Exploring the Relationship between Drugs and Crime: A...
244
Transcript of Exploring the Relationship between Drugs and Crime: A...


Exploring the Relationship between Drugs and Crime: A Comparative
Analysis of Survey Data from Prisoners in Four Caribbean Countries
Dominica
Saint Kitts and Nevis
Saint Lucia
Saint Vincent and the Grenadines
November 2012

Exploring the Relationship between Drugs and Crime
i
OAS Cataloging-in-Publication Data
Organization of American States. Inter-American Drug Abuse Control Commission.
Exploring the relationship between drugs and crime: a comparative analysis of survey data from prisoners:
Dominica, St. Kitts and Nevis, St. Lucia, [and] St. Vincent and the Grenadines.
v. ; cm. (OAS Official Records Series).
ISBN 978-0-8270-5912-2
1. Drug abuse and crime--Caribbean Area--Statistics. 2. Drug control--Caribbean Area. 3. Drug abuse surveys--Caribbean
Area.
4. Prisoners--Drug use--Caribbean Area--Statistics. I. Title. II. Title: A comparative analysis of survey data from prisoners.
III. Series.
OEA/ Ser.L/XIV.6.16
Comments on the report can be sent to:
The Inter-American Observatory on Drugs
Inter-American Drug Abuse Control Commission
Organization of American States
1889, F Street, N.W.
Washington D.C. 20006
U.S.A
Tel: (202) 458 3000
Email: [email protected] or [email protected]
Website: www.cicad.oas.org

Exploring the Relationship between Drugs and Crime
ii
TABLE OF CONTENTS AND LIST OF TABLES
Acknowledgments ................................................................................................................... v
Prologue………………………………………………………………………………….... vi
Executive summary ................................................................................................................. 1
Chapter 1 .................................................................................................................................. 8
1.1 Introduction and background ......................................................................................... 8
1.2 General objectives ........................................................................................................ 11
1.3 Specific objectives ....................................................................................................... 11
1.4 Profile of the countries’ prison systems ....................................................................... 12
Chapter 2 ................................................................................................................................ 19
Methodology .......................................................................................................................... 19
2.1 Target population and sampling ................................................................................... 19
2.2 Data collection instrument and data management……………………………………21
2.3 Definitions of terms: .................................................................................................... 22
2.4 Limitations ................................................................................................................... 22
2.5 Layout of the report...................................................................................................... 22
Chapter 3 – Results ................................................................................................................ 24
3.1 Demographics characteristics ..................................................................................... 24
Table CA1: Age, gender, status, employment and nationality of offenders .......................... 24
3.2 Criminal history and criminal offending ..................................................................... 28
Table CA2: Offense category (current sentence), repeat offending and age of first offense.28
3.3 Previous offending ....................................................................................................... 31
Drug use and patterns of use .............................................................................................. 33
Exploring the Relationship between Drugs and Crime
iii
Table CA3: Lifetime prevalence overall, gender, type of offending and status .................... 33
Table CA4: Criminal offending and lifetime drug use .......................................................... 40
3.4 Age of first substance use ............................................................................................. 42
Table CA5: Age of first drug use among offenders and Table CA5a: Age of first drug use
among offenders – survey average ........................................................................................ 42
3.5 Relationship between drugs and crime ........................................................................ 45
Table CA6: Relationship between drugs and crime - [Offenders responding “YES”] ......... 46
Table CA7: Relationship between drugs and crime – Summary ........................................... 47
3.6 Importance of the relationship between drugs and crime ............................................ 51
Table CA8: Importance of the relationship between drugs and crime .................................. 51
3.7 Offenders’ perceptions of drug use .............................................................................. 53
Table CA9: Perception of drug use by fellow inmates .......................................................... 53
Perception of drug use of fellow inmates ....................................................................... 53
Perception of ease of access to drugs in prison .............................................................. 55
Table CA10: Ease of access to drugs in prison ..................................................................... 55
Perception of drug use and violence in prison ............................................................... 57
Table CA11: Perception of drug use and violence in prison ................................................. 57
Perception of possible causes of fellow inmates’ drug use ............................................ 59
Table CA12: Possible causes of fellow inmates’ drug use .................................................... 59
3.8 Gang involvement ........................................................................................................ 61
History of gang involvement .......................................................................................... 61
Table CA13: History of gang involvement and perceptions of gang activities ..................... 61
Chapter 4 ................................................................................................................................ 66
Discussion, conclusions and policy implications ............................................................... 66
4.2 Conclusions .................................................................................................................. 68

Exploring the Relationship between Drugs and Crime
iv
4.3 Policy implications ....................................................................................................... 68
4.4 Recommendations ........................................................................................................ 69
Appendices .................................................................................................................... ……72
Appendix 1: Results for Saint Vincent and the Grenadines ............................................... 73
Appendix 2: Results for Saint Kitts and Nevis ................................................................. 117
Appendix 3: Results for Dominica ................................................................................... 158
Appendix 4: Results for Saint Lucia ................................................................................. 197

Exploring the Relationship between Drugs and Crime
v
ACKNOWLEDGMENTS
This report was made possible by a contribution from the Government of Canada through
the Department of Foreign Affairs and International Trade Canada (DFAIT).
The Executive Secretariat of CICAD appreciates the contributions and support of the drug
commissions, prison directorates, and other authorities in Dominica, Saint Kitts and Nevis,
Saint Lucia, and Saint Vincent and the Grenadines.
Dominica: Dennis Blanc, Superintendent of Prisons and his staff; Jacinta Bannis, Director,
National Drug Prevention Unit (NDPU); Martha Jarvis, Research Officer, NDPU; Arthur
Smith, Coordinator of the Dominica Prison Survey, and Annie St. Luce and Thomas
Holmes, authors of the Dominica country report.
Saint Kitts and Nevis: Franklin Dorsett, Commissioner of Her Majesty’s Prison and his
staff; Elvis Newton, Permanent Secretary, Ministry of Homeland Security; Michael Penny,
Ministry of Foreign Affairs; and Elneth Toussaint-Harvey, Coordinator of the Saint Kitts
and Nevis Prison Survey.
Saint Lucia: Hilary Herman, Director of the Bordelais Correctional Facility and his staff;
Fortuna Belrose, Deputy Permanent Secretary, Ministry of Legal Affairs, Homeland Affairs
and National Security; Cyprian Yarde, Coordinator, Substance Abuse Advisory Council
Secretariat (SAACS), Ministry of Health; Robert Huggins, SAACS, and Jicinta Alexis,
Coordinator of the St. Lucia Prison Survey.
Saint Vincent and the Grenadines: Linus Goodluck, Superintendent of Prisons and his
staff; Mr. Godfrey Pompey, Permanent Secretary, Ministry of National Security, and Mr.
Selwyn Allen, Coordinator of the St. Vincent and the Grenadines Prison Study.
A number of people provided invaluable technical and other support to this project as part of
the extended CICAD team, including Dr. Wendy Crawford-Daniel (planning and
development, training, and technical support), Alejandro Retamoso (data processing), and
Dr. Ken-Garfield Douglas (editorial services, data processing, and report writing).
Within the Executive Secretariat of CICAD, staff of the Inter-American-Observatory on
Drugs (OID) made significant contributions to all areas of this project and to this report: Dr.
Francisco Cumsille, Coordinator of the OID; Rachel Boyce, Project Assistant, and Pernell
Clarke, Specialist in Drug Research and Coordinator of this report.

Exploring the Relationship between Drugs and Crime
vi
EXPLORING THE RELATIONSHIP BETWEEN DRUGS AND CRIME: A
COMPARATIVE ANALYSIS OF SURVEY DATA FROM PRISONERS
Prologue
Overwhelming evidence supports the idea that there is an association between drugs and
crime. This association is not a simple one of causation, but one that is best explained by
the model of common cause in which the association has a cluster of causes (White &
Gorman 2001). The challenge, therefore, in examining this relationship is to find a scientific
means of approaching these two phenomena and shedding light on the various facets of their
association. The ultimate aim is to provide the information and know-how needed to
empower those who have the responsibility of developing policies and programs to prevent,
treat or mitigate the consequences of drugs and crime.
The Inter-American Drug Abuse Control Commission (CICAD) of the Secretariat for
Multidimensional Security of the Organization of American States (OAS) is the forum for
development of drug policies in the Western Hemisphere, in the context of the 2010
Hemispheric Drug Strategy.
The Inter-American Observatory on Drugs (OID) is one of CICAD’s six lines of action
designed to strengthen capacity and coordinate efforts in the member states. One of the
tools developed by the OID is the Inter-American Drug Use Data System (SIDUC), which
utilizes a number of protocols to guide the implementation of studies and surveys that
measure drug use and related issues. One of these protocols is the Drug Use Survey for
Adult Prisoners, which was first piloted in the English-speaking Caribbean in 2010.
I am pleased to present the report Exploring the Relationship between Drugs and Crime:
A Comparative Analysis of Survey Data from Prisoners. It represents the first multi-
centric study of drugs, crime and related issues among prisoners in four Caribbean countries,
and provides some new information that begins to identify and explain the drugs-crime
nexus. The data paint a compelling picture of the population surveyed and provide policy-
makers with much food for thought. The report is divided into four main chapters that
provide a collective analysis of the data from all four countries, followed by appendices
showing the findings for each country.
It is my belief that as we work to implement the Hemispheric Drug Strategy, a scientific
approach to the production of information on drugs will serve our member states well, and
will contribute to the body of knowledge that is needed for sound policy-making and
effective program design.
Exploring the Relationship between Drugs and Crime
vii
I would like to express my gratitude and congratulations to the four countries that
participated in this groundbreaking study, and hope that the findings will have a positive
impact on their own policies and programs, and on the policies and programs of other
countries in the hemisphere.
__________________________
Paul E. Simons
Executive Secretary
Inter-American Drug Abuse Control Commission
Secretariat for Multidimensional Security
Organization of American States

Exploring the Relationship between Drugs and Crime
1
EXECUTIVE SUMMARY
This study is an exploratory and diagnostic study to contribute to determining the extent of
the relations or links between criminal behavior and drugs in four countries of the
Caribbean: Saint Vincent and the Grenadines, Saint Kitts and Nevis, Dominica, and Saint
Lucia. The population surveyed consisted of all persons aged 18 years and older detained in
prisons in those countries. The surveys, which were conducted in March and April 2012,
covered both those who were remanded into custody (awaiting trial) and those who had been
convicted. A cross-sectional, descriptive survey using proportional stratified random
sampling was conducted (except in the case of Dominica where a census was carried out).
Direct interviewing was done by trained interviewers at a time and place convenient to the
prison systems and ensuring the confidentiality of the offenders’ responses. Where possible,
the entire population of female offenders was interviewed to compensate for their small
numbers.
The general objective of the study was to determine the prevalence of psychoactive
substance use among the adult prison population (whether in pre-trial detention (remanded)
or convicted) in the four Caribbean countries, and to examine the link between criminal
behavior and the use of psychoactive substances as perceived by the offenders.
This study does not establish a causal relationship between drug use and crime—and the
authors wish to stress that not all drug users are criminals, nor are all criminal acts
committed by drug users. However, the study does highlight certain key issues that warrant
the attention of policy-makers in the four countries involved, and perhaps beyond. For
example, prisoners are heavy users of marijuana, and according to this study, typically
began their marijuana use at around the age of fourteen, which is below the median age of
first use of any other legal or illegal substance. Prisoners responding to the surveys were
overwhelmingly male and single, and over one fifth had committed their first offense by the
age of 23-25. A significant proportion were repeat offenders, but few reported that they had
ever received any treatment in prison or outside for their drug use or mental health
problems. It appears that certain crimes are associated with the use of particular substances:
for example, alcohol use appears to have a strong correlation with physical assault, and
cocaine/crack use with acquisitive crime (theft and robbery in order to buy drugs).
While further study of these associations is needed, some policy implications are clear:
substance abuse prevention programs must be stepped up in the schools and community
groups to help prevent substance use from ever starting; drug treatment programs are much
needed in prisons and in post-release community centers, in order to prevent relapse into
drug use; stricter controls are needed over alcohol sales and dispensing to help reduce
physical assaults, and more stringent security must be put in place in the prisons to prevent
the smuggling of drugs and alcohol into the prisons. Social services and crime prevention

Exploring the Relationship between Drugs and Crime
2
programs are needed for adolescents and young people, particularly those who report that
their family members are involved in some type of criminal activity.
Demographic characteristics of the offenders
Most of the prison population in all four countries (81-89%) was between the ages of 16 and
45, with between a fifth and a quarter under the age of twenty-four. Saint Kitts and Nevis
had a slightly younger cohort of offenders, with Dominica and Saint Lucia having a slightly
older offender population.
The overwhelming majority of prisoners in all countries were males (97-98%). Dominica
had the highest proportion of convicted offenders (77%), and Saint Lucia, the lowest (50%).
In Saint Vincent and the Grenadines (69%) and Saint Kitts and Nevis (67%), almost seven
in every ten detainees were convicted offenders.
A little more than half of prisoners in Saint Vincent and the Grenadines (52%) and Saint
Kitts and Nevis (54%) had been employed full-time prior to imprisonment. These
proportions were much lower for Saint Lucia (36%) and Dominica (25%). Self-employed
status was somewhat similar (21-27%) in three countries, except for Saint Lucia, where the
proportion of self-employed was slightly higher (32%).
Pre-incarceration unemployment rates (8.8-18.9%) were similar for Saint Kitts and Nevis
and Saint Lucia, slightly lower for Saint Vincent and the Grenadines, and moderately higher
for Dominica. Further analysis showed that whether they were remand or convicted
prisoners, their pre-incarceration employment status was quite similar in the four countries.
The majority of prisoners were nationals of their own county, from a low of 89% in Saint
Vincent and the Grenadines to 95% in both Dominica and Saint Kitts and Nevis. The non-
national offenders were predominantly nationals of other Caribbean countries.
Criminal history and criminal offending
The offenses most often reported by convicted offenders were physical assault, capital
crimes, stealing, robbery, and drug crimes. Small proportions of sexual offenses were
reported for all countries (4-8%), with Saint Kitts and Nevis (8%) and Saint Vincent and the
Grenadines (6.3%) recording the largest proportion.
Physical assault was more likely to be reported in Saint Vincent and the Grenadines (12%)
and Dominica (15%). Robbery was reported most often in Saint Kitts and Nevis (10%) and
Dominica (8%), while stealing was most likely to be reported in Dominica (23%) and Saint
Vincent and the Grenadines (12%). Malicious damage was the least reported offense in all
countries (half of a percent to 3%). Some capital crimes were reported in all countries (7-
15%), with the highest proportions in Saint Lucia (15%) and Saint Kitts and Nevis (14%).

Exploring the Relationship between Drugs and Crime
3
Interestingly, less than 5% of current offenses by convicted prisoners were drug crimes1: in
Saint Kitts and Nevis, the proportion was 4% and in Saint Lucia, 3%. Saint Vincent and the
Grenadines (11%) and Dominica (8%) recorded the highest proportions of drug crimes.
Significant numbers of offenders were repeat offenders: the highest proportion was recorded
for Dominica (61%), followed by Saint Vincent and the Grenadines (56%), Saint Kitts and
Nevis (47%), and Saint Lucia (35%).
The mean age of first offense was around 23 years for all countries except Saint Lucia,
where it was 25. Males were significantly more likely to offend at an earlier age, as, for
example, in Saint Vincent and the Grenadines, where the age of first offense for males was
23 years compared to females (31 years), p<0.01. The age of first offense of remand
offender and convicted prisoners was significantly different for Dominica and Saint Lucia.
The age of first offense of first-time offenders was significantly different from repeat
offenders in all countries, p<0.01. The age of first offense among repeat offenders was
youngest in Saint Kitts and Nevis (19.4 years) and in Saint Vincent and the Grenadines (20.6
years).
Self-reported lifetime prevalence of substance use
The most prevalent drug reported ever used by offenders in all four countries was marijuana.
About 68-86% of all offenders had used marijuana at least once in their lifetime: the highest
proportion was reported in Dominica and Saint Vincent and the Grenadines, and the lowest
proportion overall in Saint Kitts and Nevis (67.9%). High prevalence of cocaine and crack
cocaine use was reported in Dominica (28% and 26% respectively), followed by Saint
Vincent and the Grenadines (12.9% cocaine and 6.8% crack). There was no reported use of
inhalants or heroin in Saint Lucia, with negligible proportions reported in the other countries
(inhalants 0.5-3%) and heroin (1-3%). No heroin use was reported in Saint Vincent and the
Grenadines.
In all countries, males reported notably higher proportions of drug use compared to females
(note that the proportions indicated for females relate to only 2 or 3 offenders in most cases).
Lifetime prevalence for marijuana among males was 50-60 percentage points higher than for
females in all countries except Saint Vincent and the Grenadines, where it was only 18
1 A drug crime as used in this report means any crime for which a person is accused or convicted that directly
contravenes the drug laws of a country, including charges for possession of, trafficking in, and/or intent to
supply illicit drugs. It does not include “drug-related offenses” such a conviction of burglary whose intent may
have been to obtain the means to purchase drugs.

Exploring the Relationship between Drugs and Crime
4
percentage points higher. In the case of Saint Kitts and Nevis, only males reported cocaine
use, as was the case for crack cocaine in Dominica.
In every country, repeat offenders reported notably higher proportions of illicit drug use than
first-time offenders (12-16 percentage points higher in the case of marijuana).
Convicted offenders in Saint Vincent and the Grenadines and Dominica reported higher
prevalence of marijuana use than remand prisoners. Cocaine and crack cocaine use among
both convicted offenders and those on remand in these two countries was significantly
higher than was reported in the other countries (12 percentage points higher than the next
highest for crack cocaine among those on remand and 23 percentage points higher than the
next highest for crack cocaine among convicted prisoners).
Offense category and lifetime drug use
Lifetime marijuana use featured prominently in all offenses, except for malicious damage in
the case of Saint Vincent. In Saint Kitts and Nevis, more than 60% of marijuana use was
reported for all offenses except sexual offenses and physical assault. For Dominica,
relatively high proportions of both marijuana and crack cocaine use were reported among all
offense categories. This was the same pattern for marijuana use in Saint Lucia and crack
cocaine use was most likely to be reported for robberies and stealing.
Age of first use of drugs by offenders
A significant finding of this study is that in all four countries, prisoners reported that they
began to use marijuana at a younger age than alcohol and tobacco. The mean age of first use
of other illicit substances was twenty or older in all.
Relationship between drugs and crime
More than one-third of offenders on remand in all four countries reported that they had been
previously convicted and imprisoned for an offense. Dominica reported the highest
proportion (54.7% or more than half of remand offenders), followed by Saint Vincent and
the Grenadines (43.9%), Saint Kitts and Nevis (39.3%) and lastly, Saint Lucia (34.4%).
Seemingly small proportions of offenders—both those on remand and those convicted—
indicated some type of relationship between the crime committed and drugs. For the most
part, higher proportions of remand offenders in Dominica and Saint Lucia reported such a
link. By comparison, higher proportions of convicted offenders in Saint Vincent and the
Grenadines and Dominica reported such a relationship. A little more than 50% of responses
in Saint Lucia, Saint Kitts and Nevis, and Saint Vincent and the Grenadines indicated that
the relationship between drugs and crime was important (very important, important, or
somewhat important). It was notably higher in Dominica, where 75% indicated that the
relationship was important.

Exploring the Relationship between Drugs and Crime
5
In all four countries, when the crime was seen as having a relationship with drugs, the main
link was committing the crime while under the influence of drugs, or when the crime was
linked to the production, selling and/or trafficking of drugs and was against the drug laws.
It is reasonable to assume that a drugs-crime relationship also existed when offenders
committed a crime in order to obtain drugs for their personal use; intentionally used a
substance in order to boost their courage to commit the crime; or committed a crime against
a victim who was under the influence of alcohol or drugs.
Perceptions of drug use by fellow inmates
The general perception was that many inmates were using drugs, or were seen to be using
drugs in prison. Some 58-66% of respondents indicated that drug use was observed in
prison (Saint Vincent and the Grenadines (65%); Saint Lucia (66%); and Dominica (58%),
but a relatively small number in Saint Kitts and Nevis (22%) reported seeing drug use in
prison. One third of the prisoners interviewed said they were affected by the use of drugs or
substances in prison.
Perception of ease of access to drugs in prison
While less than half of the offenders in all four countries reported that drugs were easy to
obtain inside the prison, 43% in Dominica and 38% in Saint Lucia (38%) said that drugs
were relatively easy to obtain. The figures were lower for Saint Kitts and Nevis (14%) and
Saint Vincent and the Grenadines (25%).
Repeat offenders in Saint Vincent and the Grenadines and Saint Kitts and Nevis were
significantly more likely to indicate that it was easy to obtain drugs in prison compared to
first-time offenders. Remand prisoners, except for those in Saint Lucia, were less likely to
indicate that drugs were easy to obtain in prison as compared to convicted prisoners.
Perception of drug use and violence in prison
For the most part, offenders did not believe that violence in prisons was related to drugs—
with the exception of Saint Vincent and the Grenadines where more than 50% of offenders
did feel that to be the case.
Gang involvement
Gang involvement was reported by 30% of prisoners interviewed in Dominica and by 40%
in Saint Lucia. Figures were lower in Saint Vincent and the Grenadines and Saint Kitts and
Nevis, where less than a quarter of respondents said that they had ever been involved in a
gang. A moderately high proportion of offenders in all four countries reported that the
crime for which they were currently incarcerated was related to involvement in or
membership of a gang: 21% in Saint Vincent and the Grenadines, 23% in Saint Kitts and
Nevis, 37% in Dominica and 30% in Saint Lucia.

Exploring the Relationship between Drugs and Crime
6
Small but significant proportions in all countries (13-18%) indicated that it was likely that
they would readily return to gang activities upon release.
Conclusions
This study has revealed some key issues in the four countries studied:
Prisoners overall reported that they began to use marijuana at an early age (mean age
of 14). Marijuana was, in many cases, the substance used first, even before alcohol
and tobacco. Use of marijuana was prevalent among all inmates and across all
categories of offense.
Repeat offenders reported generally higher rates of drug use overall than first-time
offenders, and also reported seeing more drug use inside the prison than first
offenders.
Few offenders who reported drug use said they had received any type of treatment or
counseling to help them overcome their drug use.
Alcohol appeared to play a significant role in crimes of physical assault, while
cocaine and crack use was associated more frequently with acquisitive crimes
(stealing and robbery).
The fact that crimes are committed by drug users is not a sufficient condition for us to say
that drug use causes crime or vice versa. Drug use may, however, intensify and perpetuate
the commission of criminal offenses. Drug use is only one factor among a group of
variables that may account for criminal behavior, including variables such as physiological,
psychological and behavioral, family, cultural, social, economic and situational factors. The
research does confirm that a number of links can be established between drugs and crime,
but that those links are not necessarily causal in nature and more closely resemble variables
in a complex relationship between drugs and crime.
There is sufficient evidence from the findings of this study to engage policymakers in a
discussion about the clear (statistical) relationships between cocaine/crack cocaine use and
repeat offending; cocaine/crack use and stealing and robbery; alcohol use and physical
assault; early initiation of drug use (especially marijuana use) and its role in criminal
offending, as well as the relatively high rate of criminal recidivism reported in all countries.
It is recommended that every country that participated in this study begin such a dialogue.
Policy implications
A clear policy implication of this study is that offenders should be offered drug and alcohol
treatment while they are in prison, and that follow-up counseling should be provided to them
in the community after their release, to help prevent relapse into drug use. Treatment and
rehabilitation programs offer the opportunity to address both drug use and other behavioral
and health problems facing offenders, in an effort to prevent re-offending.

Exploring the Relationship between Drugs and Crime
7
In light of offender reports that many of them started to use marijuana and alcohol while still
adolescents, it is highly recommended that substance abuse prevention programs be stepped
up in primary and secondary schools, and in community and religious groups. Life skills
programs that teach anger and stress management, resilience and coping skills, and capacity
to resist peer pressure can help young people resist drug use and criminal behavior.
A significant proportion of prisoners reported that family members were involved in either
drug use or criminal offending. Therefore, treatment and rehabilitation programs should
necessarily include the offenders’ families in an effort to break the cycle of re-offending.
Again, such programs need to treat all the factors that contribute to drug use and crime, as
detailed in this report, and should not focus exclusively on drug use.

Exploring the Relationship between Drugs and Crime
8
CHAPTER 1- INTRODUCTION
1.1 Introduction and background
An important starting point in the literature is that it should come as no surprise that prison
inmates use drugs or that drugs are smuggled into the prisons. The realities of the abusive
use of alcohol and other drugs have considerable implications from a socio-economic
perspective, and can seriously affect the economic and social developmental capacities of an
entire country. Drug and alcohol use are considered important factors in criminal offending
(White & Gorman 2002)1. Using Australia as an example, the tangible costs to the
Australian society of drug and alcohol-related crime have been estimated at over AUD $4
billion (Collins & Lapsley 2002)3. In a more recent report, the cost of crime in Australia was
estimated to be at least AUD $32 billion, and drug offenses to be at least AUD $1.96
billion, but could possibly be higher because drugs are implicated in many other crimes
(Mayhew 2003).
Many studies have been done and articles written about the drug-crime relationship,
including a very useful chapter on The Dynamics of the Drug-Crime Relationship by
Helene Raskin White and D. Gorman in the book The Nature of Crime: Continuity and
Change. In this chapter, the authors set out some general theoretical models of the drug-
crime connection, including the hypotheses that drug use causes crime; that crime leads to
drug use; and that both drug use and crime are caused by the same factors. The chapter goes
on to review the empirical research that supports and/or refutes these explanatory models,
and concludes that no single model can account for the drug-crime relationship. Rather, the
drug-using, crime-committing population is heterogeneous, and there are multiple paths that
lead to drug use and crime.
Even though this insight can give us a preliminary overview of the relationship between
drugs and crime, the problem facing most countries in the Americas, especially in Latin
America and the Caribbean, is that objective, scientifically established data are not readily
available, which means that States cannot easily examine the realities of their own prisons
and issues of crime and drug, or develop effective policies for intervening in the problem.
Illicit drug use is “almost automatically” associated with criminal behavior, according to
Serge Brochu, an expert in this field. The statistical relationship between illicit drug use and
crime is convincing at first glance, but it is not possible to draw a conclusion regarding a
definite cause-and-effect link between the two phenomena.
2 White, H. R., & Gorman, D. M. (2000), “Dynamics of the drug-crime relationship”, I n G. LaFree (Ed.),
Criminal justice 2000: The nature of crime: Continuity and change (pp. 151–218). Washington,
DC: U.S. Department of Justice. 3Collins, D.J. and Lapsley, H.M. (2002), Counting the cost: estimates of the social costs of drug abuse in
Australia in 1998–9, National Drug Strategy Monograph Series No. 49.

Exploring the Relationship between Drugs and Crime
9
Scientific studies conducted over the past two decades provide evidence that tends to show
that drug use is one of a number of factors that may explain why some people commit
criminal acts. For example, many people who have developed a dependence on expensive
drugs such as heroin or crack/cocaine and cannot afford their habit will commit crimes to
buy drugs. However, they do not represent all or even most illicit drug users, especially in
the case of marijuana users. In other words, illicit drug use does not necessarily lead to an
increase in crime, even among people who are regular users or have developed dependence.
The research shows that a number of social, psychological and cultural factors may be used
to identify people who are at risk of becoming offenders and/or drug users. Factors that may
explain both drug use and criminal activity include poverty, lack of social values,
personality disorders, association with drug users and/or offenders, and loss of contact with
agents of socialization4.
In principle, the use of drugs can cause or promote a crime, and in turn, criminality may
reinforce drug use. Influences in both directions should be taken as a matter of probability
rather than deterministic. Not all drug users are criminals, nor are all criminal acts
committed by drug users. (NIJ, 2003)
However, drug use does play a role in violence and crime, both because of the
psychopharmacological effects that drugs produce, and because some acquisitive crimes are
committed in order to buy drugs. Alcohol appears to correlate closely with certain types of
criminal behaviors, such a physical assault (NIJ, 2003; Gartner, 2004).
Paul Goldstein5 developed a taxonomy or classification of the ways in which drugs and
crime relate (NIJ, 2003), and proposed three categories that help our understanding of the
link between drugs and violence:
1. Psychopharmacological: violence due to the direct and acute effects of the
psychoactive drugs consumed.
2. Economic-compulsive: violence committed as an instrumental means to generate
financial resources to obtain drugs.
3. Systemic: violence associated with the illicit drug market, territorial fights, and
confrontations between gangs of drug traffickers, among others.
Goldstein’s taxonomy explained
The psychopharmacological model of the link between drug use and crime is based in
particular on research data showing that a large number of arrestees and inmates had used
4 Lyne Casavant and Chantal Collin (2001), Illegal Drug Use and Crime: A Complex Relationship. Prepared
for the Senate Special Committee on Illegal Drugs, Library of Parliament. 5 Paul J Goldstein. "The Drugs/Violence Nexus: A Tripartite Conceptual Framework," Journal of Drug Issues
v. 39 (1985): 143-174.

Exploring the Relationship between Drugs and Crime
10
drugs on the day they committed the crimes for which they were incarcerated. Another
possible explanation of the link between drug use and crime is the economic-compulsive
model, which assumes that drug users commit crimes to finance their drug use. More
specifically, according to this model of the drug-crime relationship, the compelling and
recurrent need for drugs and their high price lead some users to commit crimes to obtain the
money they need to buy drugs. This model focuses on individuals who have developed a
dependence on expensive drugs and assumes that the large amounts of money associated
with frequent use of certain illicit drugs are an incentive to criminal action. This explanation
of the relationship between drugs and crime is well supported in the literature.
The systemic link posits that violence is an integral part of the illegal drug distribution
market. Violence occurs mainly because the drug market affords no legal way of obtaining
justice when rules are violated. According to this model of the relationship between drugs
and crime, the profit opportunities perceived by the various players in the market and the
fierce competition in this illegal environment encourage involvement in crimes such as
disputes between dealers, problems involved in recovering debts, protection rackets, and so
forth. On this point, Casavant et al contends that while legally regulated markets, such as
those in alcohol or pharmaceuticals, have recourse to legitimate authority to resolve disputes
and set standards for fair competition, those involved in an illegal, high profit market resort
mainly to force6.
Recently in San Salvador, El Salvador, a meeting of experts convened by the Executive
Secretariat of CICAD to examine the issue of drug use and prisoners looked at Goldstein’s
taxonomy, and found it necessary to include two additional categories (CICAD, 2007):
1. Legal: all those situations that violate the drug laws of a State.
2. Instrumental: the use of drugs to acquire the state of mind and behaviour necessary
to commit the crime.
These two additional categories should be tested in prospective studies in order to validate
them and recommend their application in future studies on the issue. We also raise the
possibility that another category be considered in the future, which would link violence to
the use of drugs by the victim to facilitate robbery or other violent acts while the victim is
under the influence of drugs.
Significant efforts have been made iin the Americas to establish the nature and types of
relationships between drugs and crime, and they have led to some effective strategies that
have guided research on the topic.
Lyne Casavant and Chantal Collin (2001). Illegal Drug Use And Crime: A Complex Relationship. prepared for
the Senate Special Committee on Illegal Drugs, Library of Parliament.

Exploring the Relationship between Drugs and Crime
11
Canada is one of the countries that has undertaken this type of research, in light of the
enormous social costs that the problematic use of alcohol and drugs exerts on the country’s
socioeconomic infrastructure. The Canadian Centre on Substance Abuse (CCSA) conducted
research demonstrating the association between different types of crimes and the use and
abuse of alcohol and other psychoactive drugs, together with the proportion of crimes that
can be attributed to the use and abuse of alcohol and other drugs in the country. (Pernanen,
K; Cousineau, MM, Brochu, S; Sun, F; 2002)7
It can be concluded from Canada's experience that it is not easy to estimate the role played
by alcohol and drugs in the total volume of crimes committed. The primary reason is that
most criminal acts remain underreported or undetected by the authorities.
1.2 General objectives of the SIDUC8 survey of prisoners in four Caribbean countries
1. To determine the prevalence of psychoactive substance use among the adult prison
population in four Caribbean countries, both those on remand and those convicted.
2. To examine the link between criminal behaviour and the use of psychoactive
substances, as perceived by adult remand and convicted prisoners.
1.3 Specific objectives are to determine:
Social demographic profiles
Criminal history and criminal offending
Drug use and patterns of substance use
Relationship between criminal behavior and drug use
Offenders’ perceptions of drug use among fellow inmates.
Level of gang involvement in criminal offending and drug use
7 Pernanen, K.; Cousineau, M.; Brochu, S.; Sun, F. (2002). Proportions of Crimes associated with Alcohol and
Other Drugs in Canada. Canada: Canadian Centre on Substance Abuse. 8 SIDUC is the standardized Inter-American Drug Use Data System developed by CICAD and used in most
countries of the Americas.

Exploring the Relationship between Drugs and Crime
12
1.4 Profile of the countries’ prison systems
Saint Lucia
Bordelais Correctional Facility
Saint Lucia, a democratic country that is part of the Organization of Eastern Caribbean
States, has an advanced, secure, state-of-the-art prison, the Bordelais Correctional Facility
(BCF) located in Dennery, which was commissioned in January 2003, the first of its kind in
the Caribbean. The Ministry of Home Affairs and National Security is the government
Ministry charged with the security of the nation, and consequently, BCF falls under the
auspices of this ministry. The Bordelais Correctional Facility is designed to allow for the
separate housing of female inmates and youth offenders. Convicted inmates are housed
separately from remand inmates. The compound includes medical, educational and
vocational facilities, and a place of worship.
According to the 2011 Human Rights reports9, the prison meets the international standards
for human rights. Recent visits by independent human rights observers revealed that inmates
retained the right to practice their individual religious observances and the right to family
visits. The prison authorities facilitate the process of inmate complaints to the judicial
authorities through legal representation.
The Bordelais Correctional Facility has an official intended capacity of 500 inmates (World
Prison Brief)10
. As of February 2012, there was a prison population of 534 inmates, 525
(98.3%) males and 9 (1.7%) females. The prison population rate was 307 prisoners per
100,000 or 0.31% of the national population11
. The prison population stratification is as
follows: Convicted-272 (51%) and Remand- 262 (49%). The occupancy level based on
official capacity was 118.67%.
Analysis of prison population trends shows that there has been a steady increase in the
numbers of prisoners, as shown in the following extract of data from Recent Prison
Population Trends (World Prison Brief).
9 US Department of State, Bureau of Democracy, Country Reports on Human Rights Practices for 2011.
10 International Centre for Prison Studies, World Prison Brief 2011, accessed October 30, 2012 at
http://www.prisonstudies.org/info/worldbrief/wpb_country.php?country=68 11
The country’s population is estimated to be 173,720 persons (Central Statistics Office, 2010).

Exploring the Relationship between Drugs and Crime
13
Year Prison
population
total
Prison population
rate (per 100,000
national
population)
1998 319 (208)
2001 464 (291)
2004 485 (296)
2008 518 (304)
The rising trend in incarceration is proving to be one of the challenges facing the Bordelais
Correctional Facility. In a 2011, in an Organization of American States (OAS) report, the
Director of Corrections identified overcrowding, the high proportion of pre-trial prisoners,
punitive criminal justice policies, out-dated prison legislation and punitive social
environments that support the death penalty as deterrents to effectively implementing
rehabilitative prison reform (Herman, 2011).
Despite these impediments, the BCF administration has moved ahead with its rehabilitative
efforts. Among its many achievements are the educational programs in which the inmates
participate. In 2011, the BCF implemented a pilot phase of the Caribbean Youth
Empowerment Programme (CYEP), which targets vulnerable youth aged 17--25. The intent
of the CYEP is to provide selected participants with job training in a range of areas and
eventual job placement, thus increasing their opportunity to access the job market.
Additionally, BCF continues to move toward self-sustainability in terms of agriculture. The
institution’s agricultural production has resulted in increased revenues, thereby reducing its
food consumption budget. The BCF farm, which is manned by the inmates, focuses on
vegetable production as well as animal husbandry.
Saint Kitts and Nevis
The Federation of Saint Kitts and Nevis is the smallest sovereign nation in the sub regional
grouping of the Organization of Eastern Caribbean States (OECS). Statistics collected from
the last population census gave an approximate population of 49,000.
Located just 19° north of the equator, its proximity to the United States and South America
has made it vulnerable as a trans-shipment point for the trafficking of drugs. The porous
nature of the geographical borders of the countries of this region, combined with the limited
frequency with which border patrols are carried out, leaves the countries more susceptible to

Exploring the Relationship between Drugs and Crime
14
the transiting of illicit substances. A report by the United Nations Office on Drugs and
Crime (UNODC) suggests that “....one thing all Caribbean countries have in common is that
they have long been caught in the crossfire of international drug trafficking”12
.
Despite extremely limited data collection procedures, there is a perception that residents use
both illicit and licit drugs. The Government of Saint Kitts and Nevis recognizes that the
impact of the drug trade is multifaceted and can have severe implications for society.
Government has consistently committed to taking steps and ratifying treaties that will help
to address the problem of the drug trade. A Master Plan was developed to deal with the
complex nature of the drug problem, as a direct consequence of this commitment.
The National Anti-Drug Master Plan (2000) laments the absence of epidemiological
research to guide policymaking on demand reduction and drug trafficking13
. Although
sporadic research projects have been conducted, mostly by individuals, there is yet to be a
research methodology that will seek information from the general population on drug use
and its attendant implications on the individual, and by extension the social and economic
fabric of society.
The Federation’s prison system comprises two buildings: Her Majesty’s Prison (HMP)
which was constructed in 1840 by the British, and a prison facility named Russell’s Rest,
located in the Madden Mountain on the sister-isle Nevis. Her Majesty’s Prison is located in
the heart of the capital city of Basseterre. Random searches within the prison facility have
shown that the prisoners have access to illicit substances even when incarcerated. The
location of the facility is itself a critical issue, since the poor fencing around it allows the
general public to discreetly throw substances over the fence.
In 1973, the prison was constructed on Nevis to enable first-time offenders to be held in a
system that was not as rigid as that of HMP. It also had the goal of reducing the stigma of
incarceration, since its location would ensure that prisoners would not readily be seen by the
public. In addition, prisoners who had served the majority of their sentence and were about
to re-enter society were allowed to be placed in this facility in an environment that would
help them to readjust to the freedoms and responsibilities that come with being fully
rehabilitated. It was thought that this would serve to reduce the possibility that the prisoners
would re-offend.
Prisoners who have a history of substance abuse are enrolled in a program to consult with
the psychiatrist/psychologist about controlling their addictions. In the past, a program was
12
United Nations Office on Drugs and Crime and the World Bank. Crime, Violence, and Development: Costs
and Policy Options in the Caribbean, March 2007. 13
Ministry of National Security. National Anti-Drug Master Plan 2000. Government of St Kitts and Nevis.

Exploring the Relationship between Drugs and Crime
15
instituted by the Catholic Church to help substance abusers control their urge to use drugs,
but it is no longer operating.
Saint Vincent and the Grenadines
The Saint Vincent and the Grenadines male prison is Her Majesty’s Prison, which was built
in 1872. It is a walled prison situated in the centre of Kingstown, the country’s capital. It is
bounded on the south by the grounds of the High Court and on the west and east by Paul’s
Lot and Mackie’s Hill, densely populated residential and business areas.
It was initially constructed to house 70 prisoners. Over the years, extensive upgrading was
done and it is now capable of housing 300 inmates. The female prison is situated in another
location called Fort Charlotte, which is two miles from the male prison. The building that is
used to house the female prisoners was originally used as a garrison.
In 1972, the prison staff comprised a Superintendent of Prisons, an Assistant Superintendent
of Prisons, three Senior Prison Officers, twenty-nine Prison Officers, a Matron, an Assistant
Matron and one clerk/typist. The prison population at that time was 86 inmates.
The prison was plagued with many problems that severely affected its overall operations.
Overcrowding was one of its main problems. A series of serious events, including violence
and jailbreaks occurred in 1999--2001, which left the prison unstable and almost unable to
function. However, changes began when the new government took office in 2001 and
appointed a new Superintendent of Prisons.
The prison has been plagued with the problem of recidivism. Rehabilitation is one of the
key tools now used to minimize this crisis, and inmates are trained in carpentry, mechanics,
auto body repair, masonry, baking, tailoring and welding. An Adult Education Program is
conducted by the Ministry of Education in conjunction with the prison staff, in an effort to
equip inmates with the tools needed to assist them in the job market after their release.
Some of the male prisoners are work every day at tasks such as cutting grass and cleaning
school properties, cemeteries and other government buildings. They are also involved in
community service and sporting activities with the general public, which helps foster greater
community bonds.
Many religious activities are conducted in both the male and female prisons, greatly
enhancing the prisoners' religious beliefs and sense of self-worth. A counsellor attached to
the facility has been instrumental in assisting the prisoners on all levels. With these new
measures in place, there is optimism that there will be a dramatic decline in the prison
population.

Exploring the Relationship between Drugs and Crime
16
The new Belle Isle Correctional Facility is now operational, and 226 prisoners have been
transferred in. This was announced by the Ministry of National Security on April 23, 2012.
Her Majesty’s Prison in Kingstown will remain in operation, and will house 146 prisoners,
including 140 on remand and 20 who are in the maximum-security area. Fourteen female
prisoners are still at Fort Charlotte, and will remain there until the next construction phase of
the Belle Isle Facility is complete.
The Belle Isle Correctional Facility was constructed at a cost of EC$18.7 million to house
288 inmates. It is hoped that the facility will be self-sustaining, with a pig farm and a
vegetable farm now in operation, and a poultry farm will soon be introduced. A workshop is
currently under construction where carpentry, mechanics and tailoring will be done.
Dominica Prison System
The Dominica State Prison was constructed in 1954 and initially accommodated eighty-four
inmates. In its early days, most of the inmates came from the lower strata of society, and
most were illiterate. However, the composition of the offenders has changed to reflect
crimes committed by all races, colors and creeds of all professions, including young
offenders, both genders and students.
The prison inmate population has been not less than two hundred for many years, and
recently, it has been in the region of 300. The Prison employs sixty-two prison officers, of
whom fifty are male and twelve female. The positions held by prison officers include: the
Superintendent, the Assistant Superintendent, the Chief Prison Officer, the Principal Prison
Officer, the Senior Prison Officer, the Prison Officer, the Auxiliary Prison Officer, and a
Temporary Prison Officer.
The Prison’s mission statement:
“The Dominica Prison Service serves the public by keeping in safe custody those committed
by the courts. Our duty is to look after them with humanity and to help them lead law-
abiding and useful lives in custody and after release.”
The goals of the Prison are to:
“Keep inmates in custody.
Set standards by which subordinate officers will perform their tasks effectively and
efficiently.
Meet the needs of inmates’ care, health and safety.
Create a safe environment, order, control and discipline.
Provide positive regimes to help inmates address their offending behavior and allow
to life as responsibly as possible.

Exploring the Relationship between Drugs and Crime
17
Assist inmates to reintegrate back into the community.
Take up our responsibilities as provided for by law.
To set standards for health and safety measures.”
The following values and guidelines are used to achieve those goals:
“Integrity: the fundamental thing that we do. We will meet our legal obligation, act
with honesty and openness and exercise effective stewardship of public money and
assets.
Commitment to our staff: Staff is the most important asset of the prison service.
They will be empowered to develop and use their skills and abilities to full, while
being held accountable for their performance, teamwork will be encouraged. They
will be treated with fairness, respect and openness. Their safety and wellbeing will
be a prime concern.
Inmate Care: they will be treated with humanity and respected as individuals. They
will not suffer any other punishment other than that of the loss of liberty and will be
entitled to certain recognized standards in prisons. We will encourage the
relationship with families and friends and as far as possible involve both parties in
discussions about matters affecting them.
Opportunities: we are committed to equal opportunities and elimination of
discrimination.”
Rehabilitation program:
The prison has no structured rehabilitation program, but various groups, organizations and
individuals facilitate sessions with inmates from time to time. Such groups and organizations
include the National Drug Prevention Unit, faith-based organizations, adult education,
NGOs, Ministry of Education, Ministry of Social Services and other related groups.
Sessions for female inmates include arts and craft, framing, religious fellowship and
counseling intervention, while sessions for the males include cooking, agriculture, welding,
woodwork, adult education, drug prevention, auto mechanic, masonry and religious
fellowship.
Recreational activities in the Prison:
Recreational time is provided for three main categories:
Juveniles are permitted ninety minutes daily from 8:00 to 9:30 am
Remand inmates are allowed recreation for two hours in the afternoon from 1:00 to
3:00 pm
Convicted inmates are allowed limited recreation.

Exploring the Relationship between Drugs and Crime
18
Recreational activities for male offenders include outdoor sporting activities such as cricket,
football and basketball, and indoor games such as dominoes, cards, draft and chess.
Recreational activities for the females are somewhat different: they play rounders (softball)
and dominoes, and watch educational movies.
There is also the annual live radio program when the National Radio (DBS Radio) visits the
Prison and gives the inmates the opportunity to send greetings to their families, loved ones
and friends. The inmates are also permitted to participate in a Carnival Calypso Show in the
facility to exhibit their performing talents.
Prison visits
The general public is allowed to visit most inmates on Mondays, Fridays and Saturdays for
two hours, 9:00 to 11: 00 am, while visitation for maximum security prisoners is scheduled
for first and third Wednesdays of each month. There are no visitations on Sundays or public
holidays. A maximum of five persons is allowed for each visit, and children are allowed
only with the express permission of the Superintendent of the Prison.
Visitors must obey strict dress codes: Women are not permitted entry if they are clothed in
tights, leggings, see-through clothing, sleeveless or short tops, extra short pants, tubing,
spaghetti tops or excessive jewelry. Male visitors are refused entry if they are wearing
sleeveless shirts, vests, short pants, and excessive jewelry. In addition, male visitors must
not be barefoot or bareback, and if they have dreadlocks, their hair must be covered.
Items permitted and prohibited during visits
Inmates are not allowed to receive certain items during visits, since they are seen as possible
vehicles for bringing in drugs. Prohibited items include peanut butter, tooth paste, and roll-
ons. However, items such as fruit and personal care products are permitted for some
inmates.

Exploring the Relationship between Drugs and Crime
19
CHAPTER 2 - METHODOLOGY
2.1 Target population and sampling
This study lies within the framework of an exploratory and diagnostic study, in particular, in
determining the extent of the relations or link between criminal behavior and drugs. The
target population consists of imprisoned persons aged 18 and older in different prisons in
four countries of the Caribbean—Saint Vincent and the Grenadines, Saint Kitts and Nevis,
Dominica, and Saint Lucia. The target population covered both remand and convicted
prisoners.
A cross-sectional, descriptive survey using proportional stratified random sampling (except
in the case of Dominica, where a census was done) among adults 18 years and over, men
and women, convicted and on remand. Direct interviewing was done by trained interviewers
at a time and place convenient to the prison system and insuring the confidentiality of the
offenders’ responses. Where possible, the entire population of female offenders was
interviewed to compensate for their small numbers.
Selection of respondents was random, until the quota for that prison, group of interest, and
gender was complete. The replacement of participants who discontinued participation was
also random, until the quotas were filled.
Survey weighting
In most surveys, it will be the case that some groups are over-represented in the raw data
and others under-represented. These misrepresentations are usually dealt with by weighting
the data. The idea behind weighting is that:
Members of sub-groups that are thought to be over- or under-represented in the
survey data are each given a weight
Over-represented groups are given a weight of less than one
Under-represented groups are given a weight of greater than one
The weight being calculated is done in such a way that the weighted frequency of
groups matches the population
All survey estimates are calculated using these weights, so that averages become
weighted averages, and percentages become weighted percentages, and so on.
Survey weights and statistical estimation based on those weights provide the link between
the observations from a probability sample of the prisoners and summary measures or
population parameters about the target population. Weighted data analyses adjust the raw
survey data to represent the population from which the sample is drawn. In this case, the
data were weighted on the basis of incarceration status and gender demographic
characteristics of the prison population surveyed.

Exploring the Relationship between Drugs and Crime
20
The overall study was designed to provide a national picture of the characteristics,
experiences, and perceptions of prisoners with respect to drugs and crime. Therefore, all the
statistics presented in this report are weighted estimates of the national population of
prisoners, except in the case of Dominica as previously noted (see Tables M1 and M2
below).
Table M1: Distribution of Actual and Weighted Ns
Country Actual
number of
respondents
Number of
weighted
cases
Saint Vincent and the Grenadines 180 411
Saint Kitts and Nevis 199 324
Dominica 233 -
Saint Lucia 187 529
Table M2: Approximate Weighted Ns and [Un-weighted Ns] by Subgroup and Country
Saint Vincent
and the
Grenadines
Saint Kitts
and Nevis
Dominica * Saint Lucia
Sex
Male 399 [168] 318 [193] 229 520 [181]
Female 12 [12] 6 [6] 4 9 [6]
Status
On remand 126 [55] 108 [67] 54 263 [103]
Convicted 285 [525] 216 [132] 179 266 [84]
*Data not weighted
Analysis approaches
Analyses reported in this document involve simple descriptive statistics from univariate
analysis to describe the central tendency (e.g., mean, mode, median dispersion - range,

Exploring the Relationship between Drugs and Crime
21
variance, max, min, standard deviation and percentages), and bi-variate relationships (i.e.,
cross-tabulations and chi-square). Bi-variate analysis looked at associations/relationships
among two variables, and measures of the strength of the relationship between two
variables, thereby determining whether the relationship between the two variables is large
enough to rule out random chance or sampling error as reasons why there appears to be a
relationship between the two variables. All statistics were weighted to be representative of a
larger population of prisoners.
A p value of < 0.05 was used in identifying significant differences. The large number of
comparisons made in this report will results in some apparently significant differences, even
at this level, being false positives (i.e., Type I errors). Readers are cautioned that the
meaningfulness of differences reported here cannot be inferred from their statistical
significance.
2.2 Data collection instrument and data management
The data collection instrument consists of a pre-coded questionnaire, to assess the following
areas:
1. Socio-demographic characteristics of the population under study
2. Legal status of the prisoner
3. The main drugs used within the prison, their traits, their impact on the prisoner, and
their link to violence, both outside and within the prison, according to the prisoner
4. Incidence of drug use among the prison population and the main patterns of use
(history of use)
5. Changes in consumption patterns, during his/her time in prison
6. Link between crime and drug consumption, and its classification
7. Criminal background of each individual under study
8. Impact of drug consumption and the criminal act on the prisoner’s personal and
family life
9. Proportion of problem drug use and treatment needs of the prison population under
study
The data from these interviews were transcribed using a customized Microsoft Excel
spreadsheet that was formatted to allow for cleaning and verification. These data were then
imported into SPSS14
for statistical analysis (univariate and bi-variate analyses).
2.3 Definitions of terms:
On remand: Those persons who have been accused of a crime and who are awaiting trial
based on the judicial investigative process.
14
Statistical Package for the Social Sciences, Version 17.

Exploring the Relationship between Drugs and Crime
22
Convicted: Those persons who have received a sentence ruling with regard to due process
and a related trial and who are serving a sentence.
2.4 Limitations
There are certain limitations to studies that survey incarcerated offenders. The findings
cannot be generalized to all offenders or to all illicit drug users, as unknown proportions
never come to the attention of the police, and only a small percentage of those who are
charged and convicted are sentenced to serve time in prison. Persons who receive prison
sentences are more likely to be chronic or repeat offenders with extensive criminal histories,
vulnerable to detection by police because they are not in the legitimate labor market or are
working or living on the street.
Accuracy of memory recall and willingness to report sensitive or private experiences
(especially illegal activities) are important considerations in self-report studies of this nature.
Much of the information provided by participants is in relation to activities that may not
have been detected by law enforcement agencies, or disclosed to anyone else prior to the
interview, such as the extent of offending and illicit drug use, personal experiences with
gangs or other criminal activities, and so forth. Given the nature and content of this
information, this study, like similar studies in other part of the world, is limited by the extent
to which the self-reported information is reliable.
2.5 Layout of the report
The main components of the report are as follows:
Chapter 1. Comparative analysis of the results of the individual surveys carried out in the
four countries. This main section also provides: an introduction and background to the
study including the objectives, justification for the study and also provides a profile of the
prison system in each country;
Chapter 2 - The study methodology and limitations;
Chapter 3 – The results of the analysis
Demographics
Age
Gender
Status
Employment history pre-incarceration
Nationality

Exploring the Relationship between Drugs and Crime
23
Criminal history and criminal offending
Offense categorization
Repeat offending
Age of first offense
Families’ involvement in criminal activities
Drug use and patterns of use
Lifetime prevalence
Age of first use
Initiation rates
Repeat offending and lifetime prevalence of drug use
Offense categories and lifetime prevalence
Factors associated with lifetime prevalence
Drugs and crime
Relationship between drugs and crime
Importance of the relationship between drugs and crime
Offenders’ perceptions of drug use
Perception of drug use of fellow inmates
Perception of accessibility of drugs in prison
Perception of drug use and violence in prison
Perception of possible causes of fellow inmates drug use
Gang involvement
History of gang involvement
Gangs in prison (perceptions)
Gang activities and the drug trade (perceptions)
Chapter 4 - Discussion, conclusions and recommendations.
Appendices with details of each of the four country survey results.

Exploring the Relationship between Drugs and Crime
24
CHAPTER 3 - RESULTS
3.1 Demographic characteristics
Table CA1: Age, gender, status, employment and nationality of offenders
Age group Saint
Vincent
(n=411)
Saint
Kitts
(n=324)
Dominica
(n=233)*
Saint
Lucia
(n=529)
16-24 31.1 33.0 20.6 23.7
25-35 34.5 43.3 31.8 42.2
36-45 23.9 12.7 28.8 21.5
46-54 7.9 6.4 15.0 9.6
55 -65 2.6 4.6 3.4 3.0
Gender
Male 97.1 98.1 98.3 98.3
Female 2.9 1.9 1.7 1.7
Status
Convicted 69.4 66.8 76.8 50.2
On remand 30.6 33.2 23.2 49.8
Pre-imprisonment employment
Unemployed 8.8 11.5 18.9 12.0
Part-time employee 16.7 12.2 24.0 19.6
Full-time employee 52.1 54.4 25.3 35.6
Self-employed/informal work 20.7 21.9 26.6 32.2
Nationality
Own national 89.1 95.4 95.3 92.8
Other nationality 10.9 4.6 4.7 7.2
* Census population

Exploring the Relationship between Drugs and Crime
25
Saint Vincent and the Grenadines
The mean age of offenders overall was 32 years and the median age was 30. The ages of
offenders ranged from 18 to 64 years, a range of 46 years. About one-third (31%) of all
offenders were 24 years or younger and 75% were 39 years and under. By age groupings,
most offenders were in three age brackets: 16-24 (31%), 25-35 (35%) and 36-45 (24%).
Eight percent were in the 46-54 age group, and three percent were in the 55-65 age bracket,
the oldest age cohort. (See Table CA1).
More than two-thirds of the population was convicted prisoners (69.4%), while 30.6% were
on remand. A similar pattern was observed for males, with 69.7% convicted and 30.3% on
remand; for females, the pattern was dissimilar, 58.3% were convicted and 41.7% were on
remand.
Most offenders overall reported full time employment (52%), while 17% had been employed
part time and another 9% had been unemployed prior to incarceration. About one-fifth
(21%) had been self-employed. About half (50.7%) of the convicted offenders were in full-
time employment before they were arrested and 16% were employed part time. About 10%
were unemployed and a further 21.8% were involved in informal activities (self-employed).
A small number (about 1.7%) were in some “other” employment at time of incarceration.
Slightly more than half of the offenders on remand (54%) were in full-time employment,
and 18% were employed part-time. About 6.4% were unemployed and a further 17.7% were
involved in informal activities (self-employed).
Saint Kitts and Nevis
The mean age of offenders overall was 30.6 years and the median age was 28. The ages of
offenders ranged from 18 to 64, a range of 46 years. About one-third (33%) of all offenders
were 24 years or younger and 75% were 34 years and under. By age groupings, most
offenders were in three age brackets: 16-24 (33%), 25-35 (43%) and 36-45 (13%). Six
percent were in the 46-54 age bracket and five percent were in the 55-65 age group (see
Table CA1).
More than two-thirds of the offending population was convicted prisoners (66.8%) while
33.2% were on remand. A similar pattern was observed for males (66.8% were convicted
and 32.3% were on remand), and for females (67.7% convicted and 33.3% on remand).
Most offenders reported that they had had full-time employment prior to incarceration
(54.4%), while 12% were in part-time employment and another 12% were unemployed.
About one-fifth (22%) were self-employed. More than half (60%) of convicted offenders
were in full-time employment, and 13% were employed part-time. About 8% were
unemployed and a further 18.6% were involved in informal activities (self-employed). For

Exploring the Relationship between Drugs and Crime
26
offenders on remand, slightly more than four out of every ten (43%) were employed full-
time, 11% part-time, 18% were unemployed and some 29% were self-employed.
Dominica
The mean age of offenders overall was 34.9 years and the median age was 35. The ages of
offenders ranged from 16 to 72, a range of 56 years. As shown in Table CA1, about one-
fifth (20.6%) of all offenders were 24 years or younger and 75% were 43 years and under.
By age groupings, most offenders were in three age brackets: 16-24 (21%), 25-35 (32%) and
36-45 (29%). Fifteen percent were in the 46-54 age group, and three percent were in the
55-65 age bracket.
More than three-quarter of the offending population were convicted prisoners (76.8%) while
23.2% were on remand. A similar pattern was observed for males (77% were convicted and
23% were on remand), and three of the four females (75%) were convicted offenders.
About a quarter (25%) of all offenders reported full-time employment prior to incarceration,
while 24% were in part-time employment and another 19% were unemployed. A little more
than one-fifth (27%) were self-employed. One-third of convicted offenders had been in full-
time employment (33%), and 26% were employed part-time prior to incarceration. About
15% were unemployed and a further 22% were self-employed. Of offenders on remand,
slightly more than one-fifth (23%) were employed full-time, 24% part-time, 20% were
unemployed and some 28% were self-employed.
Saint Lucia
The mean age of offenders overall was 32.5 years and the median age was 31. The ages of
offenders ranged from 16 to 62, a range of 46 years. A little less than a quarter (23.7%) of
all offenders were 24 years or younger and 75% were 38 years and under. By age
groupings, most offenders were in three age brackets: 16-24 (24%), 25-35 (42%) and 36-45
(22%). Ten percent were in the 46-54 age group and three percent were in the 55-65 age
bracket (see Table CA1).
Half of the offending population were convicted prisoners (50.2%), while 49.8% were on
remand. A similar pattern was observed for males (50.5% convicted and 49.5% on remand),
and six of the nine females (66.7%) were offenders on remand.
More than one-third (35.6%) of all offenders reported that they had had full-time
employment prior to incarceration, while 19.6% were in part-time employment and another
12% were unemployed. Almost one-third (32.2%) were self-employed. More than one-
third of convicted offenders were in full-time employment (39%), and 14% were employed
part-time. About 8% were unemployed and a further 38% were involved in informal
activities (self-employed). Of the offenders on remand, about one-third (32%) were

Exploring the Relationship between Drugs and Crime
27
employed full-time, 25.4% part-time, 16.4% were unemployed and some 26% were self-
employed.
SU
MM
AR
Y
Demographic characteristics of the offenders (Table CA1)
The age distribution of the prison population in all four countries was not
dissimilar: most of the offenders (81-89%) were in the three lowest age brackets,
with Dominica six percentage points less than the other countries. Saint Kitts and
Nevis had a slightly younger cohort of offenders, with Dominica and Saint Lucia
having a slightly older offender population.
The overwhelming majority of offenders in all countries were males (97-98%).
Dominica had the highest proportion of convicted offenders (77%) and Saint Lucia
the lowest (50%). In Saint Vincent and the Grenadines (69%) and Saint Kitts and
Nevis (67%), almost seven out of every ten offenders were convicted prisoners.
A notably high proportion of offenders in Saint Vincent and the Grenadines (52%)
and Saint Kitts and Nevis (54%) had been employed full time prior to
imprisonment. These proportions were much lower for Saint Lucia (36%) and
Dominica (25%). Self-employed status was somewhat similar (21-27%) in three
countries, but Saint Lucia had a slightly higher proportion (32%).
Pre-incarceration unemployment rates (8.8-18.9%) were similar for Saint Kitts and
Nevis and Saint Lucia but slightly lower for Saint Vincent and the Grenadines and
moderately higher for Dominica. Further analysis illustrated that whether on
remand or convicted, pre-incarceration employment status differed little among
countries.
The majority of offenders were nationals of their own county and the proportion
ranged from a low of 89% in Saint Vincent and the Grenadines to 95% in both
Dominica and Saint Kitts and Nevis. The non-national offenders were
predominantly nationals of other Caribbean countries, for example, Guyana,
Barbados, Jamaica, and Saint Vincent.

Exploring the Relationship between Drugs and Crime
28
3.2 Criminal history and criminal offending
Table CA2: Offense category (current sentence), repeat offending and age of first
offense
Survey
average
across
countries
Saint
Vincent
Saint
Kitts
Dominica
Saint
Lucia
Offense category
5.8 Sexual offense 6.3 7.7 4.7 4.3
9.9 Physical assault 12.0 7.5 14.6 5.5
7.4 Robbery - 10.2 8.2 3.7
11.9 Stealing 12.0 7.5 23.2 4.9
1.6 Malicious damage 1.1 0.5 2.6 0.6
11.8 Capital crimes 11.1 13.8 7.3 15.1
6.6 Drug crimes 11.1 4.1 7.7 3.3
10.9 Other 10.3 12.4 8.6 12.3
Type of offending
50.3 First-time offender (overall) 44.4 53.3 38.6 64.7
51.4 First-time offender (convicted) 42.3 56.9 38.0 68.3
49.1 First-time offender (on remand) 49.3 45.4 40.7 61.1
49.8 Repeat offender (overall) 55.6 46.7 61.4 35.3
48.6 Repeat offender (convicted) 57.7 43.1 62.0 31.7
50.9 Repeat offender (on remand) 50.7 54.6 59.3 38.9
Age of first offense (mean age)
23.8 Overall 23.3 22.88 23.68 25.35
23.7 Male 23.1 22.80 23.69 25.30

Exploring the Relationship between Drugs and Crime
29
26.8 Female 31.6 27.00 23.25 25.40
23.8 Remand 23.8 23.04 20.78 27.45
23.4 Convicted 23.1 22.80 24.50 23.13
26.7 First-time offender 26.92 25.97 26.42 27.36
20.7 Repeat offender 20.62 19.48 21.22 21.58
Saint Vincent and the Grenadines
The offenses most often reported by convicted offenders were, in rank order, physical
assault and stealing (about one in eight prisoners or 12% each); capital crimes and drug
crimes (11% each); followed by other crimes (10%); and sexual offenses and malicious
damage reported by 6% or less (see Table CA2).
For offenders who reported previous offenses (n=212, 51% of the population), the offenses
most often reported were drug crimes and other crimes (23% each), followed by physical
assault (about one-fifth of offenders or 21%), stealing and robbery (11% each) and capital
crimes, malicious damage and sexual offenses, reported by less than 5% of offenders.
Female offenders were more likely to be convicted of capital crimes or stealing, while males
were more likely to be sentenced for physical assault, drug crimes, stealing, capital crimes
and other offenses.
More than half of all offenders were repeat offenders (55.6%). Some 57.7% of convicted
prisoners indicated that this was not the first time they had been sentenced, and similarly,
50.7% of remand prisoners also reported that they had been sentenced before.
The mean age of first offense reported was 23 years. The median age was 21 years and the
ages of first offense ranged from 10-54 years. About 26% of offenders had offended before
the age of 18, while 75% had offended by the age of twenty-six.
Males were significantly more likely to offend at an earlier age (23 years) than females (31
years), p<0.01. However, there was no significant difference in age of first offense between
prisoners on remand (23 years) and those that were convicted (also 23 years), p>0.05. The
age of first offense between first-time offenders (26.9 years) and repeat offenders (20.6
years) was also significantly different, p<0.01.
Saint Kitts and Nevis
The offenses most often reported by convicted offenders were, in rank order, capital crimes,
robbery, physical assault, stealing, and sexual offenses (Table CA2). Interestingly, very few

Exploring the Relationship between Drugs and Crime
30
were serving a sentence for drug crimes (4%). For offenders who reported previous offenses
(48.1% of the prison population), the offenses most often reported were physical assault
(28.6%), stealing (16%), followed by drug crimes, robbery, capital crimes and more than
one-fifth for “other” offenses.
Of the four convicted female offenders, one was currently sentenced for stealing, one for
physical assault and two for “other” offenses. Males were more likely to be sentenced for
capital crimes, robbery, and “other” offenses. A little less than half of all offenders were
repeat offenders (47%). Some 43% of convicted prisoners reported that this was not the first
time they had been sentenced. A notably higher proportion of those on remand also reported
that they had been sentenced before (55%), p=0.059.
The age of first offense among males was notably younger than that of females (22 years
versus 27 years), however there was no statistically significant difference, p>0.05. There
was also no significant difference in the age of first offense between prisoners on remand
(23 years) and those that were convicted (22.8 years), p>0.05. The age of first offense for
first-time offenders (25.9 years) and for repeat offenders (19.4 years) was also significantly
different, p<0.01.
Dominica
The offenses most often reported by convicted offenders were, in rank order, stealing,
physical assault, robbery, drug crimes, capital crimes, and sexual offenses (Table CA2). For
offenders who reported previous offenses (n=149 or 67.4% of the population), the offenses
most often reported were drug crimes, stealing, physical assault, and “other” offenses.
Of the three convicted female offenders, one was currently sentenced for robbery, and two
for capital crimes. Males were more likely to be sentenced for capital crimes, robbery,
stealing, physical assault, drug crimes and to a lesser extent sexual offenses. A little more
than six of every ten offenders were repeat offenders (61.4%). Some 62% of convicted
prisoners reported that this was not the first time they had been sentenced. An equally high
proportion of those on remand also reported that they had been sentenced before (59.3%),
p>0.05.
The mean age of first offense indicated was 23.6 years ± 9.44 years, and the median age was
21, with a range of 59 years. About 30% of offenders had offended before the age of 18,
while 75% had offended by the age of 28.
The age of first offense among males was very similar to that of females (23.6 versus 23.2
years), and this was not statistically different, p>0.05. However, there was a significant
difference in age of first offense between prisoners on remand (20.7 years) and those that
were convicted (24.5 years), p<0.05. The age of first offense of first-time offenders (26.4

Exploring the Relationship between Drugs and Crime
31
years) was also significantly different (p<0.01) from the age of first offense of repeat
offenders (21.2 years).
Saint Lucia
The offenses most often reported by those offenders who were currently sentenced, in rank
order, were capital crimes, physical assault, stealing, sexual offenses, robberies and drug
crimes. For offenders who reported previous offenses (n=222 or 42% of the prison
population), the offenses most often reported were, physical assault, drug crimes, robbery,
stealing, and “other” offenses.
Of the three convicted female offenders, one was currently sentenced for drug crimes and
two for capital crimes. Males were more likely to be sentenced for capital crimes, physical
assault, stealing and sexual offenses.
A little more than three of every ten offenders were repeat offenders (35.3%). Some 31.7%
of convicted prisoners reported that this was not the first time they had been sentenced. A
slightly higher proportion of those on remand also reported that they had been sentenced
before (38.9%), p>0.05.
The mean age of first offense indicated was 25.3 years ± 9.60. The median age was 23 and
the ages of first offense had a range of 43 years. About 31% of offenders had offended
before the age of 18, while 75% had offended by age 29.
The age of first offense among males was very similar to that of females (25.3 versus 25.4
years), and this was not statistically different, p>0.05. However, there was a significant
difference in age of first offense between prisoners on remand (27.4 years) and those that
were convicted (23.1 years), p<0.01. The age of first offense of first-time offenders (27.3
years) and repeat offenders (21.5 years) was also significantly different, p<0.01.
3.3 Previous offending (previously accused or sentenced)
Some 42-67% of offenders in all four countries reported previous offenses for which they
had been either charged or sentenced (see Table CA2). The highest proportion was reported
in Dominica (67%), followed by Saint Vincent and the Grenadines (52%), Saint Kitts and
Nevis (48%) and Saint Lucia (42%).

Exploring the Relationship between Drugs and Crime
32
SU
MM
AR
Y
Criminal history and criminal offending (Table CA2)
The offenses most often reported by those offenders who were currently
sentenced overall tended to be physical assault, capital crimes, stealing, robbery
and drug crimes. Small proportions of sexual offenses were reported for all
countries (4-8%) with Saint Kitts and Nevis (8%) and Saint Vincent and the
Grenadines (6.3%) recording the largest proportion.
Physical assault was more likely to be reported in Saint Vincent and the
Grenadines (12%) and Dominica (15%). Robbery was mostly reported in Saint
Kitts and Nevis (10%) and Dominica (8%), while stealing was most likely to be
reported in Dominica (23%) and Saint Vincent and the Grenadines (12%).
Malicious damage was the least reported offense in all countries (half of a
percent to 3%). A notable proportion of capital crimes was reported for all
countries (7-15%), with the highest in Saint Lucia (15%) and Saint Kitts and
Nevis (14%).
Interestingly, in two countries (Saint Kitts and Nevis (4%) and Saint Lucia (3%),
less than 5% of the current offenses among convicted offenders were drug
crimes. Saint Vincent and the Grenadines (11%) and Dominica (8%) recorded
the highest proportions.
Significant proportions of offenders were repeat offenders—the highest
proportion was recorded in Dominica (61%), followed by Saint Vincent and the
Grenadines (56%), Saint Kitts and Nevis (47%), and Saint Lucia (35%). More
than 40% of convicted offenders in Saint Vincent and the Grenadines, Saint Kitts
and Nevis and Dominica were repeat offenders compared to more than 50% of
those on remand recorded for all countries except Saint Lucia (39%).
The mean age of first offense indicated overall was about 23 years for all
countries except Saint Lucia (age 25). Males were significantly more likely to
offend at an earlier age-- in the case of Saint Vincent and the Grenadines--males
(age 23) compared to females (age 31), p<0.01. The age of first offense of
prisoners on remand and those convicted was significantly different in Dominica
and Saint Lucia. Additionally, the age of first offense of first-time offenders and
repeat offenders in all countries was significantly different, p<0.01. The age of
first offense among repeat offenders was youngest in Saint Kitts and Nevis
(19.4) and Saint Vincent and the Grenadines (20.6).

Exploring the Relationship between Drugs and Crime
33
Drug use and patterns of use
Table CA3: Lifetime prevalence overall, by gender, type of offending and status
Overall lifetime prevalence
Mariju
ana
Cocaine Crack Any
illicit
drug
Alcohol Tobacco
Saint Vincent and the Grenadines 84.6 12.9 6.8 84.6 66.4 73.7
Saint Kitts and Nevis 67.9 4.6 5.6 68.4 61.6 25.2
Dominica 85.8 28.3 26.2 87.1 66.1 76.4
Saint Lucia 80.4 5.7 4.8 80.4 58.5 69.0
Survey average 79.7 12.9 10.9 80.1 63.2 61.1
Gender (male)
Saint Vincent and the Grenadines 85.1 13.0 6.5 85.1 66.6 74.4
Saint Kitts and Nevis 68.9 4.7 5.7 69.4 62.1 25.2
Dominica 86.9 28.8 26.2 88.2 66.4 77.0
Saint Lucia 81.2 5.5 4.5 81.2 59.5 69.7
Survey average 80.5 13.0 10.7 80.9 63.7 61.6
Gender (female)
Saint Vincent and the Grenadines 66.7 8.3 16.7 66.7 58.3 50.0
Saint Kitts and Nevis 16.7 - - 16.7 33.3 16.7
Dominica 25.0 - 25.0 25.0 50.0 -
Saint Lucia 33.3 22.2 22.2 33.3 - 22.2
Survey average 35.4 15.3 21.3 35.4 47.2 29.6

Exploring the Relationship between Drugs and Crime
34
Table CA3 continued
Type of offending (first-time)
Saint Vincent and the Grenadines 77.0 3.9 2.6 77.0 62.6 61.5
Saint Kitts and Nevis 60.8 0 1.0 60.8 51.8 13.9
Dominica 77.8 13.3 12.2 77.8 70.0 64.4
Saint Lucia 76.5 2.6 0.9 76.5 59.3 63.5
Survey Average 73.0 6.6 4.2 73.0 60.9 50.8
Type of offending (repeat)
Saint Vincent and the Grenadines 90.6 20.1 10.2 90.6 69.4 83.4
Saint Kitts and Nevis 76.0 9.8 10.2 77.1 72.8 38.2
Dominica 90.9 37.8 35.0 93.0 63.6 83.9
Saint Lucia 87.5 11.4 11.8 87.5 57.0 78.8
Survey Average 86.3 19.8 16.8 87.1 65.7 71.1
Status (on remand)
Saint Vincent and the Grenadines 81.1 5.8 6.6 81.1 63.0 72.4
Saint Kitts and Nevis 74.0 4.5 1.5 74.0 66.4 24.1
Dominica 79.6 14.8 18.5 79.6 55.6 70.4
Saint Lucia 84.8 6.6 4.7 84.8 59.6 71.4
Survey Average 79.9 7.9 7.8 79.9 61.2 59.6
Status (convicted )
Saint Vincent and the Grenadines 86.1 16.1 7.0 86.1 67.9 74.1
Saint Kitts and Nevis 64.9 3.8 0.8 65.6 59.2 25.8
Dominica 87.7 32.4 28.5 89.4 69.3 78.2
Saint Lucia 76.1 4.9 4.9 76.1 57.4 66.8
Survey Average 78.7 14.3 10.3 79.3 63.5 61.2

Exploring the Relationship between Drugs and Crime
35
Saint Vincent and the Grenadines
Table CA3 above shows that the most prevalent drug reported ever used by offenders was
marijuana. About 85% of all offenders had used marijuana in their lifetime. This was
followed by tobacco (73.7%) and alcohol (66.4%). Cocaine was the second most prevalent
illicit drug used—some 13% reported lifetime use--and 6.8% reported lifetime use of crack
cocaine. A small proportion reported non-prescription use of medication (2.3%), while
1.7% used inhalants. This population of offenders reported no heroin use. “Any illicit drug
use” was computed to give a lifetime prevalence of 84.6% (similar prevalence for lifetime
marijuana use).
Some 85% of males compared to 66.7% of females reported lifetime marijuana use; 13% of
males versus 8.3% of females reported cocaine use; 6.5% of males versus 16.7% of females
reported crack cocaine use; and 66.6% of males versus 58.3% of females reported lifetime
alcohol use. Tobacco use was reported by 74.7% of males compared to 50% of females.
There was no significant difference between males and females with respect to reported
lifetime drug use prevalence (p>0.05).
Some 77% of first-time offenders compared to 91% of repeat offenders reported lifetime
marijuana use (p<0.01). Four percent of first-time offenders versus 20% of repeat offenders
reported cocaine use (p<0.01) while 2.6% of first-time offenders versus 10% of repeat
offenders reported crack cocaine use (p<0.01). In addition, 62.6% of first-time offenders
versus 69.4% of repeat offenders reported lifetime alcohol use (p>0.05).
Tobacco use was reported by 61.8% of first-time offenders compared to 83.4% of repeat
offenders (p<0.01). Reported lifetime prevalence (for marijuana, cocaine, crack cocaine,
and tobacco) among first-time offenders was significantly different from that reported by
repeat offenders, (p<0.01).
Some 81% of offenders on remand compared to 86% of convicted offenders reported
lifetime marijuana use; 5.8% of those on remand versus 16% of those convicted reported
cocaine use; 6.6% of offenders on remand versus 7% of convicted offenders reported crack
cocaine use; and 63% of those on remand versus 68% of convicted reported lifetime alcohol
use.
Saint Kitts and Nevis
The most prevalent drug reported ever used by offenders was marijuana, as shown in Table
CA3 above. About 68% of all offenders had used marijuana in their lifetime. This was
followed by alcohol (61.6%) and tobacco (25.2%). Crack cocaine was the second most
prevalent illicit drug used—some 5.6% reported lifetime use--and 4.6% reported lifetime use

Exploring the Relationship between Drugs and Crime
36
of cocaine powder. A small proportion reported non-prescription use of medication (1.3%)
while 0.5% reported inhalant use and 1% reported heroin use. “Any illicit drug use” was
computed to give a lifetime prevalence of 68.4%.
Some 69% of males compared to 16.7% of females reported lifetime marijuana use; cocaine
and or crack cocaine use was reported only by male offenders—4.7% cocaine and 5.7%
crack cocaine; and 62.1% of males versus 33.3% of females reported lifetime alcohol use.
Tobacco use was reported by 25.2% of males compared to 16.7% of females. There was no
significant difference between males and females with respect to reported lifetime drug use
prevalence (p>0.05).
Some 61% of first-time offenders compared to 76% of repeat offenders reported lifetime
marijuana use (p<0.01). Cocaine use was only reported by repeat offenders (p<0.01); and
1.2% of first-time offenders versus 10.6% of repeat offenders reported crack cocaine use
(p<0.01). About 52% of first-time offenders versus 72.8% of repeat offenders reported
lifetime alcohol use (p<0.01); and 13.9% of first-time offenders versus 38.2% of repeat
offenders reported tobacco use (p<0.01). Reported lifetime prevalence (for marijuana,
cocaine, crack cocaine, alcohol and tobacco) among first-time offenders was significantly
different statistically from that reported by repeat offenders, (p<0.01 on chi square test).
Some 74% of offenders on remand compared to 65% of convicted offenders reported
lifetime marijuana use; 6% of those on remand versus 3.8% of those convicted reported
cocaine use; 4.5% of offenders on remand versus 6% of convicted offenders reported crack
cocaine use; and 66.4% of those on remand versus 59% of convicted reported lifetime
alcohol use. Tobacco use was reported by 24% of offenders on remand compared to 26%
for those convicted. There was no statistically significant difference between offenders on
remand and those convicted with respect to reported lifetime prevalence.
Dominica
The most prevalent drug reported ever used by offenders was marijuana, as shown in Table
CA3 above. About 86% of all offenders had used marijuana in their lifetime. This was
followed by tobacco (76.4%) and alcohol (66.1%). Cocaine was the second most prevalent
illicit drug used—some 28.3% of lifetime use was reported and 26.2% reported lifetime use
of crack cocaine. A small proportion reported non-prescription use of medication (1.7%)
while 3% reported inhalant use and 3% reported heroin use. “Any illicit drug use” was
computed to give a lifetime prevalence of 87.1%.
Some 87% of males compared to 25% of females reported lifetime marijuana use; cocaine
use was reported only by male offenders—28.8%. However, 26% of crack cocaine was

Exploring the Relationship between Drugs and Crime
37
reported by males and 25% by females, while 66.4% of males versus 50% of females
reported lifetime alcohol use. Tobacco use was reported by 77.7% of males compared to no
lifetime use reported by females. There was no significant difference between males and
females with respect to reported lifetime drug use prevalence (p>0.05).
Some 78% of first-time offenders compared to 91% of repeat offenders reported lifetime
marijuana use (p<0.01). Cocaine use was reported by 13.3% of first-time offenders and
37.8% of repeat offenders (p<0.01). Some 12.2% of first-time offenders versus 35% of
repeat offenders reported crack cocaine use (p<0.01); and 70% of first-time offenders versus
63.6% of repeat offenders reported lifetime alcohol use (p>0.05). In addition, 64.4% of
first-time offenders versus 83.9% of repeat offenders reported tobacco use (p<0.01).
Some 80% of offenders on remand compared to 88% of convicted offenders reported
lifetime marijuana use; 15% of those on remand versus 32.4% of those convicted reported
cocaine use (χ2=6.32, p<0.05); 18.5% of offenders on remand versus 28.5% of convicted
offenders reported crack cocaine use; and 56% of those on remand versus 69% of convicted
reported lifetime alcohol use. Tobacco use was reported by 70% of offenders on remand
compared to 78% for those convicted, p>0.05.
Saint Lucia
As shown in Table CA3 above, the most prevalent drug reported ever used by offenders was
marijuana. About 80% of all offenders had used marijuana in their lifetime. This was
followed by tobacco (69%) and alcohol (59%). Cocaine was the second most prevalent illicit
drug used—some 5.7% lifetime use was reported and 4.8% reported lifetime use of crack
cocaine. A small proportion reported non-prescription use of medication (1.6%). There
were no reported use of inhalants and heroin. “Any illicit drug use” was computed to give a
lifetime prevalence of 80.4%, which mirrors the lifetime marijuana prevalence.
Some 81% of males compared to 33% of females reported lifetime marijuana use; cocaine
use prevalence among male offenders was 5.5% with only two of the nine females reporting
cocaine or crack cocaine use. However, 4.5% of male offenders also reported crack cocaine
use. Only males reported lifetime alcohol use (60%). Tobacco use was reported by 69.7%
of males compared to 22% reported by females. There was no significant difference
between males and females with respect to any reported lifetime drug use prevalence
(p>0.05).
Some 77% of first-time offenders compared to 88% of repeat offenders reported lifetime
marijuana use (p<0.01). Cocaine use was reported by 2.6% of first-time offenders and
11.4% of repeat offenders (p<0.01). Less than 1% of first time offenders versus 11.8% of

Exploring the Relationship between Drugs and Crime
38
repeat offenders reported crack cocaine use (p<0.01); and 59% of first time offenders versus
57% of repeat offenders reported lifetime alcohol use (p>0.05). In addition, 64% of first
time offenders versus 79% of repeat offenders reported tobacco use (p<0.01). Lifetime
prevalence (for marijuana, cocaine, crack cocaine and tobacco) among first time offenders
was significantly different statistically, from that reported by repeat offenders, (p<0.01 on
chi square test).
Some 85% of offenders on remand compared to 76% of convicted offenders reported
lifetime marijuana use; 6.6% of those on remand versus 4.9% of those convicted reported
cocaine use; 4.7% of offenders on remand versus 4.9% of convicted offenders reported
crack cocaine use; and 60% of those on remand versus 57% of convicted reported lifetime
alcohol use. Tobacco use was reported by 71% of offenders on remand compared to 67%
for those convicted. There was no statistically significant difference between offenders on
remand and those convicted with respect to reported lifetime prevalence.

Exploring the Relationship between Drugs and Crime
39
SU
MM
AR
Y
Self-reported lifetime prevalence of substance use (Table CA3 above)
The most prevalent drug reported ever used by offenders in all four countries
was marijuana. About 68-86% of all offenders had used marijuana in their
lifetime—the highest proportion was reported in Dominica and Saint Vincent
and the Grenadines, and the lowest proportion overall in Saint Kitts and Nevis
(67.9%). High prevalence of cocaine and crack cocaine use was reported in
Dominica (28% and 26% respectively). Saint Vincent and the Grenadines
(12.9% cocaine and 6.8% crack) reported the next most significant proportions
of cocaine/crack cocaine use. There were no reported use of inhalants and
heroin in Saint Lucia and very negligible proportions reported in the other
countries (inhalants 0.5-3%) and heroin (1-3%), with the other exception being
Saint Vincent and the Grenadines, with no heroin reported.
In all countries, males reported notably higher proportions of drug use compared
to females (note that the proportions indicated for females relate to only 2 or 3
offenders in most cases). Lifetime prevalence for marijuana among males was
50-60 percentage points higher than females in all countries with the exception
of Saint Vincent and the Grenadines (only 18 percentage points higher). In the
case of Saint Kitts and Nevis, only males reported cocaine use, as was the case
for crack cocaine in Dominica.
In every country, repeat offenders reported notably higher proportions of illicit
drug use (12-16 percentage points higher in the case of marijuana). In all cases,
cocaine and crack cocaine use was significantly higher among repeat offenders
compared to first-timers.
Convicted offenders in Saint Vincent and the Grenadines and Dominica reported
higher prevalence of marijuana use compared to those offenders on remand.
Cocaine and crack cocaine use among both convicted offenders and those on
remand was significantly higher than that reported in the other countries (12
percentage points higher than the next highest for crack cocaine among those on
remand and 23 percentage points higher than the next highest for crack cocaine
for those convicted).

Exploring the Relationship between Drugs and Crime
40
Table CA4: Criminal offending and lifetime drug use
Offense category Saint Vincent Saint Kitts Dominica Saint Lucia
Mar Crack Mar Crack Mar Crack Mar Crack
Sexual offense 90.9 9.1 53.3 6.7 90.9 18.2 57.1 -
Physical assault 81.0 4.8 52.1 - 91.2 14.7 55.6 -
Robbery 83.3 - 70.0 10.0 78.9 36.8 100.0 16.7
Stealing 90.4 16.4 61.6 13.7 92.6 38.9 87.5 12.5
Malicious damage 50.0 - 100.0 - 83.3 33.3 100.0 -
Capital crimes 87.4 5.2 77.8 7.4 64.7 17.6 73.1 4.1
Drug crimes 87.5 10.3 87.5 12.5 94.4 33.3 62.3 -
Other 83.7 - 62.0 - 90.0 25.0 85.0 5.0
Saint Vincent and the Grenadines
As shown in Table CA4 above, lifetime marijuana use was notably high among all offense
categories (81-90%), except in the case of malicious damage (offenders in this category
reported lifetime marijuana use of only 50%). For cocaine use, offenders who committed
stealing reported 40.4% lifetime use; for drug crimes, lifetime use was 25.7%, and the
figures for capital crimes were 10.4%, sexual offenses, 9% and other crimes, 10.9%. A
similar pattern was noted for crack cocaine with the highest prevalence reported for the
offense of stealing (16.4%), followed by drug crimes (10%), sexual offenses (9%), capital
crimes (5%) and physical assault (4.8%).
Lifetime alcohol use was notably high among all offense categories (50-77%), except in the
case of malicious damage (offenders in this category reported no lifetime alcohol use).
Tobacco use followed the same pattern (61-86%) in all categories except for malicious
damage (50% lifetime prevalence).

Exploring the Relationship between Drugs and Crime
41
Saint Kitts and Nevis
Lifetime marijuana use was notably high among all offense categories (52-88%), as shown
in Table CA4 above. In the case of malicious damage, 100% of offenders in this category
reported lifetime marijuana use. For cocaine use, offenders who committed stealing
reported the highest prevalence (13.7%), followed by sexual offenses (7%), robbery (5%)
and capital crimes (3.7%). A similar pattern was noted for crack cocaine, with the highest
prevalence reported for the offense of stealing (13.7%) followed by drug crimes (12.5%),
robbery (10%), capital crimes (7.4%), and sexual offenses (6.7%).
Lifetime alcohol use was notably high among all offense categories (44-75%), except in the
case of malicious damage (offenders in this category reported no lifetime alcohol use).
Tobacco use followed the same pattern but with moderate use in all categories except for
malicious damage (12-40% lifetime prevalence).
Dominica
As shown in Table CA4 above, lifetime marijuana use was notably high among all offense
categories (65-94%). The highest proportions were reported for drug crimes and stealing.
For cocaine use, offenders who committed malicious damage, stealing and robbery reported
the highest prevalence. A similar pattern was noted for crack cocaine, with the highest
prevalence reported for the offense of stealing (39%) followed by robbery (37%), drug
crimes (33%), malicious damage (33%), and other offenses (25%).
Lifetime alcohol use was notably high among all offense categories (55-77%) with the
highest prevalence in the case of physical assault (77%), robbery (74%) and drug crimes
(72%). Tobacco use followed the same pattern with over 80% prevalence in the physical
assault, sexual offenses, and stealing categories.
Saint Lucia
Lifetime marijuana use was notably high among all offense categories (56-100%), as shown
in Table CA4 above. The highest proportions were noted for robbery, malicious damage
and stealing. For cocaine use, offenders who committed stealing reported the highest
prevalence. A similar pattern was noted for crack cocaine with the highest prevalence
reported for the offense of robbery (17%) and stealing (13%).
Lifetime alcohol use was notably high among all offense categories (41-78%), with the
exception of drug crimes (19%). The highest prevalences reported were in the following
categories: physical assault (78%), robbery (67%) and stealing (63%). Tobacco use

Exploring the Relationship between Drugs and Crime
42
followed the same pattern with over 70% prevalence in the cases of physical assault, sexual
offenses, robbery and stealing categories.
SU
MM
AR
Y
Offense category and lifetime drug use
Lifetime marijuana use featured predominantly in all offenses, except malicious
damage in Saint Vincent. In the case of Saint Kitts and Nevis, more than 60% of
marijuana use was reported for all offenses except sexual offenses and physical
assault. In Dominica, relatively high proportions of both marijuana and crack
cocaine use were reported among all offense categories. This was the same pattern
for marijuana use in Saint Lucia, and in the case of crack cocaine use, robbery and
stealing were the offenses for which lifetime use was most likely to be reported.
3.4 Age of first substance use
Table CA5: Age of first drug use among offenders
Saint Vincent Saint Kitts Dominica Saint Lucia
Mean
(yrs.)
Median
(yrs.)
Mean
(yrs.)
Median
(yrs.)
Mean
(yrs.)
Median
(yrs.)
Mean
(yrs.)
Median
(yrs.)
Marijuana 14.7 14.0 15.1 14.0 15.6 15.0 14.9 14.0
Cocaine 21.5 20.0 23.3 21.9 22.0 20.0 21.6 22.0
Crack 23.5 24.0 25.1 21.0 21.9 20.0 26.7 24.0
Inhalants 23.0 23.0 19.0 19.0 16.2 16.0 - -
Any illicit
drug
14.7 14.0 15.2 14.1 15.7 15.0 14.9 14.0
Alcohol 16.2 16.0 16.3 16.0 16.5 16.0 15.3 15.0
Tobacco 16.5 15.0 16.9 17.1 17.7 17.0 18.1 18.0
Saint Vincent and the Grenadines
As shown in Table CA5 above, the mean age of first use of marijuana was lower than the
mean age of first use of alcohol and tobacco. The mean age of first use of marijuana was
14.7 and the median age was 14. Fifty percent of marijuana use was initiated by the age of

Exploring the Relationship between Drugs and Crime
43
14, which was two years earlier than alcohol and one year earlier than tobacco use. In
reality, marijuana use was begun as if it were a licit substance, and was reported as having
been initiated before the age of ten.
Tobacco use (mean initiation age of 16.5) was started about the same time as alcohol use
(mean initiation age of 16.2).
Marijuana use was initiated before the age of 10, similar to the two licit substances (tobacco
and alcohol). In addition, with the exception of marijuana (43.1%), the greatest proportion of
use initiated between ages 10-14 was tobacco (35.8%) and alcohol (25%). Substantial
proportions of use were initiated between 15-19 and 20-24 (73% of cocaine use, 57% of
crack cocaine use, 50% of inhalant use, 55% of alcohol use and 49% of tobacco use).
Saint Kitts and Nevis
The mean age of first use of licit substances (alcohol, at 16.3 years) and tobacco (16.9 years)
was slightly higher than that of the main illicit drug, marijuana (15.1 years). Tobacco use
(median initiation age of 17) was started a little later than alcohol use (median initiation age
of 16). Marijuana use was initiated at an early age, comparable to alcohol and tobacco – the
median age of first use for marijuana was 14 years. Fifty percent of marijuana use was
initiated by age 14, which was two years earlier than that proportion of alcohol use and three
year earlier for tobacco use. As in other countries, marijuana use was initiated as if it was a
licit substance.
Initiation of the other illicit drugs along an age differential tended to follow a discernible
pattern of moving from the presumed “softer drugs” (alcohol and marijuana) to “harder
drugs” (cocaine and crack cocaine). Mean age of initiation for cocaine powder was 23,
compared to crack cocaine use (25 years). Mean age of initiation reported for any illicit
drug followed the pattern observed for marijuana (15 years).
Interestingly, the only substances reported as initiated before the age of 10 were the two licit
substances (tobacco and alcohol) and marijuana (the most prevalent illicit substances self-
reported). In addition, with the exception of marijuana (40.3%), the greatest proportion of
use initiated between the ages of 10 and 14 were tobacco (24%) and alcohol (24%).
Substantial proportions of use were initiated between the ages of 15 and 19 and 20-24 (67%
of cocaine use or crack cocaine use, 60% of alcohol use and 64% of tobacco use).
Dominica
The mean age of first use for the licit substances alcohol (age 16.5) and tobacco (age 17.7)
was slightly higher than that of the main illicit drug, marijuana (age 15.6). Tobacco use
(median initiation age of 16 years) was started at about the same time as alcohol use (median
initiation age of 16 years). Marijuana use was initiated at an early age, comparable to

Exploring the Relationship between Drugs and Crime
44
alcohol and tobacco – the median age of first use for marijuana was 15 years. Fifty percent
of marijuana use was initiated by the age of 15, which was one year earlier than that
proportion of alcohol or tobacco use. The mean age of initiation for cocaine powder was 22
years compared to crack cocaine (21.9 years). The mean age of initiation reported for any
illicit drug followed the pattern observed for marijuana (15.7 years). The initiation age for
heroin was notably later (mean age of 25.2 years), while and that of inhalants was 16.2
years.
All the substances were reported initiated before the age of 10 years -more so tobacco and
marijuana, the most prevalent illicit substances self-reported. In addition, with the exception
of cocaine and crack cocaine, 30-38% of all other substance use was initiated between the
ages of 10 and 14. A substantial proportion of use of all substances was initiated between
the ages of 15 and 19 (some 33-43%).
Saint Lucia
The mean age of first use of licit substances—alcohol (15.3 years) and tobacco (18.1 years)-
-was slightly higher than that of the main illicit drug, marijuana (14.9 years). Tobacco use
(median initiation age of 18) was started some time later than alcohol use (median initiation
age of 15). Marijuana use was initiated at an earlier age compared to alcohol and tobacco –
the median age of first use of marijuana was 14, which indicates that some 50% of
marijuana use was already initiated by the age of 14, one year earlier than that proportion of
alcohol use and four years earlier than tobacco use. The mean age of initiation of cocaine
powder was 22, compared to crack cocaine (26.7 years of age). The mean age of initiation
reported for any illicit drug followed the pattern observed for marijuana (14.9 years).
Interestingly, all the substances, with the exception of cocaine and crack, were reported
initiated before the age of 10 (more so, tobacco and alcohol). In addition, with the exception
of cocaine and crack cocaine, 22-44% of all other substance use was initiated between the
ages of 10 and 14. Substantial proportions of use of all substances were also initiated
between the ages of 15-19 (some 22-41%).

Exploring the Relationship between Drugs and Crime
45
SU
MM
AR
Y
Age of first use among offenders (Table CA5)
The mean age of first use of licit substances (alcohol and tobacco) in all countries
was slightly less than that of illicit drugs, with the exception of marijuana.
Interestingly, the age of first use of marijuana was lower than that of alcohol and
tobacco in all cases. The age of first use of other illicit substances was age 20 or
older in all four countries. The age of first use of “any illicit drug” followed the
same pattern as that of marijuana.
Table CA5a: Age of first drug use among offenders—survey average
Survey average-
Mean and median age of first use
Mean
(yrs.)
Median
(yrs.)
Marijuana 15.1 14.3
Cocaine 22.1 21.0
Crack 24.3 22.3
Inhalants 19.4 19.3
Any illicit drug 15.1 14.3
Alcohol 16.1 15.8
Tobacco 17.3 16.8
3.5 Relationship between drugs and crime
Tables CA6 and CA7 below show offender responses (convicted and on remand) to survey
questions about their perceptions of the relationship between drugs and crime.

Exploring the Relationship between Drugs and Crime
46
Table CA6: Relationship between drugs and crime - [Offenders responding “YES”]
Items Saint Vincent Saint Kitts Dominica Saint Lucia
Con Rem Con Rem Con Rem Con Rem
Did the crime you committed have some
kind of relationship with drugs?
126
(44.4)
11
(18.9)
35
(15.3)
3
(7.7)
74
(41.3)
7
(22.6)
56
(22.3)
20
(21.7)
When you committed the crime for which
you are currently imprisoned, were you
under the influence of a drug or
intoxicated?
67
(55.4)
2
(29.3)
18
(52.4)
3
(66.7
)
52
(29.1)
7
(22.6)
23
(40.4)
13
(64.3)
Do you think you would have committed
the crime if you were not under the
influence of a drug or intoxicated
(drugged)?
13
(19.1)
- 5
(27.3)
3
(60.0
)
15
(8.4)
- 10
(17.9)
3
(12.9)
Did you commit the crime for which you
are currently imprisoned in order to get
drugs for your own personal use?
22
(33.2)
3
(41.4)
8
(23.5)
2
(33.3
)
29
(16.2)
6
(19.5)
13
(23.1)
10
(51.4)
Was (were) the victim(s) of your crime
under the influence of alcohol or other
drugs?
17
(25.4)
2
(29.3)
8
(23.5)
3
(60.0
)
10
(5.6)
- 13
(23.1)
5
(25.7)
Did you wilfully/intentionally consume a
substance in order to boost your courage
to commit the crime for which you are
currently in prison?
22
(18.7)
- 3
(9.5)
2
(33.3
)
6
(3.4)
- 13
(23.1)
10
(51.4)
Was the crime for which you are
currently imprisoned linked to the
production, selling and/or trafficking of
drugs?
61
(51.4)
2
(19.3)
15
(42.9)
3
(60.0
)
35
(19.6)
2
(3.7)
43
(76.9)
15
(74.3)
Was the crime for which you are
currently imprisoned linked to drug
trafficking?
55
(46.6)
2
(29.3)
13
(38.1)
3
(60.0
)
26
(14.5)
2
(3.7)
43
(76.9)
8
(38.6)
Was the crime for which you are
currently imprisoned linked to activities
that went against drug laws?
56
(46.5)
7
(87.9)
27
(76.2)
3
(60.0
)
41
(22.9)
3
(5.6)
40
(71.1)
8
(38.6)

Exploring the Relationship between Drugs and Crime
47
Table CA7: Relationship between drugs and crime – Summary
Countries Ever
convicted and
imprisoned
Crime linked to drugs
On remand On remand Convicted
Saint Vincent and the Grenadines 54 (43.9) 11 (18.9) 126 (41.4)
Saint Kitts and Nevis 42 (39.3) 3 (7.7) 35 (15.3)
Dominica 29 (54.7) 7 (22.6) 74 (41.3)
Saint Lucia 89 (34.4) 20 (21.7) 56 (22.3)
Saint Vincent and the Grenadines
Offenders on remand were asked if they had ever been convicted and imprisoned for any
offense: 43.9% said ‘yes’ (see Table CA7 above). Those who responded in the affirmative
were asked whether the crime for which they were previously convicted had some type of
relationship with drugs: 18.9% said ‘yes’. Convicted offenders were also asked this
question and 44.4% said “yes”.
Of those who said that their offense had some type of relationship with drugs:
55.4% of convicted offenders had committed the crime while under the influence of
drugs, compared to 29.3% of those on remand;
51.4% of convicted offenders indicated that the crime was linked to production,
selling and/or trafficking of drugs, or directly linked to drug trafficking (46.6%), or
to activities that were against drug laws (46.6%). This compares to a small
proportion (29.3%) of those on remand who indicated that the crime was linked to
production, selling and/or trafficking of drugs, or directly linked to drug trafficking
(29.3%), or to activities that were against drug laws (87.9%);
About 33.2% of convicted offenders had committed the crime in order to obtain
drugs for their own personal use, as compared to 41.4% on remand;
A small proportion of convicted offenders (18.7%) indicated that they had
intentionally consumed a substance in order to boost their courage to commit the
crime. This was not indicated by those on remand;

Exploring the Relationship between Drugs and Crime
48
A notable proportion of offenders (25.4% convicted and 29.3% of those on remand)
indicated that their crime was perpetrated on a victim who was under the influence
of alcohol or drugs.
Offense categories and link with drugs
Offenders who committed the crime to obtain drugs for personal use were more likely to be
sentenced for robbery, stealing and drug offenses. Interestingly, about a quarter of those
sentenced for stealing also said they intentionally used a drug in order to boost their courage
to commit the crime. The highest proportions of affirmative responses (69-85%) were from
prisoners convicted of drug offenses, that is, where the offense was linked to production,
selling or trafficking in drugs, or was against the drug laws of the country.
Saint Kitts and Nevis
Offenders on remand were asked if they had ever previously been convicted and imprisoned
for any offense: 39.3% said ‘yes’. Those who responded affirmatively were asked whether
their previous crime had some type of relationship with drugs: 7.7% of remand prisoners
said ‘yes’, while 15.3% of convicted prisoners agreed.
Of those who said that their offense had some type of relationship with drugs:
52.4% of convicted offenders had committed the crime while under the influence of
drugs or intoxicated, compared to 67% of those on remand;
42.9% of convicted offenders reported that the crime was linked to production,
selling and/or trafficking of drugs, or directly linked to drug trafficking (38%), or to
activities that were against drug laws (76%). This compares to a very small number
of inmates (3 inmates) on remand, but accounts for 60% of those who reported that
the crime was linked to production, selling and/or trafficking of drugs, or directly
linked to drug trafficking (60%), or to activities that were against drug laws (60%);
Around 24% of convicted offenders had committed the crime in order to obtain
drugs for their own personal use, compared to 33% on remand;
A small proportion of the convicted offenders (9.5%) reported that they had
wilfully/intentionally consumed a substance in order to boost their courage to
commit the crime. This was reported by only two of the offenders on remand in this
group;
Nearly a quarter of convicted offenders (23.8%) reported that their crime was
perpetrated on a victim who was under the influence of alcohol or drugs. This
compares to two offenders on remand in the group (33.3%) who also reported this.

Exploring the Relationship between Drugs and Crime
49
Offense categories and link with drugs
Offenders sentenced for sexual offenses said that the offense they committed had some kind
of relationship with drugs, or that the crime was committed while under the influence of
drug or while intoxicated. For this offense category, a small proportion of victims were also
under the influence of drugs or were intoxicated. This pattern was also common for
offenders convicted of stealing, drug crimes and “other” crimes. However, higher
proportions of those convicted for drug crimes also reported that they were linked to drug
trafficking, activities that went against drug laws and to production and or selling of drugs;
In summary, sexual offenses, stealing, drug crimes and to a lesser extent robbery indicated
some link to drugs.
Dominica
Remand prisoners were asked if they had ever previously been convicted and imprisoned for
any offense: 54.7% said ‘yes’. Those who responded in the affirmative were asked whether
their previous crime had had some type of relationship with drugs, and 22.6% of remand
prisoners said ‘yes’, while 41.3% of convicted offenders agreed.
Of those who said that their offense had some type of relationship with drugs:
29% of convicted offenders had committed the crime while under the influence of
drugs, which compares to 23% of those on remand;
20% of convicted offenders indicated that the crime was linked to production, selling
and/or trafficking of drugs, or directly linked to drug trafficking (15%), or to
activities that were against drug laws (23%). This compares to a very small
proportion (3.7%) of those on remand who indicated that the crime was linked to
production, selling and/or trafficking of drugs, or directly linked to drug trafficking
(3.7%), or to activities that were against drug laws (5.6%);
About 16% of convicted offenders had committed the crime in order to obtain drugs
for their own personal use, as compared to 20% on remand;
A small proportion of convicted offenders (3.4%) indicated that they had
wilfully/intentionally consumed a substance in order to boost their courage to
commit the crime. This was not indicated by those on remand;
Again, a very small proportion of offenders (5.6% convicted only) indicated that
their crime was perpetrated on a victim who was under the influence of alcohol or
drugs.
Offense categories and link with drugs
Some convicted offenders sentenced in all offense categories said that their offense had
some kind of relationship with drugs, and that the crime was committed while under the

Exploring the Relationship between Drugs and Crime
50
influence of drug or while intoxicated. In addition, for all offense categories, offenders
indicated that the crime was linked to activities that went against the drug laws, or that they
committed the crime in order to obtain drugs for their own use.
In summary, sexual offenses, physical assault, robbery stealing, capital crimes and drug
crimes were all linked to drugs in one way or another.
Saint Lucia
Offenders on remand were asked if they had ever been convicted and imprisoned for any
offense: 34.4% said ‘yes’. Those who responded in the affirmative were asked whether the
crime for which they were previously convicted had some type of relationship with drugs,
and 21.7% said ‘yes’. Convicted offenders were also asked this question and 22.3% said
“yes”.
Of those who said that their offense had some type of relationship with drugs:
40.3% of convicted offenders had committed the crime while under the influence of
drugs, as compared to 64% of those on remand;
76.9% of convicted offenders indicated that the crime was linked to production,
selling and/or trafficking of drugs, or directly linked to drug trafficking (76.9%), or
to activities that were against drug laws (71%). This compares to 74.3% of those on
remand who indicated that the crime was linked to production, selling and/or
trafficking of drugs, or directly linked to drug trafficking (40%), or to activities that
were against drug laws (40%);
About 23% of convicted offenders had committed the crime in order to obtain drugs
for their own personal use, compared to 51.4% on remand;
More than one-fifth (23%) of convicted offenders indicated that they had
wilfully/intentionally consumed a substance in order to boost their courage to
commit the crime, compared to 51.4% of those on remand;
Around one quarter of all offenders (23% convicted and 26% on remand) indicated
that their crime was perpetrated on a victim who was under the influence of alcohol
or drugs.
Offense categories and link with drugs
Some offenders sentenced in all offense categories (except malicious damage) said that their
offense had had some kind of relationship with drugs, and that the crime was committed
while under the influence of drugs or while intoxicated (except sexual offenses and drug
crimes). In addition, for all offense categories (except sexual offenses and malicious
damage), offenders also indicated that the crime was linked to activities that went against the
drug laws; or that the crime was linked to drug trafficking;

Exploring the Relationship between Drugs and Crime
51
In summary, sexual offenses, physical assault, robbery, stealing, capital crimes and drug
crimes were all linked to drugs in one way or another. Stealing, robbery and capital crimes
all showed some link to drug use.
3.6 Importance of the relationship between drugs and crime
Offenders were asked to state their perception of the importance of the relationship between
drugs and crime, see Table CA8 below.
Table CA8: Importance of the relationship between drugs and crime
Saint
Vincent
Saint Kitts Dominica Saint Lucia
(n=127) (n=40) (n=80) (n=76)
Of little importance 18.6 4.2 6.3 16.2
Of no importance 25.0 20.9 13.8 26.0
Somewhat important 13.8 29.1 - -
Important 17.5 4.2 17.5 4.3
Very important 23.2 20.9 57.5 50.2
Don’t know/no response 1.9 20.8 5.1 3.4
Saint Vincent and the Grenadines. Of those who responded (n=127 or 30.9% of all
offenders), most (54.5%) felt the link was important—23.2% felt it was very important,
17.5% important, and 13.8% somewhat important. About 18.6% felt it was of little
importance and one-quarter (25%) felt it was of no importance. A negligible proportion
(1.9%) did not know of the importance or did not respond.
Saint Kitts and Nevis. Of those who responded (n=40 or 12.3% of all offenders), most
(54.2%) felt it was important—21% felt it was very important, 4.2% important, and 29%
somewhat important. About 4% felt it was of little importance and one-fifth (21%) felt it
was of no importance. A notably large proportion (21%) did not know of the importance or
did not respond.
Dominica. Of those who responded (n=80 or 34.3% of all offenders), most (75%) felt it
was important—57.5% felt it was very important and 17.5% important. About 6.3% felt it

Exploring the Relationship between Drugs and Crime
52
was of little importance and 13.8% felt it was of no importance. A small proportion (5%) did
not know of the importance or did not respond.
St. Lucia. Of those who responded (n=76 or 14.4% of all offenders), most (54.5%) felt it
was important—50% felt it was very important and 4% important. About 16% felt it was of
little importance and more than a quarter (26%) felt it was of no importance. A small
proportion (3.4%) did not know of the importance or did not respond.
SU
MM
AR
Y
Relationship between drugs and crime (Table CA8)
More than one-third of all offenders on remand in all four countries reported that
they had been previously convicted and imprisoned for an offense. Dominica
reported the highest proportion (54.7% or more than half of these offenders),
followed by Saint Vincent and the Grenadines (43.9%), Saint Kitts and Nevis
(39.3%) and lastly, Saint Lucia (34.4%).
Small proportions of offenders, both on remand and convicted, reported some
type of relationship between the crime committed and drugs. For the most part,
higher proportions of remand offenders in Dominica and Saint Lucia reported
such a link. By comparison, higher proportions of convicted offenders in Saint
Vincent and the Grenadines and Dominica reported a link between drugs and the
crime committed.
In most of the countries, the link between the crime and drugs was predominantly
when the crime was committed while under the influence of drugs, or when the
crime was linked to production, selling and/or trafficking of drugs, or directly
linked to drug trafficking, and the activities were against the drug laws.
It may be reasonably inferred from the responses that a relationship between
drugs and the crime existed when the offenders committed the crime in order to
obtain drugs for their own use; intentionally used a substance in order to boost
their courage to commit the crime; or when the crime was perpetrated on a victim
who was under the influence of alcohol or drugs.
A reasonable assumption can be made that all other offense categories show
some link with drug use—in all countries, some responses indicated that sexual
offenses, physical assault, robbery, stealing, capital crimes and drug crimes were
all linked to drugs in one way or another. Stealing, robbery and capital crimes all
showed a stronger association with drug use.

Exploring the Relationship between Drugs and Crime
53
A little more than 50% of responses in Saint Lucia, Saint Kitts and Nevis, and
Saint Vincent and the Grenadines indicated that the relationship between drugs
and crime was important (very important, important, or somewhat important).
This was notably higher in Dominica, where 75% responded that the relationship
was important. A relatively high proportion (14-26%) indicated it was of no
importance—the highest proportions being reported in Saint Lucia (26%) and
Saint Vincent and the Grenadines (25%). However, equally high proportions of
offenders in Saint Lucia (16%) and Saint Vincent and the Grenadines (19%) felt
that the relationship was of no importance.
3.7 Offenders’ perceptions of drug use
Offenders were asked to indicate the three drugs most often used by fellow inmates.
Table CA9: Perception of drug use by fellow inmates
Saint
Vincent
Saint
Kitts
Dominica Saint
Lucia
Inmates seen using drugs
All 5.0 1.0 14.7 11.5
Many 64.5 22.4 57.8 65.5
A few 20.3 15.6 19.0 14.0
None 10.0 50.0 5.0 5.0
Personally affected by drug use 22.0 16.0 26.0 34.0
Perception of drug use by fellow inmates
Saint Vincent and the Grenadines. Offenders were asked to indicate the three drugs most
often used by fellow inmates. The highest proportion of offenders indicated that marijuana
was the drug most used (77%), the second most important was tobacco (85%), and the third
most important was alcohol (72%). A small proportion (12.3%) indicated that tobacco was
the first most important, while 9% said marijuana was the second most important and 13%
felt that cocaine was the third most important.

Exploring the Relationship between Drugs and Crime
54
When asked how many inmates have been seen using drugs or substances in prison, the
majority of offenders said many (64.5%); while 20.3% said few, 5% said all and 10% said
none or did not respond. Slightly more than a fifth (22%) said they were affected by the use
of drugs or substances in prison. The main reasons cited were the health effects of smoke
(asthma, sinus irritation, burning of eyes, shortness of breath, and so on).
Saint Kitts and Nevis. Offenders were asked to indicate the three drugs most often used by
fellow inmates. Their responses were that the first most important was marijuana (52.3%),
the second most important was alcohol (12.5%), and the third was also alcohol (10%).
Some 9% indicated that cocaine and tobacco were the second most important. When asked
how many inmates have been seen using drugs or substances in prison, half of the offenders
said none. About one fifth (22.4%) said many; while 15.6% said a few; and one or two
persons said all.
Only 16% said they were affected by the use of drugs or substances in prison. The main
reasons indicated related to the health effects of smoke (asthma, sinus irritation, burning of
eyes, headaches, and so on.).
Dominica. Offenders were asked to indicate the three drugs most often used by fellow
inmates. The only illicit substance indicated by offenders as the first most important was
marijuana (14.2%), but 71% mentioned tobacco as also being the most important. The
second most important were also marijuana and tobacco, and the third most important was
crack cocaine or cocaine. When asked how many inmates were seen using drugs or
substances in prison, the majority of offenders said many (57.8%). About 19% said few,
while 14.7% said all. About 5% said none and 4.3% did not know or did not respond.
About a quarter (26%) said they were affected by the use of drugs or substances in prison.
The main reasons indicated related to the health effects of smoke (asthma, sinus irritation,
burning of eyes, headaches, and so on, or because they found it offensive).
Saint Lucia. Offenders were asked to indicate the three drugs most often used by fellow
inmates. The only illicit substance indicated by offenders as the first most important was
marijuana (38.8%), but 55% mentioned tobacco as the most important. The second most
important substances were also marijuana and tobacco. When asked how many inmates
were seen using drugs or substances in prison, the majority of offenders said many (65.5%).
About 14% said few, while 11.5% said all. About 5% said none.
About one-third of offenders (34%) said they were affected by the use of drugs or
substances in prison. The main reasons indicated related to the health effects of smoke (the
smell, second-hand smoke, affected breathing, headaches, and so on.).

Exploring the Relationship between Drugs and Crime
55
SU
MM
AR
Y
Perception of drug use by fellow inmates (Table CA9)
The general perception was that many inmates were using drugs (or seen to be using
drugs) in prison. Some 58-66% of respondents indicated that drug use was
observed—Saint Vincent and the Grenadines (65%); Saint Lucia (66%); and
Dominica (58%). A relatively low proportion reported seeing drug use in Saint Kitts
and Nevis (22%) compared to the other countries. Moderate proportions of offenders
(34%) said they were affected by the use of drugs or substances in prison.
Perception of ease of access to drugs in prison
Table CA10: Ease of access to drugs in prison
Saint
Vincent
Saint Kitts Dominica Saint
Lucia
Survey average
Easy to obtain drugs?
Overall
Easy 25.6 14.4 43.4 37.7 30.3
Difficult 59.2 45.3 50.9 49.5 51.2
Don’t know/NR 15.2 40.3 5.7 12.9 18.5
On remand
Easy 21.5 11.2 35.9 33.1 25.4
Difficult 48.4 47.2 52.8 41.0 47.4
Don’t know/NR 30.2 41.7 11.3 16.0 24.8
Convicted
Easy 27.5 16.2 45.8 42.2 32.9
Difficult 63.9 44.0 50.3 47.9 51.5
Don’t know/NR 8.5 39.8 4.0 9.8 15.5
First-time
Easy 18.1 10.8 42.0 33.4 26.1
Difficult 58.2 38.3 48.8 49.3 48.7
Don’t know/NR 23.6 51.8 9.1 16.4 25.2
Repeat
Easy 31.4 19.7 44.3 43.3 34.7
Difficult 60.2 53.3 52.1 49.8 53.9
Don’t know/NR 8.4 27.0 3.5 5.9 11.2

Exploring the Relationship between Drugs and Crime
56
Saint Vincent and the Grenadines. A quarter of all inmates felt that it was easy to obtain
drugs or substances in prison (6.4% very easy and 19.2% easy) (see Table CA10 above).
However, more than a half (59%) felt it was difficult—36.5% very difficult and 22.7%
difficult. About 15% did not respond or did not know. Repeat offenders (31.4%) were
significantly more likely to indicate that it was easy to obtain drugs in prison compared to
first-time offenders (18.1%), Χ2=21.18, p<0.01. About the same proportion of repeaters felt
it was difficult to obtain drugs compared to first timers.
With respect to offenders on remand, 22% felt it was easy to obtain drugs compared to 28%
of convicted prisoners. A significantly higher proportion of convicted offenders felt it was
difficult to obtain drugs (64% versus 48%), but four times as many offenders on remand,
compared to those convicted, did not know or did not respond.
Saint Kitts and Nevis. Less than six of every ten offenders (14.4%) felt that it was easy to
obtain drugs or substances in prison (5.1% very easy and 9.3% easy). However, three times
as many (45%) felt it was difficult—22.9% very difficult and 22.4% difficult. About 40%
did not respond or did not know. Repeat offenders (19.7%) were significantly more likely to
indicate that it was easy to obtain drugs in prison compared to first-time offenders (10.8%),
Χ2=22.87, p<0.01. However, a notably higher proportion of repeaters also felt it was
difficult to obtain drugs compared to first timers.
With respect to offenders on remand, 11% felt it was easy to obtain drugs compared to 16%
of convicted prisoners. Still comparing convicted prisoners and those on remand, about the
same proportions felt it was difficult to obtain drugs and almost equal proportions did not
know or did not respond. These differences were not statistically significant.
Dominica. More than four out of every ten offenders (43.4%) felt that it was easy to obtain
drugs or substances in prison (20.4% very easy and 23% easy). However, just about half
(50.9%) felt it was difficult—12.6% very difficult and 38.3% difficult. About 5.7% did not
respond or did not know. Repeat offenders (44.3%) were as likely to indicate that it was
easy to obtain drugs in prison as first-time offenders (42%), p>0.05. A few more repeaters
compared to first-timers felt it was difficult to obtain drugs (52% versus 49%).
With respect to offenders on remand, 36% felt it was easy to obtain drugs compared to 46%
of convicted prisoners. About the same proportions felt it was difficult to obtain drugs, but a
higher proportion of those on remand did not know or did not respond.
Saint Lucia. More than three of every ten offenders (37.7%) felt that it was easy to obtain
drugs or substances in prison (15.9% very easy and 21.8% easy). However, just about half
(49.5%) felt it was difficult—18.4% very difficult and 31.1% difficult. About 13% did not
respond or did not know. Repeat offenders (43.3%) were likely to indicate that it was easy
to obtain drugs in prison compared to first-time offenders (33%), p>0.05. The same

Exploring the Relationship between Drugs and Crime
57
proportion of repeaters compared to first-timers felt it was difficult to obtain drugs (43.3%
versus 49.3%).
With respect to offenders on remand, 33% felt it was easy to obtain drugs compared to 33%
of convicted prisoners. Slightly more convicted offenders felt it was difficult to obtain drugs
(49% versus 41%), but a higher proportion of those on remand did not know or did not
respond.
SU
MM
AR
Y
Perception of ease of access to drugs in prison (Table CA10)
Fewer than 50% of offenders in all four countries reported that drugs were easy to
obtain in prisons. However, in the case Dominica (43%) and Saint Lucia (38%),
relatively high proportions said drugs were easy to obtain, compared to Saint Kitts
and Nevis (14%) and Saint Vincent and the Grenadines (25%).
Repeat offenders in Saint Vincent and the Grenadines and Saint Kitts and Nevis
were significantly more likely to indicate that it was easy to obtain drugs in prison
compared to first-time offenders. On the other hand, offenders on remand were less
likely to indicate that drugs were easy to get in prison (this was the same pattern for
all countries with the exception of Saint Lucia, where there was no difference
between remand prisoners and convicted prisoners who felt it was easy to access
drugs).
Perception of drug use and violence in prison
For the most part, offenders did not believe that violence in prisons was related to
drugs—with the exception of Saint Vincent and the Grenadines where more than
50% of offenders felt that prison violence was in fact related to drugs.
Perception of drug use and violence in prison
Offenders were asked whether they believed that the violence that occurs within the prison
compound is related to drugs. The options given were “yes” (slightly, moderately, very
much so, and excessively so), “no” and “don’t know” (see Table CA11 below).

Exploring the Relationship between Drugs and Crime
58
Table CA11: Perception of drug use and violence in prison
Saint
Vincent
Saint
Kitts
Dominica Saint
Lucia
Survey
Average
Violence in prison related to
drugs?
Yes 53.3 11.4 32.3 32.2 32.3
No 42.0 79.0 63.0 63.0 61.8
Being in prison makes one use
drugs
Yes 41.0 19.0 39.0 49.5 37.1
No 54.0 73.0 60.0 47.0 58.5
Saint Vincent and the Grenadines. More than half (53.5%) said that they believed that the
violence that occurs within the prison compound is related to drugs: 20% indicated slightly,
9% moderately, another 20% very much so, and 5% excessively so. Some 42% said that
they did not believe violence in prison was related to drugs. Offenders were also asked
whether, in their opinion, the fact of being imprisoned makes a person use drugs. Four of
every ten (41%) said yes, 54% said no, and about 5% did not respond.
Saint Kitts and Nevis. A little more than ten percent (11.4%) said believed that the violence
that occurs within the prison compound is related to drugs: 6.5% indicated slightly, 1.5%
moderately, 2% very much so, and 1% excessively so. Some 79% said that they did not
believe violence in prison was related to drugs and 10% did not know. Offenders were also
asked whether, in their opinion, the fact of being imprisoned makes a person use drugs. Just
under one-fifth (19.1%) said “yes” and 73% said “no”. About 8% did not know.
Dominica. About one-third (32.3%) said yes—13% indicated slightly, 6.6% moderately,
and 12% very much so. Some 63% said that they did not believe that violence in prison was
related to drugs, and 4.4% did not know. Offenders were also asked whether, in their
opinion, the fact of being imprisoned makes a person use drugs. More than one-third (39%)
said yes and 60% said no. About 1% did not know.
Saint Lucia. About one-third (32.2%) said yes—16% indicated slightly, 7.3% moderately,
7.3% ‘very much so’ and 2% ‘excessively so’. Some 62% said that they did not believe that

Exploring the Relationship between Drugs and Crime
59
violence in prison was related to drugs, and 6% did not know. Offenders were also asked
whether, in their opinion, the fact of being imprisoned makes a person use drugs. Half
(49.5%) said ‘yes’ and 47% said ‘no’. About 4% did not know.
Perception of possible causes of fellow inmates’ drug use
Offenders were asked to give their opinion on what situations are possible causes that led
inmates to use drugs.
Table CA12: Possible causes of fellow inmates’ drug use
Items
Percentage responding “yes”
Saint
Vincent
Saint Kitts Dominica Saint
Lucia
Before entering prison they already used
these drugs
82.9 67.5 78.1 74.3
To escape their problems 73.0 42.1 65.0 76.0
Problems or family difficulties 52.6 29.9 55.4 54.1
To calm their nerves 82.4 47.2 67.0 77.5
To be able to sleep 60.1 23.2 45.6 53.1
Nothing else to do 52.0 25.5 59.3 57.6
To feel good 74.7 52.3 67.6 58.5
Because they like it 72.4 57.9 64.0 75.9
Peer pressure by fellow inmates 40.9 24.5 30.5 39.5
To increase their control and authority 37.9 19.4 32.0 36.1
To increase their privileges or popularity 41.4 18.9 31.3 36.8
To be accepted by their fellow inmates 51.9 26.1 36.0 41.5

Exploring the Relationship between Drugs and Crime
60
Saint Vincent and the Grenadines. 60% or more positively indicated the following:
Before entering prison, they already used these drugs (82.9%)
To calm their nerves (82.4%)
To feel good (74.7%)
Because they like it (72.4%)
To escape their problems (73.0%)
To be able to sleep (60.1%)
Saint Kitts and Nevis. 40% or more positively indicated the following situations:
Before entering prison, they already used these drugs (67.5%)
Because they like it (57.9%)
To feel good (52.3%)
To calm their nerves (44.2%)
To escape their problems (42.1%)
Dominica. 40% or more positively indicated the following situations:
Before entering prison, they already used these drugs (78%)
Because they like it (64%)
To feel good (68%)
To calm their nerves (44.2%)
To escape their problems (65%)
Problems or family difficulties (55.4%)
To be able to sleep (45.6%)
Nothing else to do (59%)
Saint Lucia. 50% or more positively indicated the following situations:
Before entering prison, they already used these drugs (74%)
To escape their problems (76%)
Problems or family difficulties (54%)
To calm their nerves (78%)
To be able to sleep (53%)
Nothing else to do (58%)
Because they like it (76%)

Exploring the Relationship between Drugs and Crime
61
3.8 Gang involvement
History of gang involvement
Table CA13: History of gang involvement and perceptions of gang activities
Items Saint
Kitts
Dominica Saint
Vincent
Saint
Lucia
Survey
Average
Are you in or have you ever been in a
gang?
14.3 23.2 29.8 40.1
26.9
Were you a member of a gang
immediately before your
imprisonment?
65.5 68.5 54.9 52.9
60.5
Was the crime related in any way to
your involvement/membership of the
gang?
20.7 24.1 37.4 29.9
28.0
Were you ever imprisoned in the past
for gang related activities?
24.1 29.6 24.0 15.6
23.3
Was drug use a part of your gang
activities before imprisonment?
46.6 77.8 68.3 52.6
61.3
Was trafficking in drugs a part of your
gang activities before imprisonment?
55.5 57.4 68.4 67.1
62.1
Upon release, how likely are you to
readily get back into gang activities?
very likely or likely
13.7 16.7 14.3 13.3
14.5
Are you aware of any gangs in prison,
either now or in the past?
60.4 20.3 43.0 50.8
43.6
Since imprisonment, has anyone
approached you to be a member of a
prison-based or outside gang?
11.7 7.0 9.8 18.9
11.9
Are you aware of any gang-related
activity that supports the drug trade?
13.7 25.2 32.9 29.0
25.2

Exploring the Relationship between Drugs and Crime
62
Saint Vincent and the Grenadines
About 30% (123/411) of all offenders reported that they were presently in a gang or had
been in a gang previously (significantly more convicted offenders (38%) compared to those
on remand (14%, p<0.01). The vast majority were males (98.4%), with only two females.
About 36% were in the 10-14 age bracket, 49% in the 15-19 age bracket and 15% in the 20
years and older age group when their gang activities started.
Of those who were involved with a gang (n=123):
54.9% were gang members immediately before incarceration;
37.4% reported that the crime for which they were presently incarcerated was
related to involvement in or membership of a gang (significantly more convicted
offenders (41%) compared to those on remand (12%, p<0.05);
24% were previously imprisoned for gang-related activities; and 68.3% reported that
drug use was part of their gang activity before imprisonment, with 68.4% indicating
that trafficking was part of their gang activities (significantly more offenders on
remand (94%) compared to convicted offenders (66%, p<0.05).
Some 86% of these offenders felt that it was not likely that they would readily
resume gang activities after release. However, 14.3% felt that it was likely (11.6%
very likely and 2.7% likely);
Gangs in prison. About 43% (173/324) of all offenders said that they were aware of gangs
in prison (whether presently or in the past), and 9.8% said that since incarceration they had
been approached by a member of a prison-based or outside gang (significantly more
convicted offenders (12%) compared to those on remand (6%, p<0.05).
Gang activities and the drug trade. A relatively high proportion of offenders overall
(32.9% or about one-third), said they were aware of gang-related activities that support the
drug trade (significantly more convicted offenders (40%) compared to those on remand
(22%, p<0.01).
Saint Kitts and Nevis
About 14% (46/324) of all offenders reported that they were presently in a gang or had been
in a gang previously. These were all males, and 40.8% were under the age of 15, 48% were
aged 15-19, and 11.2% were aged 20 or older when their gang activities started.
Of those who were involved with a gang:
65% were gang members immediately before incarceration, with 62% of those on
remand compared to 66% of those convicted;

Exploring the Relationship between Drugs and Crime
63
21% reported that the crime for which they were presently incarcerated was related
to involvement in or membership of a gang—convicted prisoners (23%) compared to
those on remand (19%);
24% were previously imprisoned for gang-related activities—convicted (39%)
compared to those on remand (19%);
47% indicated that drug use was part of their gang activity before imprisonment--
62% of those on remand compared to 38% of those convicted;
56% indicating that trafficking was part of their gang activities--50% of those on
remand compared to 51% of those convicted);
Some 86% of these offenders felt that it was not likely that they would readily return
to gang activities after release. However, 14% felt that it was likely--29% of those
on remand compared to 9% of those convicted).
Gangs in prison. Six of every ten (60%) of all offenders said that they were aware of gangs
in prison, whether now or in the past—47% of those on remand compared to 67% of those
convicted. About 12% said that since incarceration, they had been approached to be a
member of a prison-based or outside gang--12% of those on remand compared to 12% of
those convicted.
Gangs activities and the drug trade - About one in seven offenders overall (14%) said
they were aware of gang-related activities that support the drug trade--15% of those on
remand compared to 13% of those convicted.
Dominica
About 23% (54/233) of all offenders indicated that they were presently in a gang or had
been in a gang previously. These were mostly all males (one female), and 48% were under
the age of 15, 42% were aged 15-19 and 9.4% were 20 or older when their gang activities
started.
Of those who were involved with gangs:
69% were gang members immediately before incarceration--62% of those on remand
compared to 71% of those convicted;
24% reported that the crime for which they were presently incarcerated was related
to involvement in or membership of a gang --23% of those on remand compared to
24% of those convicted;
30% were previously imprisoned for gang-related activities --21% of those on
remand compared to 39% of those convicted;
78% reported that drug use was part of their gang activity before imprisonment--68%
of those on remand compared to 81% of those convicted;

Exploring the Relationship between Drugs and Crime
64
57% indicating that trafficking was part of their gang activities--46% of those on
remand compared to 61% of those convicted;
Some 80% of these offenders felt that it was not likely that they would readily return
to gang activities after release. However, 16.7% felt that it was likely (7.4% very
likely and 9.3% somewhat likely), --8% of those on remand compared to 20% of
those convicted;
Gangs in prison. About 20.3% of all offenders said that they were aware of gangs in prison,
whether now or in the past--15% of those on remand compared to 22% of those convicted.
About 7% said that since incarceration they have been approached to be a member of a
prison-based or outside gang --2% of those on remand compared to 9% of those convicted.
Gang activities and the drug trade. About a quarter of all offenders overall (25.2%), said
they were aware of gang-related activities that support the drug trade --20% of those on
remand compared to 27% of those convicted.
Saint Lucia
About 40% of all offenders indicated that they were presently in a gang or had been in a
gang previously—these were all males; and 54% of those on remand compared to 46% of
those convicted (see Table CA13 above). About 47% were 14 or younger, 47% were aged
15-19 and 13% were 20 or older when their gang activities started.
Of those who were involved with a gang:
53% were gang members immediately before incarceration --48% of those on
remand compared to 59% of those convicted;
30% indicated that the crime for which they were presently incarcerated was related
to involvement in or membership of a gang—those convicted (44%) were
significantly more likely to indicate this compared to those on remand (17.5%),
p<0.05;
16% were previously imprisoned for gang-related activities—again, those convicted
(22%) were significantly more likely to indicate this compared to those on remand
(10%), p<0.05;
53% indicated that drug use was part of their gang activity before imprisonment--
50% of those on remand compared to 56% of those convicted;
67% indicating that trafficking was part of their gang activities--68% of those on
remand compared to 67% of those convicted);
Some 87% of these offenders felt that it was not likely that they would readily return
to gang activities after release. However, 13% felt that it was likely--16% of those
on remand compared to 10% of those convicted).

Exploring the Relationship between Drugs and Crime
65
Gangs in prison. About half (51%) of all offenders said that they were aware of gangs in
prison, whether now or in the past—49% of those on remand compared to 53% of those
convicted. About 19% said that since incarceration, they had been approached to be a
member of a prison-based or outside gang--17% of those on remand compared to 22% of
those convicted.
Gang activities and the drug trade - About one in three offenders overall (29%), said they
were aware of gang-related activities that support the drug trade--28% of those on remand
compared to 30% of those convicted.
SU
MM
AR
Y
Gang involvement (Table CA13)
Fewer than 25% of offenders in Saint Vincent and the Grenadines and Saint Kitts
and Nevis reported that they had ever been involved in a gang. However, in
Dominica (30%) and Saint Lucia (40%), a notably large proportion indicated that
they had. A moderately high proportion of offenders in all four countries indicated
that the crime for which they were presently incarcerated was related to involvement
in or membership of a gang—21% in Saint Vincent and the Grenadines, 23% in
Saint Kitts and Nevis, 37% in Dominica and 30% in Saint Lucia.
Small, but notable, proportions in all countries (13-18%) indicated that it was likely
that they would readily resume gang activities upon release.

Exploring the Relationship between Drugs and Crime
66
CHAPTER 4
DISCUSSION, CONCLUSION AND POLICY IMPLICATIONS
4.1 Discussion
This four-country study has made a significant contribution towards furthering our
understanding of the link between drugs and crime. The results of this survey indicate that
adult offenders (males and females combined) in detention reported significant offending
profiles, engaging in almost all of the offense categorizations with the exception of
malicious damage. Interestingly, few offenders were charged with or had been convicted of
drug offenses as indicated in the categorization. This might be explained in the context of
the present practice that imposes a relatively small fine for possession of drugs for personal
use. It is only in the cases of more serious drug offenses, such as possession with intent to
supply or trafficking that a custodial sentence is imposed.
More in-depth analysis and reporting is needed on the fact that quite a few inmates reported
that the crime for which they had been sentenced was linked to drug trafficking, or the
production (supposedly the cultivation of marijuana) or selling of drugs.
Offenders who had already served a custodial sentence or had been previously charged with
a crime were as likely to report another episode of offending, especially physical assault,
robbery and stealing, as those who were in detention for the first time. Significant
proportions of offenders were repeat offenders, especially in the case of Dominica and St.
Vincent. This might speak either to the lack of appropriate rehabilitative programs in the
prison system, or to the fact that criminal offending might be contextualized in the form of a
subculture in pockets of the general population.
An important finding in this study is related to the age of first offense among the
incarcerated populations. The mean age of first offending across the four countries suggests
that young males under the age of 25 years are at increased risk of criminal offending. For
females, it was a little older for all countries except one. Significant importance must be
placed on this finding for the purposes of overall public policies to reduce criminal
offending, and to introduce programs that speak to a culture of lawfulness for the school-
aged population.
In terms of substance use, almost all offenders reported having ‘ever used’ marijuana (>70%
in all countries) or alcohol (>59%), and about five percent to as much as 26% reported crack
cocaine use. Marijuana use was predominantly high, which speaks to the growing cultural
acceptance of marijuana use among Caribbean populations. Marijuana is easy to obtain,
even inside prison, as reported in this study (more than 50% of inmates in three countries

Exploring the Relationship between Drugs and Crime
67
reported that they had seen other inmates use drugs (most likely marijuana), and 15-40% of
inmates reported that drugs are easy to obtain in prison).
Of equal significance was the age of first drug use reported by offenders. Like the general
population findings of many household surveys in the Caribbean, the age of first use of
marijuana especially mirrors that of alcohol, and in all cases among this population of
offenders, it was even younger than the age of first use of alcohol.
The links between drugs and crime were measured in a number of ways in this study, and
the results suggest that:
A notable proportion of offenders reported that the crime they had committed had
some kind of direct relationship with drugs.
The relationship between being imprisoned and using drugs for the first time was
weak: the majority of offenders did not begin drug use after their first offense, and
most drug use had already taken place prior to incarceration.
However, of those who indicated that there was a link between drugs and their crime,
half of the convicted offenders in Saint Vincent and the Grenadines and Saint Kitts
and Nevis, as well as 40% in St. Lucia and 29% in Dominica reported being
intoxicated (either drunk on alcohol or high on drugs) at the time of committing the
offense(s) for which they were then in detention.
This study provided valuable information for analysis of the economic-compulsive model by
asking the specific question: “Was this crime committed to obtain or while trying to obtain
drugs for your personal use?” More than one-third of those offenders who indicated that
there was a link between drugs and their crime indicated that they had committed the offense
in order to obtain drugs for their personal use.
Another factor that emerged as important for identifying offenders at a high risk of serious
offending and drug use was gang involvement. Gang membership was very prevalent,
ranging from 14% in Saint Kitts and Nevis to as high as 40% in Saint Lucia. Even more
important is the fact that 53-68% of those with a history of gang involvement were members
immediately before being incarcerated. Other indicators of the importance of this gang
involvement and criminal offending are the finding that the crime was related in some way
to gang membership, and that drug activities (trafficking) were reported as part of previous
gang activities. This finding, like the age of first offending, speaks to the need for early
intervention.
The findings of this study highlight the importance of early intervention programs for
breaking the cycle of drugs and crime. These interventions should target not only the
criminogenic behaviors of offenders, but also the environmental circumstances that may
give rise to such activities. The role of the family emerges as a cornerstone for the

Exploring the Relationship between Drugs and Crime
68
transmission of pro-social behaviors. In the first instance, interventions should aim to reduce
the prevalence of parental drug use, childhood and adolescent drug use and abuse, and
influences/encouragement from family members for early drug use and criminal offending.
There is need for countries to provide adequate support services for juvenile and adult
offenders who do find themselves in such situations.
This Caribbean prison study report highlights the ‘temporal development’ of drug use and
criminal careers, as well as the risk factors that appear to hasten its progression. Identifying
juveniles/ young adolescents, and older adolescents at risk, preferably through a matrix of
indicators, is essential for proper targeting of early intervention initiatives. Such a course
would require investment in screening and assessment, and greater cooperation among key
government agencies where a coordinated effort is likely to be most effective.
4.2 Conclusions
The mere fact that crimes are committed by drug users is not a sufficient condition for us to
say that drug use does cause crime or vice versa. It is more likely that drug use intensifies
and perpetuates the commission of criminal offenses. Drug use is only one factor among a
group of variables that may account for criminal behavior; other variables include
physiological, psychological and behavioral, family, cultural, social, economic and
situational factors. The research does confirm that a number of links can be established
between illicit drug use and crime but that those links are not necessarily causal in nature
and more closely resemble variables in the complex relationship between drugs and crime.
There is sufficient evidence from the findings of this study to engage policymakers in a
discussion about the clear (statistical) relationships between cocaine/crack cocaine use and
repeat offending; cocaine/crack use and stealing and robbery; alcohol use and physical
assault; early initiation of drug use (especially marijuana use) and its role in criminal
offending, as well as the relatively high rate of criminal recidivism reported in all countries.
It is recommended that every country that participated in this study begin such a dialogue.
4.3 Policy implications
The relationship between drugs and crime is not as easy to understand as some claim. The
triangular relationship between a person, a product and a behavior is complex and cannot be
defined in a simple formula, no matter how appealing. The consequences of this
observation for drug intervention and policy development are considerable. An approach
that fails to treat all factors contributing to drug use and crime, or that attributes a causal role
exclusively to drug use would inevitably result in the implementation of policies that are
ineffective.

Exploring the Relationship between Drugs and Crime
69
4.4 Recommendations
Drug prevention and treatment programs
1. It is important that effective long-term drug treatment programs be established in the
prisons. Research has shown that drug abuse treatment can help drug abusing
offenders change their attitudes, beliefs, and behaviors towards drug abuse, avoid
relapse, and successfully remove themselves from a life of substance abuse and
crime. Studies report that treatment can cut drug abuse in half, reduce criminal
activity up to 80% and reduce arrest up to 60%
2. As important as treatment programs during incarceration are, it is also essential that
treatment be continued in the community, with programs such as relapse prevention.
Continued drug abuse treatment helps the recently released offender deal with
problems found at re-entry, such as learning to handle situations that could lead to
relapse; learning how to live drug-free in the community; and developing a drug-free
peer support network. Treatment in prison can begin a process of therapeutic change,
resulting in reduced drug use and criminal behavior post-incarceration. Continuing
drug treatment in the community is essential to sustaining these gains.
3. The implementation of prevention programs to alert the prison population of the
dangers of drug abuse should be considered as part of the overall drug prevention
intervention.
4. Establishing a more efficient program of mandatory urine testing for drugs, carried
out on a sample of the prison population at regular intervals and at first admission to
prison. Urine testing can estimate the extent of drug-taking and serve as a means of
deterring inmates from using drugs. At the same time, the Prison Service may
recognize the need to balance the drug testing program with treatment and
counseling for prisoners who wanted help in addressing their drug use. Policy would
therefore call for the integration of mandatory drug testing into a comprehensive
drug strategy encompassing treatment and counseling, detoxification, broader health
issues, and links between the prison and the local community. Internal policies
should be developed to ensure that drug testing becomes more rigorous and
respected.
Security
5. It is recommended that strict security measures be enforced to ensure that drugs and
alcohol are not smuggled into the prisons. It is also recommended that a standardized
campaign (probably in the form of an information booklet for Caribbean prison
systems) be developed for inmates’ families to educate them about drug use and its

Exploring the Relationship between Drugs and Crime
70
effects and also informing them about the penalties for possession with intent to
supply.
Prison staff/officers
6. Prison staff must understand that creating a drug-free environment among inmates
will help with the prevention programs, education classes, counseling and
rehabilitation, and facilitate the inmates’ recovery and return to the community.
Stringent measures and surveillance should be in place in order to avoid involvement
by the staff in the drug market in the prisons. Education about drugs and their
consequences may be a most viable alternative that can be offered to staff.
Public policy
7. Very early intervention programs should be developed to encourage culture of
lawfulness and similar programs among the school-age population. It is important
that every effort be made to engage students before they leave the school system to
inform and educate them about the need for them to be law-abiding citizens.
8. A major regional effort in the form of a task force should be appointed to facilitate a
comprehensive study on gangs and their role in criminal offending, the drug market
and drug use and abuse in the Caribbean.

Exploring the Relationship between Drugs and Crime
71
References
Bureau of Justice (BJS) (2000): Drug Use, Testing and Treatment in Jails. Washington: US
Department of Justice, Office of Justice Programs. NCJ, 179999. U.S.A.
Collins, D.J. and Lapsley, H.M. (2002), Counting the cost: estimates of the social costs of drug abuse
in Australia in 1998–9, National Drug Strategy Monograph Series No. 49.
Cited by Lyne Casavant and Chantal Collin (2001) in Illegal Drug Use And Crime: A Complex
Relationship. Prepared For The Senate Special Committee On Illegal Drugs, Library of Parliament.
Criminal justice 2000 The nature of crime: Continuity and change (pp. 151–218). Washington, DC:
U.S. Department of Justice.
Dillon, L. (2001) Drug use among prisoners: An exploratory study. Dublin: Health Research Board.
Drug abuse among the adult prison population suspected and sentenced in prisons of Americas, the
relationship between their criminal acts and the treatment needs arising from their drug use: a
methodological research proposal. Inter-American Drug Abuse Control Commission, Organization
of American States (CICAD/OAS), March 2007.
Karberg, J.C. and James, D.J. (2005). Substance dependence, abuse, and treatment of jail inmates,
2002. Washington, DC: U.S. Department of Justice, Office of Justice Programs, Bureau of Justice
Statistics. U.S.A.
Lyne Casavant and Chantal Collin (2001) Illegal Drug Use and Crime: A Complex Relationship.
Prepared For The Senate Special Committee On Illegal Drugs, Library of Parliament.
Ministry of National Security. “National Anti-Drug Master Plan” 2000. Government of Saint Kitts
and Nevis
Paul J Goldstein. "The Drugs/Violence Nexus: A Tripartite Conceptual Framework." Journal of
Drug Issues v. 39 (1985): 143-174
Pernanen, K.; Cousineau, M.; Brochu, S.; Sun, F. (2002) Proportions of Crimes associated with
Alcohol and Other Drugs in Canada. Canada: Canadian Centre on Substance Abuse.
United Nations Office on Drugs and Crime and World Bank. Crime, Violence, and Development:
Costs and Policy Options in the Caribbean March 2007.
White, H. R., & Gorman, D. M. (2000). Dynamics of the drug-crime relationship. In G. LaFree (Ed.)

Exploring the Relationship between Drugs and Crime
72
Appendices: Detailed Country Results

Exploring the Relationship between Drugs and Crime
73
Appendix 1: Saint Vincent and the Grenadines
Section 1
Demographics

Table SVG1a: Characteristics of the study population (St. Vincent and the
Grenadines)
Note: * Other = Syrian/Lebanese, Chinese, Portuguese, and other
Age (years) Ethnic Origin (which race)
16-24 128(31.1) Black/African 317 (77.0)
25-35 142(34.5) White/Caucasian 5(1.1)
36-45 98(23.9) East Indian 12(2.9)
46-54 32(7.9) Mixed race 59(14.3)
55 -65 11(2.6) Indigenous 17(4.0)
Mean age (yrs.) 32.26 Other* 2(0.6)
Median age (yrs.) 30.0
Age range (yrs.) 46 Employment (pre-imprisonment)
Age (min-max) (yrs.) 18-64 Unemployed 36(8.8)
Part-time employee 69(16.7)
Gender Full-time employee 214(52.1)
Male 399(97.1 Informal activity (self-employed) 85(20.7)
Female 12(2.9) Other 7(1.7)
Status Trade or profession
Convicted 285(69.4) Professional 5(1.2)
On remand 126(30.6) Technician 26(6.4)
Clerical support -
Union Status Services and sales 11(12.8)
Single 319(77.7) Skilled (Agric., Forestry,
Fishery)
26(6.4)
Married 13(3.1) Craft and related trade 93(22.7)
Widowed 6(1.4) Plant and machine operator 19(4.6)
)) Divorced 5(1.1) Elementary occupation 19(4.6)
Common law 59(14.3) Other 148(36.2)
Separated 7(1.7) None 61(15.00
Visiting relationship -
Don’t know 2(0.6) In-prison activity
School/knowledge programs 12(2.90)
Education (Schooling) Computer 4(1.1)
None 7(1.7) Bakery 12(2.9)
92.9 Incomplete primary 94(22.8) Cooking 13(3.1)
Complete primary 89(21.7) Tailoring 9(2.3)
Incomplete secondary 152(37.0) Welding 71.7
Complete secondary 43(10.4) Sewing 1(0.2)
Incomplete university 5(1.2) Farming 7(1.7)
Complete university - Cleaning 34(8.2)
Tech., Voc., Com.
College
21(5.2) Teaching 7(1.7)
Administrative -
Which country born Construction/carpentry 24(5.7)
St. Vincent national 336(89.1) Arts and craft 14(3.4)
Other nationality 45(10.9) Other 24(5.7) None 244(59.3)

Exploring the Relationship between Drugs and Crime
75
Age
The mean age of offenders overall was 32 years and the median age was 30. The ages of
offenders ranged from 18 to 64 years, for a range of 46 years. There were no teen juvenile
offenders in the study population. About one-third (31%) of all offenders were 24 years or
younger and 75% were 39 years and under. By age groupings, Table SVG1a and Fig. SVG1
show that most offenders were in three age brackets: 16-24 (31%), 25-35 (35%) and 36-45
(24%). Eight percent were in the 46-54 age group, and three percent were in the 55-65 age
bracket (the oldest age cohort).
Source: Saint Vincent and the Grenadines
Gender and age group
The majority of offenders were males (97.1%) and only 2.9% were females. One-third of all
male offenders were in the 16-24 age bracket (31.6%) or the 25-35 age group (34.5%), table
1b, followed by the 36-45 age group, with 24.4%. Only about 10% of male offenders were
older than 45 years. In comparison, one third of female offenders were in the 25-35 age
group and in the 46-54 age bracket. About 17% were in the youngest age grouping, 16-24
years.

Exploring the Relationship between Drugs and Crime
76
Table SVG1b: Percentage Distribution: Age group, gender and status
Age Group Male Female On remand Convicted
16-24 31.6 16.7 32.6 30.5
25-35 34.5 33.3 36.2 33.8
36-45 24.4 8.3 20.0 25.6
46-54 7.1 33.3 7.4 8.1
55-65 2.4 8.3 3.8 2.0
Source: Saint Vincent and the Grenadines
Status of offenders
More than two-thirds of the population was convicted prisoners (69.4%) while 30.6% were
on remand (Table SVG1b). A similar pattern was observed for males, with 69.7% convicted
prisoners, and 30.3% on remand; for females, the pattern was dissimilar: 58.3% were
convicted and 41.7% were on remand.
Age group and status
More than two–thirds (68.8%) of all offenders on remand were in the two youngest age
groupings, with one-fifth (20%) in the 36-45 age bracket. The same pattern was observed for
convicted offenders, where 64.3% were in the two youngest age groupings and a quarter
(25.6%) in the 36-45 age group.

Exploring the Relationship between Drugs and Crime
77
Source: Saint Vincent and the Grenadines
Union Status
The majority of prisoners were single (77.7%), while 3% were married and 4.2% were
widowed, divorced, or separated. About 14% were living in common-law relationships (see
Fig. SVG3 below).
Source: Saint Vincent and the Grenadines
Education
A very small proportion of offenders (1.7%) had no schooling; 21.7% had completed only
the primary level of education (22.8% had not completed primary school); and 10.4% had
completed secondary level (37% had not completed secondary school) (see Fig. SVG4
below). A small proportion had completed technical or community college (5.2%), and
1.2% had not completed university level. This translates to about 15% having completed
secondary level or higher and some 60% having not completed primary or secondary
schooling at time of incarceration.

Exploring the Relationship between Drugs and Crime
78
Source: Saint Vincent and the Grenadines
Ethnicity and nationality
Most prisoners were of African origin (77% or a little more than three-quarters), followed by
“mixed” race (14.3%), indigenous (4%), East Indians (2.9%) and Caucasians (1.1%), with
“other” accounting for less than 1%. The majority of offenders were nationals of Saint
Vincent and the Grenadines (89% or about nine of every ten). About 11% were nationals of
other countries (9.3%) (see Table SVG1a above).
Pre-incarceration employment status (Fig. SVG5 and Table SVG1c)
Offenders overall were asked to state their pre-incarceration work situation. Most reported
full time employment (52%), while 17% were in part-time employment and another 9%
were unemployed. About one-fifth, or 21%, were self-employed.
Convicted prisoners were asked to indicate their employment status prior to being
incarcerated. About half (50.7%) of the offenders were in full-time employment before they
were arrested and 16% were employed part-time. About 10% were unemployed and a
further 21.8% were involved in informal activities (self-employed). A small portion (about
1.7%) was in some “other” employment at time of incarceration.

Exploring the Relationship between Drugs and Crime
79
Source: Saint Vincent and the Grenadines
Table SVG1c also shows the pre-incarceration employment status of offenders on remand.
Slightly more than half (54%) were in full-time employment, and 18% were employed part-
time. About 6.4% were unemployed and a further 17.7% were involved in informal
activities (self-employed). As shown in table SVG1c, whether on remand or convicted, the
pre-incarceration employment status was quite similar.
Table SVG1c: Employment (pre-incarceration) status
Employment status On remand Convicted
Unemployed 8(6.4) 28(9.8)
Part-time 23(17.7) 46(16.1)
Full-time 70(54.3) 145(50.7)
Informal-activity 23(17.7) 62(21.8)
Other 2(0.6) 5(1.7)
Source: Saint Vincent and the Grenadines
Income
Half of all offenders reported a monthly income of XCD$1000 or more before they were
incarcerated, 7% were not earning a monthly income and most all others reported an income
of less than XCD$1000 a month (see Table SVG1d).

Exploring the Relationship between Drugs and Crime
80
Table SVG1d: Income
Amount of income before incarceration and during imprisonment
Income (XCD$) Monthly
income before
incarceration
Current
monthly family
income
Less than XCD$ 500 2(4.9) 2(0.8)
Between XCD$ 500 and less than XCD$
600
39(9.5) 2(0.8)
Between XCD$ 600 and less than XCD$
700
8(2.0) 2(0.8)
Between XCD$ 700 and less than XCD$
800
19(4.5) 2(0.8)
Between XCD$ 800 and less than XCD$
900
30(7.2) 2(0.8)
Between XCD$ 900 and less than XCD$
1000
45(11.0) 9(3.1)
XCD$ 1000 or more 208(50.5) 52(16.9)
Does not know 13(3.1) 236(76.2)
None 30(7.1) -
Source: Saint Vincent and the Grenadines
Offenders were also asked: “How much money did you earn last month for activity carried
out while in prison?” Most replied that they did not earn anything for their activities (76%)
or 126 of the 163 offenders responding to this question. A small proportion (6/163) or 4.5%
earned $4,500 or more, while 65 earned between $100 and $375, with the remainder earning
under $100 (12.4%).
Other demographics
Religion. Sixty-three percent of offenders (258/411) said that they practiced a religion,
while 37.2% did not. Most offenders were Seventh Day Adventist (20.5%); Pentecostal
(16.8%); Roman Catholic (12%); or Rastafarian (10%).

Exploring the Relationship between Drugs and Crime
81
Children and family. Offenders were asked whether they had any children. 60.8%
(250/411) said yes and 39.2% said no. Of those indicating that they had children, 81%
reported that they had male children while 72% said they had female children.
The age of the youngest child among the offenders ranged between 0 and 31 years with the
mean age being 8 years ± 6.63 years. For the eldest child, the ages ranged between 3 and 40
years with a mean of 15 years ±8.57 years.
Contact with family members (Table SVG1e below)
Seventy-five percent of offenders reported that they kept in touch with their family while
25% did not (table1e). Convicted prisoners were significantly more likely to keep in contact
with family members compared to those on remand (77.9% versus 68.3%), = 4.32, p <
0.05. However, there was no significant difference between males and females with respect
to keeping in contact with family members (p>0.05).
Table SVG1e: Offenders’ contact with family members
In touch
with
family?
Male Female
On remand Convicted
Yes 299 (74.9) 9 (75.0) 86(68.3) 222(77.9)
No 100 (25.1) 3(25.0) 40(31.7) 63(22.1)
Source: Saint Vincent and the Grenadines

Exploring the Relationship between Drugs and Crime
82
Saint Vincent and the Grenadines
Section 2
Criminal history and criminal offending

Exploring the Relationship between Drugs and Crime
83
Criminal offending
Table SVG2a: Offense types (current sentence and previous offense)
Offense category Current
sentence
Previous
offense
Sexual offense 26 (6.3) 2 (1.1)
Physical assault 50 (12.0) 45 (21.2)
Stealing 49 (12.0) 24 (11.2)
Malicious damage 5 (1.1) 7 (3.4)
Capital crimes 45 (11.1) 10 (4.5)
Drug crimes 46 (11.1) 50 (23.4)
Other 43 (10.3) 50 (23.4)
Don’t know 7 (1.7) -
Source: Saint Vincent and the Grenadines
We see from Table SVG2a above that the offenses most often reported by convicted
prisoners were, in rank order, physical assault and stealing (about one in eight prisoners or
12% each); capital crimes and drug crimes (11% each); followed by other crimes (10%); and
sexual offenses and malicious damage reported by 6% or less.
For offenders who reported previous offenses (n=212 ), the offenses most often reported
were drug crimes and other crimes (23% each), followed by physical assault (about one-fifth
of offenders or 21%), stealing and robbery (11% each) and capital crimes, malicious damage
and sexual offenses, reported by less than 5% of offenders (see Table SVG2b and Fig.
SVG6 below).
Female offenders were more likely to have been sentenced for capital crimes or stealing,
while males were more likely to have been convicted of physical assault, drug crimes,
stealing, capital crimes and other offenses.
Repeat offending
Table SVG2b: Repeat offense by status
Is this your first sentence? Convicted Remand Overall
Yes (first-time offender) 121/285
(42.3)
62/126(49.3) 229/411 (44.4)
No (repeat offender) 165/285(57.7) 64/126(50.7) 183/411 (55.6)
Source: Saint Vincent and the Grenadines

Exploring the Relationship between Drugs and Crime
84
More than half of all offenders were repeat offenders (55.6%). 57.7% of convicted prisoners
indicate that this was not the first time they had been sentenced. Similarly, 50.7% of those
on remand indicated that they had been sentenced before.
Source: Saint Vincent and the Grenadines
Frequency of imprisonment (overall) n=229
The mean number of times imprisoned was 4.57 ± 4.29 with a median of 4.0 times. The
number of times imprisoned ranged from 1-31 times among this group of repeat offenders.
Most persons had been imprisoned between 2-4 times (69%). However, about one-fifth
(20%) had been imprisoned six or more times.
Criminal history and demographic variables (Table SVG2c)
Percentage previously imprisoned (remand versus convicted) and demographic variable
Overall. Some 50.8% of offenders on remand and 57.7% of those convicted reported a
previous incarceration. Age. 44-48% of offenders in the three lowest age brackets (16-45)
had repeat sentences. Alarmingly, some 78% of those aged 46-54 who were on remand and
all those over the age of 54 also had repeat sentences. For convicted offenders, 79% of
those aged 25-35 and 62% of those aged 36-45 had repeat sentences.
Gender. More than twice as many males (52%) on remand had previous sentences
compared to females (20%). A similar pattern is seen for those convicted (more than half of
males (58.4%) compared to 28.6% of females.
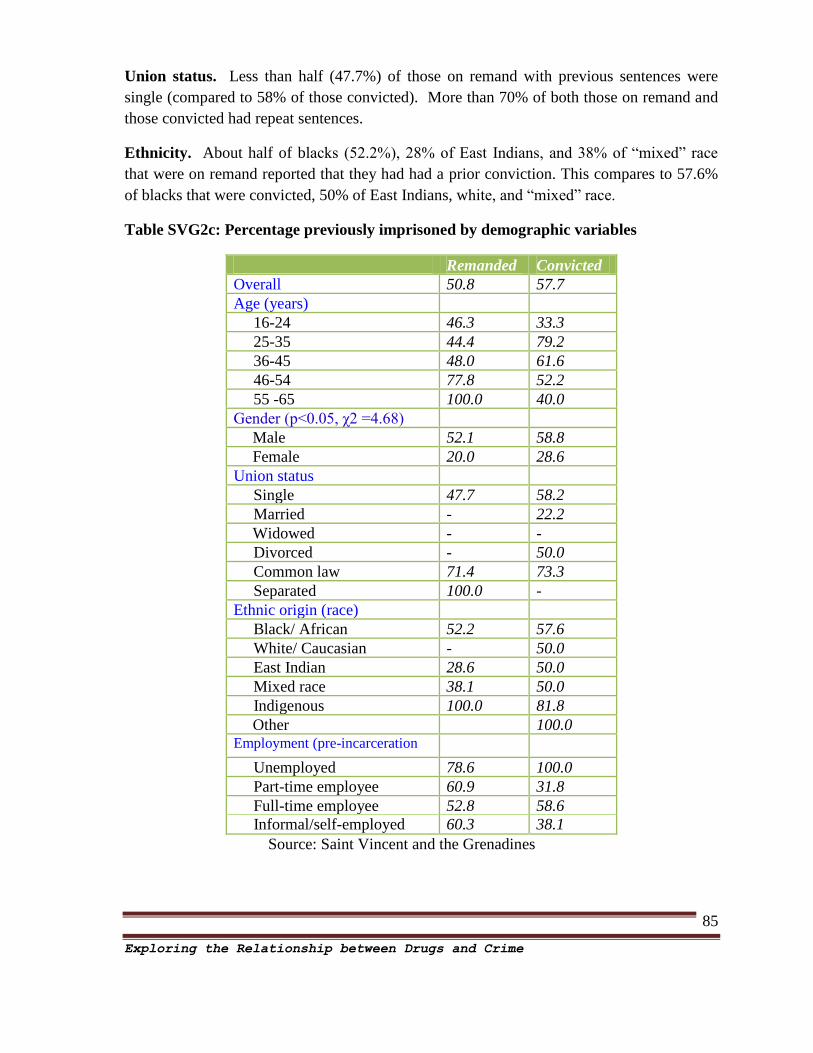
Exploring the Relationship between Drugs and Crime
85
Union status. Less than half (47.7%) of those on remand with previous sentences were
single (compared to 58% of those convicted). More than 70% of both those on remand and
those convicted had repeat sentences.
Ethnicity. About half of blacks (52.2%), 28% of East Indians, and 38% of “mixed” race
that were on remand reported that they had had a prior conviction. This compares to 57.6%
of blacks that were convicted, 50% of East Indians, white, and “mixed” race.
Table SVG2c: Percentage previously imprisoned by demographic variables
Remanded Convicted
Overall 50.8 57.7
Age (years)
16-24 46.3 33.3
25-35 44.4 79.2
36-45 48.0 61.6
46-54 77.8 52.2
55 -65 100.0 40.0
Gender (p<0.05, χ2 =4.68)
Male 52.1 58.8
Female 20.0 28.6
Union status
Single 47.7 58.2
Married - 22.2
Widowed - -
Divorced - 50.0
Common law 71.4 73.3
Separated 100.0 -
Ethnic origin (race)
Black/ African 52.2 57.6
White/ Caucasian - 50.0
East Indian 28.6 50.0
Mixed race 38.1 50.0
Indigenous 100.0 81.8
Other 100.0 Employment (pre-incarceration
Unemployed 78.6 100.0
Part-time employee 60.9 31.8
Full-time employee 52.8 58.6
Informal/self-employed 60.3 38.1
Source: Saint Vincent and the Grenadines

Exploring the Relationship between Drugs and Crime
86
Length of incarceration
Table SVG2d shows the length of time offenders were on remand, as well as the total length
of sentence for those convicted (mean and median data). For those on remand, the mean
length of time they had served in prison so far was 19.5 months, with a median of 9 months.
About 25% of these offenders were on remand for longer than 24 months.
Convicted offenders were asked the total length of their sentence. The mean length of
sentence reported was 29.6 months, with a median of 36 months. About one-third had a
sentence of 60 months (5 years) or more.
Table SVG2d: Length of incarceration
How long on Remand
(months)
Months Total length of sentence
(convicted)
Months
Mean 19.54 Mean 59.64
Standard deviation 25.25 Standard deviation 65.18
Median 9.0 Median 36.0
Mode 5 Mode 6
Range 0-120 Range 2-288
About a quarter were on remand for
longer than 2 years
About one-third had a sentence of 60
months (5 years) or more
Source: Saint Vincent and the Grenadines
Age of first offense
The mean age of first offense indicated was 23 years. The median age was 21 years and the
ages of first offense ranged from 10-54 years. About 26% of offenders had offended before
the age of 18 years, while 75% had offended by age 26 years.
Table SVG2e: Comparison of age of first offense with gender and status
Mean and Std. Dev.
(yrs.) Overall 23.3 ± 8.62
Gender (p<0.01)
Male 23.1 ± 8.38
Female 31.6 ± 12.21
Status (p>0.05)
Remand 23.8 ± 8.58
Convicted 23.1 ± 8.65
Type of Offending
(p<0.01)
First-time offender 26.92 ± 9.19
Repeat offender 20.62 ± 7.03
Source: Saint Vincent and the Grenadines

Exploring the Relationship between Drugs and Crime
87
Males were significantly more likely to offend at an earlier age (23 years) than females (31
years), p<0.01. However, there was no significant difference in the age of first offense
between prisoners on remand (23 years) and convicted prisoners (also 23 years), p>0.05 –
ANOVA test.
Other previous offenses (charged or convicted)
Some 51.6% of offenders (52.4% of males and 25% of females) reported previous offenses
for which they had been either charged or convicted. About 13% (29/219) of offenders who
were charged or convicted for previous offenses were held in a Youth Detention Center
(YDC) because they were a minors at the time of offending. These 29 offenders were all
males.
Of the 29 offenders, 45% had been sent to the Youth Detention Centre once; 16.7% twice;
25% three times, and 16.8% more than three times. The overall mean number of times sent
to YDC was 2.8 with a median of 2 times and ranged from 1-9 times.
Family members and criminal activities
Offenders were asked if they had any family members engaged in criminal activities (Fig.
SVG7 below). Slightly more than one-third of all offenders (34.4%) indicated that they had
family members who are or were involved in criminal activities: 34.4% of males compared
to 33.3% of females, and 19.8% on remand compared to 41.8% convicted.
Source: Saint Vincent and the Grenadines
For the most part, brothers (11.5%), uncles (12.1%), father (5.8%) and some other family
member (9.7%) were the family members primarily reported (Table SVG2f and Fig. SVG8
below). A mother was indicated by 3% of offenders and an aunt, and grandparents by less
than one percent of offenders.

Exploring the Relationship between Drugs and Crime
88
Offense category for family members
Table SVG2f: Percentage of family members in criminal activities by offense category
Offense Category Father Mother Brother Uncle Aunt
Sexual offense - - - - -
Physical assault - 18.4 35.0 9.5 -
Robbery 9.1 - 5.0 9.5 -
Stealing 18.1 - 25.1 - -
Malicious damage - 18.4 - 4.8 -
Capital crimes 37.2 7.8 5.0 19.0 70.2
Drug crimes 9.1 37.1 14.9 19.0 29.8
Other 18.3 - 10.1 23.9 -
Source: Saint Vincent and the Grenadines
Table SVG2f shows the percentage of family members involved in criminal activities by
offense categories. The indicated offenses in rank order for each family member involved
were:
Fathers were involved mostly in capital crimes, stealing, other offenses, robbery and
drug crimes;
Mothers were involved in drug crimes, malicious damage and physical assault;
Brothers were involved in physical assault, stealing, drug crimes, other offenses,
robbery and capital crimes;
Uncles were involved in other crimes, drug crimes, capital crimes, physical assault
and robbery;
Aunts were involved in capital crimes and drug crimes.
Figure SVG8: Family Members and
Criminal Activities
father
mother
brother
uncle
aunt
other
grandparent

Exploring the Relationship between Drugs and Crime
89
Frequency of offending by family members (Fig. SVG9)
When asked about the frequency with which family members offend, most offenders
(48.9%) said less than once per year. Most others said once per year (26.4%), or indicated
that they did not know (16.5%).
Source: Saint Vincent and the Grenadines
Exploring the Relationship between Drugs and Crime
90
Saint Vincent and the Grenadines
Section 3
Drug use

Exploring the Relationship between Drugs and Crime
91
Drug use
Table SVG3a and Fig. SVG10 show self-reported lifetime prevalence of various drugs (both
licit and illicit) and give cross-tabulations by selected demographic variables.
Table SVG3a: Self-reported drug use (lifetime prevalence) by selected demographic
variables
Marijuana Cocaine Crack Inhalants Any
illicit
drug
Alcohol Tobacco
Overall 84.6 12.9 6.8 1.7 84.6 66.4 73.7
Age (years)
16-24 79.6 2.7 0.8 1.8 79.6 68.4 71.9
25-35 91.6 15.0 12.4 1.7 91.6 65.0 75.4
36-45 82.0 19.3 4.8 2.5 82.0 57.9 67.3
46-54 79.1 22.0 7.4 - 79.1 89.7 87.5
55 -65 90.5 22.4 22.4 - 90.5 67.6 90.9
Gender
Male 85.1 13.0 6.5 1.8 85.1 66.6 74.4
Female 66.7 8.3 16.7 - 66.7 58.3 50.0
Type of offending
First time 77.0 3.9 2.6 1.3 77.0 62.6 61.5
Repeat
(recidivist)
90.6 20.1 10.2 2.1 90.6 69.4 83.4
Status
On remand 81.1 5.8 6.6 1.9 81.1 63.0 72.4
Convicted 86.1 16.1 7.0 1.7 86.1 67.9 74.1
Offense category

Exploring the Relationship between Drugs and Crime
92
Sexual offense 90.9 9.1 9.1 - 90.9 63.6 73.1
Physical assault 81.0 4.8 4.8 4.8 81.0 76.2 76.0
Robbery 83.3 - - - 83.3 50.0 85.7
Stealing 90.4 40.4 16.4 - 90.4 61.6 85.7
Malicious
damage
50.0 - - - 50.0 - 50.0
Capital crimes 87.4 10.4 5.2 - 87.4 77.0 69.9
Drug crimes 87.5 25.7 10.3 5.1 87.5 69.1 60.9
Other 83.7 10.9 - - 83.7 70.6 72.7
Source: Saint Vincent and the Grenadines
Lifetime prevalence
The most prevalent drug indicated ever used by offenders in Saint Vincent and the
Grenadines was marijuana. About 85% of all offenders had used marijuana in their lifetime.
This was followed by tobacco (73.7%) and alcohol (66.4%). Cocaine was the second most
prevalent illicit drug used, with around 13% lifetime use reported, while 6.8% reported
lifetime use of crack cocaine. A small proportion reported non-prescription use of
medication (2.3%) while 1.7% used inhalants. This population of offenders reported no
heroin use. “Any illicit drug use” was computed to give a lifetime prevalence of 84.6%
(similar prevalence for lifetime marijuana use).
Gender and lifetime drug use
Some 85% of males compared to 66.7% of females reported lifetime marijuana use; 13% of
males versus 8.3% of females reported cocaine use; 6.5% of males versus 16.7% of females
reported crack cocaine use; and 66.6% of males versus 58.3% of females reported lifetime
alcohol use. Tobacco use was reported by 74.7% of males compared to 50% of females.
There was no significant difference between males and females with respect to reported
lifetime drug use prevalence (p>0.05 on chi square test).

Exploring the Relationship between Drugs and Crime
93
Source: Saint Vincent and the Grenadines
Repeat offending and lifetime drug use (Table SVG3b and Fig. SVG11)
Some 77% of first-time offenders compared to 91% of repeat offenders reported lifetime
marijuana use (p<0.01); 3.9% of first-time offenders versus 20% of repeat offenders
reported cocaine use (p<0.01); 2.6% of first-time offenders versus 10% of repeat offenders
reported crack cocaine use (p<0.01); and 62.6% of first-time offenders versus 69.4% of
repeat offenders reported lifetime alcohol use (p>0.05).
Table SVG3b: Relationship between type of offending and lifetime drug use
Type of Offending Marijuana Cocaine Crack Alcohol Tobacco
First time 77.0 3.9 2.6 62.6 61.5
Repeat
(recidivist)
90.6 20.1 10.2 69.4 83.4
Chi square (χ2) 14.76 23.81 8.65 2.09 25.03
p-value 0.01 0.01 0.01 0.17 0.001
Source: Saint Vincent and the Grenadines
Tobacco use was reported by 61.8% of first-time offenders compared to 83.4% of repeat
offenders (p<0.01). Reported lifetime prevalence (for marijuana, cocaine, crack cocaine,
and tobacco) among first-time offenders was significantly different statistically from that
reported by repeat offenders, (p<0.01 on chi square test).

Exploring the Relationship between Drugs and Crime
94
Source: Saint Vincent and the Grenadines
Age and lifetime drug use
Lifetime marijuana use was notably high among all age groups (79-92%). Cocaine
prevalence increased as the age groups became older—from 2.7% among the youngest age
group (16-24) to 22.4% in the oldest age group (55-65yrs). Lifetime prevalence of crack
cocaine use was highest in the 55-65 age group (22.4%) and in the 25-35 age group (12.4%).
Minimal use of crack cocaine was noted in the 16-24 age group (less than 1%). Lifetime
alcohol (58-90%) and tobacco (67-91%) use was notably high among all age groups.
Status (on remand vs. convicted) and lifetime drug use
Some 81% of offenders on remand compared to 86% of convicted offenders reported
lifetime marijuana use; 5.8% of those on remand versus 16% of those convicted reported
cocaine use; 6.6% of offenders on remand versus 7% of convicted offenders reported crack
cocaine use; and 63% of those on remand versus 68% of convicted reported lifetime alcohol
use.
Tobacco use was reported by 73% of offenders on remand compared to 74% for those
convicted. There was no statistically significant difference between offenders on remand
and those convicted with respect to reported lifetime drug use prevalence except for lifetime
cocaine use (p<0.05 on chi square test).
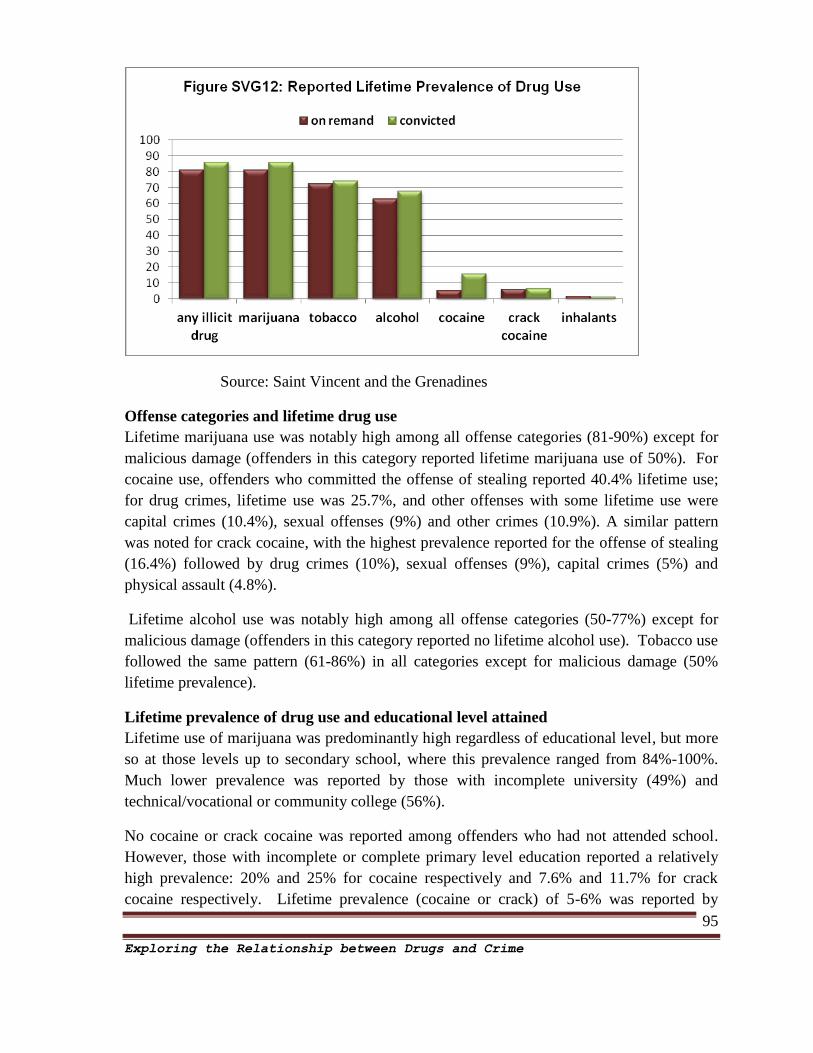
Exploring the Relationship between Drugs and Crime
95
Source: Saint Vincent and the Grenadines
Offense categories and lifetime drug use
Lifetime marijuana use was notably high among all offense categories (81-90%) except for
malicious damage (offenders in this category reported lifetime marijuana use of 50%). For
cocaine use, offenders who committed the offense of stealing reported 40.4% lifetime use;
for drug crimes, lifetime use was 25.7%, and other offenses with some lifetime use were
capital crimes (10.4%), sexual offenses (9%) and other crimes (10.9%). A similar pattern
was noted for crack cocaine, with the highest prevalence reported for the offense of stealing
(16.4%) followed by drug crimes (10%), sexual offenses (9%), capital crimes (5%) and
physical assault (4.8%).
Lifetime alcohol use was notably high among all offense categories (50-77%) except for
malicious damage (offenders in this category reported no lifetime alcohol use). Tobacco use
followed the same pattern (61-86%) in all categories except for malicious damage (50%
lifetime prevalence).
Lifetime prevalence of drug use and educational level attained
Lifetime use of marijuana was predominantly high regardless of educational level, but more
so at those levels up to secondary school, where this prevalence ranged from 84%-100%.
Much lower prevalence was reported by those with incomplete university (49%) and
technical/vocational or community college (56%).
No cocaine or crack cocaine was reported among offenders who had not attended school.
However, those with incomplete or complete primary level education reported a relatively
high prevalence: 20% and 25% for cocaine respectively and 7.6% and 11.7% for crack
cocaine respectively. Lifetime prevalence (cocaine or crack) of 5-6% was reported by

Exploring the Relationship between Drugs and Crime
96
offenders who had either complete or incomplete secondary education, and significantly
higher for those with a technical or community college education (11%).
Lifetime prevalence of drug use and work situation
Again, marijuana use dominated in all work categories with prevalences ranging from 67-
90% with the highest among part-time employees (90%) and the self-employed (90%).
Unemployed had the next highest prevalence (86.8%). Cocaine use was highest among the
unemployed (22.5%), as was crack cocaine use (18.6%). This was followed by part-time
employees (17% cocaine and 7% crack cocaine), self-employed with (16.6% cocaine and
2.8% crack cocaine), and full-time employees (8.9% cocaine and 6.7% crack cocaine).
Table SVG3c: Self-reported drug use (lifetime prevalence) by other selected
demographic variables
Source: Saint Vincent and the Grenadines
Reported age of first use of drugs - initiation rates
In this study, all initiation rates are based on offenders who reported having used a substance
at least once in their lifetime (Table SVG3d and Fig. SVG13).
Marijuana Cocaine Crack
cocaine Employment (pre-
incarceration
Unemployed 86.8 22.5 18.6
Part-time employee 90.1 17.2 7.0
Full-time employee 80.7 8.9 6.7
Informal activity (self-
employed)
90.0 16.6 2.8
Other 66.9 - -
Education (Schooling)
None 100.0 - -
Incomplete primary 91.2 20.3 7.6
Complete primary 84.5 25.0 11.7
Incomplete secondary 83.7 4.6 5.3
Complete secondary 88.8 5.5 -
Incomplete university 49.4 - -
Tech., Voc., Com. College 55.6 11.0 11.0

Exploring the Relationship between Drugs and Crime
97
Table SVG3d: Reported age of first use – overall
Age of First Use
Mean (yrs.) Median
(yrs.)
75th
percentile (yrs.)
Marijuana 14.7 14.0 17.0
Cocaine 21.5 20.0 25.0
Crack 23.5 24.0 25.0
Inhalants 23.0 23.0 26.0
Any illicit drug 14.7 14.0 17.0
Alcohol 16.2 16.0 19.0
Tobacco 16.5 15.0 18.0
Source: Saint Vincent and the Grenadines
In this study, all initiation rates are based on offenders who reported having used a substance
at least once in their lifetime. The mean age of first use for licit substances (alcohol and
tobacco) was slightly less than for illicit drugs with the exception of marijuana. Tobacco
use (mean initiation age of 16.5 years) began at about the same time as alcohol use (mean
initiation age of 16.2 years). However, 50% of tobacco use was initiated by age 15
compared to 50% of alcohol use by age 16—the median age for tobacco use was 15 years
compared to alcohol at 16 years of age.
Marijuana use was initiated at an early age compared to alcohol and tobacco: the mean age
of first use for marijuana was 14.7 years and the median age 14 years. Fifty percent of
marijuana use was initiated by age 14, which was two years earlier than that proportion of
alcohol use and one year earlier for tobacco use. In reality, marijuana use was initiated as if
it were a licit substance.
Initiation of the other illicit drugs along an age differential tended to follow a discernible
pattern of moving from the presumed “softer drugs” (alcohol and marijuana) to “harder
drugs” (cocaine and crack cocaine). The mean age of initiation for cocaine powder was 21.5
years compared to crack cocaine (23.5 years). The mean age of initiation reported for any
illicit drug followed the pattern observed for marijuana (14.7 years).

Exploring the Relationship between Drugs and Crime
98
Source: Saint Vincent and the Grenadines
Age of initiation at the seventy-fifth percentile serves to illustrate that 75% of all use had
already taken place by that age. In relation to first use, and from table SVG3d above, it may
be inferred that:
75% of all tobacco first use had taken place by the age of 18
75% of all alcohol use had taken place by the age of 19
75% of all marijuana use had taken place by the age of 17
75% of all crack cocaine use had taken place by the age of 25
75% of all cocaine powder use had taken place by the age of 25
75% of all inhalants use had taken place by age 26
75% of any illicit drug use had taken place by age 17.
Initiation rates by age groupings
Table SVG3e shows the distribution of rates of first use for five different age groupings—
less than 10 years, 10-14 years, 15-19 years, 20-24 years and 25 years and over. Those who
did not know or could not recall were omitted from the tabulations.
It should be noted that marijuana was also reported as initiated before the age of 10 years,
similar to the two licit substances (tobacco and alcohol). In addition, with the exception of
marijuana (43.1%), the greatest proportion of use initiated between the ages of 10 and 14
was related to tobacco (35.8%) and alcohol (25%). Substantial proportions of use were
initiated between the ages of 15-19 and 20-24 (73% of cocaine use, 57% of crack cocaine
use, 50% of inhalant use, 55% of alcohol use and 49% of tobacco use).

Exploring the Relationship between Drugs and Crime
99
Table SVG3e: Initiation rates - age of first use (age groupings)
Percentage of use by age (yrs.)
< 10 10-14 15-19 20-24 > = 25
Marijuana 11.7 43.1 33.6 7.2 4.4
Cocaine powder - - 37.6 35.7 26.7
Crack cocaine - - 11.9 45.8 42.3
Inhalants - - - 50.0 50.0
Any illicit drug 11.7 43.1 33.6 7.2 4.4
Alcohol 11.4 25.0 42.6 12.7 8.3
Tobacco 7.1 35.8 36.7 12.2 8.2
Source: Saint Vincent and the Grenadines
Source: Saint Vincent and the Grenadines

Exploring the Relationship between Drugs and Crime
100
Last time used drugs
Table SVG3f: Pattern of use – last time used drugs
Time last used drugs
Last 24
hours
Last
week
Last 30
days
>1 mth.
but <1
yr.
1 yr. or
more
Marijuana 38.7 12.1 3.5 11.1 18.6
Cocaine powder - 0.6 0.6 4.3 6.9
Crack cocaine - 0.6 0.6 2.5 3.1
Inhalants 1.2 - - 0.6 0.6
Alcohol 1.2 0.6 2.3 24.5 29.2
Tobacco 37.0 9.2 2.9 9.8 11.2
Source: Saint Vincent and the Grenadines
A high proportion of offenders reported using marijuana in the last 24 hours (38.7% or
almost four of every ten). Twelve percent reported marijuana use in the last week and about
4% in the last 30 days. About 30% reported marijuana use more than one month and up to
more than a year ago.
Almost no cocaine or crack cocaine use was reported in the last month, but about 6-11%
reported using these drugs up to more than a year ago. Forty-nine percent 49% of offenders
reported using tobacco in the last 24 hours to last 30 days. Few offenders (only 4%) reported
alcohol use in the last thirty days
How often used drugs
Marijuana was used very often within the past month—51% used four or more times per
week, 25% one to three times per week, and 16% one to three times per month (see Table
SVG3g below). Most cocaine use was four or more times per week (58%). However, one-
third of the use reported was within the last year. Crack cocaine use was as frequent as
marijuana use, but in slightly lower proportions--38% four or more times per week, 16% one
to three times per week, and another 16% one to three times per month.

Exploring the Relationship between Drugs and Crime
101
Table SVG3g: Patterns of use – how often used drugs
How often Consumed Drugs
Less
than
once a
year
Once a
year
1-11
times
per
year
1-3
times
per
month
1-3
times
per
week
4 or
more
times
per week
Marijuana - 5.0 2.9 16.3 24.6 51.2
Cocaine powder 8.3 25.1 - 8.3 - 58.3
Crack cocaine 15.5 15.5 - 15.8 15.5 37.8
Inhalants - - - - - -
Alcohol 2.9 5.6 11.8 28.8 38.5 12.4
Tobacco 0.9 4.5 0.9 11.7 37.9 44.1
Source: Saint Vincent and the Grenadines
Who got the offender involved in drug use?
For the most part, offenders got started or involved on their own (43.8%), or through friends
(37.7%). Contributions of mother or father (5.4%) or brother or sisters (3.1%), other family
members (5%) and acquaintance or neighbors (5%) were negligible.
Reasons for using drugs
Most offenders (21%) indicated curiosity as a direct reason for consuming drugs (21.4%
males and 33.3% females) (see Table SVG3h below). Some other reason was indicated by
one-quarter of offenders (24.3%). The next most prevalent reasons, in rank order, were peer

Exploring the Relationship between Drugs and Crime
102
pressure (15% overall and 15.5% of males and versus 16.7% of females). “I thought it
would make me feel good” accounted for 8.3%; “it was a way to escape reality” (6.9%),
family pressure (5.2%, males only), to belong to a group (3.4%, males only), and in order to
feel more courageous (2.9%).
Table SVG3h: Reasons for using drugs by gender
Reasons for drug use Overall Gender
Male Female
Curiosity 21.8 21.4 33.3
Peer pressure 15.5 15.5 17.7
To belong to a group 3.4 3.5 -
Family pressure 5.2 5.3 -
To feel more courageous 2.9 3.0 -
It was a way to escape reality 6.9 7.1 -
I like the idea of doing it 6.3 6.5 -
I thought it would make me feel good 8.3 8.3 8.3
Source: Saint Vincent and the Grenadines
Drug use while in prison
Seven of every ten offenders (69.7%) reported that they have used or were using drugs while
incarcerated (these were only males, i.e., 78% of all male offenders). Convicted offenders
were significantly more likely to report using drug while incarcerated—61.6% of all persons
on remand versus 73.6% of all convicted prisoners, χ2=5.83, p<0.05. See Fig. SVG16,
showing that the substances most used were marijuana and crack cocaine, and tobacco.

Exploring the Relationship between Drugs and Crime
103
Change in patterns of use
Of those who reported that they had used or were using drugs while incarcerated, only 3.4%
(n=10) had started using drugs for the first time while incarcerated. Seven of these
offenders were 21 years old when they started and the others were 17 years old. Again for
those who were using or had used, 11% (n=31) reported changing the type of substance that
they normally would have consumed outside of prison. Seven persons had changed to
marijuana, two to cocaine, two to alcohol, and nineteen to tobacco.
Offenders were asked whether the fact that they were in prison caused them to start or
resume using drugs, 39% said yes (34.6% of all offenders on remand and 40.6% of all those
convicted). Some 48% of those who had used or were using in prison responded that once
they started using drugs, they had an uncontrolled urge to keep using.
Of this same group of offenders, 84% perceived that they were able to stop using drugs for a
period of time without making a great effort or without feeling bad. Fifteen percent did not
share this view.
A notably high proportion of offenders (345/411 or 85.8%) said they were aware of the
physical or mental damage that drug use causes.
Offenders were asked to indicate whether they had ever received treatment by a doctor or
any other professional as a result of their use of any drugs or substances. A small proportion
(4.7% or 19 persons) indicated that they had previously received treatment for substance
use. They were also asked about hospitalization for drug use or related mental or physical
complications (3.6% or 14 persons). To complete this section, offenders were asked if they
felt that they presently needed treatment for drugs currently used: 4.7% said that they felt
they needed treatment.

Exploring the Relationship between Drugs and Crime
104
Family members’ drug use
Offenders were more likely to identify brothers (27.5%) as marijuana users, followed by
uncles (17.8%), and father (16.2%). Brothers (7.5%) were also as the most likely users of
cocaine, while uncles (5.2%) were the most likely users of crack. Uncles, brothers and
fathers were those named most often as having the highest proportion of tobacco and alcohol
use.
Table SVG3i: Offenders’ perception of family members’ drug use
Source: Saint Vincent and the Grenadines
Family members Marijuana Cocaine Crack Tobacco Alcohol
Father 16.2 1.2 1.7 11.0 10.4
Mother 6.0 0.6 - 5.7 5.8
Brother 27.5 7.5 3.5 17.6 20.9
Sister 3.7 0.6 - 1.7 3.1
Uncle 18.7 4.0 5.2 15.6 17.3
Aunt 1.4 - - 2.0 0.8
Other 17.8 1.1 - 8.9 11.8

Exploring the Relationship between Drugs and Crime
105
Saint Vincent and the Grenadines
Section 4
Relationship between drugs and crime

Exploring the Relationship between Drugs and Crime
106
Relationship between drugs and crime
A notably high proportion of responses to the questions indicated a link between drugs and
crime. Offenders on remand were asked if they had ever been convicted and imprisoned for
any offense, and 43.9% answered ‘yes’ (see Table SVG4a below). Those who responded in
the affirmative were asked whether the crime for which they were currently on remand had
some type of relationship with drugs, and 18.9% said ‘yes’. The respondents’ answers to the
follow-up questions are indicated in column 3 of the table, and labeled - on remand.
Convicted offenders were also asked whether the crime for which they were currently
serving a sentence had some type of relationship with drugs, and 44.4% said ‘yes’.
Convicted offenders’ responses to the follow-up questions are indicated in column 2 of the
table, and labeled – convicted.
Of those who said that their offense had some type of relationship with drugs:
55.4% of convicted offenders had committed the crime while under the influence of
drugs, which compares to 29.3% of those on remand;
51.4% of convicted offenders indicated that the crime was linked to production,
selling and/or trafficking of drugs, or directly linked to drug trafficking (46.6%), or
to activities that were against drug laws (46.6%). This compares to a very small
proportion (29.3%) of those on remand who indicated that the crime was linked to
production, selling and/or trafficking of drugs, or directly linked to drug trafficking
(29.3%), or to activities that were against drug laws (87.9%);
About 33.2% of convicted offenders had commit the crime in order to obtain drugs
for their personal use, compared to 41.4% on remand;
A small proportion of convicted offenders (18.7%) indicated that they had
wilfully/intentionally consumed a substance in order to boost their courage to
commit the crime. This was not indicated by those on remand;
A notable proportion of offenders (25.4% convicted and 29.3% of those on remand
indicated that their crime was perpetrated on a victim who was under the influence
of alcohol or drugs.

Exploring the Relationship between Drugs and Crime
107
Table SVG4a: Relationship between drugs and crime
[Offenders responding “YES” to questions posed]
Items Convicted On
remand
Did the crime you committed have some kind of relationship
with drugs?
126
(44.4)
11
(18.9)
When you committed the crime for which you are currently
imprisoned were you under the influence of a drug or
intoxicated?
67 (55.4) 2
(29.3)
Do you think you would have committed the crime if you
were not under the influence of a drug or intoxicated
(drugged)?
13 (19.1) -
Did you commit the crime for which you are currently
imprisoned in order to get drugs for your own personal use?
22
(33.2)
3
(41.4)
Was (were) the victim(s) of your crime under the influence of
alcohol or other drugs?
17
(25.4)
2
(29.3)
Did you wilfully/intentionally consume a substance in order
to boost your courage to commit the crime for which you are
currently in prison?
22
(18.7)
-
Was the crime for which you are currently imprisoned linked
to the production, selling and/or trafficking of drugs?
61
(51.4)
2
(19.3)
Was the crime for which you are currently imprisoned linked
to drug trafficking?
55
(46.6)
2
(29.3)
Was the crime for which you are currently imprisoned linked
to activities that went against drug laws?
56
(46.5)
7
(87.9)
Source: Saint Vincent and the Grenadines
Offense category and relationship between drugs and crime (convicted prisoners)
Offenders sentenced for sexual offenses said that the offense committed had some kind of
relationship with drugs, and that he crime was committed while under the influence of drug
or while intoxicated. In addition, notable proportions of offenders whose crime had a
relationship with drugs were sentenced for robbery, stealing, capital crimes, drug crimes and
other offenses;

Exploring the Relationship between Drugs and Crime
108
Table SVG4b: Offense category and relationship between drugs and crime (convicted
prisoners)
[Offenders responding “YES” to questions posed]
Sex
ual
off
ense
Ph
ysic
al
ass
au
lt
Robber
y
Ste
ali
ng
Mali
ciou
s dam
age
Capit
al
crim
es
Dru
g
crim
es
Oth
er
Did the crime you committed have
some kind of relationship with
drugs?
36.4 38.1 33.3 50.0 - 20.8 100.0 24.0
Crime committed while under the
influence of a drug or intoxicated?
27.3 28.6 16.7 40.4 - 5.2 36.0 10.9
Would you have committed the
crime if you were not under the
influence of a drug
- - - - - 10.3 10.9 -
Committed crime in order to get
drugs for your own personal use?
- - 16.7 26.0 - - 10.3 5.4
Victim(s) under the influence of
alcohol or other drugs?
- 23.8 - - - - 10.3 -
Wilfully/intentionally consume a
substance in order to boost your
courage to commit the crime
- 26.0 - - 10.3 -
Crime linked to the production,
selling and/or trafficking of drugs?
- 9.5 16.7 16.4 - 10.4 84.6 5.3
Crime linked to drug trafficking? - 4.8 16.7 9.6 - 5.2 84.6 10.9
Crime linked to activities that went
against drug laws?
- 4.8 33.3 14.4 - 5.2 69.1 13.2
Source: Saint Vincent and the Grenadines
Offenders who committed the crime to obtain drugs for their personal use were more likely
to have been convicted of robbery, stealing and drug offenses. Interestingly, about a quarter
of those sentenced for stealing also said they intentionally consumed a drug in order to boost
their courage to commit the crime;

Exploring the Relationship between Drugs and Crime
109
The highest proportions of affirmative responses (69-85%) were in those cases where those
sentenced for drug offenses and where the offense committed was linked to production,
selling or trafficking in drugs, or was against the drug laws of the country.
Importance of the relationship between drugs and crime
Offenders were asked to state their perception of the importance of the relationship between
drugs and crime and the options given were: of little importance, of no importance,
somewhat important, important and very important.
Of those who responded (n=127 or 30.9% of all offenders), most (54.5%) felt it was
important: 23.2% felt it was very important, 17.5% important, and 13.8% somewhat
important. About 18.6% felt it was of little importance and one-quarter (25%) felt it was of
no importance. A negligible proportion (1.9%) did not know of the importance or did not
respond (Fig. SVG17).
Source Saint Vincent and the Grenadines

Exploring the Relationship between Drugs and Crime
110
Saint Vincent and the Grenadines
Section 5
Perceptions of drug use

Exploring the Relationship between Drugs and Crime
111
Offenders’ perceptions of drug use by fellow inmates
Offenders were asked to indicate the three drugs most often used by fellow inmates. The
highest proportion of offenders indicated the first most important as marijuana (77%), the
second most important was tobacco (85%), and the third most important was alcohol (72%).
A small proportion (12.3%) indicated that tobacco was the first most important while 9%
said marijuana was the second most important and 13% felt that cocaine was the third most
important.
When asked how many inmates had been seen using drugs or substances in prison, the
majority of offenders said many (64.5%); while 20.3% said few, 5% said all and 10% said
none or did not respond.
Slightly more than a fifth (22%) said they were affected by the use of drugs or substances in
prison. The main reasons indicated related to the health effects of smoke (asthma, sinus
irritation, burning of eyes, shortness of breath, and so on).
Perception of ease of access to drugs in prison
A quarter of all inmates felt that it was easy to obtain drugs or substances in prison (6.4%
very easy and 19.2% easy). However, more than one half (59%) felt it was difficult—36.5%
very difficult and 22.7% difficult. About 15% did not respond or did not know.
Table SVG5a: Perception of ease of access to drugs in prison, by status and type of
offender
How easy to
obtain drugs?
Overall Status Type of Offender
On
remand
Convicted First-
time
Repeat
Easy 25.6 21.5 27.5 18.1 31.4
Difficult 59.2 48.4 63.9 58.2 60.2
Don’t know/NR 15.2 30.2 8.5 23.6 8.4
Source: Saint Vincent and the Grenadines
Drugs and violence in prison
Offenders were asked whether they believed that the violence that occurs within the prison
compound is related to drugs. More than half (53.5%) said yes—20% indicated slightly, 9%
moderately, another 20% very much so, and 5% excessively so. Some 42% said that they
did not believe violence in prison was related to drugs.

Exploring the Relationship between Drugs and Crime
112
Repeat offenders (31.4%) were significantly more likely to indicate that it was easy to obtain
drugs in prison compared to first-time offenders (18.1%), Χ2=21.18, p<0.01. About the same
proportion of repeaters felt it was difficult to obtain drugs compared to first timers.
With respect to offenders on remand, 22% felt it was easy to obtain drugs compared to 28%
of those that were convicted. A significantly higher proportion of convicted offenders felt it
was difficult to obtain drugs (64% versus 48%) but four times as many offenders on remand,
compared to those convicted, did not know or did not respond.
Offenders were also asked whether, in their opinion, the fact of being imprisoned makes a
person use drugs. Four of every ten (41%) said yes and 54% said no. Around 5% did not
respond.
Source: Saint Vincent and the Grenadines
Possible reasons for fellow inmates’ drug use
Offenders were asked to give their opinion as to which situations are possible reasons why
inmates were using drugs in prison (Table SVG5b below). Sixty percent or more indicated
the following:
Before entering prison, they already used these drugs (82.9%)
To calm their nerves (82.4%)
To feel good (74.7%)
Because they like it (72.4%)
To escape their problems (73.0%)
To be able to sleep (60.1%)

Exploring the Relationship between Drugs and Crime
113
In addition, between 40-60% of offenders felt the following were important causes:
problems or family difficulties; nothing else to do; peer pressure by fellow inmates; to be
accepted by their fellow inmates; and to increase their privileges or popularity.
Table SVG5b: Possible causes of fellow inmates’ drug use
Items Yes No Maybe
Before entering prison they already used
these drugs
82.9 2.3 5.9
To escape their problems 73.0 11.9 5.8
Problems or family difficulties 52.6 21.0 13.4
To calm their nerves 82.4 4.7 5.8
To be able to sleep 60.1 18.7 10.5
Nothing else to do 52.0 31.5 8.2
To feel good 74.7 7.6 9.3
Because they like it 72.4 8.8 8.8
Peer pressure by fellow inmates 40.9 42.7 6.4
To increase their control and authority 37.9 40.4 12.8
To increase their privileges or popularity 41.4 37.4 8.8
To be accepted by their fellow inmates 51.9 25.7 11.7
Source: Saint Vincent and the Grenadines

Exploring the Relationship between Drugs and Crime
114
Saint Vincent and the Grenadines
Section 6
Gang involvement

Exploring the Relationship between Drugs and Crime
115
History of gang involvement
About 30% (123/411) of all offenders indicated that they were presently in a gang or had
been in a gang previously (significantly more convicted offenders (38%) than those on
remand (14%, p<0.01). The vast majority were males (98.4%) with only two females.
About 36% were in the 10-14 age bracket, 49% in the 15-19 age group and 15% in the 20
and older bracket when their gang activities started.
Table SVG6a: History of gang involvement/perceptions of gangs in prison
Items Overall On
remand
Convicted Chi-
square
P value
Are you in or have you ever been in a gang?
(123/411)
29.8 14.3 38.0 22.99 <0.01
Were you a member of a gang immediately
before your imprisonment? (n=123)
54.9 66.7 52.4 1.26 >0.05
Was the crime related in any way to your
involvement/membership of the gang? (n=123)
37.4 11.8 41.3 5.47 <0.05
Were you ever imprisoned in the past for gang
related activities? (n=123)
24.0 38.9 21.0 2.74 >0.05
Was drug-use a part of your gang activities
before imprisonment? (n=123)
68.3 66.7 68.6 0.02 >0.05
Was trafficking in drugs a part of your gang
activities before imprisonment? (n=123)
68.4 94.4 65.7 6.02 <0.05
Upon release, how likely are you to readily get
back into gang activities? (n=123)- very likely
or likely
14.3 27.8 11.6
Are you aware of any gangs in prison, either
now or in the past? (n=411)
43.0 38.2 46.5 2.35 >0.05
Since imprisonment, have you been
approached to be a member of a prison-based
or outside gang? (n=411)
9.8 5.6 12.0 3.95 <0.05
Are you aware of any gang related activity
which supports the drug trade? (n=411)
32.9 22.3 39.8 11.34 <0.01

Exploring the Relationship between Drugs and Crime
116
Of those who were involved with a gang (n=123):
54.9% were gang members immediately before incarceration;
37.4% indicated that the crime for which they were presently incarcerated was
related to involvement in or membership of a gang (significantly more convicted
offenders (41%) compared to those on remand (12%, p<0.05);
24% were previously imprisoned for gang-related activities; and 68.3% indicated
that drug use was part of their gang activity before imprisonment, with 68.4%
indicating that trafficking was part of their gang activities (significantly more
offenders on remand (94%) compared to convicted offenders (66%, p<0.05).
Some 86% of these offenders felt that it was not likely that they would readily
resume gang activities after release. However, 14.3% felt that it was likely (11.6%
very likely and 2.7% likely);
About 43% (173/324) of all offenders said that they were aware of gangs in prison
(whether presently or in the past);
9.8% said that since incarceration, they had been approached by a member of a
prison-based or outside gang (significantly more convicted offenders (12%)
compared to those on remand (6%, p<0.05);
A relatively high proportion of offenders overall (32.9% or about one-third), said
they were aware of gang-related activities that support the drug trade (significantly
more convicted offenders (40%) compared to those on remand (22%, p<0.01).

Exploring the Relationship between Drugs and Crime
117
Appendix 2: Results for Saint Kitts and Nevis
Section 1
Demographics

Exploring the Relationship between Drugs and Crime
118
Table SKN1a: Characteristics of the study population (Saint Kitts)
Age (years) Ethnic origin (which race) 16-24 107 (33.0) Black/African 319 (98.5)
25-35 140 (43.3) White/Caucasian 2 (0.5)
36-45 41 (12.7) East Indian -
46-54 21 (6.4) Mixed race 2 (0.5)
55-65 15 (4.6) Indigenous -
Mean age (yrs.) Other* 2 (0.5)
Median age (yrs.)
Age range (yrs.) Employment (pre-imprisonment)
Age (min-max) (yrs.) Unemployed 37 (11.5)
Part-time employee 40 (12.2)
Gender Full-time employee 176 (54.4)
Male 318 (98.1) Informal/self-employed 71 (21.9)
Female 6 (1.9)
Status Trade or profession
Convicted 216 (66.8) Professional 20 (6.1)
On remand 108 (33.2) Technician 13 (4.1)
Clerical support 5 (1.5)
Union status Services and sales 38 (11.6)
Single 270 (83.4) Skilled (agric., forestry) Fishery) 35 (10.7)
Married 16 (5.1) Craft and related trade 28 (8.6)
Widowed - Plant and machine operator 17 (5.4)
Divorced 4 (1.3) Elementary occupation 136 (42.0)
Common law 28 (8.6) Other 16 (5.1)
Separated 5 (1.5) None 16 (4.6)
Visiting relationship -
Don’t know - In-prison activity
School/knowledge programs 69 (21.4)
Education (schooling) Computer -
None - Bakery 5 (1.5)
Incomplete primary 4 (1.3) Cooking 5 (1.5)
Complete primary 8 (2.6) Tailoring 3 (1.0)
Incomplete secondary 199 (61.8) Welding -
Complete secondary 77 (23.8) Sewing -
Incomplete university 5 (1.5) Farming 17 (5.1)
Complete university 5 (1.5) Cleaning 12 (3.6)
Tech., Voc., Com. College 24 (7.5) Teaching 2 (2.5)
Administrative -
Which country born Construction/carpentry 10 (3.1)
St. Kitts and Nevis national 309 (95.4) Arts and craft 13 (4.1)

Exploring the Relationship between Drugs and Crime
119
Note: *Other = Syrian/Lebanese, Chinese, Portuguese, and other
Other nationality 15 (4.6) Other 100 (20.8)
None 89 (27.4)

Exploring the Relationship between Drugs and Crime
120
Age
The mean age of offenders overall was 30.6 years and the median age was 28. The ages of
offenders ranged from 18 to 64 years, a range of 46 years. About one-third (33%) of all
offenders were 24 years or younger and 75% were 34 years and under. By age groups,
Table SKN1a shows that most offenders were in three age brackets: 16-24 (33%), 25-35
(43%) and 36-45 (13%). Six percent were in the 46-54 age group, and five percent were in
the 55-65 age bracket (the oldest age cohort).
Source: Saint Kitts
Gender and age group
Most offenders were males (98.1%) and only 1.9% were females. One-third of all male
offenders were in the 16-24 age bracket (32.6%), with slightly more than 40% in the 25-35
age group (see Table SKN1b). The 36-45 age bracket was next, with 13%. About 11% of
male offenders were older than 45. By comparison, one-half of female offenders were in the
16-24 age group, with 33% in the 25-35 age bracket and the remaining 17% in the 46-54 age
bracket.

Exploring the Relationship between Drugs and Crime
121
Table SKN1b: Percentage distribution: age group, gender and status
Age Group Male Female On remand Convicted
16-24 32.6 50.0 31.4 32.4
25-35 43.5 33.3 49.8 40.0
36-45 13.0 - 9.1 14.6
46-54 6.2 16.7 3.9 7.7
55-65 4.7 - 3.0 5.4
Source: Saint Kitts
Status of prisoners
More than two-thirds of the offending population were convicted prisoners (66.8%), while
33.2% were on remand. A similar pattern was observed for both males (66.8% were
convicted and 32.3% were on remand), and females (67.7% convicted and 33.3% on
remand).
Age group and status
More than eight of every ten offenders (81%) on remand were in the two youngest age
groups, with 9% in the 36-45 age bracket (see table SKN1b). A notably high proportion of
convicted offenders (72%) were also in the two youngest age groups, and 15% in the 36-45
age bracket. About 12% of convicted offenders were older than 45 years.
Source: Saint Kitts
Union status
The majority of offenders were single (84.4%), while 5% were married and 2.8% were
widowed, divorced, or separated. About 9% were living in common-law relationships.
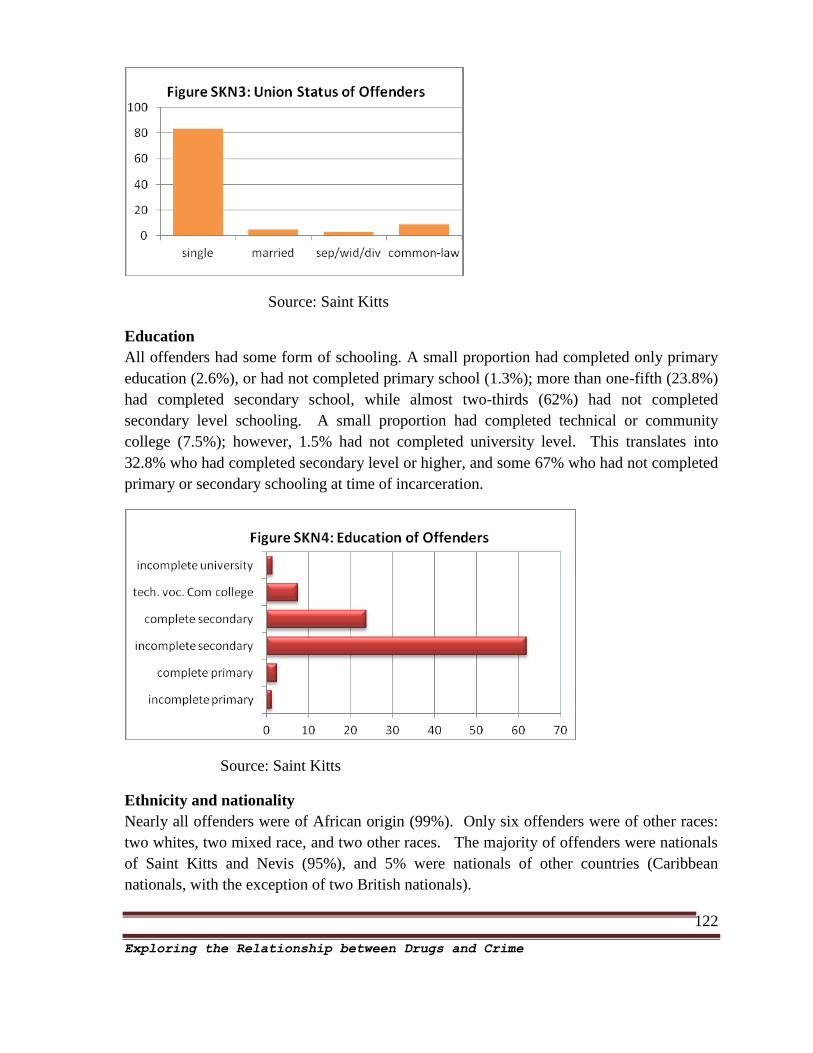
Exploring the Relationship between Drugs and Crime
122
Source: Saint Kitts
Education
All offenders had some form of schooling. A small proportion had completed only primary
education (2.6%), or had not completed primary school (1.3%); more than one-fifth (23.8%)
had completed secondary school, while almost two-thirds (62%) had not completed
secondary level schooling. A small proportion had completed technical or community
college (7.5%); however, 1.5% had not completed university level. This translates into
32.8% who had completed secondary level or higher, and some 67% who had not completed
primary or secondary schooling at time of incarceration.
Source: Saint Kitts
Ethnicity and nationality
Nearly all offenders were of African origin (99%). Only six offenders were of other races:
two whites, two mixed race, and two other races. The majority of offenders were nationals
of Saint Kitts and Nevis (95%), and 5% were nationals of other countries (Caribbean
nationals, with the exception of two British nationals).

Exploring the Relationship between Drugs and Crime
123
Pre-incarceration employment status
Offenders overall were asked to state their pre-incarceration work situation. Most indicated
full-time employment (54.4%) while 12% were in part-time employment and another 12%
were unemployed. About one-fifth, or 22%, were self-employed.
Source: Saint Kitts
Cross tabulation in Table SKN1c below shows the pre-incarceration employment status of
both convicted and remanded offenders. More than half (60%) of convicted offenders were
in full-time employment, and 13% were employed part-time. About 8% were unemployed
and a further 18.6% were involved in informal activities (self-employed). For offenders on
remand, slightly more than four of every ten (43%) were employed full-time, 11% part-time,
18% were un-employed and some 29% were self-employed.
Table SKN1c: Employment (pre-incarceration) status
Employment Status Convicted On remand)
Unemployed 18 (8.4) 19 (17.5)
Part-time 28 (13.0) 11 (10.6)
Full-time 130 (60.0) 47 (43.2)
Informal activity (self-
employed)
40 (18.6) 31 (28.7)
Source: Saint Kitts

Exploring the Relationship between Drugs and Crime
124
Income
More than three-quarter of all offenders indicated a monthly income of XCD$1,000 or more
before being incarcerated; 11% were not earning a monthly income or did not know what
their income was. However, most all others (13%) indicated an income less than
XCD$1000 a month (Table SKN1d).
Table SKN1d: Amount of income before incarceration and during imprisonment
Income (XCD$) Monthly
before
incarceration
Current
monthly family
income
Less than XCD$ 500 10 (3.1) -
Between XCD$ 500 and less than XCD$
600
12 (3.6) 2 (0.6)
Between XCD$ 600 and less than XCD$
700
1 (0.3) 3 (1.2)
Between XCD$ 700 and less than XCD$
800
3 (1.0) -
Between XCD$ 800 and less than XCD$
900
3 (1.0) -
Between XCD$ 900 and less than XCD$
1000
13 (4.1) -
XCD$ 1000 or more 247 (76.2) 44 (13.7)
Does Not Know/NR 21 (6.6) 229 (82.3)
None 14 (4.2)
Source: Saint Kitts
Other demographics
Religion. Seventy-one percent of offenders said that they practiced a religion, while 29.3%
did not. Most offenders were Anglican (18%); Methodist (15%; Church of God (12%);
Rastafarian (12%); or some “other” religion (19%).

Exploring the Relationship between Drugs and Crime
125
Children and Family. Offenders were asked whether they had any children: 54.1% said
yes and 45.9% said no. Of those indicating that they had children, 86% reported that they
had male children while 78% said they had female children.
Eighty-five percent of offenders indicated that they kept in touch with their family while
15% did not (Table SKN1e). There was no statistically significant difference between
convicted prisoners and those on remand or between males and females with respect to
keeping in contact with family members (p>0.05).
Table SKN1e: Offenders’ contact with family members
In touch
with
family?
Overall Male Female
On
remand
Convicted
Yes 275 (84.8 269
(84.6)
6 (100.0) 88 (81.5) 186 (86.1)
No 49 (15.2) 49
(15.4)
- 20 (18.5) 30 (13.9)
Source: Saint Kitts

Exploring the Relationship between Drugs and Crime
126
Saint Kitts and Nevis
Section 2
Criminal history and criminal offending

Exploring the Relationship between Drugs and Crime
127
Criminal offending
Table SKN2a: Offense types (current sentence and previous offense)
Offense category Current
sentence
Previous
offense
Sexual offense 25 (7.7) 2 (1.1)
Physical assault 24 (7.5) 42 (28.6)
Robbery 33 (10.2) 16 (11.2)
Stealing 24 (7.5) 23 (15.7)
Malicious damage 2 (0.5) 3 (2.2)
Capital crimes 45 (13.8) 11 (7.7)
Drug crimes 13 (4.1) 18 (12.3)
Other 40 (12.4) 31 (21.2)
Don’t know 10 (3.1) -
On remand 108 (33.2)
Source: Saint Kitts
Table SKN2a shows that the offenses most often reported by those offenders who were
currently sentenced were, in rank order, capital crimes, robbery, physical assault, stealing,
and sexual offenses. Interestingly, very few were serving a sentence for drug crimes (4%).
For offenders who reported previous offenses (48.1% of the population), the offenses most
often indicated were physical assault (28.6%), stealing (16%), followed by drug crimes,
robbery, capital crimes and more than one-fifth for “other” offenses.
Of the four convicted female offenders, one was currently sentenced for stealing, one for
physical assault and two for “other” offenses. Males were more likely to be sentenced for
capital crimes, robbery, and “other” offenses.
Repeat offending
Table SKN2b: Repeat offending by status
Is this your first
sentence?
Convicted Remand Overall
Yes (first
offenders)
123 (56.9) 49 (45.4) 173 (53.3)
No (repeat
offenders
93 (43.1) 59 (54.6) 151 (46.7)
Source: Saint Kitts

Exploring the Relationship between Drugs and Crime
128
As shown in Table SKN2b above, a little less than half of all offenders were repeat
offenders (47%). Some 43% of convicted prisoners reported that this was not the first time
they had been sentenced. A notably higher proportion of those on remand also indicated
that they had been sentenced before (55%), p=.059.
Source: Saint Kitts
Frequency of imprisonment (overall) n=151
The mean number of times imprisoned was 3.41 ± 1.90 with a median of 3.0 times. The
number of times imprisoned ranged from 1-11 times among this group of repeat offenders.
Most had been imprisoned between 1-4 times (82%). However, about 8% had been
imprisoned six or more times.
Criminal history and demographic variables (Table SKN2c)
Percent previously imprisoned (remand versus convicted) and demographic variables
Overall, some 54.6% of offenders on remand and 43% of those convicted reported a
previous incarceration. Age. Most offenders on remand with previous imprisonment were
in the two lowest age cohorts—66% in the 25-35 age group and 27% in the 16-24 age
bracket. For those convicted, most offenders with previous imprisonment were spread over
the first three age brackets-- some 84% of offenders were in these three brackets.
Gender. All the males on remand had previous sentences, compared to only 43.9% of those
that were convicted. None of the females, whether on remand or convicted, had previous
imprisonment.
Union status. Most of those on remand or convicted with previous sentences were single
(80% on remand compared to 84% of those convicted).

Exploring the Relationship between Drugs and Crime
129
Length of incarceration
Table SKN2c shows the length of time offenders were on remand, as well as total length of
sentence for those convicted (mean and median data). For those on remand, the mean length
of time thus far was 8.9 months with a median of 4 months. About 12% of these offenders
were on remand for longer than 24 months. Convicted offenders were asked the total length
of their sentence: the mean length of sentence indicated was 104.3 months with a median of
72 months. More than half (61%) had a sentence of 60 months (5 years) or more and 8
offenders were serving life sentences.
Table SKN2c: Length of incarceration
How long on remand
(months)
Months Total length of sentence
(convicted)
Months
Mean 8.9 Mean 104.3
Standard deviation 11.3 Standard deviation 106.2
Median 4.0 Median 72.0
Mode 1.0 Mode 36.0
Range 0-46
About 12% were on remand for longer
than 2 years
More than half (61%) had a sentence of
60 months (5 years) or more and 8
offenders were serving life sentences.
Source: Saint Kitts
Age of first offense
The mean age of first offense reported was 22 years. The median age was 20 years and the
ages of first offense ranged from 10-59 years. About 29% of offenders had offended before
the age of 18, while 75% had offended by the age of 24.
Table SKN2d: Comparison of age of first offense with gender and status
Mean and Std. Dev.
(yrs.) Overall 22.88 ± 9.0
Gender (p>0.05)
Male 22.80 ± 8.9
Female 27.00 ± 13.1
Status (p>0.05)
Remand 23.04 ± 9.87
Convicted 22.80 ± 8.53
Type of Offending
(p<0.01)
First-time offender 25.97 ± 9.91
Repeat offender 19.48 ± 6.34
Source: Saint Kitts

Exploring the Relationship between Drugs and Crime
130
The age of first offense for males was notably lower than that of females (22 versus 27
years), but this was not a statistically significant difference, p>0.05. There was also no
significant difference in the age of first offense between prisoners on remand (23 years) and
those that were convicted (22.8 years), p>0.05 – ANOVA test.
Other previous offenses (accused or sentenced)
Some 48.1% (156/324) of offenders (48.7% of males and 16.7% of females, i.e. one female)
reported previous offenses for which they had been either accused or sentenced. About
8.1% (13/156) of offenders who were charged with or sentenced for previous offenses were
held in a Youth Detention Centre because they were minors at the time of offending. These
13 offenders were all males.
Of the 13 offenders, 8 or 72% were sent to the Youth Detention Centre once; 2 or 14.4%
twice; and 2 others or 14.4%, three times. The overall mean number of times sent to YDC
was 1.4, with a median of 1 time and a range of 1-3 times.
Family members and criminal activities
Offenders were asked whether they had any family members who were engaged in criminal
activities (see Fig. SKN7 and Table SKN2e below). About one-third of all offenders
(32.7%) indicated that they had family members who are or were involved in criminal
activities: 33.9% of males compared to 33.3% of females, p>0.05; and 26% on remand
compared to 38% convicted,Χ2=4.56, p<0.05.
Source: Saint Kitts
For the most part, brothers (14.1%), uncles (7.1%), and some other family member (16.9%)
were the family members primarily reported (Figure SKN8). Mothers, sisters, aunts and
grandparents were not indicated as family members being involved in criminal offending.

Exploring the Relationship between Drugs and Crime
131
Offense category for family members
Table SKN2e: Frequency of family members involved in criminal activities by offense
category
Offense category Father Brother Uncle Other
fam Sexual offense - 2 - -
Physical assault - 7 8 7
Robbery - 5 - 7
Stealing - 2 - 2
Malicious damage - - - -
Capital crimes 2 13 3 14
Drug crimes - 3 3 3
Other - 3 9 19
Source: Saint Kitts
Table SKN2e shows the frequency of family members’ involvement in criminal activities by
offense categories. The reported offenses in rank order for each family member involved
are shown below:
Fathers: only two reports, which were related to capital crimes;
Brothers: capital crimes, physical assault, robbery, drug crimes, stealing, and other
offenses;
Uncles: physical assault, drug crimes, capital crimes, and other crimes.
Figure SKN8: Family Members and
Criminal Activities
uncle
other
family
brother
Frequency of offending by family members
When asked about the frequency with which family members offend, most offenders did not
know or did not respond to this question (58%). Twenty-six percent said less than once per
year, 11% said once per year and 4.4% said once per month.

Exploring the Relationship between Drugs and Crime
132
Saint Kitts and Nevis
Section 3
Drug use

Exploring the Relationship between Drugs and Crime
133
Drug use
Table SKN3a below shows self-reported lifetime prevalence of various drugs (both licit and
illicit) among inmates in Saint Kitts and Nevis and shows cross-tabulations by selected
demographic variables.
Table SKN3a: Self-reported drug use (lifetime prevalence) by selected demographic
variables
Mari Coc Crack Any
illicit
Alc Tob
Overall 67.9 4.6 5.6 68.4 61.6 25.2
Age (years)
16-24 75.0 - 1.6 76.6 53.4 16.8
25-35 71.5 3.5 2.3 71.5 61.6 25.5
36-45 44.0 20.0 20.0 44.0 80.1 31.7
46-54 71.5 8.0 15.9 71.5 47.6 38.1
55 -65 44.4 - 11.2 44.4 88.8 46.7
Gender
Male 68.9 4.7 5.7 69.4 62.1 25.2
Female 16.7 - - 16.7 33.3 16.7
Type of Offending
First time 60.8 - 1.0 60.8 51.8 13.9
Repeat (recidivist) 76.0 9.8 10.2 77.1 72.8 38.2
Status
On Remand 74.0 4.5 1.5 74.0 66.4 24.1
Convicted 64.9 3.8 0.8 65.6 59.2 25.8
Offense Category
Sexual offense 53.3 6.7 6.7 53.3 66.7 40.0

Exploring the Relationship between Drugs and Crime
134
Physical assault 52.1 - - 52.1 61.6 12.5
Robbery 70.0 5.0 10.0 70.0 55.0 35.3
Stealing 61.6 13.7 13.7 61.6 68.5 28.0
Malicious damage 100.0 - - 100.0 - 100.0
Capital crimes 77.8 3.7 7.4 77.8 44.4 28.9
Drug crimes 87.5 - 12.5 87.5 75.0 23.1
Other 62.0 - - 62.0 71.1 15.0
Source: Saint Kitts
Lifetime prevalence
The most prevalent drug reported as ever used by offenders was marijuana. About 68% of
all offenders had used marijuana in their lifetime. This was followed by alcohol (61.6%)
and tobacco (25.2%). Crack cocaine was the second most prevalent illicit drug used: 5.6%
of lifetime use was reported and 4.6% reported lifetime use of cocaine powder. A small
proportion reported non-prescription use of medication (1.3%) while 0.5% inhalant use and
1% heroin use was reported. “Any illicit drug use” was computed to give a lifetime
prevalence of 68.4%.
Source: Saint Kitts
Gender and lifetime drug use
Some 69% of males compared to 16.7% of females reported lifetime marijuana use; cocaine
and or crack cocaine use was only reported by male offenders: 4.7% cocaine and 5.7% crack
cocaine; and 62.1% of males versus 33.3% of females reported lifetime alcohol use.

Exploring the Relationship between Drugs and Crime
135
Tobacco use was reported by 25.2% of males compared to 16.7% of females. There was no
significant difference between males and females with respect to reported lifetime drug use
prevalence (p>0.05 on chi square test).
Repeat offending and lifetime drug use
Some 61% of first time offenders compared to 76% of repeat offenders reported lifetime
marijuana use (p<0.01); cocaine use was reported only by repeat offenders (p<0.01); 1.2%
of firs- time offenders versus 10.6% of repeat offenders reported crack cocaine use (p<0.01);
and 51.8% of first-time offenders versus 72.8% of repeat offenders reported lifetime alcohol
use (p<0.01). 13.9% of first-time offenders versus 38.2% of repeat offenders reported
tobacco use (p<0.01).
Table SKN3b: Relationship between type of offending and lifetime drug use
Type of Offending Marijuana Cocaine Crack Alcohol Tobacco
First time 60.8 0.0 1.2 51.8 13.9
Repeat
(recidivist)
76.0 9.9 10.6 72.8 38.2
Chi square (χ2) 8.84 17.89 13.69 15.14 25.29
p-value < 0.01 <0.01 < 0.01 < 0.01 < 0.01
Source: Saint Kitts
Reported lifetime prevalence (for marijuana, cocaine, crack cocaine, alcohol and tobacco)
among first time offenders was significantly different statistically from that reported by
repeat offenders, (p<0.01 on chi square test).

Exploring the Relationship between Drugs and Crime
136
Source: Saint Kitts
Age and lifetime drug use
Lifetime marijuana use was notably high among all age groups (44-75%). Cocaine
prevalence was at 20% among 36-45 year-olds but was not reported by the youngest age
group (16-24). Prevalence of 8% was reported in the 46-54 age bracket. Lifetime
prevalence of crack cocaine use was also highest in the 36-45 age group (20%) and the 46-
54 age group (15.9%), followed by the 55-65 age bracket with 11.2%. Minimal use of crack
cocaine was noted in the 16-24 age group (1.6%). Lifetime alcohol use was high (48-89%),
and tobacco use (17-47%) was moderate in all age groups.
Status (on remand vs. convicted) and lifetime drug use
Some 74% of offenders on remand compared to 65% of convicted offenders reported
lifetime marijuana use; 6% of those on remand versus 3.8% of those convicted reported
cocaine use; 4.5% of offenders on remand versus 6% of convicted offenders reported crack
cocaine use; and 66.4% of those on remand versus 59% of convicted reported lifetime
alcohol use.
Tobacco use was reported by 24% of offenders on remand compared to 26% for those
convicted. There was no statistically significant difference between offenders on remand
and those convicted with respect to reported lifetime prevalence.

Exploring the Relationship between Drugs and Crime
137
Source: Saint Kitts
Offense categories and lifetime drug use
Lifetime marijuana use was notably high among all offense categories (52-88%). In the case
of malicious damage, 100% of offenders in this category reported lifetime marijuana use.
For cocaine use, offenders who committed a stealing offense reported the highest prevalence
(13.7%), followed by sexual offenses (7%), robbery (5%) and capital crimes (3.7%). A
similar pattern was noted for crack cocaine, with the highest prevalence reported for the
offense of stealing (13.7%), followed by drug crimes (12.5%), robbery (10%), capital crimes
(7.4%), and sexual offenses (6.7%).
Lifetime alcohol use was notably high among all offense categories (44-75%), except in the
case of malicious damage (offenders in this category reported no lifetime alcohol use).
Tobacco use followed the same pattern but with moderate use in all categories except for
malicious damage (12-40% lifetime prevalence).
Lifetime prevalence and educational level attained
Lifetime use of marijuana was predominantly high regardless of educational level, but more
so at levels up to secondary school, where it ranged from 38-71%. Interestingly, offenders
with incomplete primary level school reported the lowest lifetime prevalence (38%). All
other reported prevalences ranged between 60% and 71%.
Though no cocaine or crack cocaine was reported among offenders who had a primary
school education, a small proportion of offenders who had either complete or incomplete
secondary level education reported use—4-7%. Offenders with technical or community
college education reported lifetime prevalence (cocaine or crack) of 7%.

Exploring the Relationship between Drugs and Crime
138
Lifetime prevalence and work situation
Again, marijuana use dominated in all work categories with prevalences ranging from 62-
76% with the highest among the self-employed (76%). Cocaine and crack cocaine use was
also highest among this group (8.2% and 13.9% respectively). This was followed by the
unemployed (8.8% cocaine and 4.4% crack cocaine), part-time employee (4.2% cocaine and
4.2% crack cocaine), and full-time employees (1.9% cocaine and 2.8% crack cocaine).
Table SKN3c: Self-reported drug use (lifetime prevalence) by other selected
demographic variables
Source: Saint Kitts
Reported age of first use - initiation rates
In this study, all initiation rates are based on offenders who reported having used a substance
at least once in their lifetime. The mean age of first use for licit substances (alcohol (16.3
years) and tobacco (16.9 years)) was slightly higher than that of the main illicit drug
marijuana (15.1 years). Tobacco use (median initiation age of 17 years) was started a little
later than alcohol use (median initiation age of 16).
Marijuana Cocaine Crack
cocaine Employment (pre-
incarceration
Unemployed 66.2 8.8 4.4
Part-time employee 62.4 4.2 4.2
Full-time employee 66.4 1.9 2.8
Informal activity (self-
employed)
75.5 9.2 13.9
Other
Education (Schooling)
Incomplete primary 38.4 - -
Complete primary 59.8 - -
Incomplete secondary 70.8 4.9 6.6
Complete secondary 66.5 4.3 4.3
Incomplete university 66.7 - -
Tech., Voc., Com.
College
68.4 6.9 6.9

Exploring the Relationship between Drugs and Crime
139
Table SKN3d: Reported age of first use – overall
Age of First Use
Mean
(yrs.)
Median
(yrs.)
75th
percentile
(yrs.)
Marijuana 15.1 14.0 17.0
Cocaine 23.3 21.9 25.0
Crack 25.1 21.0 25.0
Inhalants 19.0 19.0 19.0
Heroin 21.5 21.4 24.0
Any illicit drug 15.2 14.1 17.0
Alcohol 16.3 16.0 17.0
Tobacco 16.9 17.1 18.0
Source: Saint Kitts
Marijuana use was initiated at a notably earlier age than alcohol and tobacco – the median
age of first use for marijuana was 14. Fifty percent of marijuana use was initiated by age 14,
which was two years earlier than that proportion of alcohol use and three years earlier for
tobacco use. As in other countries, marijuana use was initiated as if it were a licit substance.
Initiation of the other illicit drugs along an age differential tended to follow a discernible
pattern of moving from the presumed “softer drugs” (alcohol and marijuana) to “harder
drugs” (cocaine and crack cocaine). The mean age of initiation for cocaine powder was 23
years, compared to crack cocaine (25 years). The mean age of initiation reported for any
illicit drug followed the pattern observed for marijuana (15 years).

Exploring the Relationship between Drugs and Crime
140
Source: Saint Kitts
The age of initiation at the seventy-fifth percentile serves to illustrate that 75% of all use had
already taken place by that age. In relation to first use, it may be inferred from Table
SKN3d above that:
75% of all tobacco first use had taken place by the age of 18
75% of all alcohol use had taken place by age 17
75% of all marijuana use had taken place by the age of 17
75% of all crack cocaine use had taken place by age 25
75% of all cocaine powder use had taken place by age 25
75% of all inhalants use had taken place by the age of 19
75% of any illicit drug use had taken place by age 17.
Initiation rates by age groups
Table SKN3e shows the distribution of the rates of first use for five different age groups:
under 10, 10-14, 15-19, 20-24 and 25 years and over. Those who did not know or could not
recall were omitted from the tabulations.
Interestingly, the only substances reported as initiated before the age of 10 years were the
two licit substances (tobacco and alcohol) and marijuana (the most prevalent illicit
substances self-reported). In addition, with the exception of marijuana (40.3%), the greatest
proportion of use initiated between the ages of 10 and 14 was related to tobacco (24%) and
alcohol (24%). Substantial proportions of use were initiated between ages 15-19 years and
20-24 years (67% of cocaine use or crack cocaine use), 60% of alcohol use and 64% of
tobacco use).

Exploring the Relationship between Drugs and Crime
141
Table SKN3e: Initiation rates - age of first use (age groups)
Percentage of use by indicated age (yrs.)
< 10 10-14 15-19 20-24 > = 25
Marijuana 10.4 40.3 36.4 11.2 1.7
Cocaine powder - - 33.5 33.3 33.2
Crack cocaine - - 33.5 33.5 33.0
Any illicit drug 10.4 39.9 37.0 11.1 1.6
Alcohol 8.0 24.1 50.8 9.1 8.0
Tobacco 7.2 24.0 50.5 13.5 4.8
Source: Saint Kitts
Source: Saint Kitts
Last time used drugs
Table SKN3f shows that a moderately small proportion of offenders reported using
marijuana over the last thirty days (11.4%, or just about one in every ten). Four percent
indicated using marijuana in the last week and about 6% in the past 30 days. About 14%
reported marijuana use more than one month and up to more than a year ago, and the
majority (39%) reported marijuana use one year or more ago.

Exploring the Relationship between Drugs and Crime
142
Table SKN3f: Patterns of use – last time used drugs
Time last used drugs
Last 24
hours
Last
week
Last 30
days
>1 mth.
but <1
yr.
1 yr. or
more
Marijuana 1.0 4.3 6.1 14.2 38.7
Cocaine
powder
- - 0.5 1.5 2.5
Crack cocaine - - 0.5 1.5 4.6
Tobacco - - 2.0 7.1 13.0
Alcohol - 1.0 2.5 22.1 27.8
Source: Saint Kitts
Almost no cocaine or crack cocaine use was reported in the last month, but about 4-6%
reported using these drugs more than one month and up to more than a year ago. Offenders
reported almost no tobacco use in the last 24 hours to the last 30 days (2%) and for alcohol
only 3.5%.
How often used drugs (based on lifetime prevalence)
Marijuana was used very often within the last month: 40% four or more times per week,
32% one to three times per week, and 12% one to three times per month (see Table SKN3g).
Most cocaine was used 1-3 times per week (43%). However, 29% of use was four or more
times per week. Crack cocaine use was as frequent as marijuana use, with an even higher
proportion using one to three times per week (45% compared to 32% for marijuana).

Exploring the Relationship between Drugs and Crime
143
Table SKN3g: Patterns of use – how often used drugs
How often used drugs
Less
than
once a
year
Once a
year
1-11
times
per
year
1-3
times
per
month
1-3
times
per
week
4 or
more
times per
week
Marijuana 2.3 5.9 8.2 11.6 31.6 40.4
Cocaine
powder
14.4 - - 14.1 42.9 28.5
Crack cocaine 11.2 - - 11.2 44.5 33.1
Tobacco 3.0 3.0 14.7 14.7 26.4 38.3
Alcohol 2.9 - 8.6+ 8.0 47.4 33.1
Source: Saint Kitts
Who got the offender involved in drug use?
For the most part, offenders got started or involved on their own (62.9%) or through friends
(26.2%) (see Fig. SKN14 below). Contributions of father (1.8%) or brother (3.6%), other
family members (1.2%) and acquaintance, others or neighbors (4.2%) were negligible.

Exploring the Relationship between Drugs and Crime
144
Reasons for using drugs
Most offenders (44%) indicated curiosity as a direct reason for consuming drugs. Some
“other” reason was indicated by 18% of offenders. The next most prevalent reasons, in rank
order were: ‘I thought it would make me feel good’ (12%). ‘I like the idea’ (9%), peer
pressure, (7%) and in order to belong to a group (3.6%). Two females responded: one said
curiosity and the other peer pressure. Males were more likely to indicate curiosity, peer
pressure, ‘to belong to a group’, ‘because I thought it would make me feel good’, and ‘I
liked the idea’.
Table SKN3h: Reasons for using drugs by gender
Reasons for drug use Overall
Percent
Gender
Male Female
Curiosity 44.3 37.8 16.7
Peer pressure 7.0 5.7 16.7
To belong to a group 3.6 3.1 -
Family pressure 1.8 1.5 -
To feel more courageous 2.4 2.1 -
To increase authority or privileges 0.5 0.5 -
It was a way to escape reality 0.6 0.5 -
I like the idea of doing it 0.6 7.7 -
I thought it would make me feel good 12.0 10.4 -
Other 18.7 15.5 33.3
Source: Saint Kitts
Drug use while in prison
One-quarter of offenders (24.4%) indicated that they have used or were using drugs while
incarcerated (these were all males, i.e., 22.7% of all male offenders). Convicted offenders
were as likely as offenders on remand to report using drugs while incarcerated: 24.1% of all
persons on remand versus 21.3% of all offenders who were convicted, p>0.05.

Exploring the Relationship between Drugs and Crime
145
Change in patterns of use
Of those who indicated that they had used or were using drugs while incarcerated (n=72),
only 4.3% (n=3) had started using drugs for the first time while incarcerated. Again, for
those who were using or had used drugs, only two persons indicated changing the type of
substance that they normally would have used outside prison. No indication was given as to
the substance or drug that they had changed to.
Offenders were asked whether the fact that they were in prison caused them to start or
resume using drugs. Of those who indicated drug use while incarcerated, 17.3% or 13
offenders, said “yes”. Some 26% of those who had used or were using in prison responded
that once they started using drugs, they had an uncontrolled urge to keep using.
Of this same group of offenders, 89% (68/76) perceived that they were able to stop using
drugs for a period of time without making a great effort or without feeling bad. Eleven
percent did not share this view.
A notably high proportion of offenders (255/324 or 77.1%) said they were aware of the
physical or mental damage that drug use can cause.
Previous treatment for drug use
Offenders were asked to indicate whether they had ever received treatment by a doctor or
any other professional because of the use of any drugs or substances. A small proportion
(3.1% or 10 persons) indicated that they had previously received treatment for substance
use.
They were also asked about hospitalization for drug use or related mental or physical
complications—eight for consumption and two for mental complications. To complete this
section, offenders were asked if they felt that they presently needed treatment for drugs
currently used, all respondents said that they did not need any treatment.

Exploring the Relationship between Drugs and Crime
146
Saint Kitts and Nevis
Section 4
Relationship between drugs and crime

Exploring the Relationship between Drugs and Crime
147
Relationship between drugs and crime
Very small numbers of both convicted offenders and those on remand responded
affirmatively to the questions that sought to establish a link between their crime and drug
use.
Table SKN4a below shows that all offenders on remand were asked whether they had ever
been convicted and imprisoned for any offense; 39.3% (42 offenders) said ‘yes’. Those who
responded in the affirmative were asked whether the crime for which they were currently on
remand had some type of relationship with drugs: 7.7% (3 offenders) said ‘yes’. The
respondents’ answers to the follow-up questions are indicated in column 3 of the table, and
labeled - on remand.
All convicted offenders were asked whether the crime for which they were currently serving
a sentence had some type of relationship with drugs: 15.3% (33 offenders) said ‘yes’. Of the
convicted offenders whose offense had a relationship with drugs (n=35), responses to the
follow-up questions are indicated in column 2 of the table, and labeled – convicted.
Of those who said that their offense had some type of relationship with drugs:
52.4% of convicted offenders had committed the crime while under the influence of
drugs or intoxication, which compares to 67% of those on remand;
42.9% of convicted offenders indicated that the crime was linked to production,
selling and/or trafficking of drugs, or directly linked to drug trafficking (38%), or to
activities that were against drug laws (76%). This compares to a very small number
of inmates (3 inmates) on remand, but however accounts for 60% who indicated
that the crime was linked to production, selling and/or trafficking of drugs, or
directly linked to drug trafficking (60%), or to activities that were against drug laws
(60%);
About 24% of convicted offenders had commit the crime in order to obtain drugs for
their own use, compared to 33% on remand;
A small proportion of convicted offenders (9.5%) indicated that they had
wilfully/intentionally consumed a substance in order to boost their courage to
commit the crime. This was reported by only two of the offenders on remand in this
group;
A notable proportion of convicted offenders (23.8%) indicated that their crime was
perpetrated on a victim who was under the influence of alcohol or drugs. This
compares to two offenders on remand in the group (33.3%) who also reported this.

Exploring the Relationship between Drugs and Crime
148
Table SKN4a: Relationship between drugs and crime
[Offenders responding “YES” to questions posed]
Items Convicted On
remand
Did the crime you committed have some kind of relationship
with drugs?
33 (15.3) 3 (7.7)
When you committed the crime for which you are currently
imprisoned were you under the influence of a drug or
intoxicated?
18 (52.4) 3 (66.7)
Do you think you would have committed the crime if you
were not under the influence of a drug or intoxicated
(drugged)? (n=18 convicted, and n= 5 for on remand)
5 (27.3) 3 (60.0)
Did you commit the crime for which you are currently
imprisoned in order to get drugs for your own personal use?
8 (23.5) 2 (33.3)
Was (were) the victim(s) of your crime under the influence of
alcohol or other drugs?
8 (23.5) 3 (60.0)
Did you wilfully/intentionally consume a substance in order
to boost your courage to commit the crime for which you are
currently in prison?
3 (9.5) 2 (33.3)
Was the crime for which you are currently imprisoned linked
to the production, selling and/or trafficking of drugs?
15 (42.9) 3 (60.0)
Was the crime for which you are currently imprisoned linked
to drug trafficking?
13 (38.1) 3 (60.0)
Was the crime for which you are currently imprisoned linked
to activities that went against drug laws?
27 (76.2) 3 (60.0)
Source: Saint Kitts

Exploring the Relationship between Drugs and Crime
149
Offense category and relationship between drugs and crime (convicted)
Offenders sentenced for sexual offenses said that the offense committed had some kind of
relationship with drugs, and that the crime was committed while under the influence of drug
or while intoxicated. For this offense category, a small proportion of victims were also
under the influence of drugs or were intoxicated.
Table SKN4b: Offense category and relationship between drugs and crime
Sex
ual
off
ense
Ph
ysic
al
ass
au
lt
Robber
y
Ste
ali
ng
Mali
ciou
s dam
age
Capit
al
crim
es
Dru
g
crim
es
Oth
er
Did the crime you committed have
some kind of relationship with
drugs?
20.0 - 10.0 20.5 - 3.7 75.0 16.5
Crime committed while under the
influence of a drug or intoxicated?
20.0 - 10.0 20.5 - - 12.5 8.3
Would you have committed the
crime if you were not under the
influence of a drug
- - 5.0 13.7 - - - -
Committed crime in order to get
drugs for your own personal use?
- - 5.0 6.8 - - 25.0 4.1
Victim(s) under the influence of
alcohol or other drugs?
13.3 - 5.0 6.8 - - - 4.1
Wilfully/intentionally consume a
substance in order to boost your
courage to commit the crime
- - 5.0 6.8 - - - -
Crime linked to the production,
selling and/or trafficking of drugs?
- - 5.0 6.8 - 3.7 62.5 4.1
Crime linked to drug trafficking? - - 5.0 6.8 - 3.7 50.0 4.1
Crime linked to activities that went
against drug laws?
6.7 - 5.0 20.5 - 3.7 75. 16.5
Source: Saint Kitts

Exploring the Relationship between Drugs and Crime
150
The patterns shown above were also common for offenders convicted of stealing, drug
crimes and “other” crimes. However, higher proportions of those convicted for drug crimes
also indicated that they were linked to drug trafficking, activities that went against drug laws
and to production and or selling of drugs;
In summary, sexual offense, stealing, drug crimes and to a lesser extent robbery indicated
some link to drugs.
Relationship of drugs and crime (male/female differences)
With only six females in the offender population, all affirmative responses to the questions
about the relationship between drugs and crime were those of males.
Importance of the relationship between drugs and crime
Offenders were asked to state their perception of the importance of the relationship between
drugs and crime. The options given were: of little importance, of no importance, somewhat
important, important and very important.
Of those who responded (n=40 or 12.3% of all offenders), most (54.2%) felt it was
important: 21% felt it was very important, 4.2% important, and 29% somewhat important.
About 4% felt it was of little importance and one-fifth (21%) felt it was of no importance. A
notably large proportion (21%) did not know of the importance or did not respond, (figure
SKN15).
Source: Saint Kitts

Exploring the Relationship between Drugs and Crime
151
Saint Kitts and Nevis
Section 5
Perceptions of drug use

Exploring the Relationship between Drugs and Crime
152
Offenders’ perceptions of drug use by fellow inmates
Offenders in Saint Kitts and Nevis were asked to indicate the three drugs most often used by
fellow inmates. The only substance indicated by offenders as the first most important was
marijuana (52.3%), the second most important was alcohol (12.5%), and the third most
important was also alcohol (10%). A small proportion (9%) indicated that cocaine and
tobacco was the second most important.
When asked how many inmates have been seen using drugs or substances in prison, the
majority of offenders said none (50%). About one fifth (22.4%) said many; while 15.6%
said a few; and one or two persons said all.
A moderately small proportion (16%) said they were affected by the use of drugs or
substances in prison. The main reasons indicated related to the health effects of smoke
(asthma, sinus irritation, burning of eyes, headaches, and so forth).
Perception of ease of access to drugs in prison
Less than six of every ten offenders (14.4%) felt that it was easy to obtain drugs or
substances in prison (5.1% very easy and 9.3% easy). However, three times as many (45%)
felt it was difficult—22.9% very difficult and 22.4% difficult. About 40% did not respond
or did not know.
Table SKN5a: Perception of ease of access to drugs in prison by status and type of
offender
How easy to
obtain drugs?
Overall Status Type of Offender
On
remand
Convicted First-
time
Repeat
Easy 14.4 11.2 16.2 10.8 19.7
Difficult 45.3 47.2 44.0 38.3 53.3
Don’t know/NR 40.3 41.7 39.8 51.8 27.0
Source: Saint Kitts
Repeat offenders (19.7%) were significantly more likely to indicate that it was easy to obtain
drugs in prison compared to first-time offenders (10.8%), Χ2=22.87, p<0.01. However, a
notably higher proportion of repeaters also felt it was difficult to obtain drugs compared to
first timers.

Exploring the Relationship between Drugs and Crime
153
With respect to offenders on remand, 11% felt it was easy to obtain drugs compared to 16%
of those that were convicted. Still comparing convicted and those on remand, about the
same proportions felt it was difficult to obtain drugs and almost equal proportions did not
know or did not respond. These differences were not statistically significant.
Perceptions of drug use and violence in prison
Offenders were asked whether they believed that the violence that occurs within the prison
compound is related to drugs (see Fig. SKN16 below). A little more than ten percent
(11.4%) said yes—6.5% indicated slightly, 1.5% moderately, 2% very much so, and 1%
excessively so. Some 79% said that they did not believe violence in prison was related to
drugs, while 10% did not know.
Offenders were also asked whether, in their opinion, the fact of being imprisoned makes a
person use drugs. Just under one-fifth (19.1%) said “yes” and 73% said “no”. About 8% did
not know.
Source: Saint Kitts
Possible causes of fellow inmates’ drug use
Offenders were asked to give their opinion about possible causes that have led inmates to
use drugs (see Table SKN5b below). Forty percent or more positively indicated the
following:
Before entering prison, they already used these drugs (67.5%)
Because they like it (57.9%)
To feel good (52.3%)
To calm their nerves (44.2%)
To escape their problems (42.1%)

Exploring the Relationship between Drugs and Crime
154
In addition, 25-30% of offenders felt the following were causes of drug use by fellow
inmates: problems or family difficulties; nothing else to do; peer pressure by fellow inmates;
and to be accepted by their fellow inmates.
Table SKN5b: Possible causes of fellow inmates’ drug use
Items Yes No Maybe
Before entering prison they already used
these drugs
67.5 4.6 6.6
To escape their problems 42.1 14.8 18.0
Problems or family difficulties 29.9 18.3 22.7
To calm their nerves 47.2 11.2 14.9
To be able to sleep 23.2 30.1 17.9
Nothing else to do 25.5 34.4 11.3
To feel good 52.3 9.7 11.8
Because they like it 57.9 6.1 9.8
Peer pressure by fellow inmates 24.5 38.2 11.6
To increase their control and authority 19.4 38.2 8.8
To increase their privileges or popularity 18.9 40.7 7.8
To be accepted by their fellow inmates 26.1 35.9 8.3

Exploring the Relationship between Drugs and Crime
155
Saint Kitts and Nevis
Section 6
Gang involvement

Exploring the Relationship between Drugs and Crime
156
History of gang involvement
About 14% (46/324) of all offenders in Saint Kitts and Nevis indicated that they were
presently in a gang or had been in a gang previously (see Table SKN6a below). These were
all males and 40.8% were under the age of 15 when their gang activities started. 48% were
in the 15-19 age bracket and 11.2% in the 20 and over age group when gang involvement
began.
Table SKN6a: History of gang involvement/perceptions of gangs in prison
Items Overall On
remand
Convicted Chi-
square
P value
Are you in or have you ever been in a
gang?
14.3 12.0 15.3 0.67 ns
Were you a member of a gang
immediately before your imprisonment?
65.5 61.5 65.7 0.28 ns
Was the crime related in any way to your
involvement/membership of the gang?
20.7 23.1 19.4 0.35 ns
Were you ever imprisoned in the past for
gang related activities?
24.1 38.5 19.4 1.15 ns
Was drug-use a part of your gang
activities before imprisonment?
46.6 61.5 38.2 1.41 ns
Was trafficking in drugs a part of your
gang activities before imprisonment?
55.5 50.0 51.4 0.82 ns
Upon release, how likely are you to
readily get back into gang activities? -
very likely or likely
13.7 28.6 8.8
Are you aware of any gangs in prison,
either now or in the past?
60.4 47.2 67.1 17.35 <0.01
Since imprisonment, have you been
approached to be a member of a prison-
based or outside gang?
11.7 12.0 11.6 0.06 ns
Are you aware of any gang related
activity, which supports the drug trade?
13.7 15.0 13.0 0.02 ns

Exploring the Relationship between Drugs and Crime
157
Of those who were involved with a gang:
65% were gang members immediately before incarceration: 62% of those on remand
compared to 66% of those convicted;
21% indicated that the crime for which they were presently incarcerated was related
to involvement/membership in a gang: 23% of convicted prisoners compared to 19%
of those on remand;
24% were previously imprisoned for gang-related activities: convicted (39%)
compared to those on remand (19%);
47% indicated that drug use was part of their gang activity before imprisonment:
62% of those on remand compared to 38% of those convicted;
56% reported that trafficking was part of their gang activities: 50% of those on
remand compared to 51% of those convicted;
Some 86% of these offenders felt that it was not likely that they would readily
resume gang activities after release. However, 14% felt that it was likely: 29% of
those on remand compared to 9% of those convicted).
Gangs in prison
Six of every ten (60%) offenders said that they were aware of gangs in prison, whether now
or in the past: 47% of those on remand compared to 67% of those convicted. About 12%
said that since incarceration, they had been approached to be a member of a prison-based or
outside gang: 12% of those on remand compared to 12% of those convicted.
Gang activities and the drug trade
About one in seven offenders overall (14%) said they were aware of gang-related activities
that support the drug trade: 15% of those on remand compared to 13% of those convicted.
.

Exploring the Relationship between Drugs and Crime
158
Appendix 3: Results for Dominica
Section 1
Demographics

Exploring the Relationship between Drugs and Crime
159
Table DOM1a: Characteristics of the study population (Dominica)
Age (years) Ethnic origin (which race)
16-24 48(20.6) Black/African 189(81.8)
25-35 74(31.8) White/Caucasian 1(0.4)
36-45 67(28.8 ) East Indian
46-54 35(15.0 ) Mixed race 21(9.0 )
55 -65 8(3.4 ) Indigenous 19(8.2)
Mean age (yrs.) 34.95
Median age (yrs.) 35 Employment (pre-imprisonment)
Age range (yrs.) 56 Unemployed 44(18.9 )
Age (min-max) (yrs.) 16-72 Part-time employee 56(24.0 )
Full-time employee 59(25.3 )
Gender Informal activity (self-
employed)
62(26.6 )
Male 229(98.3) Other 9(3.9 )
Female 4(1.7 )
Trade or profession
Status Professional 2(0.9 )
Convicted 179(76.8 ) Technician 5(2.2 )
On remand 54(23.2 ) Services and sales 5(2.2 )
Skilled (agric., forestry)
Fishery)
49(21.6 )
Union Status Craft and related trade 45(19.8 )
Single 183(80.3 ) Plant and machine operator 8(3.5 )
Married 10(4.4 ) Elementary occupation 36(15.9 )
Widowed Other 65(28.6 )
Divorced 4(1.8 ) None 12(5.3 )
Common law 28(12.3 )
Separated 1(0.4 ) In-prison activity
Visiting relationship 2(0.9 ) School/knowledge programs 13(5.6 )
Education (Schooling) Computer 1(0.4 )
None 3(1.3 ) Bakery 6(2.6 )
Incomplete Primary 46(19.7 ) Cooking 10(4.3 )
Complete Primary 84(36.1 ) Tailoring 1(0.4 )
Incomplete Secondary 64(27.5 ) Welding 2(0.9 )
Complete Secondary 19(8.2 ) Farming 19(8.2 )
Incomplete University Cleaning 3(1.3 )
Complete University 2(0.9 ) Teaching 1(0.4 )
Tech., Voc., Com.
College
13(5.6 ) Administrative 1(0.4 )
Construction/carpentry 30 (13.0 )
Which country born Arts and craft 10 (4.3 )
Dominica national 222(95.3 ) Other 33 (14.3 )
Other nationality 11(4.7 ) None 101(43.7 )

Exploring the Relationship between Drugs and Crime
160
Age
The mean age of offenders overall was 34.9 years and the median age was 35. The ages of
offenders ranged from 16 years to 72 years, a range of 56 years. About one-fifth (20.6%) of
all offenders were 24 years or younger and 75% were 43 years and under. By age group,
table DOM1a shows that most offenders were in three age brackets: 16-24 (21%), 25-35
(32%) and 36-45 (29%). Fifteen percent were in the 46-54 age group, and three percent
were in the 55-65 age bracket (the oldest age cohort).
Source: Dominica
Gender and age group
The majority of offenders were males (98.3%) and only 1.7% were females (four females
only). One-fifth of all male offenders were in the 16-24 age bracket (20.5%), with 31% in
the 25-35 age group (see table DOM1b), followed by the 36-45 age group (29.3%). About
18% of male offenders were older than 45 years. In comparison, one female was in the 16-
24 age bracket, two or 50% were between 25 and 35 years of age, and the remaining female
offender was in the 46-54 age group.

Exploring the Relationship between Drugs and Crime
161
Table DOM1b: Percentage distribution: age group, gender and status
Age Group Male Female On remand Convicted
16-24 20.5 25.0 37.0 15.6
25-35 31.4 50.0 25.2 30.7
36-45 29.3 - 13.0 33.5
46-54 14.8 25.0 9.3 16.8
55-65 3.5 - 3.7 3.4
Source: Dominica
Status of prisoners
More than three-quarters of the offending population were convicted prisoners (76.8%),
while 23.2% were on remand. A similar pattern was observed for males (77% were
convicted and 23% were on remand), and three of the four females (75%) were convicted
offenders.
Age group and status
More than seven of every ten offenders (72%) on remand were in the two youngest age
groups, with 13% in the 36-45 age group (see table DOM1b). A slightly lower proportion of
convicted offenders (46%) were in the two youngest age groups, and 34% in the 36-45 age
bracket. About 20% of convicted offenders were older than 45 years.
Source: Dominica

Exploring the Relationship between Drugs and Crime
162
Union status
The majority of offenders were single (80.3%) while 4.4% were married and 2.2% were
widowed, divorced, or separated. About 12.3% were living in common-law relationships.
Education
All offenders except three had some form of schooling (see Fig. DOM5 below). Slightly less
than one-fifth (19.7%) had not completed primary school, while more than one-third (36%)
had completed primary schooling. More than one-fifth (27.5%) had not completed
secondary level and less than 10% had completed secondary level schooling. A small
proportion had completed technical or community college (5.6%). This translates into about
15% who had completed secondary level or higher, and some 85% who had not completed
primary or secondary level schooling at time of incarceration.
Source: Dominica
Ethnicity and nationality
Most offenders were of African origin (82%). There were also offenders in the indigenous
category (8.2%), and 9% of “mixed” race and one “other” race.

Exploring the Relationship between Drugs and Crime
163
The majority of offenders were nationals of Dominica (95%), with 5% nationals of other
countries (four other Caribbean nationals and seven foreign nationals).
Pre-incarceration employment status
Offenders overall were asked to state their pre-incarceration work situation. About a quarter
(25%) indicated full-time employment, while 24% were in part-time employment and
another 19% were unemployed. A little more than one-fifth (27%) were self-employed.
Source: Dominica
Cross tabulation in Table DOM1c below shows the pre-incarceration employment status of
both convicted and remanded offenders in Dominica. One-third of convicted offenders were
in full-time employment (33%), and 26% were employed part-time. About 15% were
unemployed and a further 22% were involved in informal activities (self-employed). For
offenders on remand, slightly more than one-fifth (23%) were employed full-time, 24% part-
time, 20% were unemployed and some 28% were self-employed.
Table DOM1c: Employment (pre-incarceration) status
Employment status Convicted On remand
Unemployed 14.8 20.1
Part Time 25.9 23.5
Full Time 33.3 22.9
Informal activity (self-
employed)
22.2 27.9

Exploring the Relationship between Drugs and Crime
164
Income
Just under a third of all offenders (32%) indicated a monthly income of XCD$1000 or more
before being incarcerated. 8% were not earning a monthly income or did not know what
their income was. However, most others (60%) indicated an income of less than XCD$1000
a month (see table DOM1d).
Table DOM1d: Amount of income before incarceration and during imprisonment
Income (XCD$) Monthly
income before
incarceration
Current
monthly family
income
Less than XCD$ 500 40 (17.6) 21 (14.1)
Between XCD$ 500 and less than XCD$
600
31 (13.7) 5 (3.4)
Between XCD$ 600 and less than XCD$
700
19 (4.0) 5 (3.4)
Between XCD$ 700 and less than XCD$
800
14 (6.2) 1 (0.4)
Between XCD$ 800 and less than XCD$
900
13 (5.7) -
Between XCD$ 900 and less than XCD$
1000
30 (13.2) 5 (3.4)
XCD$ 1000 or more 72 (31.7) 16 (10.70
Does Not Know/NR 4 (1.8) 96 (64.4)
None 14 (6.2) -
Source: Dominica
Other demographics
Religion – Eighty percent of offenders (185/233) said that they practiced a religion while
20% did not. Most offenders were predominantly Baptist, Roman Catholic and Seventh Day
Adventist.

Exploring the Relationship between Drugs and Crime
165
Children and family - Offenders were asked whether they had any children: 56% said yes
and 44% said no. Of those indicating that they had children, 72% indicated that they had
male children, and 72% said they had female children.
Seventy-four percent of offenders indicated that they kept in touch with their family while
26% did not (table DOM1e). There was no statistically significant difference between
convicted prisoners and those on remand (73.4% versus 76.5%) or between males and
females (74.1% versus 75%) with respect to keeping in contact with family members
(p>0.05).
Table DOM1e: Offenders’ contact with family members
In touch
with
family?
Overall Male Female
On
remand
Convicted
Yes 74.1 74.1 75.0 73.4 76.5
No 24.9 25.9 25.0 26.6 23.5
Source: Dominica

Exploring the Relationship between Drugs and Crime
166
Dominica
Section 2
Criminal history and criminal offending

Exploring the Relationship between Drugs and Crime
167
Criminal offending
Table DOM2a shows that the offenses most often reported by those offenders who were
currently sentenced, in rank order, were stealing, physical assault, robbery, drug crimes,
capital crimes, and sexual offenses. For offenders who reported previous offenses (n=149 or
67.4% of the population), the most frequent offenses were drug crimes, stealing, physical
assault, and “other” offenses.
Table DOM2a: Offense types (current sentence and previous offense)
Offense category Current
sentence
Previous
offense
Sexual offense 11 (4.7) 1 (0.7)
Physical assault 34 (14.6) 21 (20.8)
Robbery 19 (8.2) 31 (14.1)
Stealing 54 (23.2) 34 (22.8)
Malicious damage 6 (2.6) 5 (3.4)
Capital crimes 17 (7.3) 3 (2.0)
Drug crimes 18 (7.7) 38 (25.5)
Other 20 (8.6) 16 (10.7)
On remand 54 (23.2)
Source: Dominica
Of the three convicted female offenders, one was currently sentenced for robbery, and two
for capital crimes. Males were more likely to be sentenced for capital crimes, robbery,
stealing, physical assault, drug crimes and to a lesser extent sexual offenses.
Repeat offending
Table DOM2b: Repeat offenders by status
Is this your first
sentence?
Convicted
(n=179)
Remand
(n=54)
Overall
(n=233)
Yes (first offenders) 38.0 40.7 38.6
No (repeat offenders) 62.0 59.3 61.4
Source: Dominica
Slightly than six out of every ten offenders were repeat offenders (61.4%). Some 62% of
convicted prisoners indicated that this was not the first time they had been sentenced. An
equally high proportion of those on remand also indicated that they had been sentenced
before (59.3%), p>0.05.

Exploring the Relationship between Drugs and Crime
168
Source: Dominica
Frequency of imprisonment (overall) n=151
The mean number of times imprisoned was 4.71 ± 4.19 with a median of 3.0 times.
Seventy-five percent of offenders had been imprisoned for up to five times, and 25% had
been imprisoned six or more times.
Age of first offense
The mean age of first offense reported was 23.6 years ± 9.44 years. The median age was 21
years and the ages of first offense had a range of 59 years. About 30% of offenders had
offended before the age of 18 years, and 75% had offended by age 28 years.
The age of first offense for males was very similar to that of females (23.6 versus 23.2
years), which is not statistically different, p>0.05. However, there was a significant
difference in the age of first offense of prisoners on remand (20.7 years) and convicted
prisoners (24.5 years), p<0.05 – ANOVA test.
Table DOM2c: Comparison of age of first offense by gender and status
Mean and Std. Dev.
(yrs.) Overall 23.68 ±9.44
Gender (p>0.05)
Male 23.69 ± 9.48
Female 23.25 ± 7.50
Status (p>0.05)
Remand 20.78 ± 9.09
Convicted 24.50 ± 7.50
Type of Offending
(p<0.01)
First-time offender 26.42 ± 11.27
Repeat offender 21.22 ± 8.09
Source: Dominica

Exploring the Relationship between Drugs and Crime
169
Other previous offenses (accused or sentenced)
Some 67.4% (157/233) of offenders (68% of males and 25% of females, i.e. one female)
reported previous offenses for which they had either been charged or sentenced. About
3.8% (6/157) of offenders who were charged or sentenced for previous offenses were
imprisoned in a Youth Detention Centre because they were minors at the time of offending.
These six offenders were all males. Of the six offenders, 5 or 83% were sent to the Youth
Detention Centre once; and the other twice.
Family members and criminal activities
Offenders were asked whether they had any family members who were engaged in criminal
activities (see Fig. DOM8 and Table DOM2d below). More than one-third of all offenders
(34.8%) reported that they had family members who are or were involved in criminal
activities—34% of males compared to 75% of female, p>0.05; and 37% on remand
compared to 34% convicted, p>0.05.
Source: Dominica
For the most part, brothers (13.7%), uncles (8.2%), and some other family member (12%)
were the family members primarily indicated (Figure DOM9). Mothers, sisters and aunts
were also reported as family members being involved in criminal offending.

Exploring the Relationship between Drugs and Crime
170
Offense category for family members
Table DOM2d: Frequency of family members in criminal activities by offense
category.
Offense category Father
/mother
Brother
/sister
Uncle Other
Sexual offense 2 1 - -
Physical assault - 3 2 4
Robbery - 1 - 5
Stealing 3 10 4 7
Malicious
damage
- - - -
Capital crimes 1 8 2 4
Drug crimes 4 6 3 1
Other - 1 2 2
Source: Dominica
Table DOM2d shows the frequency of family members involved in criminal activities by
offense categories. The reported offenses in rank order for each family member involved is
shown below:
Father/mother – drug crimes, stealing, sexual offenses and capital crimes;
Brother/sister – stealing, capital crimes, drug crimes, and physical assault;
Uncle – stealing, drug crimes, capital crimes, and other crimes; and
Other family members – stealing, robbery, physical assault, and capital crimes.
Source: Dominica
Figure DOM9: Family Members and Criminal
Activities
brother
uncle
other family
father

Exploring the Relationship between Drugs and Crime
171
Frequency of offending by family members
When asked about the frequency with which family members offend, a large proportion of
offenders did not know or did not respond to this question (39%). Thirty-two percent said
less than once per year, 20% said once per year and 9% said once per month.

Exploring the Relationship between Drugs and Crime
172
Dominica
Section 3
Drug use

Exploring the Relationship between Drugs and Crime
173
Drug use
Table DOM3a presents self-reported lifetime prevalence of various drugs (both licit and
illicit) among prison inmates in Dominica, and shows cross-tabulations by selected
demographic variables.
Table DOM3a: Self-reported drug use (lifetime prevalence) by selected demographic
variables
Mari Coc Crack Any
illicit
Alc Tob
Overall 85.8 28.3 26.2 87.1 66.1 76.4
Age Group (years)
16-24 87.5 12.5 10.4 87.5 62.5 79.2
25-35 85.1 27.0 21.6 87.8 62.2 73.0
36-45 85.1 35.8 40.3 86.6 70.1 80.6
46-54 91.4 40.0 34.3 91.4 68.6 77.1
55 -65 75.0 25.0 12.5 75.0 75.0 62.5
Gender
Male 86.9 28.8 26.2 88.2 66.4 77.0
Female 25.0 - 25.0 25.0 50.0 -
Type of Offending
First time 77.8 13.3 12.2 77.8 70.0 64.4
Repeat
(recidivist)
90.9 37.8 35.0 93.0 63.6 83.9
Status
On Remand 79.6 14.8 18.5 79.6 55.6 70.4
Convicted 87.7 32.4 28.5 89.4 69.3 78.2
Offense Category

Exploring the Relationship between Drugs and Crime
174
Sexual offense 90.9 18.2 18.2 90.9 54.5 81.8
Physical assault 91.2 23.5 14.7 94.1 76.5 91.2
Robbery 78.9 42.1 36.8 84.2 73.7 78.9
Stealing 92.6 40.7 38.9 94.4 68.5 83.3
Malicious
damage
83.3 50.0 33.3 83.3 66.7 66.7
Capital crimes 64.7 17.6 17.6 64.7 64.7 52.9
Drug crimes 94.4 16.7 33.3 94.4 72.2 61.1
Other 90.0 45.0 25.0 90.0 65.0 80.0
Source: Dominica
Lifetime prevalence
As shown in Fig. DOM10 below, the most prevalent drug reported ever used by offenders
was marijuana. About 86% of all offenders had used marijuana in their lifetime. This was
followed by tobacco (76.4%) and alcohol (66.1%). Cocaine was the second most prevalent
illicit drug used—some 28.3% of lifetime use was reported and 26.2% reported lifetime use
of crack cocaine. A small proportion reported non-prescription use of medication (1.7%)
while 3% inhalant use and 3% heroin use was reported. “Any illicit drug use” was
computed to give a lifetime prevalence of 87.1%.

Exploring the Relationship between Drugs and Crime
175
Source: Dominica
Gender and lifetime drug use
Some 87% of males compared to 25% of females reported lifetime marijuana use; cocaine
use was reported only by male offenders—28.8%. However, 26% of crack cocaine was
reported by males and 25% by females, while 66.4% of males versus 50% of females
reported lifetime alcohol use. Tobacco use was reported by 77.7% of males compared to no
lifetime use reported by females. There was no significant difference between males and
females with respect to reported lifetime drug use prevalence (p>0.05 on chi square test).
Repeat offending and lifetime drug use
Some 78% of first time offenders compared to 91% of repeat offenders reported lifetime
marijuana use (p<0.01). Cocaine use was reported by 13.3% of first-time offenders and
37.8% of repeat offenders (p<0.01). Some 12.2% of first-time offenders versus 35% of
repeat offenders reported crack cocaine use (p<0.01); and 70% of first-time offenders versus
63.6% of repeat offenders reported lifetime alcohol use (p>0.05). In addition, 64.4% of
first-time offenders versus 83.9% of repeat offenders reported tobacco use (p<0.01).
Table DOM3b: Relationship between type of offending and lifetime drug use
Type of Offending Marijuana Cocaine Crack Alcohol Tobacco
First-time 77.8 13.3 12.2 70.0 66.4
Repeat
(recidivist)
90.9 37.8 35.0 63.6 83.9
Chi square (χ2) 7.78 16.23 14.78 0.99 11.61
p-value < 0.01 <0.01 < 0.01 >0.05 < 0.01
Source: Dominica
Reported lifetime prevalence (for marijuana, cocaine, crack cocaine and tobacco) among
first-time offenders was significantly different statistically from that reported by repeat
offenders, (p<0.01 on chi square test).

Exploring the Relationship between Drugs and Crime
176
Source: Dominica
Age and lifetime drug use
Lifetime marijuana use was notably high among all age groups (75-91%). Cocaine
prevalence ranged from 13-40% among all age brackets, with the lowest reported prevalence
in the 16-24 age bracket. A prevalence of 40% was reported in the 46-54 age bracket.
Lifetime prevalence of crack cocaine use was also high, ranging from 10-40%, with the 36-
45 age group at 40% and the 46-54 ages group at 34%. Minimal use of crack cocaine was
reported in the 16-24 age grouping (10.4%). Lifetime alcohol and tobacco use was high
among all age groups: 62-75% for alcohol and 63-81% for tobacco.
Status (on remand vs. convicted) and lifetime drug use
As shown in Fig. DOM12 below, 80% of offenders on remand compared to 88% of
convicted offenders reported lifetime marijuana use. 15% of those on remand versus 32.4%
of those convicted reported cocaine use (χ2=6.32, p<0.05); 18.5% of offenders on remand
versus 28.5% of convicted offenders reported crack cocaine use; and 56% of those on
remand versus 69% of convicted reported lifetime alcohol use. Tobacco use was reported
by 70% of offenders on remand compared to 78% for those convicted. There was no
statistically significant difference between offenders on remand and those convicted with
respect to reported lifetime prevalence except for cocaine use.

Exploring the Relationship between Drugs and Crime
177
Source: Dominica
Offense categories and lifetime drug use
Lifetime marijuana use was notably high among all offense categories (65-94%). The
highest proportions were reported for drug crimes and stealing. For cocaine use, offenders
who committed malicious damage, stealing and robbery reported the highest prevalence. A
similar pattern was noted for crack cocaine, with the highest prevalence reported for the
offense of stealing (39%) followed by robbery (37%), drug crimes (33%), malicious damage
(33%), and other offenses (25%).
Lifetime alcohol use was notably high among all offense categories (55-77%) with the
highest prevalence in the case of physical assault (77%), robbery (74%) and drug crimes
(72%). Tobacco use followed the same pattern with over 80% prevalence in the physical
assault, sexual offenses, and stealing categories.
Lifetime prevalence and educational level attained
Lifetime use of marijuana was high regardless of educational level, but more so at those
levels up to secondary school, this prevalence ranged from 84-92%. Interestingly, offenders
with no schooling reported lower lifetime prevalence (67%) than those at the primary and
secondary level. All other reported prevalence ranged between 46% and 50%. Alarmingly
high proportion of offenders at all education levels reported lifetime prevalence of cocaine
and crack cocaine use, with the exception of those with technical or community college level
education.
Lifetime prevalence and work situation
Again, marijuana use dominated in all work categories, with prevalence ranging from 78%
to 93%, with the highest among part-time employees (93%). Cocaine and crack cocaine use
was highest among the unemployed (36% and 38% respectively). This was followed by the

Exploring the Relationship between Drugs and Crime
178
self-employed (31% cocaine and 29% crack cocaine), part-time employees (23% cocaine
and 25% crack cocaine), and full-time employees (24% cocaine and 17% crack cocaine).
Table DOM3c: Self-reported drug use (lifetime prevalence) by other selected
demographic variables
Source: Dominica
Reported age of first use - initiation rates
In this study, all initiation rates are based on offenders who reported having used a substance
at least once in their lifetime. The mean age of first use for licit substances (alcohol (16.5
years) and tobacco (17.7 years) was slightly higher than that of the main illicit drug
marijuana (15.6 years) (see Table DOM3d below). Tobacco use (median initiation age of 16
years) was started at about the same time as alcohol use (median initiation age of 16 years).
Marijuana use was initiated at an earlier age than alcohol and tobacco – the median age of
first use for marijuana was 15 years. Fifty percent of marijuana use was initiated by the age
of 15, which was one year earlier than that proportion of alcohol or tobacco use.
The mean age of initiation for cocaine powder was 22 years compared to crack cocaine
(21.9 years). The mean age of initiation reported for any illicit drug followed the pattern
observed for marijuana (15.7 years). The initiation age for heroin was notably later (mean
age of 25.2 years), and that of inhalants was 16.2 years.
Marijuana Cocaine Crack
cocaine Employment pre-incarceration
Unemployed 86.4 36.4 38.6
Part-time employee 92.9 23.2 25.0
Full-time employee 81.4 23.7 16.9
Informal/self-employed 83.9 30.6 29.0
Other
Education (Schooling)
Incomplete primary 84.9 23.9 28.3
Complete primary 89.3 38.1 34.5
Incomplete secondary 92.2 26.6 20.3
Complete secondary 84.2 21.1 15.8
Complete university 50.0 50.0 -
Tech., Voc., Com. College 46.2 - -

Exploring the Relationship between Drugs and Crime
179
Table DOM3d: Reported age of first use – overall
Age of first use
Mean
(yrs.)
Median
(yrs.)
75th
percentile
(yrs.)
Marijuana 15.6 15.0 17.0
Cocaine 22.0 20.0 27.0
Crack 21.9 20.0 26.0
Inhalants 16.2 16.0 20.0
Heroin 25.2 24.5 33.0
Any Illicit Drug 15.7 15.0 17.0
Alcohol 16.5 16.0 18.0
Tobacco 17.7 17.0 18.0
Source: Dominica
.
Source: Dominica
The age of initiation at the seventy-fifth percentile serves to illustrate that 75% of all use had
already taken place by that age. In relation to first use, as shown in table DOM3d above, it
can be inferred that:

Exploring the Relationship between Drugs and Crime
180
75% of all tobacco first use had taken place by the age of 19
75% of all alcohol use had taken place by the age of 18
75% of all marijuana use had taken place by age 17
75% of all crack cocaine use had taken place by age 27
75% of all cocaine powder use had taken place by age 27
75% of all inhalants use had taken place by the age of 20
75% of any illicit drug use had taken place by the age of 18
Initiation rates by age group
Table DOM3e below shows the distribution of the rate of first use for five different age
groups: under 10, 10-14, 15-19, 20-24 and 25 and over. Those who did not know or could
not recall were omitted from the tabulations.
Interestingly, all the substances were reported initiated before the age of 10 years
(particularly tobacco and marijuana, which were the most prevalent illicit substances self-
reported). In addition, with the exception of cocaine and crack cocaine, 30-38% of all other
substance use was initiated between the ages of 10-14. Substantial proportions of use of all
substances were initiated between 15-19 years of age (around 33-43%).
Table DOM3e: Initiation rates - age of first use (by age group)
Percentage of use by reported age (yrs.)
< 10 10-14 15-19 20-24 > = 25
Marijuana 5.8 37.9 41.0 9.5 5.8
Cocaine powder 1.6 8.2 32.8 24.6 32.8
Crack cocaine 1.8 7.1 35.7 25.0 30.4
Any illicit drug 6.1 37.8 39.8 9.2 7.1
Alcohol 2.2 35.6 42.9 11.2 8.1
Tobacco 5.1 29.3 41.4 11.5 12.7
Source: Dominica

Exploring the Relationship between Drugs and Crime
181
Source: Dominica
Last time used drugs
Table DOM3f: Patterns of use – last time used drugs
Time last used drugs
Last 24
hours
Last
week
Last 30
days
>1 mth.
but < 1
yr.
1 yr. or
more
Marijuana 9.0 5.6 12.4 24.5 33.5
Cocaine
powder
- 0.4 0.4 5.6 15.9
Crack cocaine - - 1.7 6.9 12.4
Tobacco 56.2 1.3 2.6 7.3 3.4
Alcohol 1.3 - 7.3 21.0 27.5
Source: Dominica
A moderately small proportion of offenders reported using marijuana over the last month
(27% or just over one-quarter). Nine percent reported use in the last 24 hours, 6% in the last
week and about 12% in the last 30 days. About 25% reported marijuana use more than one
month and up to a year ago, and the largest proportion (34%) reported marijuana use one
year or more ago. Almost no cocaine or crack cocaine use was reported in the last month,
but about 6-7% reported using these drugs up to more than a year ago. Offenders reported a

Exploring the Relationship between Drugs and Crime
182
notably high proportion of tobacco use in the last 24 hours (56%) but very little thereafter—
last 30 days (2.6%). For alcohol, only 7.3% reported use in the last 30 days.
How often used drugs (based on lifetime prevalence)
As shown in Table DOM3g below, marijuana was used often within the last month: 57%
four or more times per week, 20% one to three times per week, and another 20% one to
three times per month. Most cocaine use was at the rate of four or more times per week
(59%). However, 27% of use was 1-3 times per week or per month. Crack cocaine use was
reported by an even higher proportion at four or more times per week (80%) compared to
marijuana use.
Table DOM3g: Patterns of use – how often used drugs
How often used drugs
< once
a year
once a
year
1-11
times
per
year
1-3
times
per
month
1-3
times
per
week
4 or
more
times per
week
Marijuana - 2.2 2.2 19.6 19.6 56.5
Cocaine
powder
- 9.1 4.5 18.2 9.1 59.1
Crack cocaine - - 6.7 6.7 6.7 80.0
Tobacco - - - 5.8 18.1 76.1
Alcohol - 2.0 7.8 17.6 47.1 25.5
Source: Dominica
Who got the offender involved in drug use?
For the most part, offenders got started or involved on their own (45.6%) or through friends
(46.9%). Contributions of father (1.8%) or brother (0.9%), other family members (2.6%)
and acquaintances, others or neighbors (1.8%) were negligible.

Exploring the Relationship between Drugs and Crime
183
Reasons for using drugs
Most offenders (48%) reported curiosity as a direct reason for consuming drugs (see Table
DOM3h below). Some “other” reason was reported by 5% of offenders. The next most
prevalent reasons, in rank order, were peer pressure, (12.7%), ‘I thought it would make me
feel good’ (11%), ‘to belong to a group’ (5.3%), family pressure (5.3%) and ‘to feel more
courageous’ (5%). Females gave as their reasons curiosity and peer pressure. Males were
more likely to indicate curiosity, peer pressure, and ‘because I thought it would make me
feel good’.
Table DOM3h: Reasons for using drugs by gender
Reasons for drug use Overall
percent
Gender
Male Female
Curiosity 48.2 47.2 50.0
Peer pressure 12.7 12.2 25.0
To belong to a group 5.3 5.2 -
Family pressure 5.3 5.2 -
To feel more courageous 4.8 4.8 -
To increase control/authority/privileges 1.3 1.3 -
It was a way to escape reality 1.8 1.7 -
I like the idea of doing it 3.9 3.9 -
I thought it would make me feel good 11.4 11.4 -
Other 5.3 5.2 -

Exploring the Relationship between Drugs and Crime
184
Drug use while in prison
Just about two-third of prison inmates in Dominica (65.8%) reported that they have used or
were using drugs while incarcerated (these were all males, i.e., 67% of all male offenders).
Convicted offenders were as likely as offenders on remand to report using drug while
incarcerated: 61.1% of all persons on remand versus 67.2% of all offenders who were
convicted, p>0.05.
Change in patterns of use
Of those who reported that they had used or were using drugs while incarcerated (n=152),
one-fifth (20.3% or 30 persons) had started using drugs for the first time while incarcerated.
Again, for those who were using or had used drugs, 24% (35 persons) reported changing the
type of substance that they normally would have used outside prison. There were some
indications of changing to marijuana.
Offenders were asked whether the fact that they were in prison caused them to start or
resume using drugs. Of those who reported drug use while incarcerated, 24% or 37
offenders, said yes. Some 43% of those who had used or were using in prison responded
that once they started using drugs, they had an uncontrolled urge to keep using.
Of this same group of offenders, 84% perceived that they were able to stop using drugs for a
period without making a great effort or without feeling bad. Fourteen percent did not share
this view.
A notably high proportion of all offenders (90%) said they were aware of the physical or
mental damage that drug use causes.
Previous treatment for drug use
Offenders were asked to indicate whether they had ever received treatment by a doctor or
any other professional because of their use of any drugs or substances. A small proportion
(10% or 23 persons) reported that they had previously received treatment for substance use.
They were also asked about hospitalization for drug use or related mental or physical
complications: 14 for drug use and 5 for mental disorders. To complete this section,
offenders were asked whether they felt that they presently needed treatment for drugs
currently used, and 14.6% of all respondents said that they did need treatment.

Exploring the Relationship between Drugs and Crime
185
Dominica
Section 4
Relationship between drugs and crime

Exploring the Relationship between Drugs and Crime
186
Relationship between drugs and crime
Very small numbers of both convicted offenders and those on remand responded in the
affirmative to questions that sought to establish a link between their crime and drug use (see
Table DOM4a below).
Offenders on remand were asked if they had ever been convicted and imprisoned for any
offense, and 54.7% said ‘yes’. Those who responded affirmatively (n=29) were asked
whether the crime for which they were currently on remand had some type of relationship
with drugs, and 22.6% said ‘yes’. The respondents’ answers to the follow-up questions are
indicated in column 3 of the table, and labeled - on remand.
Convicted offenders were asked whether the crime for which they were currently serving a
sentence had some type of relationship with drugs, and 41.3% said ‘yes’. The convicted
offenders’ responses to the follow-up questions are indicated in column 2 of the table, and
labeled – convicted.
Of those who said that their offense had some type of relationship with drugs:
29% of convicted offenders had committed the crime while under the influence of
drugs, which compares to 23% of those on remand;
20% of convicted offenders reported that the crime was linked to production, selling
and/or trafficking of drugs, or directly linked to drug trafficking (15%), or to
activities that were against drug laws (23%). This compares to a very small
proportion (3.7%) of those on remand who reported that the crime was linked to
production, selling and/or trafficking of drugs, or directly linked to drug trafficking
(3.7%), or to activities that were against drug laws (5.6%);
About 16% of convicted offenders had commit the crime in order to obtain drugs for
their own personal use compared to 20% on remand;
A small proportion of convicted offenders (3.4%) reported that they had
wilfully/intentionally consumed a substance in order to boost their courage to
commit the crime. This was not indicated by those on remand;
Again, a very small proportion of offenders (5.6% convicted only) reported that their
crime was perpetrated on a victim that was under the influence of alcohol or drugs.

Exploring the Relationship between Drugs and Crime
187
Table DOM4a: Relationship between drugs and crime
[Offenders responding “YES” to questions posed]
Items Convicted On
remand
Did the crime you committed have some kind of relationship
with drugs?
74 (41.3) 7 (22.6)
When you committed the crime for which you are currently
imprisoned were you under the influence of a drug or
intoxicated?
52 (29.1) 7 (22.6)
Do you think you would have committed the crime if you
were not under the influence of a drug or intoxicated
(drugged)?
15 (8.4) -
Did you commit the crime for which you are currently
imprisoned in order to get drugs for your own personal use?
29 (16.2) 6 (19.5)
Was (were) the victim(s) of your crime under the influence of
alcohol or other drugs?
10 (5.6) -
Did you wilfully/intentionally consume a substance in order
to boost your courage to commit the crime for which you are
currently in prison?
6 (3.4) -
Was the crime for which you are currently imprisoned linked
to the production, selling and/or trafficking of drugs?
35 (19.6) 2 (3.7)
Was the crime for which you are currently imprisoned linked
to drug trafficking?
26 (14.5) 2 (3.7)
Was the crime for which you are currently imprisoned linked
to activities that went against drug laws?
41 (22.9) 3 (5.6)
Source: Dominica

Exploring the Relationship between Drugs and Crime
188
Offense category and relationship between drugs and crime (convicted)
Convicted offenders sentenced in all offense categories said that the offense committed did
have some kind of relationship with drugs, and that the crime was committed while under
the influence of drugs or while intoxicated. In addition, for all offense categories, offenders
also reported that the crime was linked to activities that went against the drug laws, or that
they committed the crime in order to obtain drugs for their own use.
In summary, sexual offenses, physical assault, robbery stealing, capital crimes and drug
crimes were all linked to drugs in one way or another.
Table DOM4b: Offense category and relationship between drugs and crime
Sex
ual
off
ense
Ph
ysic
al
ass
au
lt
Robber
y
Ste
ali
ng
Mali
ciou
s dam
age
Capit
al
crim
es
Dru
g
crim
es
Oth
er
Did the crime you committed have
some kind of relationship with drugs?
36.4 35.3 47.4 40.7 33.3 23.5 100.0 15.0
Crime committed while under the
influence of a drug or intoxicated?
36.4 23.5 36.8 29.6 33.3 17.7 50.0 15.0
Would you have committed the crime if
you were not under the influence of a
drug
- 2.9 5.3 5.6 16.7 11.8 33.3 5.0
Committed crime in order to get drugs
for your own personal use?
- 8.8 31.6 4.1 16.7 5.9 22.2 5.0
Victim(s) under the influence of
alcohol or other drugs?
- 11.8 - 1.9 - 17.7 11.1 -
Wilfully/intentionally consume a
substance in order to boost your
courage to commit the crime
- - 10.5 3.7 16.7 - 5.7 --
Crime linked to the production, selling
and/or trafficking of drugs?
- 17.6 21.1 14.8 16.7 11.8 77.9 -
Crime linked to drug trafficking? - 11.6 15.8 9.3 16.7 5.9 66.7 -
Crime linked to activities that went
against drug laws?
18.2 17.6 21.1 14.8 16.7 17.7 94.4 -
Source: Dominica

Exploring the Relationship between Drugs and Crime
189
Relationship of drugs and crime (male/female differences)
There were four females offenders. However, all affirmative responses to the questions
related to the relationship between drugs and crime were those of males.
Importance of the relationship between drugs and crime
Offenders were asked to state their perception of the importance of the relationship between
drugs and crime. The options given were: of little importance, of no importance, somewhat
important, important and very important.
Of those who responded (n=80 or 34.3% of all offenders), most (75%) felt it was
important—57.5% felt it was very important and 17.5% important. About 6.3% felt it was
of little importance and 13.8% felt it was of no importance. A small proportion (5%) did not
know of the importance or did not respond (figure DOM16).
Source Dominica

Exploring the Relationship between Drugs and Crime
190
Dominica
Section 5
Perceptions of drug use

Exploring the Relationship between Drugs and Crime
191
Offenders’ perceptions of drug use by fellow inmates in Dominica
Offenders were asked to indicate the three drugs most often used by fellow inmates. The
only illicit substance reported by offenders as the first most important was marijuana
(14.2%), but 71% also mentioned tobacco as the most important. The second most
important were also marijuana and tobacco and the third most important was crack cocaine
or cocaine.
When asked how many inmates were seen using drugs or substances in prison, the majority
of offenders said many (57.8%). About 19% said few, while 14.7% said all. About 5% said
none and 4.3% did not know or did not respond.
A moderately small proportion (26%) said they were affected by the use of drugs or
substances in prison. The main reasons reported related to the health effects of smoke
(asthma, sinus irritation, burning of eyes, headaches, and so on, or because they found it
offensive).
Perception of ease of access to drugs in prison
More than four of every ten offenders (43.4%) felt that it was easy to obtain drugs or
substances in prison (20.4% very easy and 23% easy) (see Table DOM5a below). However,
just about half (50.9%) felt it was difficult (12.6% very difficult and 38.3% difficult). About
5.7% did not respond or did not know.
Table DOM5a: Perception of ease of access to drugs in prison (status and type of
offender)
How easy to
obtain drugs?
Overall Status Type of Offender
On
remand
Convicted First-
time
Repeat
Easy 43.4 35.9 45.8 42.0 44.3
Difficult 50.9 52.8 50.3 48.8 52.1
Don’t know/NR 5.7 11.3 4.0 9.1 3.5
Source: Dominica
Repeat offenders (44.3%) were as likely to indicate that it was easy to obtain drugs in prison
as first-time offenders (42%), p>0.05. Not many more repeaters compared to first-timers felt
it was difficult to obtain drugs (52% versus 49%).

Exploring the Relationship between Drugs and Crime
192
With respect to offenders on remand, 36% felt it was easy to obtain drugs compared to 46%
of convicted prisoners. About the same proportions felt it was difficult to obtain drugs but a
higher proportion of those on remand did not know or did not respond. These differences
were not statistically significant.
Perceptions of drug use and violence in prison
Offenders were asked whether they believed that the violence that occurs within the prison
compound is related to drugs (Fig. DOM17). About one-third (32.3%) said yes: 13%
indicated slightly, 6.6% moderately, and 12% very much so. Some 63% said that they did
not believe violence in prison is related to drugs and 4.4% did not know.
Offenders were also asked whether, in their opinion, the fact of being imprisoned makes a
person use drugs. More than one-third (39%) said yes and 60% said no. About 1% did not
know.
Source: Dominica
Possible reasons for fellow inmates’ drug use
Offenders were asked to give their opinion as to possible reasons why inmates use drugs.
Forty percent or more reported as follows:
Before entering prison, they already used these drugs (78%)
Because they like it (64%)
To feel good (68%)
To calm their nerves (44.2%)
To escape their problems (65%)
Problems or family difficulties (55.4%)
To be able to sleep (45.6%)

Exploring the Relationship between Drugs and Crime
193
Nothing else to do (59%)
In addition, 25-30% of offenders felt the following were important reasons: problems or
family difficulties; nothing else to do; peer pressure by fellow inmates, and to be accepted
by their fellow inmates.
Table DOM5b: Possible causes of fellow inmates’ drug use
Items Yes No Maybe
Before entering prison they already used
these drugs
78.1 7.0 9.2
To escape their problems 65.0 11.9 18.6
Problems or family difficulties 55.4 15.2 21.9
To calm their nerves 67.0 14.3 11.2
To be able to sleep 45.6 24.8 59.3
Nothing else to do 59.3 21.7 12.8
To feel good 67.6 13.5 10.8
Because they like it 64.0 14.4 15.8
Peer pressure by fellow inmates 30.5 49.5 12.7
To increase their control and authority 32.0 48.0 10.2
To increase their privileges or popularity 31.3 41.1 14.5
To be accepted by their fellow inmates 36.0 44.7 12.3

Exploring the Relationship between Drugs and Crime
194
Dominica
Section 6
Gang involvement

Exploring the Relationship between Drugs and Crime
195
History of gang involvement among prison inmates in Dominica
About 23% (54/233) of all offenders reported that they were presently in a gang or had been
in a gang previously. These were mostly all males (one female), and 48% were under 15
when their gang activities started, 42% were 15-19 and 9.4% were 20 or and older.
Table DOM6a: History of gang involvement/perceptions of gangs in prison
Items Overall On
remand
Convicted Chi-
square
p value
Are you in or have you ever been in a gang?
(54/233)
23.2 24.1 22.9 0.32 ns
Were you a member of a gang immediately
before your imprisonment? (n=54)
68.5 61.5 70.7 - -
Was the crime related in any way to your
involvement/membership of the gang? (n=54)
24.1 23.1 24.4 - -
Were you ever imprisoned in the past for
gang related activities? (n=54)
29.6 30.8 29.3 - -
Was drug-use a part of your gang activities
before imprisonment? (n=54)
77.8 68.2 80.5 - -
Was trafficking in drugs a part of your gang
activities before imprisonment? (n=54)
57.4 46.2 61.0 0.88 ns
Upon release, how likely are you to readily
return to gang activities? (n=54)- very likely
or likely
16.7 7.7 19.6 - -
Are you aware of any gangs in prison, either
now or in the past? (n=227)
20.3 15.1 21.8 1.13 ns
Since imprisonment, have you been
approached to be a member of a prison-
based or outside gang? (n=229)
7.0 1.9 8.6 - -
Are you aware of any gang-related activity
which supports the drug trade? (n=230)
25.2 20.4 26.7 .713 ns

Exploring the Relationship between Drugs and Crime
196
Of those who were involved with gangs:
69% were gang members immediately before incarceration--62% of those on remand
compared to 71% of those convicted;
24% reported that the crime for which they were presently incarcerated was related
to involvement in or membership of a gang --23% of those on remand compared to
24% of those convicted;
30% were previously imprisoned for gang-related activities --21% of those on
remand compared to 39% of those convicted;
78% reported that drug use was part of their gang activity before imprisonment--68%
of those on remand compared to 81% of those convicted;
57% indicating that trafficking was part of their gang activities--46% of those on
remand compared to 61% of those convicted;
Some 80% of these offenders felt that it was not likely that they would readily go
back to gang activities after release. However, 16.7% felt that it was likely (7.4%
very likely and 9.3% somewhat likely), --8% of those on remand compared to 20%
of those convicted;
Gangs in prison
About 20.3% of all offenders said that they were aware of gangs in prison, whether now or
in the past--15% of those on remand compared to 22% of those convicted.
About 7% said that since incarceration, they had been approached to be a member of a
prison-based or outside gang --2% of those on remand compared to 9% of those convicted.
Gang activities and drug trade
About a quarter of all offenders overall (25.2%), said they were aware of gang-related
activities that support the drug trade --20% of those on remand compared to 27% of those
convicted.

Exploring the Relationship between Drugs and Crime
197
Appendix 4: Results for Saint Lucia
Section 1
Demographics

Exploring the Relationship between Drugs and Crime
198
Table SLU1a: Characteristics of the study population (Saint Lucia)
Age (years) Ethnic Origin (which race)
16-24 125(23.7 ) Black/ African 487(92.1 )
25-35 223(42.2) White/ Caucasian -
36-45 114(21.5 ) East Indian 6(1.1 )
46-54 51(9.6 ) Mixed race 33(6.3 )
55 -65 16(3.0 ) Indigenous -
Mean age (yrs.) 32.5 Other 3(0.5 )
Median age (yrs.) 31.0
Age range (yrs.) 46 Employment (pre-imprisonment)
Age (min-max) (yrs.) 16-62 Unemployed 64(12.0 )
Part-time employee 103(19.6 )
Gender Full-time employee 188(35.6 )
Male 520(98.3 ) Informal/self-employed 170(32.2 )
Female 9(1.7 ) Other 488(92.8 )
41(7.2 )
Status Trade or profession
Convicted 266(50.2 ) Professional 28(5.3 )
On remand 263(49.8 ) Technician 110(21.0 )
Clerical support 3(0.6 )
Union Status Services and sales 25(4.8 )
Single 384(72.7 ) Skilled (Agric., Forestry,
Fishery)
89(16.8 )
Married 41(7.8 ) Craft and related trade 156(29.7 )
Divorced 3(0.5 ) Plant and machine operator 18(3.4 )
Common law 81(15.2 ) Elementary occupation 6(1.2 )
Separated 15(2.8 ) Other 42(7.9 )
Visiting relationship 5(1.0 ) None 48(9.1 )
Education (Schooling) In-prison activity
None 3(0.5 ) School/knowledge programs 102(19.3 )
Incomplete primary 122(23.1 ) Computer
Complete primary 92(17.4 ) Bakery
Incomplete secondary 170(32.2 ) Cooking 10(1.8 )
Complete secondary 76(14.4 ) Tailoring 10(1.8 )
Incomplete University 11(2.1 ) Farming 13(2.5 )
Complete University 9(1.7 ) Cleaning 27(5.2 )
Tech., Voc., Com.
College
45(8.6) Teaching 3(0.5 )
Administrative 3(0.6 )
Which country born Construction/carpentry 16(3.1 )
St. Lucia national 488 (92.8) Arts and craft 9(1.6 )
Other nationality 41 (7.2) Other 78(14.7 )
None 259(48.9 )

Exploring the Relationship between Drugs and Crime
199
Age
As shown in Table SLU1a, the mean age of offenders overall was 32.5 years and the median
age was 31. Their ages ranged from 16 to 62 years, a range of 46 years. A little less than a
quarter (23.7%) of all offenders were 24 years or younger and 75% were 38 years and under.
By age groups, Table SLU1a shows that most offenders were in three age brackets: 16-24
(24%), 25-35 (42%) and 36-45 (22%). Ten percent were in the 46-54 year old group, and
three percent were in the 55-65 age bracket (the oldest age cohort).
Source: Saint Lucia
Gender and age group
Most offenders were males (98.3%) and only 1.7% were females (nine females only). Just
over one-fifth of all male offenders were in the 16-24 age group (23.3%), with 43% in the
25-35 age group (see Table SLU1b), followed by the 36-45 age group (21.5%). About 13%
of male offenders were older than 45. Four females were aged 16-24, two each in the 25-35
and 36-45 year brackets, and the remaining female offender was in the 55-65 age group.
Table SLU1b: Percentage distribution: age group, gender and status
Age Group Male Female On remand Convicted
16-24 23.3 44.4 36.9 10.5
25-35 42.6 22.2 46.7 37.8
36-45 21.5 22.2 12.5 30.5
46-54 9.7 - 2.0 17.1
55-65 2.9 11.1 2.0 4.0

Exploring the Relationship between Drugs and Crime
200
Status of prisoners
Half of the offending population were convicted prisoners (50.2%), while 49.8% were on
remand. A similar pattern was observed for males (50.5% convicted and 49.5% on remand),
and six of the nine females (66.7%) were offenders on remand.
Age group and status - More than eight of every ten offender (84%) on remand were in the
two youngest age groups, with 13% in the 36-45 age bracket (see table SLU1b). A slightly
lower proportion of convicted offenders (48%) were in the two youngest age groups and
31% in the 36-45 age bracket. About 21% of convicted offenders were older than 45.
Source: Saint Lucia
Union status
The majority of offenders were single (72.7%), while 7.8% were married and 3.3% were
widowed, divorced, or separated. About 16% were living in common-law relationships or
had visiting relationships.
Source: Saint Lucia

Exploring the Relationship between Drugs and Crime
201
Education
All prison inmates in Saint Lucia except three had some form of schooling. A little more
than one-fifth (23.1%) had not completed the primary level of education, while 17% had
completed primary schooling; about one-third (32.2%) had not completed secondary school
while 14% had completed secondary level schooling. A small proportion had completed
technical or community college (8.6%). This translates into about one-quarter (24.7%) who
had completed secondary school or higher, and some 75% having not completed primary or
secondary level schooling at time of incarceration.
Source: Saint Lucia
Ethnicity and nationality
Most offenders were of African origin (92%). There were also offenders in the “mixed”
race category (6.3%) and a few East Indians (six offenders).
The majority of offenders were also nationals of Saint Lucia (92.8%), with 7% nationals of
other countries (36 other Caribbean nationals—Guyana, Barbados, Jamaica Saint Vincent—
and 6 foreign nationals.
Pre-incarceration employment status
Offenders overall were asked to state their pre-incarceration work situation. More than one-
third (35.6%) reported full-time employment while 19.6% were in part-time employment
and another 12% were unemployed. Almost one-third (32.2%) were self-employed.

Exploring the Relationship between Drugs and Crime
202
Source: Saint Lucia
Cross tabulation in Table SLU1c below shows pre-incarceration employment status of both
convicted and remand offenders. More than one-third of convicted offenders were in full-
time employment (39%), and 14% were employed part-time. About 8% were unemployed
and a further 38% were involved in informal activities (self-employed). This compares to
offenders on remand, about one-third of whom (32%) were employed full-time, 25.4% part-
time, 16.4% unemployed and some 26% self-employed.
Table SLU1c: Employment (pre-incarceration) status
Employment Status Convicted On remand)
Unemployed 7.7 16.4
Part-time 13.8 25.4
Full-time 39.1 32.0
Informal activity (self-
employed)
38.1 26.2
Source: Saint Lucia
Income
Seven of every ten offenders (73%) reported a monthly income of XCD$1000 or more
before being incarcerated; 8% were not earning a monthly income or did not know what
their income was. However, most others (19%) reported an income less than XCD$1000 a
month (see Table SLU1d).

Exploring the Relationship between Drugs and Crime
203
Table SLU1d: Amount of income before incarceration and during imprisonment
Income (XCD$) Monthly
income before
incarceration
Current
monthly family
income
Less than XCD$ 500 5.4 4.3
Between XCD$ 500 and less than XCD$
600
5.7 1.7
Between XCD$ 600 and less than XCD$
700
2.7 1.3
Between XCD$ 700 and less than XCD$
800
0.5 2.2
Between XCD$ 800 and less than XCD$
900
2.6 0.5
Between XCD$ 900 and less than XCD$
1000
3.2 0.5
XCD$ 1000 or more 72.7 16.7
Does Not Know/NR 4.7 72.6
None 2.6 -
Source: Saint Lucia
Other demographics
Religion. 68% of offenders said that they practiced a religion while 32.5% did not. Most
offenders that practiced a religion were Roman Catholic, Rastafarian, and Seventh Day
Adventist.
Children and Family. Offenders were asked if they had any children: 65% said yes and
35% said no. Of those indicating that they had children, 74% reported that they had male
children, and 72% said they had female children.
Eighty-nine percent of offenders reported that they kept in touch with their family while
11% did not (Table SLU1e). There was no statistically significant difference between
convicted prisoners and those on remand (87.9% versus 89.4%) or between males and

Exploring the Relationship between Drugs and Crime
204
females (88.3% versus 100%) with respect to keeping in contact with family members
(p>0.05).
Table SLU1e: Offenders’ contact with family members
In touch
with
family?
Overall Male Female
On
remand
Convicted
Yes 88.5 88.3 100.0 89.4 87.9
No 11.5 11.7 - 10.6 12.1
Source: Saint Lucia

Exploring the Relationship between Drugs and Crime
205
Saint Lucia
Section 2
Criminal history and criminal offending

Exploring the Relationship between Drugs and Crime
206
Criminal offending
Table SLU2a shows that the offenses most often reported by those offenders who were
currently sentenced, in rank order, were capital crimes, physical assault, stealing, sexual
offenses, robberies and drug crimes. For offenders who reported previous offenses (n=222
or 42% of the prison population), the offenses most often reported were, physical assault,
drug crimes, robbery, stealing, and “other” offenses.
Table SLU2a: Offense types (current sentence and previous offense)
Offense category Current
sentence
Previous
offense
Sexual offense 4.3 1.2
Physical assault 5.5 28.3
Robbery 3.7 12.2
Stealing 4.9 11.0
Malicious damage 0.6 5.4
Capital crimes 15.1 3.9
Drug crimes 3.3 17.0
Other 12.3 21.1
On remand 49.8 -
Source: Saint Lucia
Of the three convicted female offenders, one was currently sentenced for drug crimes and
two for capital crimes. Males were more likely to be sentenced for capital crimes, physical
assault, stealing and sexual offenses.
Repeat offending
Table SLU2b: Repeat offense by status
Is this your first
sentence?
Convicted Remand Overall
Yes (first offenders) 68.3 61.1 64.7
No (repeat offenders) 31.7 38.9 35.3
Source: Saint Lucia
A little more than three of every ten offenders were repeat offenders (35.3%) (Table
SLU2b). Some 31.7% of convicted prisoners indicate that this was not the first time they
had been sentenced. A slightly higher proportion of those on remand also reported that they
had been sentenced before (38.9%), p>0.05.

Exploring the Relationship between Drugs and Crime
207
Source: Saint Lucia
Frequency of imprisonment (overall) - The mean number of times imprisoned was 3.55 ±
2.85 with a median of 3.0 times for those with previous offenses. Seventy-five percent of
these offenders have been imprisoned for more than four times.
Age of first offense. As shown in Table SLU2c below, the mean age of first offense
reported was 25.3 years ± 9.60. The median age was 23 years and the ages of first offense
had a range of 43 years. About 31% of offenders had offended before the age of 18 years
while 75% had offended by age 29 years.
Table SLU2c: Comparison of age of first offense with gender and status
Mean and Std. Dev.
(yrs.) Overall 25.35 ±9.60
Gender (p>0.05)
Male 25.3 ± 9.62
Female 25.4 ± 8.90
Status (p<0.01)
Remand 27.45 ± 10.5
Convicted 23.13 ± 7.97
Type of Offending
(p<0.01)
First time 27.36 ± 10.18
Repeat 21.58 ± 7.00
Source: Saint Lucia
The age of first offense among males was very similar to that of females (25.3 versus 25.4
years), which was not statistically different, p>0.05. However there was a significant
difference in the age of first offense between prisoners on remand (27.4 years) and
convicted prisoners (23.1 years), p<0.01 – ANOVA test. The age of first offense of first-
time offenders (27.3 years) and repeat offenders (21.5 years) was also significantly different,
p<0.01- ANOVA test.

Exploring the Relationship between Drugs and Crime
208
Other previous offenses (accused or sentenced)
Some 42% of offenders (42.4% of males and 22% of females, i.e. two female) reported
previous offenses for which they had been either accused or sentenced. About 15.5% of
offenders who had been charged or convicted of previous offenses were imprisoned in a
Youth Detention Centre (YDC) because they were minors at the time of offending. These
six offenders were all males. Of those offenders, 84% were sent to the Youth Detention
Centre once, and 16% more than once (2-4 times).
Family members and criminal activities
Offenders were asked if they had any family members engaged in criminal activities (Fig.
SLU7). More than one-fifth of all offenders (21.7%) reported that they had family members
who are or were involved in criminal activities—21% of males but no females; 26% of those
on remand compared to 17% convicted; and 18% repeat offenders compared to 23.8% first-
timers.
Source: Saint Lucia
For the most part, brothers (8.3%), uncles (6.2%), and some other family member (10.4%)
were the family members primarily reported. A father was mentioned a few times as being
involved in criminal offending.

Exploring the Relationship between Drugs and Crime
209
Offense category for family members
Table SLU2d: Frequency of family members in criminal activities by offense category
Offense
category
Father
/mother
Brother
/sister
Uncle Other
family
members
Sexual offense - 3 - -
Physical
assault
- 8 3 3
Robbery 3 5 14 8
Stealing - 5 5 -
Capital crimes - 5 3 14
Drug crimes 5 12 5 6
Source: Saint Lucia
Table SLU2d shows the frequency of family members involved in criminal activities by
offense categories. The reported offenses in rank order for each family member involved
are:
Fathers – drug crimes, robbery, sexual offenses and capital crimes;
Brothers – drug crimes, physical assault, robbery, stealing, capital crimes;
Uncles – robbery, stealing, drug crimes, capital crimes, and physical assault; and
Other family members – capital crimes, robbery, drug crimes and physical assault.
Frequency of offending by family members
When asked about the frequency with which family members offend, a large proportion of
offenders did not know or did not respond to this question (50%). Eighteen percent said less
than once per year, 17% said once per year and 2% said once per month.

Exploring the Relationship between Drugs and Crime
210

Exploring the Relationship between Drugs and Crime
211
Saint Lucia
Section 3
Drug use

Exploring the Relationship between Drugs and Crime
212
Drug use
Table SLU3a below presents self-reported lifetime prevalence of various drugs (both licit
and illicit) among prison inmates in Saint Lucia, and shows cross-tabulations by selected
demographic variables.
Table SLU3a: Self-reported drug use (lifetime prevalence) by selected demographic
variables
Mari Coc Crack Any
illicit
Alc Tob
Overall 80.4 5.7 4.8 80.4 58.5 69.0
Age Groups (years)
16-24 82.1 2.1 - 82.1 65.4 62.3
25-35 86.1 4.1 1.2 86.1 61.0 74.4
36-45 76.2 8.5 12.0 76.2 50.5 73.7
46-54 67.9 17.9 17.9 67.9 50.0 54.9
55 -65 57.1 - - 57.1 52.8 56.3
Gender
Male 81.2 5.5 4.5 81.2 59.5 69.7
Female 33.3 22.2 22.2 33.3 - 22.2
Type of Offending
First time 76.5 2.6 0.9 76.5 59.3 63.5
Repeat (recidivist) 87.5 11.4 11.8 87.5 57.0 78.8
Status
On remand 84.8 6.6 4.7 84.8 59.6 71.4
Convicted 76.1 4.9 4.9 76.1 57.4 66.8
Offense Category

Exploring the Relationship between Drugs and Crime
213
Sexual offense 57.1 - - 57.1 57.1 72.7
Physical assault 55.6 - - 55.6 77.8 79.3
Robbery 100.0 - 16.7 100.0 66.7 84.2
Stealing 87.5 25.0 12.5 87.5 62.5 76.0
Malicious damage 100.0 - - 100.0 100.0 100.0
Capital crimes 73.1 4.1 4.1 73.1 40.6 52.5
Drug crimes 62.3 - - 62.3 18.8 35.3
Other 85.0 5.0 5.0 85.0 75.0 73.8
Source: Saint Lucia
Lifetime prevalence
The most prevalent drug reported ever used by offenders was marijuana. About 80% of all
offenders in the Saint Lucia prison had used marijuana at least once in their lifetime. This
was followed by tobacco (69%) and alcohol (59%). Cocaine was the second most prevalent
illicit drug used—some 5.7% lifetime use was reported, while 4.8% reported lifetime use of
crack cocaine. A small proportion reported non-prescription use of medication (1.6%).
There was no reported use of inhalants or heroin. “Any illicit drug use” was computed to
give a lifetime prevalence of 80.4%, which mirrors the lifetime marijuana prevalence.
Source: Saint Lucia

Exploring the Relationship between Drugs and Crime
214
Gender and lifetime drug use
Some 81% of males compared to 33% of females reported lifetime marijuana use; cocaine
use prevalence among male offenders was 5.5%, with only two of the nine females reporting
cocaine or crack cocaine use. However, 4.5% of male offenders also report crack cocaine
use. Only males reported lifetime alcohol use (60%). Tobacco use was reported by 69.7%
of males compared to 22% reported by females. There was no significant difference
between males and females with respect to any reported lifetime drug use prevalence
(p>0.05 on chi square test).
Repeat offending and lifetime drug use
Some 77% of first-time offenders compared to 88% of repeat offenders reported lifetime
marijuana use (p<0.01) (Table SLU3b below). Cocaine use was reported by 2.6% of first-
time offenders and 11.4% of repeat offenders (p<0.01). Less than 1% of first-time offenders
versus 11.8% of repeat offenders reported crack cocaine use (p<0.01); and 59% of first-time
offenders versus 57% of repeat offenders reported lifetime alcohol use (p>0.05). In
addition, 64% of first- time offenders versus 79% of repeat offenders reported tobacco use
(p<0.01).
Table SLU3b: Statistical relationship between type of offending and lifetime drug use
Type of offending Marijuana Cocaine Crack Alcohol Tobacco
First-time 76.5 2.6 0.9 59.3 63.5
Repeat (recidivist) 87.5 11.4 11.8 57.0 78.8
Chi square (χ2) 9.86 16.52 31.47 0.295 13.01
p-value < 0.01 <0.01 < 0.01 >0.05 < 0.01
Source: Saint Lucia
Reported lifetime prevalence (for marijuana, cocaine, crack cocaine and tobacco) among
first-time offenders was significantly different statistically from that reported by repeat
offenders, (p<0.01 on chi square test).
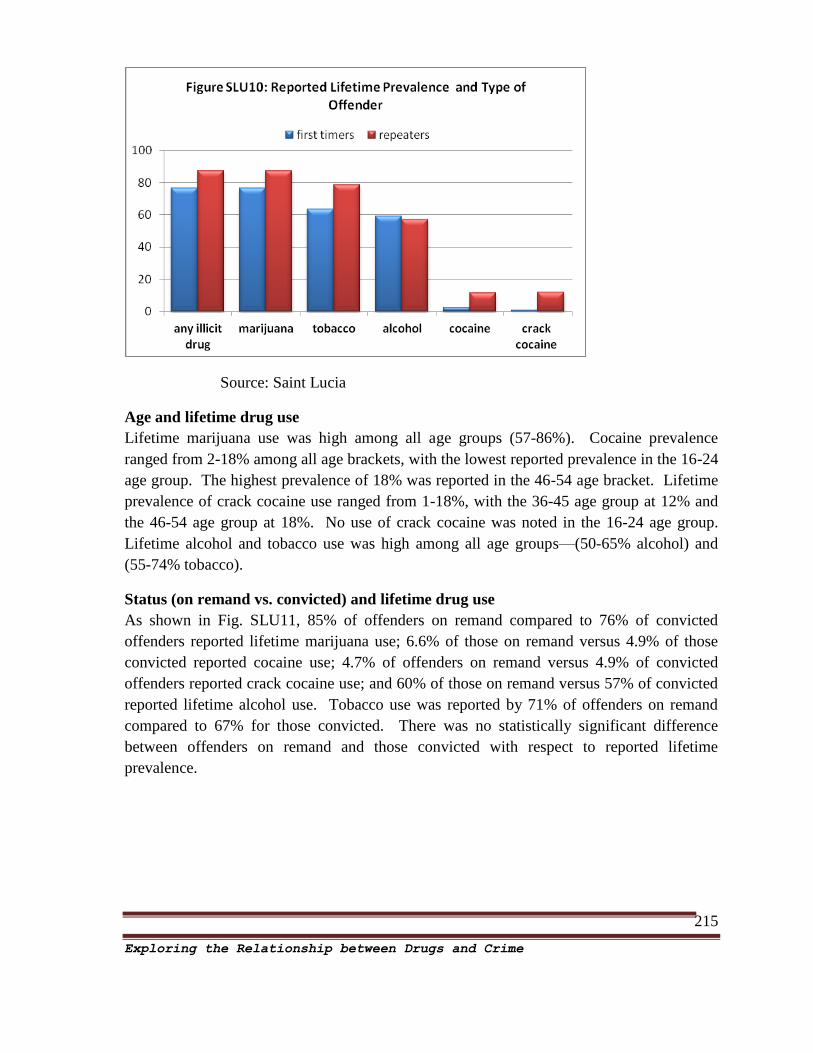
Exploring the Relationship between Drugs and Crime
215
Source: Saint Lucia
Age and lifetime drug use
Lifetime marijuana use was high among all age groups (57-86%). Cocaine prevalence
ranged from 2-18% among all age brackets, with the lowest reported prevalence in the 16-24
age group. The highest prevalence of 18% was reported in the 46-54 age bracket. Lifetime
prevalence of crack cocaine use ranged from 1-18%, with the 36-45 age group at 12% and
the 46-54 age group at 18%. No use of crack cocaine was noted in the 16-24 age group.
Lifetime alcohol and tobacco use was high among all age groups—(50-65% alcohol) and
(55-74% tobacco).
Status (on remand vs. convicted) and lifetime drug use
As shown in Fig. SLU11, 85% of offenders on remand compared to 76% of convicted
offenders reported lifetime marijuana use; 6.6% of those on remand versus 4.9% of those
convicted reported cocaine use; 4.7% of offenders on remand versus 4.9% of convicted
offenders reported crack cocaine use; and 60% of those on remand versus 57% of convicted
reported lifetime alcohol use. Tobacco use was reported by 71% of offenders on remand
compared to 67% for those convicted. There was no statistically significant difference
between offenders on remand and those convicted with respect to reported lifetime
prevalence.

Exploring the Relationship between Drugs and Crime
216
Source: Saint Lucia
Offense categories and lifetime drug use
Lifetime marijuana use was high among all offense categories (56-100%) (Table SLU3a
above). The highest proportions were noted for robbery, malicious damage and stealing.
For cocaine use, offenders who committed the offense of stealing reported the highest
prevalence. A similar pattern was noted for crack cocaine, with the highest prevalence
reported for the offenses of robbery (17%) and stealing (13%).
Lifetime alcohol use was high among all offense categories (41-78%) with the exception of
drug crimes (19%). The highest prevalences reported were in the following categories:
physical assault (78%), robbery (67%) and stealing (63%). Tobacco use followed the same
pattern with over 70% prevalence in cases of physical assault, sexual offenses, robbery and
stealing.
Lifetime prevalence and educational level attained
Lifetime use of marijuana was high regardless of educational level, but more so at those
levels up to secondary school, where prevalence ranged from 71-96%. All offenders with
no schooling reported lifetime marijuana use (this was the only drug reported as being ‘ever
used’ by this group). Notable proportions of offenders at all educational levels reported
lifetime prevalence of cocaine and crack cocaine use, with the exception of those with
incomplete university and technical or community college level education.
Lifetime prevalence and work situation
Again, high levels of marijuana use dominated in all work categories with prevalence
ranging from 76-95%, with the highest among the unemployed (95%) (Table SLU3c below).
Cocaine and crack cocaine use was highest among the part-time and unemployed (11%).
This was followed by the self-employed (4% cocaine and 6% crack cocaine), and full-time
employees (3% cocaine and 3% crack cocaine).

Exploring the Relationship between Drugs and Crime
217
Table SLU3c: Self-reported drug use (lifetime prevalence) by other selected
demographic variables
Source: Saint Lucia
Reported age of first use - initiation rates
In this study, all initiation rates are based on offenders who reported having used a substance
at least once in their lifetime (see Table SLU3d and Fig. SLU12). The mean age of first use
for licit substances--alcohol (15.3 years) and tobacco (18.1 years)--was slightly higher than
that of the main illicit drug marijuana (14.9 years). Tobacco use (median initiation age of
18) was started some time later than alcohol use (median initiation age of 15 years).
Marijuana use was initiated at an earlier age than alcohol or tobacco use: the median age of
first use for marijuana was 14 years, which indicates that some 50% of marijuana use was
already initiated by the age of 14, that is, one year earlier than that proportion of alcohol use
and four year earlier for tobacco use. The mean age of initiation for cocaine powder was 22
years compared to crack cocaine (26.7 years). The mean age of initiation reported for any
illicit drug followed the pattern observed for marijuana (14.9 years).
Marijuana Cocaine Crack
cocaine Employment pre-incarceration
Unemployed 94.9 12.3 11.2
Part-time employee 82.8 10.6 2.5
Full-time employee 76.2 2.7 3.1
Informal/self-employed 77.8 3.8 5.7
Other
Education (Schooling)
Incomplete primary 71.4 10.6 9.0
Complete primary 94.4 3.5 7.0
Incomplete secondary 84.4 3.4 1.5
Complete secondary 95.7 6.8 6.8
Incomplete university 53.1 - -
Complete university 64.2 35.8 -
Tech., Voc., Com. College 44.1 - -

Exploring the Relationship between Drugs and Crime
218
Table SLU3d: Reported age of first use – overall
Age of first use
Mean
(yrs.)
Median
(yrs.)
75th
percentile
Marijuana 14.9 14.0 17.0
Cocaine 21.6 22.0 25.0
Crack 26.7 24.0 29.0
Any illicit drug 14.9 14.0 17.0
Alcohol 15.3 15.0 18.0
Tobacco 18.1 18.0 21.0
Source: Saint Lucia
Source: Saint Lucia
The age of initiation at the seventy-fifth percentile serves to illustrate that 75% of all use had
already taken place by that age. In relation to first use (Table SLU3d above), it can be
inferred that:
75% of all tobacco first use had taken place by the age of 21
75% of all alcohol use had taken place by age 18
75% of all marijuana use had taken place by age 17
75% of all crack cocaine use had taken place by the age of 29

Exploring the Relationship between Drugs and Crime
219
75% of all cocaine powder use had taken place by the age of 25
75% of any illicit drug use had taken place by age 17.
Initiation rates by age groups
Table SLU3e shows the distribution of rates of first use for five different age groups: under
10, 10-14, 15-19, 20-24 and 25 and over. Those who did not know or could not recall were
omitted from the tabulations.
Interestingly, all the substances except cocaine and crack were reported initiated before the
age of 10. In addition, with the exception of cocaine and crack cocaine, 22-44% of all other
substance use was initiated between the ages of 10 and 14. Substantial proportions of use
of all substances were also initiated between ages 15 and19 (about 22-41%).
Table SLU3e: Initiation rates - age of first use (age group)
Percentage of use by reported age (yrs.)
< 10 10-14 15-19 20-24 > = 25
Marijuana 6.1 44.3 38.5 7.1 4.0
Cocaine powder - - 22.1 50.0 27.9
Crack cocaine - - - 29.1 70.9
Any illicit drug 6.1 44.3 38.5 7.1 4.0
Alcohol 7.2 36.1 41.4 11.9 3.4
Tobacco 7.0 22.3 40.2 23.4 14.1
Source: Saint Lucia

Exploring the Relationship between Drugs and Crime
220
Source: Saint Lucia
Last time used drugs
A moderately small proportion of offenders reported using marijuana over the last month
period (36% or just about over one-third). One-fifth reported use in the last 24 hours, 12% in
the last week and about 3.4% in the last thirty days. About 15% reported marijuana use
more than one month and up to a year ago, while the largest proportion (30%) reported
marijuana use one year or more ago.
Table SLU3f: Patterns of use – last time used drugs
Time last used drugs
Last 24
hours
Last
week
Last 30
days
>1 mth.
but <1
yr.
1 yr. or
more
Marijuana 21.1 11.6 3.4 14.6 30.1
Cocaine powder - - - 2.1 3.7
Crack cocaine - - - 2.5 2.3
Tobacco 45.3 3.2 3.6 7.6 8.4
Alcohol 3.2 2.1 - 15.7 35.7
Source: Saint Lucia

Exploring the Relationship between Drugs and Crime
221
No cocaine or crack cocaine use was reported in the last month, but about 5-6% reported
using these drugs more than one month ago and up to more than a year ago. Offenders
reported a notably high proportion of tobacco use in the last 24 hours (45%) but moderate
prevalence of use thereafter—last week (3.2%) and last 30 days (3.6%). For alcohol, only
5.3% reported use in the last 30 days.
How often used drugs (based on lifetime prevalence)
Marijuana was used often within the last month: 32% used it four or more times per week,
26% one to three times per week, and another 24% one to three times per month. Most
cocaine use was four or more times per week (24%). However, 24% of use was 1-11 times
per year and 53% less than once per year. Crack cocaine use was reported by an even higher
proportion at four or more times per week (67%) compared to marijuana use.
Use of tobacco and alcohol was predominantly at frequencies of 1-3 times per month or per
week and four or more times per week.
Table SLU3g: Patterns of use – how often used drugs
How often used drugs
Less
than
once a
year
Once a
year
1-11
times
per
year
1-3
times
per
month
1-3
times
per
week
4 or
more
times per
week
Marijuana 2.1 6.2 9.7 24.2 25.9 31.9
Cocaine
powder
53.1 - 23.5 - - 23.5
Crack cocaine - - 33.3 - - 66.7
Tobacco - 2.8 1.8 7.2 15.4 72.8
Alcohol 10.4 2.4 16.6 15.3 22.7 32.5
Source: Saint Lucia
Who got the offender involved in drug use?
For the most part, offenders got started or involved on their own (53.3%) or through friends
(31.9%). Contributions of father or mother (1%), brother (1.6%) or other family members
(3.7%) were negligible. Some 8.3% got involved through acquaintances, other persons or
neighbors.

Exploring the Relationship between Drugs and Crime
222
Reasons for using drugs
Most offenders (37%) reported curiosity as the reason for using drugs (see Table SLU3h
below), and some other reason was indicated by 24%. The next most prevalent reasons
were: peer pressure (8.3%), ‘feeling good’ (6.4%), ‘a way to escape reality’ (6.4%), ‘I liked
the idea of doing it’ (6.5%) and ‘to feel more courageous’ (5.3%). Females gave as their
main reasons curiosity and ‘I like the idea of doing it’. Males were more likely to indicate
curiosity, peer pressure, ‘‘I like the idea of doing it’ and ‘feeling good’.
Table SLU3h: Reasons for using drugs by gender
Reasons for drug use Overall
percent
Gender
Male Female
Curiosity 37.1 33.3 22.2
Peer pressure 8.3 7.6 -
To belong to a group 1.1 1.0 -
Family pressure 2.3 2.1 -
To feel more courageous 5.3 4.8 -
To increase control/authority/privileges 2.5 2.2 -
It was a way to escape reality 6.4 5.8 -
I like the idea of doing it 6.5 5.7 11.1
I thought it would make me feel good 6.4 5.8 -
Other 23.9 21.7 -

Exploring the Relationship between Drugs and Crime
223
Drug use while in prison
More than seven of every ten offenders (72.8%) reported that they have used or were using
drugs while incarcerated (73% of all male offenders and 2 female offenders). Convicted
offenders were significantly more likely than offenders on remand to report using drugs
while incarcerated: 76.9% of all convicted offenders versus 68.4% of all offenders who on
remand—Χ2=4.32, p<0.05.
Change in patterns of use
Of those who reported that they had used or were using drugs while incarcerated, much less
than ten percent (6.9%) had started using drugs for the first time while incarcerated—7% of
males; 4.4% on remand versus 10% convicted, (Χ2=4.63, p<0.05); 9% first-timers versus
4% repeaters, p>0.05.
Again, for those who were using or had used drugs, 25% reported changing the type of
substance that they normally would have used outside prison. Most all persons reported
changing to marijuana.
Offenders were asked if the fact that they were in prison caused them to start or go back to
using drugs, of those who reported drug use while incarcerated, 26% said “yes”. Some 26%
of those who had used or were using in prison responded that once they started using drugs,
they had an uncontrolled urge to keep using.
Of this same group of offenders, 84% perceived that they were able to stop using drugs for a
period without making a great effort or without feeling bad. Sixteen percent did not share
this view.
A notably high proportion of all offenders (88%) said they were aware of the physical or
mental damage that results from drug use.
Previous treatment for substance abuse
Offenders were asked to indicate whether they had ever received treatment by a doctor or
any other professional because of the use of any drugs or substances. A small proportion
(5%) reported that they had previously received treatment for substance use.
They were also asked about hospitalization for drug use or related mental or physical
complications: 8 had received treatment for drug use and 19 for mental disorders. To
complete this section, offenders were asked if they felt that they presently needed treatment
for drugs currently used, 8.3% of all respondents said that they currently had a need for
treatment.

Exploring the Relationship between Drugs and Crime
224
Saint Lucia
Section 4
Relationship between drugs and crime

Exploring the Relationship between Drugs and Crime
225
Relationship between drugs and crime
Very small numbers of either convicted offenders or those on remand in Saint Lucia
responded affirmatively to the questions that sought to establish a link between their crime
and drug use (see Table SLU4a below).
Offenders on remand were asked if they had ever been convicted and imprisoned for any
offense: 34% said ‘yes’. Those who responded in the affirmative (n=89) were asked
whether the crime for which they were currently on remand had some type of relationship
with drugs: 21.7% said ‘yes’. The respondents’ (n=20) answers to the follow-up questions
are indicated in column 3 of the table, and labeled - on remand.
Convicted offenders were asked whether the crime for which they were currently serving a
sentence had some type of relationship with drugs: 22.3% said ‘yes’. Convicted offenders’
responses (n=56) to the follow-up questions are indicated in column 2 of the table, and
labeled – convicted.
Of those who said that their offense had some type of relationship with drugs,
40.3% of convicted offenders had committed the crime while under the influence of
drugs, compared to 64% of those on remand;
76.9% of convicted offenders reported that the crime was linked to production,
selling and/or trafficking of drugs, or directly linked to drug trafficking (76.9%), or
to activities that were against drug laws (71%). This compares to 74.3% of those on
remand who reported that the crime was linked to production, selling and/or
trafficking of drugs, or directly linked to drug trafficking (40%), or to activities that
were against drug laws (40%);
About 23% of convicted offenders had commit the crime in order to obtain drugs for
their own use, compared to 51.4% on remand;
More than one-fifth (23%) of convicted offenders reported that they had
wilfully/intentionally consume a substance in order to boost their courage to commit
the crime, compared to 51.4% of those on remand;
A notably large proportion of offenders (23% convicted and 26% on remand)
reported that their crime was perpetrated on a victim who was under the influence of
alcohol or drugs.

Exploring the Relationship between Drugs and Crime
226
Table SLU4a: Relationship between drugs and crime
[Offenders responding “YES” to questions posed]
Items Convicted On
remand
Did the crime you committed have some kind of relationship
with drugs?
22.3 21.7
When you committed the crime for which you are currently
imprisoned were you under the influence of a drug or
intoxicated?
40.4 64.3
Do you think you would have committed the crime if you
were not under the influence of a drug or intoxicated
(drugged)?
17.9 12.9
Did you commit the crime for which you are currently
imprisoned in order to get drugs for your own personal use?
23.1 51.4
Was (were) the victim(s) of your crime under the influence
of alcohol or other drugs?
23.1 25.7
Did you wilfully/intentionally consume a substance in order
to boost your courage to commit the crime for which you are
currently in prison?
23.1 51.4
Was the crime for which you are currently imprisoned linked
to the production, selling and/or trafficking of drugs?
76.9 74.3
Was the crime for which you are currently imprisoned linked
to drug trafficking?
76.9 38.6
Was the crime for which you are currently imprisoned linked
to activities that went against drug laws?
71.1 38.6
Source: Saint Lucia

Exploring the Relationship between Drugs and Crime
227
Offense category and relationship between drugs and crime
As shown in Table SLU4b, offenders sentenced in all offense categories (except malicious
damage) said that their offense had some kind of relationship with drugs, as well as the
crime was committed while under the influence of drug or while intoxicated (except sexual
offenses and drug crimes). In addition, for all offense categories (except sexual offenses and
malicious damage), offenders also reported that the crime was linked to activities that went
against drug laws; or that the crime was linked to drug trafficking;
In summary, sexual offenses, physical assault, robbery stealing, capital crimes and drug
crimes were all linked to drugs in one way or another. More so, stealing, robbery and capital
crimes all showed some link to drug use.
Table SLU4b: Offense category and relationship between drugs and crime
S
exu
al
off
ense
Ph
ysic
al
ass
au
lt
Robber
y
Ste
ali
ng
Mali
ciou
s
dam
age
Capit
al
crim
es
Dru
g c
rim
es
Oth
er
Did the crime you committed have
some kind of relationship with drugs?
14.3 22.2 33.3 25.0 - 12.2 100.0 15.0
Crime committed while under the
influence of a drug or intoxicated?
- 22.2 16.7 12.5 - 4.1 - 10.0
Would you have committed the crime if
you were not under the influence of a
drug
- 11.1 - - - - - 10.0
Committed crime in order to get drugs
for your own personal use?
- - 16.7 12.5 - 4.1 - 5.0
Victim(s) under the influence of
alcohol or other drugs?
- 11.1 - 12.5 - - - 10.0
Wilfully/intentionally consume a
substance in order to boost your
courage to commit the crime
- - 16.7 12.5 - 4.1 - 5.0
Crime linked to the production, selling
and/or trafficking of drugs?
- - 33.3 25.0 - 8.1 81.2 15.0
Crime linked to drug trafficking? - 11.1 33.3 25.0 - 8.1 62.3 15.0
Crime linked to activities that went
against drug laws?
- 11.1 33.3 25.0 - 8.1 43.5 15.0

Exploring the Relationship between Drugs and Crime
228
Importance of the relationship between drugs and crime
Offenders were asked to state their perception of the importance of the relationship between
drugs and crime. The options given were: of little importance, of no importance, somewhat
important, important and very important (see Fig. SLU15 below).
Of those who responded (n=76 or 14.4% of all offenders), most (54.5%) felt it was
important—50% felt it was very important and 4% important. About 16% felt it was of little
importance and more than a quarter (26%) felt it was of no importance. A small proportion
(3.4%) did not know of the importance or did not respond (Fig. SLU15).
Source Saint Lucia

Exploring the Relationship between Drugs and Crime
229
Saint Lucia
Section 5
Perceptions of drug use

Exploring the Relationship between Drugs and Crime
230
Offenders’ perceptions of drug use by fellow inmates
Offenders were asked to indicate the three drugs most often used by fellow inmates. The
only illicit substance reported by offenders as the first most important drugs was marijuana
(38.8%), but 55% mentioned tobacco as being most important. The second most important
drugs were also marijuana and tobacco.
When asked how many inmates were seen using drugs or substances in prison, the majority
of offenders said many (65.5%). About 14% said few, while 11.5% said all. About 5% said
none and 4.1% did not know or did not respond.
About one-third of offenders (34%) said they were affected by the use of drugs or
substances in prison. The main reasons reported related to the health effects of smoke (the
smell, second-hand smoke, affects breathing, headaches, etc.).
Perception of ease of access to drugs in prison
More than three of every ten offenders (37.7%) felt that it was easy to obtain drugs or
substances in prison (15.9% very easy and 21.8% easy). However, just about half (49.5%)
felt it was difficult—18.4% very difficult and 31.1% difficult. About 13% did not respond
or did not know.
Table SLU5a: Perception of ease of access to drugs in prison by status and type of
offender
How easy to
obtain drugs?
Overall Status Type of Offender
On
remand
Convicted First-
time
Repeat
Easy 37.7 33.1 42.2 33.4 43.3
Difficult 49.5 41.0 47.9 49.3 49.8
Don’t know/NR 12.9 16.0 9.8 16.4 5.9
Source: Saint Lucia
More repeat offenders (43.3%) indicated that it was easy to obtain drugs in prison compared
to first-time offenders (33%), p>0.05. With respect to offenders on remand, 33% felt it was
easy to obtain drugs compared to 33% of convicted prisoners. Slightly more convicted
offenders felt it was difficult to obtain drugs (49% versus 41%), but a higher proportion of
those on remand did not know or did not respond. These differences were not statistically
significant.

Exploring the Relationship between Drugs and Crime
231
Perceptions of drug use and violence in prison
Offenders were asked whether they believed that the violence that occurs within the prison
compound is related to drugs (see below, Fig. SLU16). About one-third (32.2%) said yes—
16% reported slightly, 7.3% moderately, 7.3% ‘very much so’ and 2% ‘excessively so’.
Some 62% said that they did not believe violence in prison was related to drugs, and 6% did
not know.
Offenders were also asked whether, in their opinion, the fact of being imprisoned makes a
person use drugs. Half (49.5%) said ‘yes’ and 47% said ‘no’. About 4% did not know.
Source: Saint Lucia
Possible reasons for fellow inmates’ drug use
Offenders were asked to give their opinion as to the possible causes of inmate drug use.
Fifty percent or more reported as follows:
Before entering prison, they already used these
drugs (74%)
To escape their problems (76%)
Problems or family difficulties (54%)
To calm their nerves (78%)
To be able to sleep (53%)
Nothing else to do (58%)
To feel good (59%)
Because they like it (76%)
In addition, fewer than 40% of offenders felt the following were reasons for drug use: peer
pressure from fellow inmates; to increase their privileges or popularity; and to increase their
control and authority.

Exploring the Relationship between Drugs and Crime
232
Table SLU5b: Possible causes of fellow inmates’ drug use
Items Yes No Maybe
Before entering prison they already used
these drugs
74.3 8.4 8.7
To escape their problems 76.0 4.7 10.3
Problems or family difficulties 54.1 18.6 14.0
To calm their nerves 77.5 6.9 6.9
To be able to sleep 53.1 24.3 10.8
Nothing else to do 57.6 27.2 6.6
To feel good 58.5 17.9 9.9
Because they like it 75.9 7.7 6.3
Peer pressure by fellow inmates 39.5 42.5 9.3
To increase their control and authority 36.1 43.0 7.4
To increase their privileges or popularity 36.8 42.3 8.9
To be accepted by their fellow inmates 41.5 37.6 8.3

Exploring the Relationship between Drugs and Crime
233
Saint Lucia
Section 6
Gang involvement

Exploring the Relationship between Drugs and Crime
234
History of gang involvement
About 40% of all prison inmates in Saint Lucia reported that they were presently in a gang
or had been in a gang previously—these were all males; and 54% of those on remand
compared to 46% of those convicted. About 47% were 14 years or younger, 47% in the 15-
19 age bracket and 13% were 20 or older when their gang activities started.
Table SLU6a: History of gang involvement/perceptions of gangs in prison
Items Overall On
remand
Convicted Chi-
square
p value
Are you in or have you ever been in a gang? 40.1 53.9 46.1 0.527 ns
Were you a member of a gang immediately
before your imprisonment?
52.9 47.6 59.1 2.52 ns
Was the crime related in any way to your
involvement/membership of the gang?
29.9 17.5 44.3 16.3 p<0.05
Were you ever imprisoned in the past for
gang related activities?
15.6 9.7 21.8 5.36 p<0.05
Was drug-use a part of your gang activities
before imprisonment?
52.6 49.5 55.7 - -
Was trafficking in drugs a part of your gang
activities before imprisonment?
67.1 67.6 66.7 7.59 ns
Upon release, how likely are you to readily
get back into gang activities? - very likely or
likely
13.3 15.6 10.3 1.74 ns
Are you aware of any gangs in prison, either
now or in the past?
50.8 49.0 52.6 - -
Since imprisonment, have you been
approached to be a member of a prison-
based or outside gang?
18.9 16.7 21.5 1.79 ns
Are you aware of any gang related activity
which supports the drug trade?
29.0 27.9 29.8 - -

Exploring the Relationship between Drugs and Crime
235
Of those who were involved with a gang:
53% were gang members immediately before incarceration (48% of those on remand
compared to 59% of those convicted);
30% reported that the crime for which they were presently incarcerated was related
to involvement in or membership of a gang—those convicted (44%) were
significantly more likely to indicate this compared to those on remand (17.5%),
p<0.05;
16% were previously imprisoned for gang-related activities—again, those convicted
(22%) were significantly more likely to indicate this compared to those on remand
(10%), p<0.05;
53% reported that drug use was part of their gang activity before imprisonment--50%
of those on remand compared to 56% of those convicted;
67% indicating that trafficking was part of their gang activities--68% of those on
remand compared to 67% of those convicted;
Some 87% of these offenders felt that it was not likely that they would readily go
back to gang activities after release. However, 13% felt that it was likely--16% of
those on remand compared to 10% of those convicted.
Gangs in prison
About half (51%) of all offenders said that they were aware of gangs in prison, whether now
or in the past—49% of those on remand compared to 53% of those convicted.
About 19% said that since incarceration, they had been approached to be a member of a
prison-based or outside gang--17% of those on remand compared to 22% of those convicted.
Gang activities and the drug trade
About one in three offenders overall (29%), said they were aware of gang-related activities
that support the drug trade--28% of those on remand compared to 30% of those convicted.