EXPLORING THE MODERATING EFFECT OF MALAYSIA CHUA …
59
i EXPLORING THE MODERATING EFFECT OF GOVERNMENT SUPPORT ON ACTUAL ADOPTION OF E-WALLET AMONG MOBILE PHONE USERS IN MALAYSIA CHUA CHIA SOON LIM WEI XIONG NG SUE XIN WONG WAI JUN BACHELOR OF ECONOMICS (HONS) FINANCIAL ECONOMICS UNIVERSITI TUNKU ABDUL RAHMAN FACULTY OF BUSINESS AND FINANCE DEPARTMENT OF ECONOMICS SEPTEMBER 2020
Transcript of EXPLORING THE MODERATING EFFECT OF MALAYSIA CHUA …

i
EXPLORING THE MODERATING EFFECT OF
GOVERNMENT SUPPORT ON ACTUAL ADOPTION OF
E-WALLET AMONG MOBILE PHONE USERS IN
MALAYSIA
CHUA CHIA SOON
LIM WEI XIONG
NG SUE XIN
WONG WAI JUN
BACHELOR OF ECONOMICS (HONS) FINANCIAL
ECONOMICS
UNIVERSITI TUNKU ABDUL RAHMAN
FACULTY OF BUSINESS AND FINANCE
DEPARTMENT OF ECONOMICS
SEPTEMBER 2020

ii
EXPLORING THE MODERATING EFFECT OF
GOVERNMENT SUPPORT ON ACTUAL ADOPTION OF E-
WALLET AMONG MOBILE PHONE USERS IN MALAYSIA
BY
CHUA CHIA SOON
LIM WEI XIONG
NG SUE XIN
WONG WAI JUN
A final year project submitted in partial fulfilment of the
requirements for the degree of
BACHELOR OF ECONOMICS (HONS) FINANCIAL
ECONOMICS
UNIVERSITI TUNKU ABDUL RAHMAN
FACULTY OF BUSINESS AND FINANCE
DEPARTMENT OF ECONOMICS
SEPTEMBER 2020

iii
Copyright @ 2020
ALL RIGHTS RESERVED. No part of this paper may be reproduced, stored in a retrieval
system, or transmitted in any form or by any means, graphic, electronic, mechanical,
photocopying, recording, scanning, or otherwise, without the prior consent of the authors.

iv
DECLARATION
We hereby declare that:
(1) This undergraduate FYP is the end result of our own work and that due
acknowledgement has been given in the references to ALL sources of information be
they printed, electronic, or personal.
(2) No portion of this FYP has been submitted in support of any application for any other
degree or qualification of this or any other university, or other institutes of learning.
(3) Equal contribution has been made by each group member in completing the FYP.
(4) The word count of this research report is 8993 words.
Name of Student: Student ID: Signature:
1. Chua Chia Soon 1607094 __________________
2. Lim Wei Xiong 1606893 __________________
3. Ng Sue Xin 1706435 __________________
4. Wong Wai Jun 1601233 __________________
Date: 18 September 2020

v
ACKNOWLEDGEMENTS
Firstly, we would like to express our deepest gratitude to our final year project supervisor, Dr.
Go You How for his guidance and efforts throughout the period. We truly appreciate his advises,
patient and consideration in assisting us on the writing of thesis.
Furthermore, we would like to thank our examiner, Dr. Yiew Thian Hee. He has
provided several appropriate recommendations and suggestions, which assisted us in making
better improvement on this thesis. His advice has helped us to refine our thesis and made our
findings more meaningful.
Last but not least, we also wish to express our sincere thanks to our family members,
friends, course mates, and all the respondents that have participated in our survey. Their selfless
supports are gratefully acknowledged, together with the sincere apologies to those we have
unintentionally failed to mention here.
vi
DEDICATION
This study is dedicated to Universiti Tunku Abdul Rahman (UTAR) for providing us a platform
and opportunity to utilize and apply the knowledge that we have learned in financial economics
courses throughout the time.
Furthermore, we would like to dedicate this thesis to our final year project supervisor,
Dr. Go You How. He has showed a great support and motivation throughout the process of this
study. Besides that, he was compassionate in sharing the knowledge while doing the research
with us. Without our most respected supervisor, we might not be able to complete this thesis
on time. Next, we would like to dedicate to our examiner, Dr. Yiew Thian Hee. He has provided
us some proper suggestions in in making better improvement on this research project.
Moreover, this study is also dedicated to our families, friends, course mates and all the
respondents that have participated in our survey. They have provided kind assistance as well
as mental and physical supports towards our final year project. Lastly, we would like to
dedicate this study to the future researchers in assisting them to carry out their researches in
the future.

vii
TABLE OF CONTENTS
Page
Copyright Page …………………………………………………………………….... iii
Declaration …………………………………………………………………….…….. iv
Acknowledgements …………………………………………………………………… v
Dedication …………………………………………………………………………… vi
Table of Contents …………………………………………………………….……… vii
List of Tables ……………………………………………………………………..…. x
List of Figures ………………………………………………..……………….……... xi
List of Abbreviations ……………………………………………………….…...……xii
List of Appendices…………………………………………………………………… xiii
Preface …………………………………………………………….………………… xiv
Abstract ……………………………………………………………………………… xv
CHAPTER 1 INTRODUCTION ……………………………………………… 1
1.1 Background ………..….…………………………………………. 1
1.2 Problem statement ………....……………………………………. 4
1.3 Research question …...….……………………………………….. 7
1.4 Research objectives …...….……………………………………… 7
1.5 Significance of study ...….………………………………………. 8
1.6 Chapter layout …….....….………………………………………. 8
CHAPTER 2 LITERATURE REVIEW….…………………………………... 9
2.1 Theoretical framework ………………………………………….... 9
2.2 Conceptual framework ……………………………………...….... 15
2.3 Gap of literature ……..………………………………………….... 17

viii
CHAPTER 3 DATA AND METHODOLOGY .…………….…….……………. 18
3.1 Data description ……..……………………………..…………….... 18
3.1.1 Targeted respondents ...…………………..………………... 18
3.1.2 Selected sampling technique …………..………………….. 18
3.1.3 Designed questionnaire ……………….…….…………….. 19
3.1.4 Method of data collection …………….….……………….. 20
3.1.5 Pilot test ……………...………………..………………….. 21
3.1.6 Data processing ……...……….……….………………….. 22
3.2 Methodology ….……..……………….………….…..………….... 23
3.2.1 Descriptive analysis ...………………….….….………….. 23
3.2.2 Measurement model ...…….……………….….………….. 24
3.2.3 Structural model …......…………………….….………….. 25
CHAPTER 4 RESULTS AND DISCUSSION ...………………….……...…… 27
4.1 Examining respondents’ demographic profile ……….…………... 27
4.2 Evaluating reliability of constructs ….………………………….... 28
4.3 Examining mobile phones users’ actual adoption of
e-wallet in Malaysia ....………………………………………….... 30
4.3.1 Examining direct influence of government support on
mobile phones users’ actual adoption of e-wallet
in Malaysia.……………………………………………….. 32
CHAPTER 5 CONCLUSION ……………….....………………………………. 33
5.1 Main finding …………………………………………………….... 33
5.2 Implications ……………………………………………………..... 33
5.2.1 Theoretical implication.……………………….………….. 33

ix
5.2.2 Practical implication ....……………………….………….. 34
5.3 Limitation of study .…………………………………………….... 35
5.4 Recommendation of study .……………………………………..... 35
References …………………………………………………………………………… 36
Appendices…………………………………………………………………………… 42

x
LIST OF TABLES
Page
Table 3.1: Summary of items for constructs 19
Table 3.2: Coding for demographic-related variables 23
Table 3.3: Scale of Cronbach’s Alpha 24
Table 4.1: Demographic profile of respondent 27
Table 4.2: Results of testing construct reliability 28
Table 4.3: Results of Fornell-Larcker criterion 29
Table 4.4: Bootstrapping results 31

xi
LIST OF FIGURES
Page
Figure 1.1: Timeline of money evolution 1
Figure 1.2: 4G availability in Wilayah Persekutuan Kuala Lumpur in
percentage, 2019 6
Figure 2.1: Extended technology acceptance model 14
Figure 2.2: Conceptual framework of mobile phones users’ actual adoption
of e-wallet in Malaysia 15

xii
LIST OF ABBREVIATIONS
AA Actual adoption
AGFI Adjusted goodness-of-fix index
ATT Attitude
AVE Average variance extracted
B.C. Before Christ
BNM Bank Negara Malaysia
COVID-19 Coronavirus disease outbreak 2019
GS Government support
IA Intention to adopt
MCMC Malaysian Communication and Multimedia Communication
PEOU Perceived ease of use
PLS-SEM Partial Least Squares- Structural Equation Modeling
PR Perceived risk
PU Perceived usefulness
RFID Radio-frequency identification
SEM Structural Equation Modelling
SME Small and medium enterprise
SPSS Statistical Package for Social Science
TAM Technology acceptance model
TPB Theory of Planned Behavior
TRA Theory of reasoned action

xiii
LIST OF APPENDICES
Page
Appendix 1: Empirical results for construct reliability and validity…….………..42
Appendix 2: Empirical results for outer loadings ……………………….………..42
Appendix 3: Empirical results for Fornell-Larcker Criterion …………....……… 44
Appendix 4: Empirical results for bootstrapping …...………………...………….44

xiv
PREFACE
Mobile payments have become common technology in China nowadays to the extent that
paying with physical cash is practically being replaced. The popularity of e-wallet in China
somehow shows to provide a strong fundamental in the Chinese markets. With the
popularization of smartphone, the culture of making transaction via smartphone has become a
new norm in different countries. With the growing number of tourists from China, Asia
countries should learn some lessons to drive their market towards a cashless society. This can
enable the countries to fit themselves into the payment behaviour of Chinese tourist and
increase the tourism activities.
Furthermore, with the involvement of government to stimulate the adoption of e-wallet
among residents, it has motivated us to discover the role of government on actual adoption of
e-wallet in Malaysian context. This study is to explore the moderating effect of government
support on actual adoption of e-wallet by surveying the mobile phone users in Malaysia.
Lastly, we hope that our study can provide the readers with a better insight and
knowledge of the role of government on e-wallet adoption among the Malaysia citizens.

xv
ABSTRACT
The study is aimed to examine the moderating effect of government support on actual adoption
of e-wallet among mobile phone users in Malaysia. The study determines the presence of
moderating effect of government support on the actual adoption of e-wallet by including
determinants such as perceived ease of use, perceived usefulness, perceived risk, users’ attitude
and intention to adopt e-wallet with the aid of extended Technology Acceptance Model (TAM).
The target respondents for this study are the mobile phone users of e-wallet in Malaysia. Our
survey involves 434 respondents. Smart Partial Least Squares 3 software (Smart PLS 3) is used
to assist in our data analysis along the research. Reliability test, convergent and discriminant
validity, and significance of variables are applied in our data analysis. Our results indicate that
government support could not moderate the relationship between intention to adopt and actual
adoption of e-wallet. However, we find that government support could significantly provide
the direct positive influence on mobile phone users’ actual adoption of e-wallet.

1
CHAPTER 1: INTRODUCTION
1.1 Background
Money evolution is one of the most noteworthy accomplishments and civilization of human.
Money is used for trading goods during the early times and later for banking and financial
transaction. The form of money has changed from animal skin, metal, weapon to paper. First
the use of minted coins around 770 before Christ (B.C.) that replaces the use of metal tools like
weapons. Since 700 B.C., the use of paper money had been replaced by the usage of coins in
China. Until 16th century, the banks in Europe officially started to use banknotes for depositors
and borrowers.
Since 1950s, consumers start to adopt plastic money as their preferred payment method.
Apart from this, the use of plastic money such as debit and credit cards changed their behaviour
in daily transaction during the era of modernization. In the 1990s, e-payment is introduced to
substitute the actual physical cash in carrying out daily transactions including bill payment,
money transfer and even mobile banking. In 2011, with the popularization of smartphone,
Google became the first company that introduced the use of e-wallet in the world (Kalyani,
2016). Nowadays, the form of money has been currently changed to digital money (Ferreira &
Perry, 2015). The money evolution is shown in Figure 1.1.
Figure 1.1: Timeline of money evolution
Barter system
(9000-6000 B.C.)
Metal money and coins
(770 B.C.)
Paper money
(700 B.C.)
Plastic money
(1950s)
E-payment
(1990s)
E-wallet
(2011)

2
An e-wallet is known as a digital wallet. It is used as an online payment system to keep
information related to financial and personal information. In turn, users could make their online
purchases on products and services by transferring money to sellers via a smartphone
application, where its method of payment is the same with the use of debit and credit cards.
For e-wallet, it does not require customers to use the physical card in dealing with any
transactions. It is not similar to a debit card that links to bank saving account, the e-wallet does
not pay interest to the users for saving money in e-wallet, but it does compensate the users by
organizing cash back and discounts events for using them to make transactions. Unlike credit
cards, the balance in e-wallet needs to be reloaded by users for their transactions in the future.
Due to the popularity of using smartphones and the gradual increasing of e-commerce activities,
e-wallet is anticipated to be an effective tool that allows transactions to be more transparency
and efficiency.
Currently, the use of physical cash significantly declines in society due to the following
reasons. The first reason is to decrease the crime rate by encouraging users not to hold their
cash on hands. For example, in the context of United States, the usage of physical money that
involves all transactions has been accounted for 40.2% in 2012. However, the usage is recorded
at only 30% in 2017 and further declined to be 26% in 2018. In addition, debit cards are turned
to be a preference among consumers in making their payments. As a result, card payments have
made up to 51% of all financial transactions (Federal Reserve Bank of San Francisco, 2019).
In other nations, the transition from the use of physical cash payment to e-payment is observed
to happen in transforming their society into the cashless society. For example, the government
of Sweden has planned to eradicate the use of paper money by 2023 and managed to cut its
usage by 13% in 2018 (Sveriges Riksbank, 2018). On the other hand, the Indian government
has announced the demonetization campaign in 2016 and the government of United Kingdom
has managed to eliminate cash spending by 16% in 2018 (UK Finance, 2019).
By moving into the cashless society, crime rates in the nation could be further reduced and
eradicated. The increasing number of adopting electronic payments has contributed to the
declination of crime rates. For instance, Wright et al. (2017) conduct their pilot test on
individuals that received government incentives via electronic payments and those who
received them in cash or cheques. They find that crime rate in cashless regions of United States
3
declined by 9.2%. Their finding demonstrates that chances of holding cash on hand have
become low, thereby decreasing the possibility of occurring crime rates.
Second reason is to increase the convenience for users in making a transaction without
involving money exchange. In the cashless society, a simple swipe or scan via contactless
mobile payment has greatly improved consumers' purchasing experience. For example,
international travel could be easier and convenient even without cash. Furthermore, the
frustration of converting currency exchanges could also be eliminated. As a result, travelers
could digitally perform their every transaction without calculating the exchange rate manually.
As a result, they tend to be less anxious of missing cash during their travelling period because
every payment made is traceable in electronic payment application. Hence, they could spend
lesser time on searching for dollar bills and fumbling with foreign currency changes.
The understanding of acceptance motives and obstacles is important for users to develop
sustainable approaches in the application of e-wallet system from manufacturers to financial
institutions as well as from small to large vendors. Given that China boasts the world's most
robust mobile wallet market, however, the low adoption of e-wallet in most other Asian
countries has come into the mind. The technology giants, Alibaba and Tencent have ever since
dominated the global market with their own designated e-wallets, Alipay and WeChat Pay. The
popularity of e-wallet in China somehow shows to provide a strong fundamental for Chinese
markets. Yet South-East Asia should learn some lessons to drive their residents towards a
cashless society.
There are several local and international players across different markets in Southeast Asia
where the e-wallet race has attracted a heterogenous mix of firms. The two ride-hailing services
gain the highest popularity in the respective countries, which have their own payment platforms.
For example, Indonesia’s Go-Jek has Go-Pay and Singapore’s Grab has GrabPay. In Malaysia,
the number of licensed non-financial institutions for e-money issuers grew from 25 in 2016 to
47 at the end of June in 2018 with payment solutions provided via mobile applications by these
issuers (Central Bank of Malaysia, 2018).
4
In recent years, the mobile wallet market in China has transformed its payment landscape
drastically and it is matured enough to spread the contactless payment culture to other Asian
countries. China provides a large number of tourist arrivals and contributes to a large portion
of tourist income in Malaysia. As a result, Malaysia has imitated the mobile payment cultures
from China to suit the spending behaviour of the tourists especially from China. Malaysia has
welcomed over 2 million tourists from China since 2016. This number of arrivals for Chinese
tourist has increased to over 3 million in 2019. In 2019, the total expenditures from China
tourists has accounted for 17.8% of the total tourist expenditures in Malaysia (Tourism
Malaysia, 2020).
Since Malaysia has become one of the favourite travel destinations, some of the China-
based e-wallet issuers have also grabbed the opportunity to launch their e-wallet in Malaysia,
for example, Alipay and WeChat Pay. In addition, Malaysia government has implemented
digital incentives of eTunai Rakyat and ePENJANA to stimulate the adoption of e-wallet as
well as to boost the sluggish economy. Furthermore, during the COVID-19 pandemic, the
contactless payment method featured by e-wallet has played an important role to prevent the
spreading of virus. The e-wallet has proven its importance and convenience during this
challenging period and it is well-positioned to become a new trend in the payment system in
Malaysia.
1.2 Problem statement
In Malaysia, security, overspending, merchant acceptance and internet coverage are the major
factors that causing the low actual adoption of e-wallet among mobile phone users. To stimulate
the adoption among residents, the government has announced Budget 2020 to boost more
businesses into the digital in line with the Fourth Industrial Revolution (Ministry of Finance
Malaysia, 2019). Based on the Financial Sector Blueprint 2011-2020, The Malaysian
government also stood to save about 1% in cost savings to gross domestic product by
converting all payments into electronics (Central Bank of Malaysia, 2011). Hence, a transaction

5
through the use of e-wallet plays as an important role to provide a transformative impact in
making a cashless society for better connectivity.
According to Malaysia Payment Landscape (2018), 67% of Malaysian customers used
cashless payments mostly through debit card and online banking (Nielsen Malaysia, 2018).
According to Hand Phone Users Survey (2018), the percentage in penetration rate of
smartphones rose by 2.1% from 75.9% in 2017 to 78% in 2018 (Malaysian Communications
and Multimedia Commission [MCMC], 2019). In 2018, the survey also showed that 94.6% of
smartphone users are browsing the Internet via their smartphones (MCMC, 2019). Based on a
high smartphone penetration rate in Malaysia, the use of smartphones could perfectly act as a
method of performing transaction to deal without extra base charges (Central Bank of Malaysia,
2018). However, the use of e-wallet is only accounted for 8% of non-cash payment forms as a
significant distractor. Moreover, 50% of non-users worry about digital money theft and 27%
indicates that merchant acceptance is low (Nielsen Malaysia, 2018).
Firstly, security concern and risk are the biggest barriers that affect e-wallet users’ actual
adoption. The rising cases of abusing personal information and transaction records with the
adoption of e-wallet has led to higher risk concern among e-wallet users. The reason is that the
amount of licensed non-bank e-money issuers in Malaysia such as Boost and Touch N Go has
doubled and accumulated to 47 of them. This amount has provided an untruthful signal to non
e-wallet users. Based on the case published by Wong (2020), an e-wallet user reported that her
Touch N Go wallet has been hacked by an unknown user. The account was reloaded
automatically from her debit card and transfer to respective accounts amounting to RM3,000
within an hour. Several users were then become insecure because of the low protection
provided by e-wallet.
Secondly, people concern about the problem of overspending with the adoption of e-wallet.
The use of e-wallet could increase the number of transaction and the amount of cash flow.
People only need mobile devices to perform payments without carrying any cards or physical
money. Thus, the ease of adopting e-wallet would increase the chances of spending money on
unnecessary items as well. For example, 34% of non-users in e-wallet were worried regarding

6
over-expenditure (Nielsen Malaysia, 2018). The adoption of e-wallet increases users’ desire in
spending money. As reported by Central Bank of Malaysia (2018), the use of mobile payment
in 2017 has increased the number of transactions from 2 million to 33.7 million in the following
year with an average transaction size of RM23.80.
Thirdly, the issue of low actual adoption of e-wallet is the low rate of merchant acceptance
in Malaysia. Based on our observations in New Town of Kampar, several shops are seemed to
be accepting more than one e-wallet. Touch N Go has only 135,000 merchant acceptance points
respectively in nationwide (Touch N Go, 2020). The low rate of merchant acceptance is unable
to satisfy the high rate of adoption of e-wallet users in their daily spending.
Fourthly, the government in Malaysia still does not provide full coverage of mobile
networks even in Wilayah Persekutuan Kuala Lumpur (as shown in Figure 1.2). Lack of mobile
internet coverage is one of the root causes of mobile phone users to adopt e-wallet in Malaysia.
Limited internet coverage has caused the e-wallet users unable to make their payments in
under-development state. Therefore, mobile phone users refuse to adopt e-wallet and doubt the
usefulness of e-wallet as compared to physical money.
Figure 1.2: 4G availability in Wilayah Persekutuan Kuala Lumpur in percentage, 2019
Source: Mobile Network Experience Report (2019)
In order to significantly increase the actual adoption of e-wallet for Malaysians,
participating merchants and SMEs, the Malaysian government aims to provide a support by
launching the initiative of one-time RM30 digital stimulus. The terms and conditions require
88.5
90.6
95.9
83.9
70.9
82.8
0 20 40 60 80 100 120
MAXIS
CELCOM
YES
DIGI
U MOBILE
UNIFI

7
Malaysian has to be 18 years old and above with yearly income less than RM100,000. Such
requirement is to maintain an identity-verified account with selected e-wallet issuers. The
government has allocated up to RM450 million for Khazanah Nasional to implement this
digital stimulus which is expected to benefit up to 15 million Malaysians (Ministry of Finance
Malaysia, 2019). Other than that, during the pandemic of COVID-19, the Malaysian
government has rolled out with the ePENJANA initiative amounting to RM750 million to
encourage digital payment and practice social distancing. 15 million qualified Malaysians are
offered by one-time ePENJANA RM50 credits through e-wallet to boost the economy.
1.3 Research question
Does government support act as a moderator on the relationship between intention to use e-
wallet and actual adoption of e-wallet among mobile phone users in Malaysia?
1.4 Research objectives
The main research objectives is to examine:
i. The relationship of perceived ease of use, perceived usefulness and perceived risk
towards the attitude to use e-wallet among mobile phone users in Malaysia.
ii. The relationship between attitude to use-wallet and intention to use e-wallet among
mobile phone users in Malaysia.
iii. The relationship between intention to use-wallet and actual adoption of e-wallet among
mobile phone users in Malaysia.
iv. Whether government support can moderate the relationship between intention to use
e-wallet and actual adoption of e-wallet among mobile phone users in Malaysia.

8
1.5 Significance of study
This study can provide a reference in assisting government to make some improvements in e-
wallet services to increase the adoption of e-wallet among mobile phone users. If our finding
demonstrates that there is a moderating effect of government support on the actual adoption of
e-wallet, the government is suggested to improve the acceptance of e-wallet among mobile
phone users by implementing adequate regulations for e-wallet users. Furthermore, the
government also can implement a proper measurement in regulation to prevent the use of e-
money for money laundering and ensure issuer of e-wallet to address consumer protection,
education and privacy as their priority.
If our finding demonstrates that there is no moderating effect of government support in
stimulating the actual adoption of e-wallet, the government should corporate with issuer of e-
wallet to improve the adoption of e-wallet. Their cooperation is expected to enhance the safety
of the e-money data and records through the e-wallet system.
1.6 Chapter layout
After Chapter 1, the structure of thesis is presented as follows. Chapter 2 provides discussion
about the theoretical literature review for the variables used in this study. Chapter 3 provides
the research methodology, data collection, sampling design, analysis of data and research
instruments. Furthermore, Chapter 4 provides interpretation of the results from partial least
squares method for structural equation modelling. Lastly, Chapter 5 provides summarizes for
the entire study, suggestion of theoretical and practical implications, limitation and
recommendation for the study.
9
CHAPTER 2: LITERATURE REVIEW
2.1 Theoretical framework
Davis (1989) proposes the “Technology Acceptance Model” (TAM) to explain how the
technology users could accept the system. According to the author, perceived ease of use and
perceived usefulness are the main constructs in developing attitudes and behaviour towards the
implementation of information technology. To improve the model, Amoroso and Magnier-
Watanabe (2012) extend the TAM by including external determinants, perceived risk which is
omitted from the initial model. By including the important determinants, their extended model
could be used to explain better the technology acceptance in current society. They carry out a
survey of 250 respondents in Japan and find that perceived risk has an impact on attitude toward
using of mobile wallet. Lai and Zainal (2015), Ooi and Tan (2016) and Alkailani (2016) further
use the extended TAM on online payment acceptance to examine human behaviour towards
the use of this technology. Although existing studies using TAM have shown that the constructs
have an impact on people's decisions to use online payment, but majority of them are concerned
about the use and purpose to use. Hence, this study focus on the actual adoption of e-wallets.
Davis (1989) defines that perceived ease of use is the users’ perception on using a system
would be at least effort. System users’ perceived ease of use has been evaluated as an important
variable that will directly affects attitude development towards the technology system. This is
because if a system user can understand easily and use with ease, their desired output could be
generated via the system. According to Abrazhevich (2001), he finds that consumers prefer to
use provided e-payment system because its design is effective and easy to use. For example, if
the new payment system is easy to understand and use, customers can feel at ease to adopt and
use the e-payment.

10
Furthermore, Teo, Lim and Lai (1999) find that internet users’ perceived ease of use has an
impact on their attitudes and intention to use. Gefen, Karahanna and Straub (2003) conduct the
similar study by focusing on internet shoppers, they find that online commerce’s perceived
ease of use is important to the online shopper’s attitude to perform online shopping. Besides,
Yang (2005) finds that perceived ease of use affects the attitude of users towards mobile
payment in Singapore after conducting survey among 866 students. Based on studies by
Dahlberg and Mallat (2002), Ovum (2012), and Liébana-Cabanillas, Sánchez-Fernández and
Muñoz-Leiva (2014), perceived ease of use is one of the important determinants in shaping the
attitudes towards mobile payment adoption. Moreover, Chitungo and Munongo (2013) find
that perceived ease of use could provide interest and shaping attitudes on the usage of m‐
banking services in rural areas of Zimbabwe. They observe that perceived ease of use could
significantly contribute to the effect on users' attitude, hence affecting the intention to adopt m-
banking. By performing a survey on 530 respondents in context of Canada, Kafsh (2015) finds
that their perceived ease of use could be used in predicting their mobile wallet adoption.
By performing a survey on 410 shoppers who have smartphones, Hubert, Blut, Brock,
Backhaus and Eberhardt (2017) find that shoppers’ perceived ease of use of the technological
system could influence their attitude. Their finding demonstrates that those selected shoppers
tend to use their mobile payment system devices because it is easy to use relative to their current
payment methods, thereby shaping their attitude towards the system. Hence, the following
Hypothesis 1 is formed:
Hypothesis 1 (HT1): Users’ perceived ease of use significantly influences their attitude
towards technology.
Some studies find that perceived usefulness is one of the determinants of technology
acceptance. For instance, Davis, Bagozzi and Warshaw (1992) find that the usefulness in a
system or new technology is determined as perceived usefulness construct in the relevant
literature. Venkatesh and Davis (2000) examine TAM and affirm that perceived usefulness is
legitimate in foreseeing an individual's acknowledgment of numerous systems. Venkatesh,
Morris and Davis (2003) include the relevant construct into a similar model. Van der Heijden,
Verhagen and Creemers (2003) examine the influence of users’ perceived usefulness towards

11
their attitude to adopt a new technology. Based on their findings, users’ perceived usefulness
is directly affecting users’ attitude towards online purchasing. When the online store offers
efficient facilities, they obtain high evaluations in perceived usefulness from their respondents.
Nysveen (2005) finds that users’ perceived usefulness are likely to influence users’ attitude
toward mobile services. Apart for this finding, they categorize user-friendliness to be one of
indicators for users’ perceived usefulness.
Among 263 respondents in the content of Germany, Koenig-Lewis, Palmer and Moll (2010)
find that users’ perceived usefulness is a significant determinant mobile banking services
adoption. Lu, Cao, Wang and Yang (2011) explain that users could perform their transactions
and access their banking accounts at any time through mobile banking services. There is no
time limitation when performing financial transactions. Fee required for fund transfer via
mobile banking is lower than retail outlets as well. According to Akturan and Tezcan (2012),
mobile phone users tend to adopt mobile banking application if the application provides
convenience on financial transactions and users perceive it as advantageous. As a result, all
these benefits that consider as users’ perceived usefulness has an impact on their attitude to
adopt mobile banking services.
In the context of China, Li, Chung and Fiore (2017) examine the effect of consumers’
perceived usefulness on attitude towards electronic auctions. Their finding indicates that speed
of internet connection, effective and efficient functions provide good auction experience for
consumers which is related to consumers’ perceived usefulness. Min, So and Jeong (2018) state
that users’ perceived usefulness highly contributes to users’ attitude toward adopting Uber
mobile application. They find that advantage, compatibility and complexity of mobile
application are significantly related to users’ perceived usefulness. Based on these findings,
users’ perceived usefulness has a positive impact on technology acceptance. Users’ perceived
usefulness refer to how much the users willing to accept the hypothesis, which is utilizing a
system tend to improve their tasks performance. Hence, the following Hypothesis 2 is formed.
Hypothesis 2 (HT2): Users’ perceived usefulness significantly influences their attitude
towards technology.

12
Bauer (1960) defines perceived risk is the customer’s perception of negative side of an
outcome or uncertainty associated with some certain behavior in acceptance of new technology.
In Singapore, Teo and Yeong (2003) conduct a study of online shopping environment. They
find out the consumers’ risk concern is the loss of stored privacy data, the linked card credit
and hijack mobile phone account. Losing mobile phones and identity theft are the major
concerns of the consumers in online purchasing environment. Those risks become a barrier for
consumers to adopt e-payment technology. In the context of Saudi Arabia, Al-Gahtani (2011)
uses an extended TAM with three constructs such as trust, credibility and perceived risks
related to examine e-transactions. He demonstrates that security risk is the barrier of consumers
in using e-transactions technology. He also finds that perceived risk is one of important and
common factors could be used to examine the acceptance of e-technology.
In the context of Taiwan, Wu and Wang (2005) attempt to integrate innovation diffusion
theory, perceived risk in investigating the mobile commerce acceptance. They find that
consumers get attention to use mobile payment if the e-wallet system is safe and secure for
their daily transaction. In the context of Korea, Kim, Mirsobit and Lee (2010) find that security
could affect the adoption of e-wallet system among users. They conclude that the perceived
risk become higher due to the low security of system can become a restriction for users to adopt
mobile payment. In addition, Liébana-Cabanillas et al. (2014) demonstrate that users’ risk
concerns regarding the security of mobile payment systems are the key factors that affect their
attitude in adopting this technology. Hence, the following Hypothesis 3 is formed:
Hypothesis 3 (HT3): Users’ perceived risk significantly influences their attitude towards
technology.
Ajzen and Fishbein (1980) and Pee, Woon and Kankanhalli (2008) state theoretical models
such as TAM, Theory of Reasoned Action (TRA) and Theory of Planned Behavior (TPB) could
be used to demonstrate that attitude is an integral pre-requisite of the intention to adopt a certain
behaviour. According to Yang (2010), attitude represents human positive or negative feelings
towards the results of a certain behaviour. In other words, persons’ actual behaviour depends
on their attitude. With the adoption of an extended TPB model, Yang (2012) establishes a
connection between attitude and intention to adopt mobile shopping. Shiau and Luo (2012)

13
demonstrates that attitude significantly reflects the satisfaction of consumers with their future
intention to online group buying.
Crespo, de los Salmones Sánchez and del Bosque (2013) observe that former online
shopping buyers would demonstrate the effect of attitudes towards e-commerce on intention to
purchase in Spain. In the context of the United States, Bailey, Pentina, Mishra and Mimoun
(2017) argue that buyers’ attitudes towards technology positively influence their intention to
use in mobile payment. In near-field communication which is based on mobile payment
technology, Khalilzadeh, Ozturk, and Bilgihan (2017) use extended unified theory of
acceptance and use of technology model. They find that attitude to use positively influences
the behavioural intention to use in the North American restaurant industry. Furthermore, Chi
(2018) finds that attitude has a positive effect on the Chinese consumer's intention to opt for
mobile commerce by adopting an extended TAM approach. Hence, the following Hypothesis
4 is formed:
Hypothesis 4 (HT4): Users’ attitude significantly influences their intention towards
technology.
Davis, Bahozzi and Warshaw (1989) and Sun and Zhang (2004) interpret that intention to
adopt is a measure of the probability that the application tends to be approved by an individual
and forecasts the actual adoption of technology. Wu and Wang (2005) state that actual adoption
of e-wallet is the retention and the frequency of using e-wallet in a given period of time. Miltgen,
Popovič and Oliveira (2013) state that those internet users who have a stronger propensity to
adopt innovations are likely to adopt a new mobile payment system.
Based on the study in examining perception towards online electronic payment among
Greek bank’s customers, Rigopoulos and Askounis (2007) find the presence of a positive
relationship between intention to adopt and the real usage. By using TAM in the context of the
United States, Tao (2009) finds that a significant relationship between intention to use and
actual use of electronic information resources is not in the existence. In the context of India,
Gupta, Dogra, and George (2018) find that tourists’ intention to use the smartphone travel
14
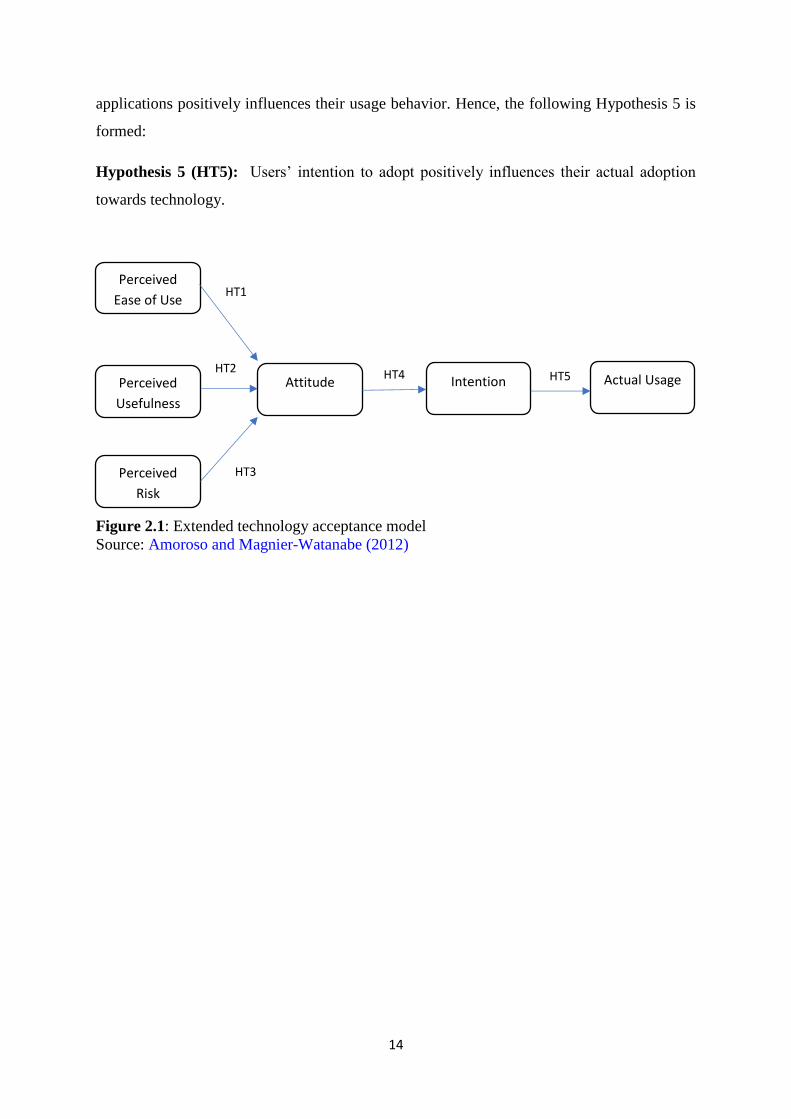
applications positively influences their usage behavior. Hence, the following Hypothesis 5 is
formed:
Hypothesis 5 (HT5): Users’ intention to adopt positively influences their actual adoption
towards technology.
Figure 2.1: Extended technology acceptance model
Source: Amoroso and Magnier-Watanabe (2012)
Perceived
Usefulness
Perceived
Ease of Use
Attitude Intention Actual Usage
Perceived
Risk
HT1
1
HT2 HT4
HT3
HT5

15
2.2 Conceptual framework
To overcome the inadequacy of the extended technological acceptance model that focus on
internet usage and mobile banking, we improve the model to better fit the actual e-wallet
adoption in the context of Malaysia by incorporating government support that acts as a
moderating variable. Our conceptual framework is shown in Figure 2.2.
Figure 2.2: Conceptual framework of mobile phones users’ actual adoption of e-wallet in
Malaysia
Source: Candidates’ own framework
Based on the five hypotheses from the theoretical framework, the attention of existing
studies that use the framework focus on adoption of internet and mobile banking in developed
countries such as the United States, Japan and Singapore. However, we find that there is a lack
of study on the actual e-wallet adoption in context of the developing country, namely Malaysia.
In this regard, we develop our conceptual framework to suit our study with the title of actual
adoption of e-wallet among mobile phone users in Malaysian context. To perform the analysis
according to the framework, we test the following hypotheses.
Hypothesis 1 (H1): Mobile phone users’ perceived ease of use significantly influences their
attitude towards e-wallet adoption in Malaysia.
Perceived ease
of use of using
e-wallet
Perceived risk
of using e-
wallet
Perceived
usefulness of
using e-wallet
Attitude of
using e-wallet
Intention of
using e-wallet
Actual
adoption of e-
wallet
Government
Support
H4
H1
H2
H3
H5
H6

16
Hypothesis 2 (H2): Mobile phone users’ perceived usefulness significantly influences their
attitude towards e-wallet adoption in Malaysia.
Hypothesis 3 (H3): Mobile phone users’ perceived risk significantly influences their attitude
towards e-wallet adoption in Malaysia.
Hypothesis 4 (H4): Mobile phone users’ attitude significantly influences their intention
towards e-wallet adoption in Malaysia.
Hypothesis 5 (H5): Mobile phone users’ intention significantly influences their actual
adoption towards e-wallet in Malaysia.
According to Moon Bretschneider (1997) and Caiazza (2016), they find that government
support plays an important role in the market penetration of some innovative technology
products and services. Their findings imply that government support is an efficient instrument
to motivate the demand of innovations by developing infrastructures. Those initiatives can
prevent the market failure of innovations that can generate huge advanced value to the society.
Lin and Ho (2009) find that government supports play an important role in the adoption of
innovations. They find that government support through providing resources and policies in
the adoption of radio-frequency identification (RFID) technology in China logistic industry. In
the context of South Korea, Kang and Park (2012) conduct a survey on SMEs in biotechnology
and they find that government support plays a positive role in promoting innovation output. In
the context of United Kingdom, Ramanathan, Ramanathan and Ko (2014) conduct a survey on
logistic firms to demonstrate that government supports could moderate the relationship
between users’ value attributes and RFID adoption. Furthermore, they find that the government
support has also received scant attention in the electric vehicle adoption literature. Based on
these existing findings, we consider government support as our moderator in moderating the
relationship between intention to use and actual adoption in our conceptual framework of e-
wallet.
The consideration of government support can enhance the TAM in order to have better
understand about the actual usage of e-wallet in Malaysia. We hypothesize that government
support could provide a stronger link between the intention to adopt e-wallet and actual

17
adoption of e-wallet among mobile phone users in Malaysia. Hence, the following Hypothesis
6 is tested.
Hypothesis 6 (H6): Government support positively moderates the relationship between
intention to adopt and actual adoption of e-wallet among mobile phone users in Malaysia.
2.3 Gap of literature
Most existing studies are found to use the TAM model in investigating adoption of technology
and mobile banking among targeted users. Although a few studies have examined adoption of
technology by considering the government support in some innovative technology products
and services, but there is still lack of studies that focus on the moderating effect of government
support between intention to adopt and actual adoption of e-wallet. Therefore, the aim of our
study is to examine whether government support can play a role of moderator in influencing
the relationship between intention to use and actual adoption of e-wallet in Malaysia.

18
CHAPTER 3: DATA AND METHODOLOGY
3.1 Data description
3.1.1 Targeted respondents
The targeted respondents for this study are the mobile phone users in Malaysia. To be
more specific, we decide to focus on the respondents who are using the e-wallet via
mobile phone. The responses from the targeted respondents can be used to study the
moderating effect of government support between the intention and actual adoption of
e-wallet in Malaysia.
3.1.2 Selected sampling technique
In this study, non-probability sampling technique is used because there is no sampling
frame for e-wallet users in Malaysia. Among non-probability sampling techniques, the
convenience sampling through online is adopted because we can obtain those mobile
phone users to be our respondents who are readily and available in spending their time
to fill the questionnaire.

19
3.1.3 Designed questionnaire
The designed questionnaire consists of Section A and B. In Section A, respondents are
required to provide their demographic-related information. For example, their gender,
age group, religion, education level, occupation, annual personal income and frequency
of using e-wallets. In order to conduct the preliminary analysis about their background,
a nominal scale is used for gender, religion, occupation and frequency of using e-wallets.
An ordinal scale is used for age group, education level and annual personal income.
In Section B, respondents are further required to indicate their response for each
statement about perceived ease of use, perceived usefulness, perceived risk, attitude,
intention to adopt e-wallet, government support and actual adoption of e-wallet. To
measure their response, the Likert scale is used. In order to avoid most respondents to
provide their neutral responses, a 6-Likert scale is chosen in our study, where the scale
ranges from 1 (denotes “Strongly Disagree”) to 6 (denotes “Strongly Agree”). All items
for each construct are shown in Table 3.1.
Table 3.1: Summary of items for constructs No. of
item(s)
Items Scale
Perceived
Ease of Use
3 PEOU1: The registration of e-wallet is easy.
PEOU2: The use of e-wallet is simple.
PEOU3: The use of e-wallet is easy to be learned.
Strongly
Disagree (1)
to Strongly
Agree (6)
Perceived
Usefulness
4 PU1: The use of e-wallet can perform my transaction(s)
quickly.
PU2: The use of e-wallet can control my payment
activities.
PU3: The use of e-wallet can improve effectiveness of
transaction(s).
PU4: The use of e-wallet can perform fund transfer to
others
Strongly
Disagree (1)
to Strongly
Agree (6)
Perceived
Risk
3 PR1: The use of e-wallet can provide security on my
personal information.
PR2: The use of e-wallet can secure my transaction(s).
PR3: The use of e-wallet can reduce error in my payment.
Strongly
Disagree (1)
to Strongly
Agree (6)

20
Table 3.1: (Continued)
No. of
item(s)
Items Scale
Attitude
4 ATT1: I use e-wallet because it is a current trend of
transaction.
ATT2: I use e-wallet because it is a better choice of
making my payment.
ATT3: I use e-wallet because it is widely accepted.
ATT4: I use e-wallet because it is easy to carry.
Strongly
Disagree (1)
to Strongly
Agree (6)
Intention to
Adopt
3 IA1: I intend to use e-wallet if the internet has high
coverage.
IA2: I intend to use e-wallet when the merchants have a
high acceptance rate.
IA3: I intend to use e-wallet if the application runs
smoothly.
Strongly
Disagree (1)
to Strongly
Agree (6)
Government
Support
5 GS1: The implementation cashless payment facilities in
government clinics encourage the adoption of e-wallet.
GS2: The implementation of “RM30 digital incentives”
encourages the adoption of e-wallet.
GS3: The implementation of “ePenjana Credit” through
voucher, cashback and discount encourages the adoption
of e-wallet.
GS4: The implementation of bill payment for government
utilities through “e-pay” encourages the adoption of e-
wallet.
GS5: The implementation of digital street parking
payment encourages the adoption of e-wallet.
Strongly
Disagree (1)
to Strongly
Agree (6)
Actual
Adoption
3 AA1: I prefer to use e-wallet rather than cash payment.
AA2: I will adopt e-wallet if people surrounding me are
using e-wallet.
AA3: I will adopt e-wallet because it increases my
purchase experience.
Strongly
Disagree (1)
to Strongly
Agree (6)
3.1.4 Method of data collection
The data collection is conducted through online method. We use this method as our
targeted respondents are the mobile phone users from Malaysia, it is the most cost-
effective method to collect data remotely through online. By considering the COVID-
19 pandemic, we do not perform face-to-face interview to prevent the spread of
COVID-19 virus by social distancing. In this case, we use Qualtrics platform to attach
our questionnaire and distribute to respondents through social media platforms such as
Facebook and Instagram. In order to get more targeted respondents from Malaysia, we
21
utilize the location targeting function under the platform of social media by sponsoring
our posts. A total of 538 mobile phone users have participated in our survey and we
manage to collect 434 useable questionnaires, which yield 80.7% of response rate. We
are able to get the respondents mostly from Wilayah Persekutuan Kuala Lumpur due to
the city has more active mobile phone users of e-wallet.
3.1.5 Pilot test
Pilot study is performed to determine response rate. For example, we could examine
the reliability of the questionnaire before we conduct data collection for the actual
survey. We distribute the questionnaire through both face to face and online method.
We distribute our questionnaires through Skype, Zoom and WhatsApp amid the period
of COVID-19 pandemic. We conduct the pilot test through face to face method with
our family members. For the relatives and friends that we cannot reach physically, we
adopt the online method for the pilot test. We target 30 family members and close
friends to be participated in the pilot test.
Throughout the test, we communicate with them to clarify whether they could
clearly understand about each statement in the questionnaire. Through their feedbacks,
we can make necessary amendments to ensure the use of appropriate language, sentence
structure and proper wording. With these precautions, the possibility of filling up some
questions without exactly understanding the content of those questions could be
eliminated. After completing the pilot study, we are able to determine the possible
problems that might happen and examine the effectiveness and efficiency of technique
used through data processing.

22
3.1.6 Data processing
Data processing is a method to retrieve and verify the primary data to be used for
computation process. The steps of data processing including questionnaire checking,
data editing and data coding. The data processing process is applied on the pilot test
results to make amendments if there is any. Smart PLS 3 is used to process the data
through computer to obtain meaningful information.
Before the questionnaire is distributed to our targeted respondents, the pilot test
questionnaire had gone through checking of grammar, item and sentence formation. All
items in the questionnaire are abstract and adopted from the existing studies. We detect
the omission of item and convergent validity between each item to ensure the data set
has no correlation. The identified problems are amended before we distribute to our
target respondents.
Data editing is used to review and adjust the set of collected data to ensure the
quality of the collected data of pilot test. The error or bias in data within the pilot test
questionnaire is detected and amended before being used to present as useful
information. This process ensures the data provided by respondents is unbiased,
complete and consistent.
After the data editing process, data coding would be carried out to classify each
item in the questionnaire by using code or number. The coding process could help us
to save time and simplify the data computation process.

23
Table 3.2: Coding for demographic-related variables Q1 Gender - “Male” = 0
- “Female” = 1
Q2 Age - “Below 21 years old” = 1
- “Between 21-30 years old” = 2
- “Between 31-40 years old” = 3
- “Between 41-50 years old” = 4
- “51 years old and above” = 5
Q3 Religion - “No religion” = 1
- “Muslim” = 2
- “Buddhist” = 3
- “Hindu” = 4
- “Christian” = 5
Q4 Education - “Primary” = 1
- “Secondary” = 2
- “Undergraduate” = 3
- “Postgraduate” = 4
Q5 Occupation - “Unemployed” = 1
- “Employed” = 2
- “Self-employed” = 3
- “Household” = 4
- “Student” = 5
- “Retiree” = 6
Q6 Annual personal income - “Below RM20,000” = 1
- “RM20,001-RM40,000” = 2
- “RM40,001-RM60,000” = 3
- “RM60,001-RM100,000” = 4
- “RM100,001-RM200,000” = 5
- “More than RM200,001” = 6
Q7 E-wallet usage frequency - “Never” = 1
- “Sometimes” = 2
- “Always” = 3
3.2 Methodology
3.2.1 Descriptive analysis
Descriptive analysis is used to simplify the information in a sensible way. We
summarize the data that collected in survey and give a description for the data. We carry
out descriptive analysis for the basic demographic frequency of respondents in our
study, for example, gender, age group, religion, education level, occupation, annual
income and weekly usage of e-wallet.

24
3.2.2 Measurement model
To evaluate our measurement model by appropriate reliability test, we need to perform
four steps. The first step, we examine the indicator reliability by using outer loading
analysis. If the value of outer loadings is below 0.7, it ought to have deletion of these
indicators. Loadings which give value above 0.7 are recommended. The value of outer
loadings greater than 0.7 indicates that indicators are satisfactory (Henseler, Ringle &
Sinkovics, 2009).
The second step is to assess the internal consistency of reliability by using
Cronbach's Alpha. To test the internal consistency of the measurement model, the value
of Cronbach's Alpha is required between 0 and 1. Furthermore, higher correlations
between items, a higher the alpha value (Tavakol & Dennick, 2011). A low alpha value
may be influenced by insufficient number of questions, poorly related between items
or heterogeneous. Table 3.3 shows that the scale of Cronbach’s Alpha. Based on the
rule of thumb for Cronbach’s Alpha, the scale should more than 0.7 to indicate that the
internal consistency is acceptable (Pallant, 2013).
Table 3.3: Scale of Cronbach’s Alpha Internal Consistency
α ≥ 0.9 Excellent
0.9 > α ≥ 0.8 Good
0.8 > α ≥ 0.7 Acceptable
0.7 > α ≥ 0.6 Questionable
0.6 > α ≥ 0.5 Poor
0.5 > α
Unacceptable
Source: Sharma (2016)
For the third step, the convergent validity of each construct measure is assessed.
The application of average variance extracted (AVE) is to evaluate convergent validity.
AVE is a technique, which can be used as a standard in examining the convergent
validity for our measurement model. When the value of AVE is equal or above 0.5, the
constructs are considered to have sufficient convergent validity (Gotz, Liehr-Gobbers

25
& Krafft, 2010). The value of AVE that exceeds 0.50 indicates that variance with 50%
and above could be sufficiently explained convergent validity (Chin, 2010).
The fourth step is to assess discriminant validity. The assessment of
discriminant validity in measurement model is to ensure the causal relationship between
latent variables by measuring the distinction between constructs. This validity is an
important approach to prevent multicollinearity issues. Fornell and Larcker criterion is
the most common strategy to be used for testing the discriminant validity. This method
is used to perform discriminant validity by comparing the square root of each AVE with
the correlation coefficient for every construct. The correlations of latent variable should
have a lower value than the square root of the AVE. If the AVE value is less than
another latent variable, it is considered as insufficient discriminant validity. Hence, the
AVE of each latent variable should be greater than the latent variable and have highest
squared correlation to other latent variable (Fornell & Larcker, 1981).
3.2.3 Structural model
The use of Partial Least Squares Structural Equation Modeling (PLS-SEM) is to
determine the complex structural equation model with small sample size (do Valle &
Assaker, 2016). To investigate the moderating effect of government support on actual
adoption of e-wallet, moderated PLS-SEM is employed in this study. Bootstrapping is
a great influential of non-parametric statistical technique in analysing PLS-SEM
statistics which using unknown sampling distribution. Bootstrapping is one of
techniques to capture the significance of mobile phone users’ perceived ease of use,
perceived usefulness, and perceived risk, following by their attitude and intention
towards actual adoption of e-wallet as well as the moderating effect of government
support.

26
Besides that, bootstrapping can be utilized to evaluate the volatility of statistic
by estimating constructs path coefficients (Streukens & Leroi-Werelds, 2016).
Furthermore, path coefficients consist a range of standardized values between –1 and
+1. If the value of path coefficient is near to zero, it demonstrates that the relationship
between the constructs is weak.

27
CHAPTER 4: RESULTS AND DISCUSSION
4.1 Examining respondents’ demographic profile
Table 4.1 shows the demographic profile among 434 respondents. Our respondents consist of
55.07% of males and the remaining are females. Moreover, most of our respondents are 21-50
years old. In terms of religious characteristics, 74.19% of respondents are Buddhist, followed
by 8.76% are Christian, 7.60% are Muslim, 5.30% are Hindu and 4.15% are non-religious.
70.05% of respondents are undergraduates and 15.44% of them are postgraduates. Furthermore,
majority of the respondents are a student which consist of 45.62% and 34.56% of respondents
are employees. Besides, 65.21% of total respondents have earned their annual personal income
below RM20,000, follow by 16.59% of them have earned between RM20,001-RM40,000
annually and 9.22% of them have earned between RM40,001-RM60,000 annually. In terms of
the weekly frequency of using e-wallet, 71.89% of respondents utilize e-wallet occasionally
whereas the rest 28.11% of respondents are using e-wallet frequently.
Table 4.1: Demographic profile of respondent. Frequency Percentage
Gender
Male 239 55.07
Female 195 44.93
Age
Below 21 42 9.68
Between 21-30 319 73.50
Between 31-40 48 11.06
Between 41-50 14 3.23
51 and above 11 2.53
Religion
No religion 18 4.15
Muslim 33 7.60
Buddhist 322 74.19
Hindu 23 5.30
Christian 38 8.76
Education
Primary 6 1.38
Secondary 57 13.13
Undergraduate 304 70.05

28
Table 4.1: (Continued)
Education (Continued) Frequency Percentage
Postgraduate 67 15.44
Occupation
Unemployed 42 9.68
Employed 150 34.56
Self-employed 31 7.14
Household 11 2.54
Occupation
Student 198 45.62
Retiree 2 0.46
Income
Below RM20,000 283 65.21
RM20,001-RM40,000 72 16.59
RM40,001-RM60,000 40 9.22
RM60,001-RM100,000 28 6.45
RM100,001-RM200,000 8 1.84
More than RM200,001 3 0.69
The use of e-wallet per week
Never 0 0
Sometimes 312 71.89
Always 122 28.11
4.2 Evaluating reliability of constructs
The measurement model has compromised seven constructs such as perceived ease of use,
perceived usefulness, perceived risk, users’ attitude, intention to adopt, actual adoption and
government support. As shown in Table 4.2, outer loadings retained for 25 items belong to all
constructs are above 0.70, while Cronbach’s alphas for all constructs are found to have values
exceeded 0.70. As a result, average variance extracted (AVE) values are turned to be higher
than threshold of 0.50. Therefore, we conclude that the measurement model has attained
adequate convergent validity.
Table 4.2: Results of testing construct reliability Variables Items Outer Loadings Cronbach’s Alpha AVE
PEOU PEOU1 0.841
PEOU2 0.886 0.832 0.748
PEOU3 0.867
PU PU1 0.760
PU2 0.705 0.767 0.590
PU3 0.858
PU4 0.741
PR PR1 0.841
PR2 0.898 0.829 0.744

29
Table 4.2: (Continued)
Variables Items Outer Loadings Cronbach’s Alpha AVE
PR (Continued) PR3 0.847
ATT ATT1 0.700
ATT2 0.829 0.820 0.651
ATT3 0.829
ATT4 0.860
IA IA1 0.838
IA2 0.900 0.832 0.749
IA3 0.857
AA AA1 0.836
AA2 0.836 0.802 0.716
AA3 0.865
GS GS1 0.753
GS2 0.860
GS3 0.824 0.869 0.654
GS4 0.820
GS5 0.780
Table 4.3 summarizes the results of discriminant validity, which is based on Fornell
and Larcker criterion. The results show that the square roots of AVE for PEOU, PU, PR, ATT,
IA, AA and GS are greater than the off-diagonal elements in the relevant rows and columns.
Overall, discriminant validity can be accepted for this model and supports the discriminant
validity between the constructs.
Table 4.3: Results of Fornell-Larcker criterion PEOU PU PR ATT IA AA GS
PEOU 0.865
PU 0.576 0.768
PR 0.410 0.566 0.862
ATT 0.505 0.669 0.588 0.807
IA 0.418 0.517 0.438 0.712 0.866
AA 0.432 0.590 0.601 0.710 0.603 0.846
GS 0.491 0.670 0.449 0.664 0.619 0.610 0.808

30
4.3 Examining mobile phones users’ actual adoption of e-wallet
in Malaysia
As shown in Table 4.4, the results indicate that mobile phone users’ perceived ease of use
positively influence their attitudes of e-wallet adoption at the significance level of 1%. This
suggests those mobile phone users tend to have a positive attitude in adopting e-wallet when
they notice that the use of e-wallet is only requiring a simple registration process and easy to
learn. This finding is consistent with the existing studies done by Chitungo and Munongo (2013)
and Kafsh (2015). Therefore, Hypothesis 1 is supported.
Perceived usefulness is found to have a significant effect at 1% level in influencing
users' attitude to use e-wallet. The reason in behind for supporting the finding is the features
such as the application speed, transaction tracking and fund transfer that could encourage users
to develop positive attitude towards adoption of e-wallet. The finding supports Hypothesis 2,
where it is consistent with the findings from the studies of Koenig-Lewis, Palmer and Moll
(2010) and Akturan and Tezcan (2012).
Moreover, mobile phone users’ perceived risk is found to positively influence their
attitudes towards e-wallet adoption at the significance level of 1%. This finding implies that
users concern about their privacy and security that subsequently increase their resistance
towards e-wallet. In other words, most of the users who are sensitive towards payment fraud
and identity theft tend to transact only if the system could guarantee the security. This finding
supports Hypothesis 3. It is consistent with those findings by Kim, Mirsobit and Lee (2010)
and Liébana-Cabanillas et al. (2014), demonstrating that users’ perceived risk on the security
of the e-wallet system can affect the users’ attitude towards e-wallet.
Overall, perceived usefulness is found to have greater influence on attitude as compared
to perceived ease of use and perceived risk due to its highest path coefficient. This indicates
that mobile phone users’ perceived usefulness is the most important in determining their
willingness to adopt e-wallet. This finding implies that mobile phone users would be more

31
concerned about the main e-wallet functions such as the effectiveness of transaction and auto-
reload feature rather than security and convenience of using the e-wallet.
Furthermore, mobile phone users’ attitudes are found to significantly influence their
intention towards e-wallet adoption at the level of 1%, agreeing with Yang (2012) and Bailey,
Pentina, Mishra and Mimoun (2017). Those mobile phone users who have good attitude would
increase their intention to use e-wallet, thereby leading to increase in their actual adoption.
Thus, this finding supports Hypothesis 4, where attitude can affect those users’ intention to
adopt e-wallet.
Our finding indicates that users’ intention to adopt also significantly influences their
actual adoption of e-wallet at 1% level. Hence, Hypothesis 5 is supported. The finding is
consistent with Rigopoulos and Askounis (2007), Tao (2009) and Gupta, Dogra, and George
(2018) who find that intention to use electronic technology can positively influence the actual
adoption and usage. This suggests that mobile users’ perceptions could influence their actual
adoption on e-wallet through their attitude and intention to use e-wallet.
The results indicate that government support does not moderate the relationship
between mobile phone users’ intention to use and their actual adoption even at the significant
level of 10%. As a result, Hypothesis 6 is not supported. The finding is contrary to the finding
of Ramanathan and Ko (2014), demonstrating that government support could act as a
moderator between the usability and actual adoption of RFID.
Table 4.4: Bootstrapping results Hypothesis Path Beta Standard Error T-Statistics P-Value Decisions
H1 PEOU―>ATT 0.142 0.043 3.283 0.001 Supported
H2 PU―>ATT 0.423 0.049 8.691 0.000 Supported
H3 PR―>ATT 0.291 0.039 7.529 0.000 Supported
H4 ATT―>IA 0.712 0.041 17.286 0.000 Supported
H5 IA―>AA 0.361 0.059 6.095 0.000 Supported
H6 Moderating Effect
(GS*IA―>AA)
-0.005 0.024 0.215 0.830 Not
Supported

32
4.3.1 Examining direct influence of government support on mobile
phones users’ actual adoption of e-wallet in Malaysia
After the testing Hypothesis 1-6, we find that Hypothesis 6 is not supported. Hence, we
tend to examine whether government support has a direct influence on actual adoption
among mobile phone users beyond our conceptual framework. Our results show that
government support has a significant direct effect on actual adoption of e-wallet among
mobile phone users at 1% level. Based on this, government support does not act as a
moderator to induce the mobile phone users' intention to actual adoption on e-wallet,
but it can provide a direct impact to the actual adoption of e-wallet.

33
CHAPTER 5: CONCLUSION
5.1 Main finding
Our empirical results indicate that government support could not moderate the relationship
between intention to adopt and actual adoption of e-wallet. However, we find that government
support could significantly provide the direct positive influence on mobile phone users’ actual
adoption of e-wallet. The reason is that government support is strong enough to induce people
to adopt e-wallet directly. The reason to justify such a finding is mobile phone users are
preferred to several direct initiatives implemented by the government in terms of campaign and
monetary form. For example, the implementation of "RM30 digital incentives” and “ePenjana
Credit”.
5.2 Implications
5.2.1 Theoretical implication
To the best of our knowledge, our finding can improve the existing theoretical
framework on e-payment from the perspective of the role of government in stimulating
the actual adoption of e-wallet. In this regard, various incentives implemented by the
government have been emphasized in measuring government support as a moderator
between intention to adopt and actual adoption of e-wallet, especially among mobile
phone users. Since our finding demonstrates that government support cannot act as a
moderator, we suggest that framework should be applicable to actual adoption of e-
wallet by focusing on the direct effect of government support instead of its moderating

34
effect. As a result, this will enhance understanding about the knowledge of this area
that can benefit to market players in globalizing the circular economy.
5.2.2 Practical implications
Our finding provides several practical implications in increasing the actual adoption of
e-wallet among users in the Malaysian context. Our finding demonstrates that
government support plays an important role to directly affect the adoption rate of e-
wallet in Malaysia. Since government support has a positive influence on the actual
adoption rate of e-wallet, the government can consider to work with e-wallet issuers in
continuously promoting the usage of e-wallet with attractive initiatives given to the
consumers and merchants. For example, the government can launch more initiatives in
the form of cashback and vouchers to greatly induce more citizens to adopt e-wallet in
their daily transaction.
Furthermore, the finding also shows that users tend to adopt e-wallet if the
payment method is widely accepted. Thus, the government can adopt the e-wallet
payment service in the government departments and agencies such as Road Transport
Department, Immigration Department and National Registration Department. With the
increasing payment spots in government departments, the adoption rate of e-wallet
among the citizens will also increase.
Other than that, the internet coverage is also a main concern of the respondents
to adopt e-wallet. Apparently, the weak internet coverage is discouraging users from
adopting e-wallet, especially in rural areas. Hence, the government can widen the
internet coverage especially in rural areas to increase the connectivity of business and
trading volumes through e-wallet across different regions.

35
5.3 Limitation of study
Our study only focuses on mobile phone users that consist of working and non-working adults.
Their response cannot be used to provide a comprehensive view of the actual adoption of e-
wallet. Indeed, the actual adoption of e-wallet between working and non-working adults is
different due to they have different behavioural in allocating their expenditure through the use
of e-wallet.
5.4 Recommendation of study
Based on the above limitation, we suggest that future researchers should separate the
respondents into those mobile phone users who are working and non-working adults in
examining actual adoption of e-wallet. Apart from this, a comparative study between two
groups of mobile phone users’ who are employed and unemployed can be performed. Since
employed and unemployed respondents will have a different perception and opinion towards
the use of e-wallet, their responses are expected can provide more insightful findings.

36
References
Abrazhevich, D. (2001). E-payment systems: issues of user acceptance. In Stanford-Smith, B.
and Chiozza, E. (Ed.), E-Work and E-Commerce. IOS Press (pp.354-360). Amsterdam.
Ajzen, I., & Fishbein, M. (1980). Understanding attitudes and predicting social behavior.
Retrieved from
https://pdfs.semanticscholar.org/0e84/1ed289a3cf9b9a799da4b344bd9397542c2e.pdf.
Akinwande, M. O., Dikko, H. G., & Samson, A. (2015). Variance inflation factor: As a
condition for the inclusion of suppressor variable(s) in regression analysis. Open Journal
of Statistics, 5, 754-767.
Akturan, U., & Tezcan, N. (2012). Mobile banking adoption of the youth market. Marketing
Intelligence & Planning, 30(4), 444–459.
Al-Gahtani, S. S. (2011). Modeling the electronic transactions acceptance using an extended
technology acceptance model. Applied Computing and Informatics, 9(1), 47-77.
Alkailani, M. (2016). Factors Affecting the Adoption of Internet Banking in Jordan: An
Extended TAM Model. Journal of Marketing Development and Competitiveness, 10(1),
39-52.
Amoroso, D. L. & Magnier-Watanabe (2012). Building a Research Model for Mobile Wallet
Consumer Adoption: The Case of Mobile Suica in Japan. Journal of Theoretical and
Applied Electronic Commerce Research, 7(1), 94-110.
Bailey, A.A., Pentina, I., Mishra, A.S. & Mimoun, M.S.B. (2017). Mobile payments adoption
by US consumers: an extended TAM. Int. J. Retail Distrib. Journal of Manag, 45 (6),
626–640.
Bauer, R.A. (1960). Consumer behavior as risk taking. In: Hancock, R.S.(Ed.), Dynamic
Marketing for a Changing World. Proceedings of the 43rd. Conference of the American
Marketing Association (pp. 389-398). Chicago.
Caiazza, R. (2016). A cross-national analysis of policies affecting innovation diffusion. The
Journal of Technology Transfer, 41(6), 1406-1419.
Central Bank of Malaysia. (2011). Financial Sector Blueprint 2011-2020. Retrieved from
https://www.bnm.gov.my/files/publication/fsbp/en/BNM_FSBP_FULL_en.pdf
Central Bank of Malaysia. (2018). Financial Stability and Payment Systems Report 2018.
Retrieved from https://www.bnm.gov.my/files/publication/fsps/en/2018/cp05.pdf
Central Bank of Malaysia. (2018). Transforming Mobile Phones into E-Wallets in Malaysia.
Retrieved from https://www.bnm.gov.my/files/publication/qb/2018/Q2/p7.pdf
Chi, T. (2018). Understanding Chinese consumer adoption of apparel mobile commerce: An
extended TAM approach. Journal of Retailing and Consumer Services, 44, 274–284.
37
Chin, W. W. (2010). How to write up and report PLS analyses. In Vinzi, V. E., Chin, W. W.,
Henseler, J., & Wang, H. (Eds.), Handbook of partial least squares: Concepts, methods
and applications in marketing and related fields (pp. 655-690). Berlin, Germany:
Springer.
Chitungo, S. K., & Munongo, S. (2013). Extending the technology acceptance model to mobile
banking adoption in rural Zimbabwe. Journal of Business Administration and
Education, 3(1).
Crespo, Á.H., de los Salmones Sánchez, M.M.G., & del Bosque, I.R. (2013). Influence of users'
perceived compatibility and their prior experience on B2C e-commerce acceptance.
Electronic Business and Marketing.
Dahlberg, T., & Mallat, N. (2002). Mobile Payment Service Development - Managerial
Implications of Consumer Value Perceptions. Proceedings of the Tenth European
Conference on Information Systems (pp. 649-657). Gdansk, Poland.
Davis, F. D. (1989). Perceived usefulness, perceived ease of use and user acceptance of
information technology. MIS Quarterly, 13(3), 319-340.
Davis, F. D., Bagozzi, R. P. & Warshaw, P. R. (1989). User acceptance of computer technology:
A comparison of two theoretical models. Management Science, 35(8), 982-1003.
Davis, F. D., Bagozzi, R. P., & Warshaw, P. R. (1992). Extrinsic and intrinsic motivation to
use computers in the workplace. Journal of Applied Social Psychology, 22(14), 1111.
do Valle, P. O., & Assaker, G. (2016). Using partial least squares structural equation modeling
in tourism research: A review of past research and recommendations for future
applications. Journal of Travel Research, 55(6), 695-708.
Federal Reserve of San Francisco. (2019). 2019 Findings from the Diary of Consumer Payment
Choice. Retrieved from https://www.frbsf.org/cash/publications/fed-
notes/2019/june/2019-findings-from-the-diary-of-consumer-payment-choice/
Ferreira, J. and Perry, M. (2015). Building an Alternative Social Currency: Dematerialising
and rematerialising digital money across media. Proc. HCI Korea’15, Dec 10-12, Seoul,
South Korea. Lee (Ed.), Hanbit Media, Inc., 122-131.
Fornell, C., & Larcker, D. F. (1981). Evaluating structural equation models with unobservable
variables and measurement error. Journal of Marketing Research, 18(1), 39-50.
Gefen, D., Karahanna, E., & Straub, D. (2003). Trust and TAM in online shopping: an
integrated model. MIS Quarterly, 27(1), 51-90.
Gotz, O., Liehr-Gobbers, K., & Krafft, M. (2010). Evaluation of structural equation models
using the partial least squares (PLS) approach. In Vinzi, V. E., Chin, W. W., Henseler,
J., & Wang, H. (Eds), Handbook of partial least squares: Concepts, methods, and
applications (pp. 691-711). Berlin, Germany: Springer.

38
Gupta, A., Dogra, N., & George, B. (2018). What determines tourist adoption of smartphone
apps? Journal of Hospitality and Tourism Technology, 9(1), 50–64.
Henseler, J., Ringle, C. M., & Sinkovics, R. R. (2009). The use of partial least squares path
modelling in international marketing. Advances in International Marketing, 20, 277-
319.
Hubert, M., Blut, M., Brock, C., Backhaus, C. & Eberhardt, T. (2017). Acceptance of
smartphone-based mobile shopping: mobile benefits, customer characteristics,
perceived risk and the impact of application context. Psychology and Marketing, 14(2),
175-194.
Kafsh, S. Z. (2015). Developing Consumer Adoption Model on Mobile Wallet in Canada.
Retrieved from
https://pdfs.semanticscholar.org/8eef/e3883075c5689cbcbb2344ab261a43b32ca1.pdf
Kalyani, P. (2016). An Empirical Study about the Awareness of Paperless E-Currency
Transaction like E-Wallet Using ICT in the Youth of India. Journal of Management
Engineering and Information Technology, 3(3), 2394-8124.
Kang, K. N., & Park, H. (2012). Influence of government R&D support and inter-firm
collaborations on innovation in Korean biotechnology SMEs.Technovation, 32(1), 68-
78.
Khalilzadeh, J., Ozturk, A. B., & Bilgihan, A. (2017). Security-related factors in extended
UTAUT model for NFC based mobile payment in the restaurant industry. Computers
in Human Behavior, 70, 460-474.
Kim, C., Mirsobit, M. & Lee, I. (2010). An Empirical Examination of Factors Influencing the
Intention to Use Mobile Payment. Computers in Human Behavior, 26, 310-322.
Koenig‐Lewis, N., Palmer, A., & Moll, A. (2010). Predicting young consumers’ take up of
mobile banking services. International Journal of Bank Marketing, 28(5), 410–432.
Lai, P. C., & Zainal, A. A. (2015). Perceived Risk As An Extension To TAM Model:
Consumers’ Intention To Use A Single Platform E-Payment. Australian Journal of
Basic and Applied Sciences, 9(2), 323-331.
Li, R., Chung, T.-L. (Doreen), & Fiore, A. M. (2017). Factors affecting current users’ attitude
towards e-auctions in China: An extended TAM study. Journal of Retailing and
Consumer Services, 34, 19–29.
Liébana-Cabanillas, F., Sánchez-Fernández, J., & Muñoz-Leiva, F. (2014). Antecedents of the
adoption of the new mobile payment systems: The moderating effect of age. Computers
in Human Behavior, 35, 464-478.
Lin, C. Y., & Ho, Y. H. (2009). An Empirical Study on the Adoption of RFID Technology for
Logistics Service Providers in China. International Business Research, 2(1), 23-36.

39
Lu, Y., Cao, Y., Wang, B., & Yang, S. (2011). A study on factors that affect users’ behavioral
intention to transfer usage from the offline to the online channel. Computers in Human
Behavior, 27(1), 355–364.
Malaysian Communications and Multimedia Commission (MCMC). (2019). Hand Phone
Users Survey 2018. Retrieved from
https://www.mcmc.gov.my/skmmgovmy/media/General/pdf/HPUS2018.pdf
Miltgen, C. L., Popovič, A., & Oliveira, T. (2013). Determinants of end-user acceptance of
biometrics: Integrating the “Big 3” of technology acceptance with privacy context.
Decision Support Systems, 56, 103-114.
Min, S., So, K. K. F., & Jeong, M. (2018). Consumer adoption of the Uber mobile application:
Insights from diffusion of innovation theory and technology acceptance model. Journal
of Travel & Tourism Marketing, 1–14.
Ministry of Finance Malaysia. (2019). Budget 2020 Speech. Retrieved from
http://www1.treasury.gov.my/index_en.html
Mobile Network Experience Report. (2019). 4G Availability in Kuala Lumpur (in %).
Retrieved from https://www.opensignal.com/reports/2019/04/malaysia/mobile-
network-experience Mobile
Moon, M. J., & Bretschneider, S. (1997). Can state government actions affect innovation and
its diffusion?: An extended communication model and empirical test. Technological
Forecasting and Social Change, 54(1), 57-77.
Nielsen Malaysia. (2018). Malaysia Payment Landscape 2018. Retrieved from
https://www.nielsen.com/content/dam/nielsenglobal/my/docs/2018/malaysiapayment-
landscape-2018
Nysveen, H. (2005). Intentions to Use Mobile Services: Antecedents and Cross-Service
Comparisons. Journal of the Academy of Marketing Science, 33(3), 330–346.
Ooi, K. B. & Tan, G. W. H. (2016). Mobile technology acceptance model: An investigation
using mobile users to explore smartphone credit card. Expert Systems with Applications,
59.
Ovum (2012). Digital Wallet Dynamics. Retrieved from
http://www.mahindracomviva.com/wpcontent/uploads/2015/02/Mahindra-Comviva-
Digital-Wallet-Whitepaper.pdf
Pallant, J. (2013). SPSS survival manual: A step by step guide to data analysis using IBM SPSS
(5th ed.). Berkshire, England: McGraw-Hill Education.
Pee, L. G., Woon, I. M. Y., & Kankanhalli, A. (2008). Explaining non-work related computing
in the workplace: A comparison of alternative models. Information & Management, 45,
120-130.

40
Ramanathan, R., Ramanathan, U., & Ko, L. W. L. (2014). Adoption of RFID technologies in
UK logistics: Moderating roles of size, barcode experience and government support.
Expert Systems with Applications, 41(1), 230-236.
Rigopoulos, G. & Askounis, D. (2007). A TAM framework to evaluate users’ perception
towards online electronic payments. Journal of Internet Banking and Commerce, 12(3),
1-6.
Sharma, B. (2016). A focus on reliability in developmental research through Cronbach’s Alpha
among medical, dental and paramedical professionals. Asian Pacific Journal of Health
Sciences, 3(4), 271-278.
Shiau, W. L., & Luo, M. M. (2012). Factors affecting online group buying intention and
satisfaction: A social exchange theory perspective. Computers in Human Behavior,
28(6), 2431–2444.
Streukens, S., & Leroi-Werelds, S. (2016). Bootstrapping and PLS-SEM: A step-by-step guide
to get more out of your bootstrap results. European Management Journal, 34(6), 1-15.
Sun, H. & Zhang, P. (2004). A methodological analysis of user technology acceptance.
Proceedings of the 37th. Annual Hawaii International Conference.
Sveriges Riksbank. (2018). Payment Patterns in Sweden 2018. Retrieved from
https://www.riksbank.se/globalassets/media/statistik/betalningsstatistik/2018/payment
s-patterns-in-sweden-2018.pdf
Tao, D. (2009). Intention to Use and Actual Use of Electronic Information Resources: Further
Exploring Technology Acceptance Model (TAM). AMIA 2009 Symposium
Proceedings, 629–633.
Tavakol, M., & Dennick, R. (2011). Making sense of cronbach’s alpha. International Journal
of Medical Education, 2, 53-55.
Teo, T. S. H., & Yeong, Y. D. (2003). Assessing the consumer decision process in the digital
marketplace. Omega, 31(5), 349-363.
Teo, T. S., Lim, V. K., & Lai, R. Y. (1999). Intrinsic and extrinsic motivation in Internet usage.
Omega International Journal of Management Science, 27(1), 25-37.
Touch N Go. (2020). Touch ‘n Go eWallet Joins the DuitNow Eco-system and Adopts the
DuitNow QR Code Standard. Retrieved from https://www.paynet.my/press-
release/2020/Touch-n-Go-eWallet-Joins-the-DuitNow-Eco-system.pdf
Tourism Malaysia. (2020). Arrivals by Country. Retrieved from
http://mytourismdata.tourism.gov.my/?page_id=232#!range=year&from=2012&to=2
019&type=55876201563fe,558762c48155c&destination=34MY&origin=32CN
UK Finance. (2019). UK Payment Markets Summary 2019. Retrieved from
https://www.ukfinance.org.uk/sites/default/files/uploads/pdf/UK-Finance-UK-
Payment-Markets-Report-2019-SUMMARY.pdf
41
Van der Heijden, H., Verhagen, T., & Creemers, M. (2003). Understanding online purchase
intentions: Contributions from technology and trust perspectives. European Journal of
Information Systems, 12(1), 41-48.
Venkatesh, V., & Davis, F. D. (2000). A Theoretical Extension of the Technology Acceptance
Model: Four Longitudinal Field Studies. Management Science, 46(2), 186–204.
Venkatesh, V., Morris, M. G., B. Davis, G., & Davis, F. D. (2003). User acceptance of
information technology: toward a unified view. MIS Quarterly, 27(3), 425-478.
Wong, A. (2020). A TNG eWallet account was allegedly “hacked”, RM3000 reloaded by card.
Retrieved from https://www.msn.com/en-my/news/national/a-tng-ewallet-account-
was-allegedly-%e2%80%9chacked%e2%80%9d-rm3000-reloaded-by-card/ar-
BB10RYV5
Wright, R., Tekin, E., Topalli, V., McClellan, C., Dickinson, T., & Rosenfeld, R. (2017). Less
Cash, Less Crime: Evidence from the Electronic Benefit Transfer Program. The Journal
of Law and Economics, 60(2), 361–383.
Wu, J.H., & Wang, S.C. (2005). What drives mobile commerce? An empirical evaluation of
the revised technology acceptance model. Information& Management, 42(5), 719-729.
Yang, K. (2010). Determinants of US consumer mobile shopping services adoption:
Implications for designing mobile shopping services. Journal of Consumer Marketing,
27(3), 262-270.
Yang, K. (2012). Consumer technology traits in determining mobile shopping adoption: An
application of the extended theory of planned behaviour. Journal of Retailing and
Consumer Services, 19(5), 484-491.
Yang, K. C. C. (2005). Exploring factors affecting the adoption of mobile commerce in
Singapore. Telematics and Informatics, 22(3), 257-277.

42
Appendices
Appendix 1: Empirical results for construct reliability and validity
Appendix 2: Empirical results for outer loadings
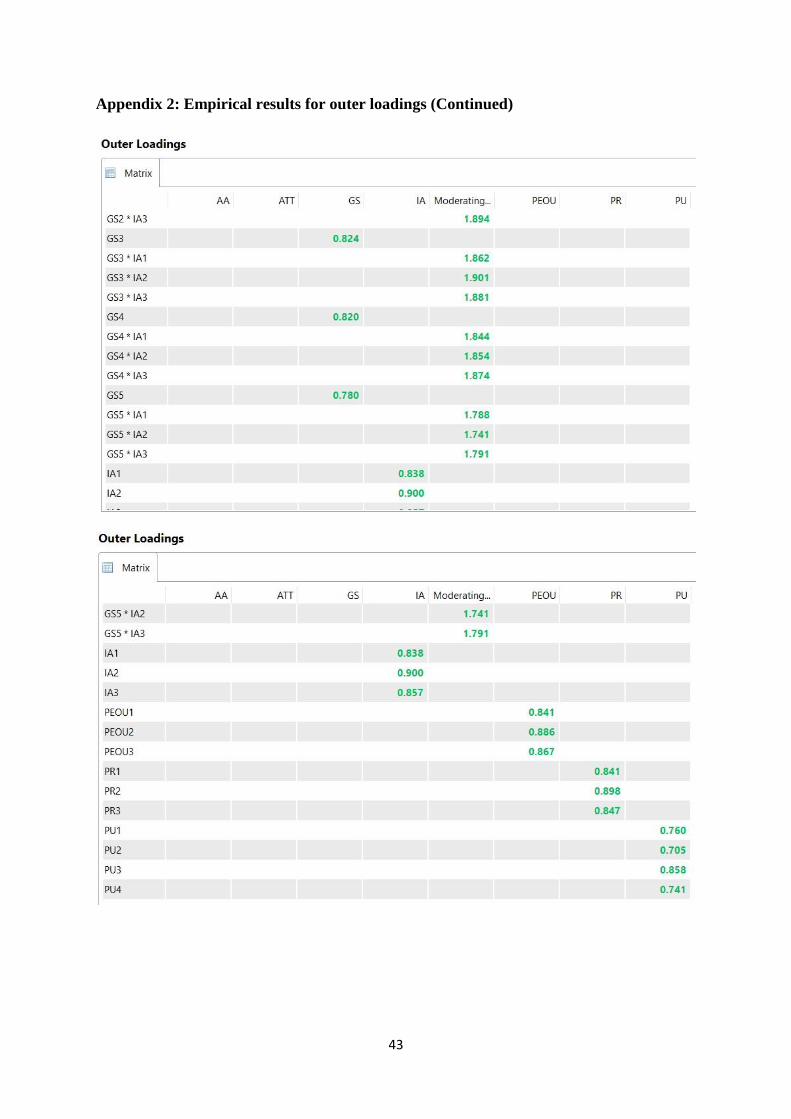
43
Appendix 2: Empirical results for outer loadings (Continued)
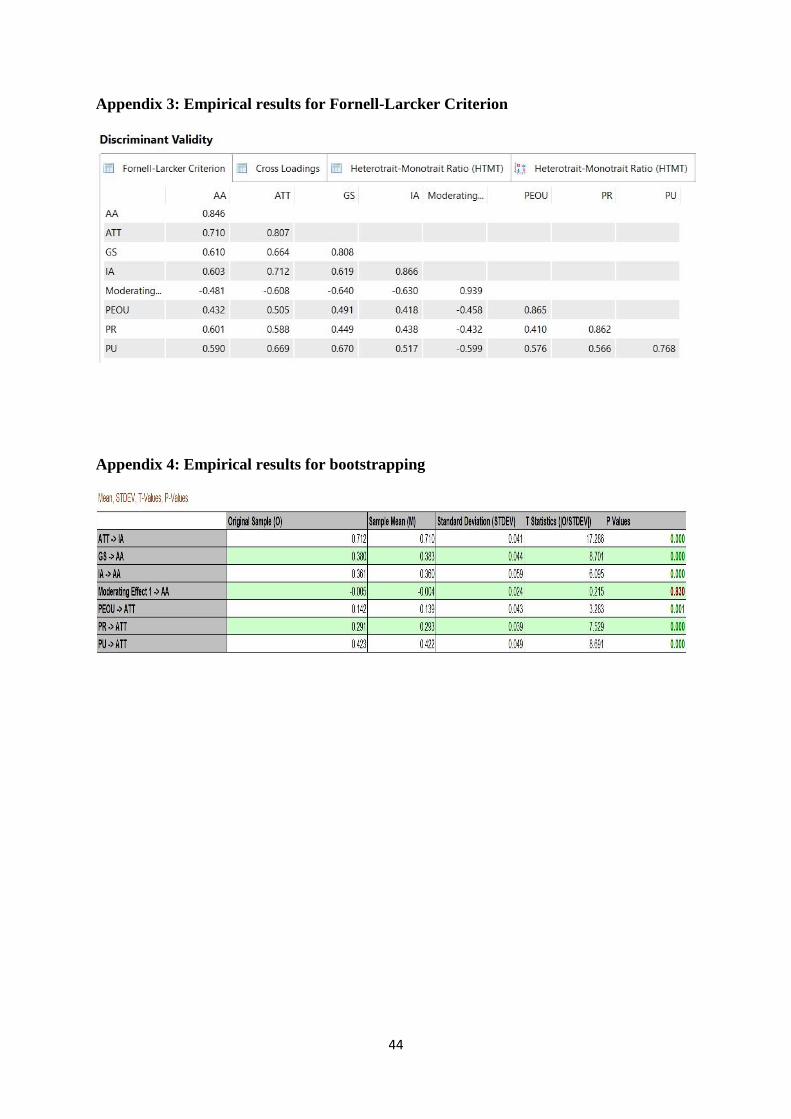
44
Appendix 3: Empirical results for Fornell-Larcker Criterion
Appendix 4: Empirical results for bootstrapping