Exploring the links between bilateral and regional trade ... Exploring the links between bilateral...
27
1 Exploring the links between bilateral and regional trade agreements and merchandise trade Felix Barbalet, Jared Greenville, Wayne Crook, Paul Gretton Productivity Commission and Robert Breunig * Crawford School of Public Policy, Australian National University Abstract Over 200 bilateral and regional trade agreements are currently in force, yet their impact remains a topic of debate. We analyse effects of 27 agreements that are of particular importance for Australia on the value of merchandise trade flows using data from 1970 up to the global financial crisis in 2008. We show that preferential trade agreements generally increase trade between members but that there are often offsetting negative effects on trade with non- signatories. In contrast to regional trading blocks and bilateral accords, agreements more oriented towards open trade principles have a positive impact on all trade flows of member nations. JEL Codes: F10, F13, F14, F49 Keywords: Free trade agreements, gravity model, merchandise trade, Australian trade policy * Corresponding author: Robert Breunig, 2.150 Crawford Building Extension (#132a), Crawford School of Public Policy, Lennox Crossing, Australian National University, Canberra ACT 0200, AUSTRALIA. Tel: +61-(0)2-6125-2148; email: [email protected] The views in this paper are those of the authors only and do not necessarily represent the views of the Productivity Commission. Robert Breunig would like to thank Blair Alexander for research assistance. We would like to thank the editor, Tom Kompas, and an anonymous referee for their help in improving the paper.
Transcript of Exploring the links between bilateral and regional trade ... Exploring the links between bilateral...

1
Exploring the links between bilateral and regional trade agreements and merchandise trade
Felix Barbalet, Jared Greenville, Wayne Crook, Paul Gretton
Productivity Commission
and
Robert Breunig* Crawford School of Public Policy, Australian National University
Abstract
Over 200 bilateral and regional trade agreements are currently in force, yet their impact remains a topic of debate. We analyse effects of 27 agreements that are of particular importance for Australia on the value of merchandise trade flows using data from 1970 up to the global financial crisis in 2008. We show that preferential trade agreements generally increase trade between members but that there are often offsetting negative effects on trade with non-signatories. In contrast to regional trading blocks and bilateral accords, agreements more oriented towards open trade principles have a positive impact on all trade flows of member nations.
JEL Codes: F10, F13, F14, F49
Keywords: Free trade agreements, gravity model, merchandise trade, Australian trade policy
* Corresponding author: Robert Breunig, 2.150 Crawford Building Extension (#132a), Crawford School
of Public Policy, Lennox Crossing, Australian National University, Canberra ACT 0200, AUSTRALIA. Tel: +61-(0)2-6125-2148; email: [email protected]
The views in this paper are those of the authors only and do not necessarily represent the views of the Productivity Commission. Robert Breunig would like to thank Blair Alexander for research assistance. We would like to thank the editor, Tom Kompas, and an anonymous referee for their help in improving the paper.
2
Introduction
Since the early 1960s, the number of trade agreements in force and notified to the World Trade Organization (WTO) has grown from 9 to almost 280, more than 200 of which deal with merchandise trade. More than half of these agreements have been finalised since 1990. In addition to the agreements notified to the WTO, there are a substantial number of other regional and bilateral agreements that influence trade relations between countries (for example, Asia-Pacific Economic Co-operation (APEC) forum and agreements between some members of the former Soviet Union).1 As well as increasing in number, the scope of agreements has expanded from focusing on merchandise trade to including many non-merchandise trade provisions.
The increasing number and overlapping nature of these agreements has led to a significant increase in the number of global trading links potentially affected by such arrangements — both directly (trade between members) and indirectly (trade between members and non-members). The growing number and influence of bilateral and regional trade agreements (BRTAs) warrants investigation of their impact on trade.
In this paper, the effects of 27 trade agreements on the value of merchandise trade flows are examined using a comprehensive trade database covering the period 1970 up to the global financial crisis in 2008. The effects of an agreement are assessed by comparing the levels of trade before and after an agreement entered into force, while controlling for other determinants of trade. The analysis is intended to shed light on the association between broad BRTA design features and the significance and direction of influence that these have on trade flows. For example, it makes it possible to draw a distinction between the effects of bilateral or regional preferential arrangements (such as the North American Free Trade Agreement (NAFTA) and the European Economic Community (EEC) and those more oriented towards open or non-discriminatory principles (such as the Association of South-East Asian Nationals (ASEAN) and APEC). It also indicates what type of agreement, short of multilateral trade liberalisation under the auspices of the WTO, is likely to yield greatest economic benefits.
We make several contributions to the literature. First, we study a broad set of diverse agreements using data on 140 countries. We examine trade within trading blocks and BRTA partners, but also trade between block members and countries outside the trade agreement. We include zero trade values in our model and use a Poisson model to capture both zero and positive trade flows. Using fixed effect panel data techniques provides a flexible approach to the incorporation of country-specific effects and we use country-pair dummies for both import and export flows to allow for asymmetric trade resistance. Panel data also allows us to account for the timing and duration of trade agreements. We use our results to categorize agreements as
1 The WTO reports 204 notified agreements pertaining to merchandise trade in-force in 2010, but this
underestimates the actual number of agreements in force as many are not notified to the WTO. In 2006, there were at least 130 agreements not notified to the WTO (Medvedev 2010).

3
inward-/outward-looking depending upon the balance of import and export effects and breadth of coverage of agreement in terms of the amount of trade that is captured within the agreement.
We find that trade agreements, for the most part, lead to increased trade. This increased trade is mostly within BRTA member countries. For many agreements, this increased trade with BRTA partners comes at the cost of decreased trade with non-signatories to the trade agreement. Trading blocks and bilateral agreements appear to have diversionary trade impacts whereas broad agreements to promote trade and lower tariffs on a most favoured nation basis appear to have beneficial trade effects for countries both with other members of the agreement and with countries outside the agreement area.
We briefly review some of the previous studies and their findings. We then present the gravity model which provides the estimation framework for our study and most of the previous studies. We preview the methodological issues involved in the application of the gravity model to the study of trade agreements. We then present our data, estimation equation and results. We summarize and conclude in the final section.
Evidence on the impact of trade agreements
Early work on the impacts of preferential trade agreements (the EEC and the European Free Trade Association (EFTA)) by Aitken (1973) suggested that agreements created trade in early years but, in later years, were likely to divert trade. (Trade diversion is when there is no net increase in trade but where trade is shifted from a country which is not a member of the trade agreement to one which is.) Since that time, a broad literature about the impact of trade agreements has developed.
Studies of European based agreements have found evidence that BRTAs increase trade. Bayoumi and Eichengreen (1995) examined the EEC and EFTA agreements and found that the impact on members changed over the life of the agreements. Their examination of EFTA found that overall, it was trade creating, while the EEC created trade between members but also had trade diversionary effects.
Sova and Sova (2009) found that bilateral agreements between the European Union 15 and Central and Eastern European countries were trade creating for the partners. Further, while not specifically modelling extra-group effects, the authors found that the trade importance of the European Union for these Central and Eastern European countries increased dramatically over the period of operation.
Carrere (2006) examined trade data for 130 countries over the period 1962 to 1996 to explore the impact of eight regional trade agreements — EEC, Andean, NAFTA, the Central American Common Market (CACM), Mercado Común del Sur (MERCOSUR), ASEAN, EFTA and the

4
Latin American Integration Association (LAIA).2 Carrere (2006) found that overall, while agreements created trade between members, they also had significant trade diversionary impacts. The ASEAN and LAIA agreements were found to be the only agreements associated with extra-group trade creation.
In a study of trade agreements between developing countries, Coulibaly (2009) found mixed effects of trade creation between members and non-members. All agreements examined, except the South Asia Preferential Trade Agreement, were found to create trade between members. However, as with other studies, the ASEAN agreement was found to be associated with trade creation both between members and between members and non-members.
A number of studies have focused on the US–Canada and NAFTA agreements. Clausing (2001) examined the US–Canada trade agreement using Harmonized System 10-digit US import data. The study found that significant intra-group trade creation was associated with the formation of the agreement — intra-group trade levels were estimated to be 26 per cent higher than could be expected in the absence of the agreement. Further, Clausing found no evidence of trade diversion. USITC (2002) compared Mexico’s import demand responsiveness to tariff preferences and found that it increased following the implementation of NAFTA. This was associated with increased confidence accompanying the NAFTA tariff cuts. Romalis (2007) found that while both the US–Canada and NAFTA agreements were associated with increased trade between partners, trade diversion was significant. In the case of NAFTA, the significance of the estimated trade diversion most likely resulted in a welfare loss for Mexico. Coulibaly (2009) found that while NAFTA was associated with increased trade between members, it had mixed effects on exports and imports between members and non-members — imports from non-members into the group increased, with exports from members to non-members declining. Magee (2008) finds important trade diversion effects and finds, as we do, that controlling for fixed effects reduces the estimated impacts of trade agreements.
Adams et al. (2003) and Cipollina and Salvatici (2010) are similar to this paper in exploring a wide range of agreements. Generally, the results obtained are consistent with those above, with the most variation seen in the extra-group effects. Of the agreements examined, the ASEAN agreement is the only one reported to be associated with both positive intra-group and extra-group effects (APEC was not examined in these two papers). Negative or mixed results on extra-group trade are reported for the other agreements included in the study. This suggests that the characteristics of BRTAs themselves, the broader circumstances surrounding the introduction of agreements and the composition of the membership have confounding influences on potential outcomes (World Bank 2005).
Our paper is similar to recent studies by Baier and Bergstrand (2007), Anderson and Yotov (2011) and Bergstrand, Larch and Yotov (2013) which all attempt to control for asymmetric
2 See Table 1 for notes on which countries are included in which agreements.
5
trade resistance effects between countries. They do not study the same mix of countries that we do, having a more European or American focus. They group some countries up into a `rest of the world’ category in a way that does not make sense for Australia and they do not necessarily focus on the key trade agreements for Australia. Baier and Bergstrand (2007) find much bigger effects of free trade than we do, particularly for FTAs to which the U.S. is a member. Bergstrand et al. (2013) focus on the effect of country-pair specific technological innovations and the possibility that failure to account for these has biased upwards the effect of free trade agreements and the decline in the distance effect of international trade. Anderson and Yotov (2011), for the most part, find similar size free trade effect as we do.
We next discuss the gravity model that forms the main estimating approach in the papers discussed above. We then turn our attention to several methodological issues involved in implementing the gravity model and then our data and results.
The gravity model of trade
The gravity model allows the examination of the effects of policies that affect trade, such as trade agreements, while abstracting from other causal influences. As implied by the name, the gravity model is a model of trade flows based on an analogy with the law of gravity in physics — relating trade between two countries to their size and the distance between them (Anderson 1979). The gravity model has been shown to be consistent with a number of theoretical models of international trade (see, for example, Anderson and van Wincoop 2003).
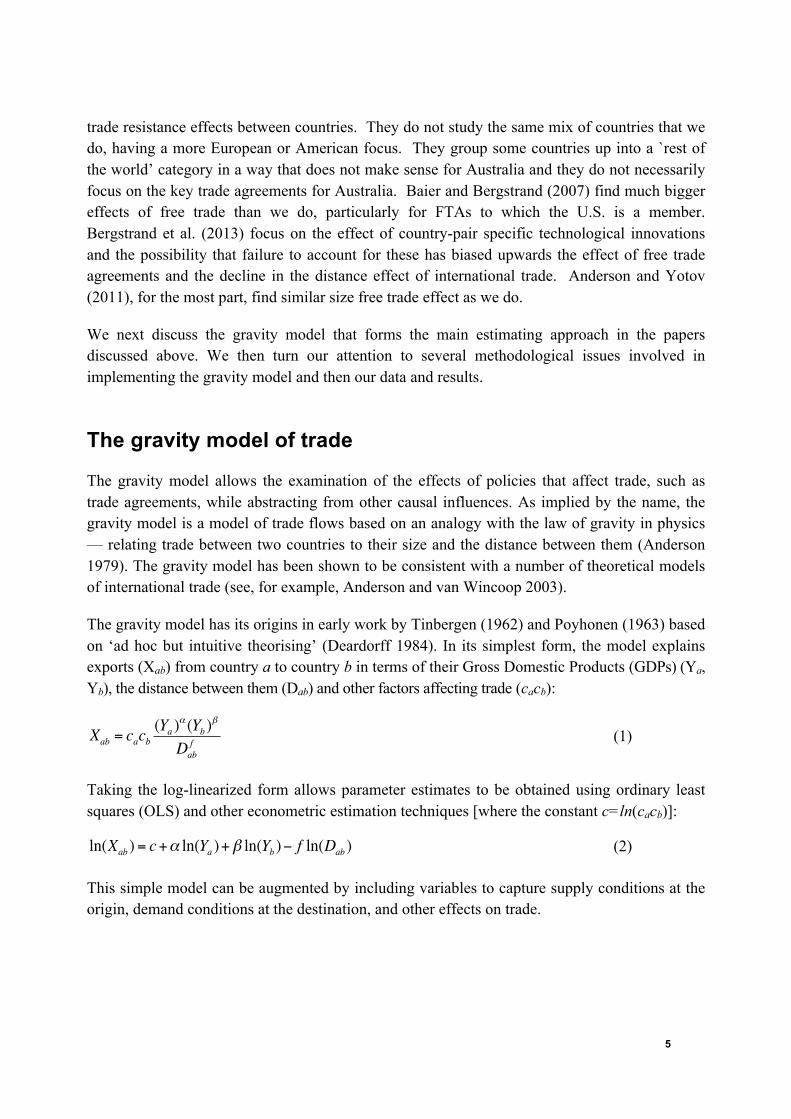
The gravity model has its origins in early work by Tinbergen (1962) and Poyhonen (1963) based on ‘ad hoc but intuitive theorising’ (Deardorff 1984). In its simplest form, the model explains exports (Xab) from country a to country b in terms of their Gross Domestic Products (GDPs) (Ya, Yb), the distance between them (Dab) and other factors affecting trade (cacb):
Xab = cacb(Ya )
α (Yb )β
Dabf (1)
Taking the log-linearized form allows parameter estimates to be obtained using ordinary least squares (OLS) and other econometric estimation techniques [where the constant c=ln(cacb)]:
ln(Xab ) = c+α ln(Ya )+β ln(Yb )− f ln(Dab ) (2)
This simple model can be augmented by including variables to capture supply conditions at the origin, demand conditions at the destination, and other effects on trade.

6
Methodological issues
Findings from the studies reviewed above vary somewhat based upon methodological approaches. In this section we highlight several important methodological issues in the application of the gravity model to understanding the effect of trade agreements. In the variable definition and model specification sections below, we explain in detail how we address these methodological issues in this paper.
Early papers used cross-sectional data and suffered from omitted variable bias due to unobservable country-specific effects. In particular, it is important to control for trade costs and resistance to trade at the country level. These are not easily captured through observable data. Once panel data are available, fixed effects estimation allows controlling for unobservable country-specific effects and allows those effects to be correlated with observed covariates. It also allows for country pair dummies (as in Carrere (2006)) or asymmetric effects between countries depending upon which country is importing and which is exporting (as we use in this paper). Panel data also allows for the timing of trade agreements to be studied.
Fixed effects estimation does not allow for the estimation of time-invariant effects (such as being land-locked.) If such variables are of interest, the fixed effects vector decomposition as used by Sova and Sova (2009) provides one solution.
The treatment of zero values in trade data between countries has been shown to have a material impact on results. Again, early papers used ordinary least squares despite a large percentage of zeros values and truncation from below at zero. (Carrere (2006) uses a linear panel model, for example.) Adams et al. (2003) and Felbermayr and Kohler (2004) tested the appropriateness of alternative estimators in the presence of zero trade flows. They suggested that the Tobit estimator is superior to OLS. The Tobit estimator assumes a truncated normal distribution and various authors (Liu 2007; Westerlund and Wilhelmsson 2009; Burger et al. 2009) have argued that this does not fit the data. Burger et al. (2009) compare ordinary least squares, Poisson, zero-inflated Poisson, negative binomial and zero-inflated negative binomial and show that results can vary widely depending upon how zero values are treated. They argue for the two Poisson models.
A related issue is how to treat zero trade values in a model where variables are specified in logs. Some early papers either dropped all the zeros or replaced the zeros with small positive values. Helpman, Melitz and Rubinstein (2008) showed that studies that discard bilateral trade links for which no trade occurs are likely to derive biased results as a consequence. They argued that by focussing solely on bilateral trade links where trade always occurs, biases downwards the estimated effect of trade barriers because it is the barriers which act as constraints at the extensive margin (stopping the development of new trade flows) that are the most costly. Burger et al. (2009) show that dropping zeros or replacing them with small values both can heavily influence results and introduce large bias in estimates.
In this paper we use panel data and a Poisson model with fixed effects and model trade values in levels allowing inclusion of zeros in estimation. We allow for trade resistance to be
7
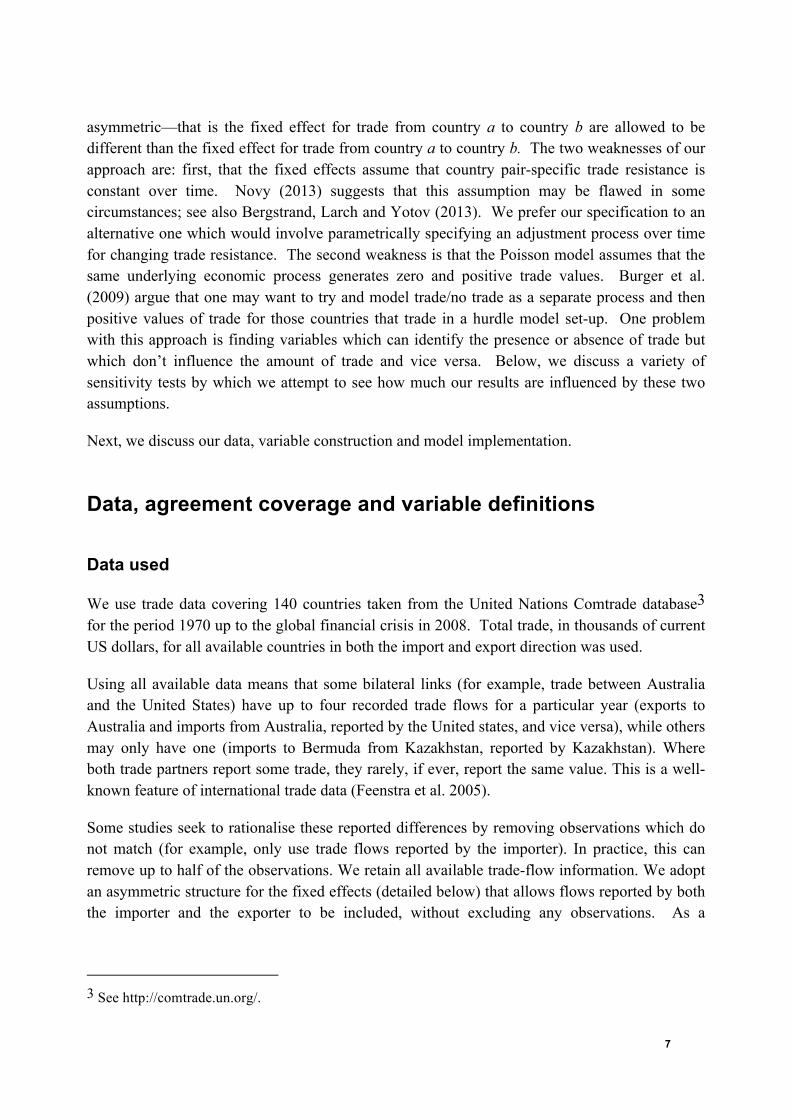
asymmetric—that is the fixed effect for trade from country a to country b are allowed to be different than the fixed effect for trade from country a to country b. The two weaknesses of our approach are: first, that the fixed effects assume that country pair-specific trade resistance is constant over time. Novy (2013) suggests that this assumption may be flawed in some circumstances; see also Bergstrand, Larch and Yotov (2013). We prefer our specification to an alternative one which would involve parametrically specifying an adjustment process over time for changing trade resistance. The second weakness is that the Poisson model assumes that the same underlying economic process generates zero and positive trade values. Burger et al. (2009) argue that one may want to try and model trade/no trade as a separate process and then positive values of trade for those countries that trade in a hurdle model set-up. One problem with this approach is finding variables which can identify the presence or absence of trade but which don’t influence the amount of trade and vice versa. Below, we discuss a variety of sensitivity tests by which we attempt to see how much our results are influenced by these two assumptions.
Next, we discuss our data, variable construction and model implementation.
Data, agreement coverage and variable definitions
Data used
We use trade data covering 140 countries taken from the United Nations Comtrade database3 for the period 1970 up to the global financial crisis in 2008. Total trade, in thousands of current US dollars, for all available countries in both the import and export direction was used.
Using all available data means that some bilateral links (for example, trade between Australia and the United States) have up to four recorded trade flows for a particular year (exports to Australia and imports from Australia, reported by the United states, and vice versa), while others may only have one (imports to Bermuda from Kazakhstan, reported by Kazakhstan). Where both trade partners report some trade, they rarely, if ever, report the same value. This is a well-known feature of international trade data (Feenstra et al. 2005).
Some studies seek to rationalise these reported differences by removing observations which do not match (for example, only use trade flows reported by the importer). In practice, this can remove up to half of the observations. We retain all available trade-flow information. We adopt an asymmetric structure for the fixed effects (detailed below) that allows flows reported by both the importer and the exporter to be included, without excluding any observations. As a
3 See http://comtrade.un.org/.

8
sensitivity test, we re-estimated our models using only importer-provided data and again using only exporter-provided data. The main conclusions of our study are unaffected.
Agreement coverage
A total of 27 agreements have been included in this study (table 1). The agreements were chosen for inclusion on the basis that either:
• Australia is a member (ANZCERTA, Australia–PNG, SPARTECA and APEC);
• they are likely to affect trade flows of Australia or its major trading partners (including the EEC, EFTA, ASEAN and NAFTA); or
• they are representative of a cross section of BRTAs (including agreements involving the EEC and third countries, and agreements involving Central and South American countries such as CACM, MERCUSOR and Chile–MERCUSOR).

9
Table 1 BRTA membership and dynamics Agreement Countries included in the groupa Date APEC Australia, Brunei, Canada, Indonesia, Japan, Korea, Malaysia, New Zealand,
Philippines, USA, Singapore, Thailand; Chile (from 1994); China and Hong Kong, China (from 1991); Mexico, Papua New Guinea (from 1993); Peru, Russian Federation, Vietnam (from 1998)
1989
ASEAN-CEPT Indonesia, Malaysia, Singapore, Philippines and Thailand; Lao PDR, Myanmar, Vietnam (from 1997)
1992
ANZCERTA Australia, New Zealand 1983 Australia–PNG Australia, Papua New Guinea 1977 SPARTECA Australia, Fiji, New Zealand, PNG, Solomon Islands 1981 EEC 27 Belgium, Luxembourg, France, Germany, Italy, Netherlands; United
Kingdom, Denmark, Ireland (from 1973); Greece (from 1981); Spain, Portugal (from 1986); Austria, Finland, Sweden (from 1995); Cyprus, Czech Republic, Estonia, Hungary, Latvia, Lithuania, Malta, Poland, Slovenia, Slovak Republic (from 2004); Bulgaria, Romania (from 2007)
1958
EEC–Poland EEC, Poland 1994-2003 EEC–Romania EEC, Romania 1995-2006 EEC–Swiss EEC, Switzerland 1973 EEC–Egypt EEC, Egypt 1978 EFTA Norway, Switzerland; Austria (to 1995); Denmark, United Kingdom (to 1972);
Portugal, Sweden (to 1985); Finland (from 1986 to 1995); Iceland (from 1970)
1960
EFTA–Hungary EFTA, Hungary 1993-2003 EFTA–Poland EFTA, Poland 1992-2003 EFTA–Israel EFTA, Israel 1992 CEFTA Hungary, Poland, Czechoslovakia (and its successor states) (to 2004);
Slovenia (from 1996 to 2006); Romania (from 1997 to 2006); Bulgaria (from 1999 to 2003); Croatia (from 2003); Albania, Bosnia and Herzegovina, Moldova, Montenegro, FYR Macedonia, Serbia, Kosovo (from 2007)
1994
US–Canada United States, Canada 1989-1993 NAFTA United States, Canada, Mexico 1994 Andean Bolivia, Colombia, Ecuador, Venezuela; Peru (from 2006) 1994 CACM Costa Rica, Guatemala, Honduras, Nicaragua, El Salvador 1993 LAIA Argentina, Bolivia, Brazil, Chile, Colombia, Ecuador, Mexico, Peru, Uruguay,
Paraguay, Venezuela; Cuba (from 1999) 1980
MERCOSUR Argentina, Brazil, Paraguay, Uruguay 1991 Bolivia–Mexico Bolivia, Mexico 1995 Costa Rica–Mexico Costa Rica, Mexico 1995 Chile–Colombia Chile, Colombia 1993 Group of three Colombia, Mexico, Venezuela 1995 Bolivia–MERCOSUR Bolivia, MERCOSUR 1996 Chile–MERCOSUR Chile, MERCOSUR 1996 a GDP data availability may mean that not every country is included in the regression analysis.
The sample covers a variety of different agreement styles. This covers a wide range including: bilateral and regional preferential agreements with varying external tariffs (such as ANZCERTA and NAFTA); agreements with a common external tariff (that is, customs unions such as the EEC); non-reciprocal agreements with a development focus (such as Australia–PNG and SPARTECA); and non-preferential agreements based on open regionalism (APEC).

10
Variable definitions
Trade flows are influenced by a number of factors. Broadly, these factors can be categorised into two groups:
• country-specific determinants of trade — country characteristics such as their size, relative income, consumer tastes and level of development.
• trade agreement related characteristics — including whether or not a country has been part of regional or bilateral trade agreement(s).
Determinants of trade
Economic size
In its simplest form, the gravity model of trade specifies that trade flows increase as the GDPs of the trading partners increase. GDP can be seen as an indicator for the levels of demand (importing country) and supply (exporting country).
The specification we use follows Adams et al. (2003), who reviewed the theory and applicability of a number of ‘size variables’ and selected three variables — the sum of bilateral GDPs, the absolute differences in GDP per capita and the similarity in country size between the country-pairs. They noted that these variables captured not only the aggregate size of the trading partners but also the expenditure capabilities and taste preferences of each partner.
GDP and GDP per capita are taken from the World Bank’s World Development Indicators and matched to the bilateral trade flow data so that the bilateral trade flow observations include GDP and GDP per capita for both importer and exporter. Current price GDP in US dollars is used, matching the current US dollar valuation of the dependent variable. This avoids the potential biases inherent with using price indices as identified by Baldwin and Taglioni (2006).4
The three GDP-related variables for countries a and b (a ≠ b) in year t are the:
• log of sum of GDPs to represent the overall size of the trading partners (SGDP)
ln GDPat +GDPbt( )
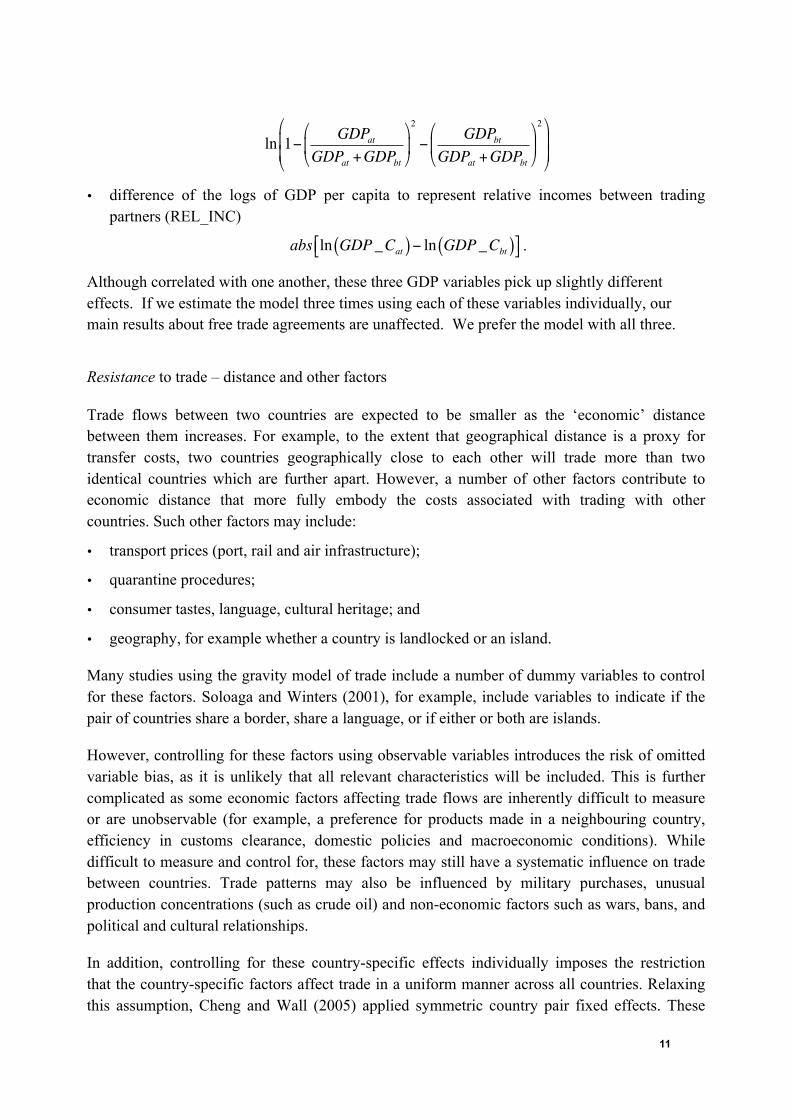
• log of absolute differences in GDP to represent the similarity of the trading partners (SIMILARITY)
4 In our study, the time dummies are sensitive to a change in GDP valuation (for example, constant
price valuation). The trade agreements dummies are not affected much. This could be due to the year dummy variables ‘soaking up’ some of the variability in valuation (a price effect).
11
ln 1− GDPatGDPat +GDPbt
"
#$
%
&'
2
−GDPbt
GDPat +GDPbt
"
#$
%
&'
2"
#$$
%
&''
• difference of the logs of GDP per capita to represent relative incomes between trading partners (REL_INC)
abs ln GDP _Cat( )− ln GDP _Cbt( )"# $% .
Although correlated with one another, these three GDP variables pick up slightly different effects. If we estimate the model three times using each of these variables individually, our main results about free trade agreements are unaffected. We prefer the model with all three.
Resistance to trade – distance and other factors
Trade flows between two countries are expected to be smaller as the ‘economic’ distance between them increases. For example, to the extent that geographical distance is a proxy for transfer costs, two countries geographically close to each other will trade more than two identical countries which are further apart. However, a number of other factors contribute to economic distance that more fully embody the costs associated with trading with other countries. Such other factors may include:
• transport prices (port, rail and air infrastructure);
• quarantine procedures;
• consumer tastes, language, cultural heritage; and
• geography, for example whether a country is landlocked or an island.
Many studies using the gravity model of trade include a number of dummy variables to control for these factors. Soloaga and Winters (2001), for example, include variables to indicate if the pair of countries share a border, share a language, or if either or both are islands.
However, controlling for these factors using observable variables introduces the risk of omitted variable bias, as it is unlikely that all relevant characteristics will be included. This is further complicated as some economic factors affecting trade flows are inherently difficult to measure or are unobservable (for example, a preference for products made in a neighbouring country, efficiency in customs clearance, domestic policies and macroeconomic conditions). While difficult to measure and control for, these factors may still have a systematic influence on trade between countries. Trade patterns may also be influenced by military purchases, unusual production concentrations (such as crude oil) and non-economic factors such as wars, bans, and political and cultural relationships.
In addition, controlling for these country-specific effects individually imposes the restriction that the country-specific factors affect trade in a uniform manner across all countries. Relaxing this assumption, Cheng and Wall (2005) applied symmetric country pair fixed effects. These

12
fixed effects replace all time-invariant country-pair specific factors such as distance and adjacency, and control for all country-pair time-invariant specific effects that affect trade flows. This reduces the risk of omitted variable bias. While this approach removes the restriction that such factors affect trade uniformly for all countries, in assuming that the effects are constant over time, it only captures the average effect over the sample period. Such country-pair fixed effects assume that the unobserved factors affecting trade are symmetric in nature — that is, they affect exports from country A to country B in the same way as they affect imports from country B to country A.
Anderson and van Wincoop (2003) derive theoretical foundations for the gravity model of trade and provide an important insight into the determinants of trade flows: that trade between two countries depends on the cost of trading between the two countries relative to the cost of each country trading with its other trading partners. They noted that in the absence of explicit multilateral resistance terms (which are not readily available), country-specific fixed effects provide consistent estimates of model parameters. Relaxing the assumption of symmetric fixed effects, asymmetric time-invariant country-pair fixed effects are specified in this study. (Trade resistance in flow from A to B may differ from that for flow from B to A.) This approach is consistent with the asymmetric nature of the Anderson and van Wincoop (2003) multilateral resistance terms.
However, the use of time-invariant fixed effects has some drawbacks. Novy (2013) notes that using time-invariant fixed effects (versus time-varying fixed effects) as a proxy for multilateral resistance may introduce misspecification, the level of which depends on the degree to which multilateral resistance of a particular country changes over the time period of interest. For some countries (for example, the United States) he finds that multilateral resistance does not change significantly over the period 1970-2000, but for other countries (for example, Korea) he finds that multilateral resistance does vary substantially.
While this limitation remains in this study, the sensitivity of results to the choice of different time period (and therefore the assumption of time-invariant multilateral resistance) is tested by estimating the model for different time periods. These sensitivity tests indicated that the coefficients on variables were generally stable across sub-samples, indicating that asymmetric time-invariant fixed effects provide a suitable proxy for time-varying multilateral resistance in this analysis.
Time dummy variables
Given the potential for global events to influence the level of trade of all countries, both positively (for example, completion of the Uruguay Round of trade negotiations) and negatively (for example, global financial disruptions), year dummy variables are included. These capture annual changes in the levels of trade common to all countries.

13
Trade agreements and related characteristics
Typically, the impact of trade agreements on trade flows is examined by adding bilateral or regional trade agreement-specific binary dummy variables to the augmented gravity model. Aitken (1973), one of the earliest studies to apply the gravity model, specified a single dummy variable to capture the changes in trade between members of the EU and EFTA respectively.
Later work, for example Bayoumi and Eichengreen (1995), added a second dummy variable to estimate the additional effect of changes in trade (imports and exports) from members of an agreement to countries not party to the agreement.
Soloaga and Winters (2001) extended the two dummy variable approach with a third dummy variable in order to differentiate the additional effects of a trade agreement on imports to members (from members and non-members) and on exports from members (to members and non-members). They suggested that the effect of a trade agreement may have asymmetric effects on exports and imports.
Following Carrere (2006), a modified version of the Soloaga and Winters (2001) three dummy variable approach is used in this study, where the second and third dummy variables exclude trade with members. This allows the estimation of the effects of a trade agreement on three categories of trade flows:
• trade between members;
• imports to members from non-members; and
• exports from members to non-members.
Dummy variables provide a broad indication of the effect of trade agreements on trade: they capture a common change in trade flows, irrespective of whether the change is due to lower tariffs or other factors associated with an agreement which influence trade. These dummies are not interacted with time dummies so we are picking up the average effects across the time period covered by the agreement. Any common changes in levels of trade that are not related to other factors controlled for by the model, and that persist over the period of the agreement, are captured by the dummy variables and are thus included in the ‘trade-agreement effect’.
The empirical model
The gravity model used in this study takes the form:
[ ]( ) ( ) ( )
⎟⎟
⎠
⎞
⎜⎜
⎝
⎛
+++++
++= ∑∑∑∑
−i
t
t
k
kit
k
k
kit
k
k
kit
kititit
it TDDDINCRELSIMILARITYSGDP
tradeE αψδδδ
βββ
1321
321
321_lnlnln
exp (3)

14
That is, estimated trade flows between country a and country b (a≠b), denoted as i, in year t, depend on the log of the sum of GDPs of country a and b (SGDP), the log of the similarity of the size of each country’s economy (SIMILARITY) and the relative incomes in each country (REL_INC). k indexes trade agreements.
Our model could be developed directly from a version of the gravity model of equation (2) combined with a precise model of the relationship between free trade agreements and bilateral trade flows. This is the approach taken by Bergstrand, Larch and Yotov (2013) using the gravity equation derived by Arkolakis, Costinot and Rodriquez-Clare (2012). Equation (3) that we estimate is consistent with an approach of this type.
The coefficient on D1k represents the estimated impact (time invariant) of membership of BRTA k on flows between member countries (intra-group). The coefficients on D2k and D3k represent the estimated impact (time invariant) of BRTA membership on imports and exports, respectively, between members and non-members (extra-group).
The time dimension on the D1, D2 and D3 variables indicates that BRTA membership is allowed to vary over the sample period. Time dummies (T) and an asymmetric country-pair fixed effect (αi) control for changes in the global level of trade from year to year and the average asymmetric multilateral trade resistance between countries over the sample period, respectively.
The Poisson probability function takes the form:
( )!
|Pri
yi
ii yexyY
iiλλ−== (4)
That is, each observation of the dependent variable yi is distributed under a Poisson distribution with parameter λi related to the independent variables xi. The most common formulation for λi is the log-linear formulation βλ ii xʹ=ln and it follows that the expected value of the dependent variable is given by [ ] ( )βiii xxyE ʹ= exp| (Green 2008).
It can be shown that the estimated coefficients from the Poisson model are semi-elasticities or proportional changes:
[ ]1
1
|lnβ=
∂∂
xxyE (5)
The standard Poisson estimator assumes that zero trade-flows in the data are produced by the same ‘data generating process’ as the non-zero trade flows. However, some studies suggest the usefulness of the Poisson model may be limited in the presence of a large number of zero trade flows. Martin and Pham (2008) and Burger et al. (2009), for example, caution against using the Poisson estimator in the presence of a large proportion of zero trade flows (around 50 per cent).

15
In our data 29 per cent of the observations are zero trade flows. We estimate the model with all the observations. We also estimate the model dropping those country pairs which record zero trade flows in every year of our data. This reduces the percentage of zero trade flows to 23 per cent. Results of these two approaches are nearly identical. In the results section below, we report the results for the latter approach.
Estimated effects of individual agreements
The specification of the model and the availability of comprehensive trade data means it is possible to separately estimate within-agreement and net effects on global trade for each agreement analysed. The different agreement types can also be classified by reference to the level of trade between members (trade orientation) and the impact of agreement on trade between members and trade between members and non-members.
Intra-agreement effects
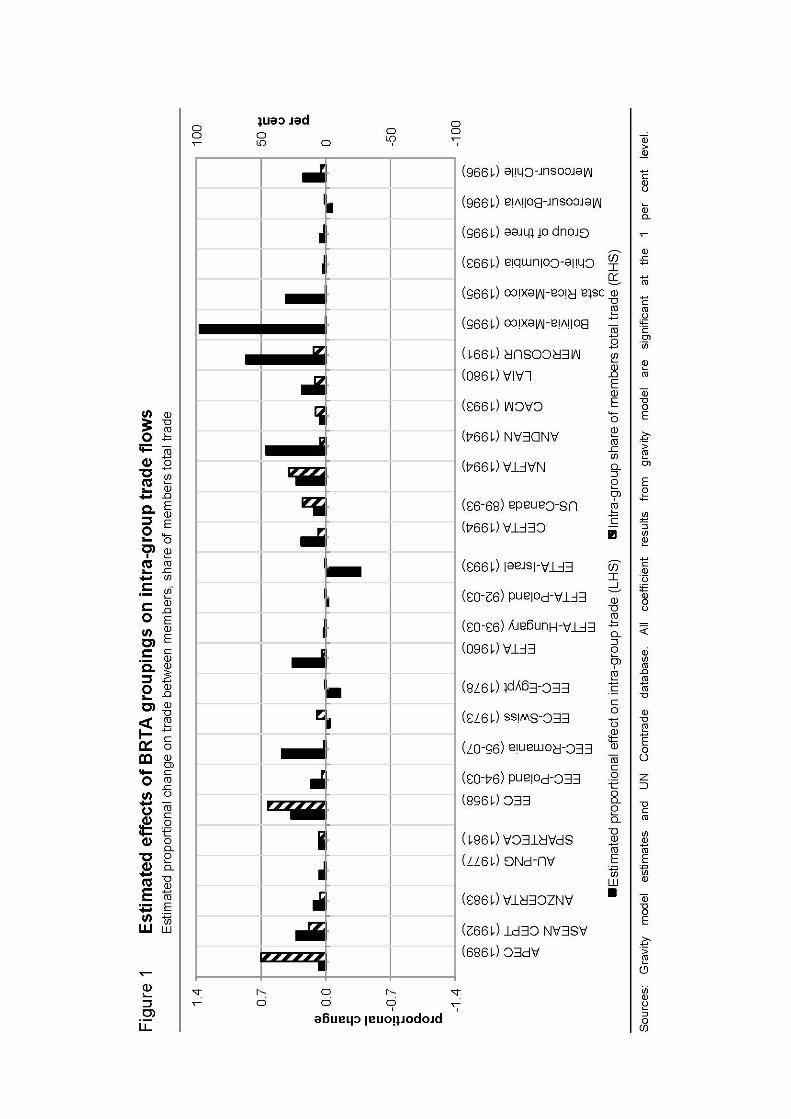
The individual effects of the 27 agreements are shown in figure 1. The estimated effects on trade between members (in proportional change terms) range from -0.378 for the EFTA-Israel agreement to 1.367 for the Bolivia-Mexico agreement.5
[Figure 1 about here]
Of the 27 agreements, 22 were estimated to be associated with higher bilateral trade between members (intra-group trade) than would otherwise prevail. Although the magnitudes of the 22 positive estimates vary, the results are in line with a priori expectations of the effect of lowering barriers to merchandise trade.
For five agreements, however, it was estimated that the formation of the agreement was associated with lower levels of trade between members than would otherwise be expected. The five agreements are:
• The EEC–Switzerland Association Agreement, in operation since 1973. The agreement served as an alternative to full Swiss membership of the EU.
• The EEC–Egypt Association Agreement, signed in 1978. The agreement provided a basis for the gradual liberalisation of trade and set out the conditions for economic, social and cultural cooperation between the European Union and Egypt. The agreement included a range of non-trade objectives (such as adherence to democratic principles and fundamental rights).
5 Coefficients should be interpreted as an approximation of the estimated proportional change in trade
flows following the formation of a trade agreement, holding other factors fixed.

16
• The EFTA–Poland agreement, in force for approximately 10 years prior to Poland joining the EEC in 2004.
• The EFTA–Israel agreement, entered into force in 1993.
• The MERCOSUR–Bolivia agreement, entered into force in 1996.
In the case of the EEC–Switzerland agreement, the negative result could be related to the expansion of the EEC, and the declining importance of trade with Switzerland for the newer members of the expanded EEC. This result is confirmed in the raw data. Since 1973, the EEC has grown in importance as a share of Switzerland’s total trade, but the share of trade with Switzerland as a total of EEC trade declined from 1.03 per cent to 0.76 per cent. For the other agreements, the cause of the negative intra-group trade effect is not clear.
The estimates in figure 1 are presented as changes proportional to the level of trade between the members of each agreement—the height of the bars should not be compared across agreements as indicating something about total trade flow.
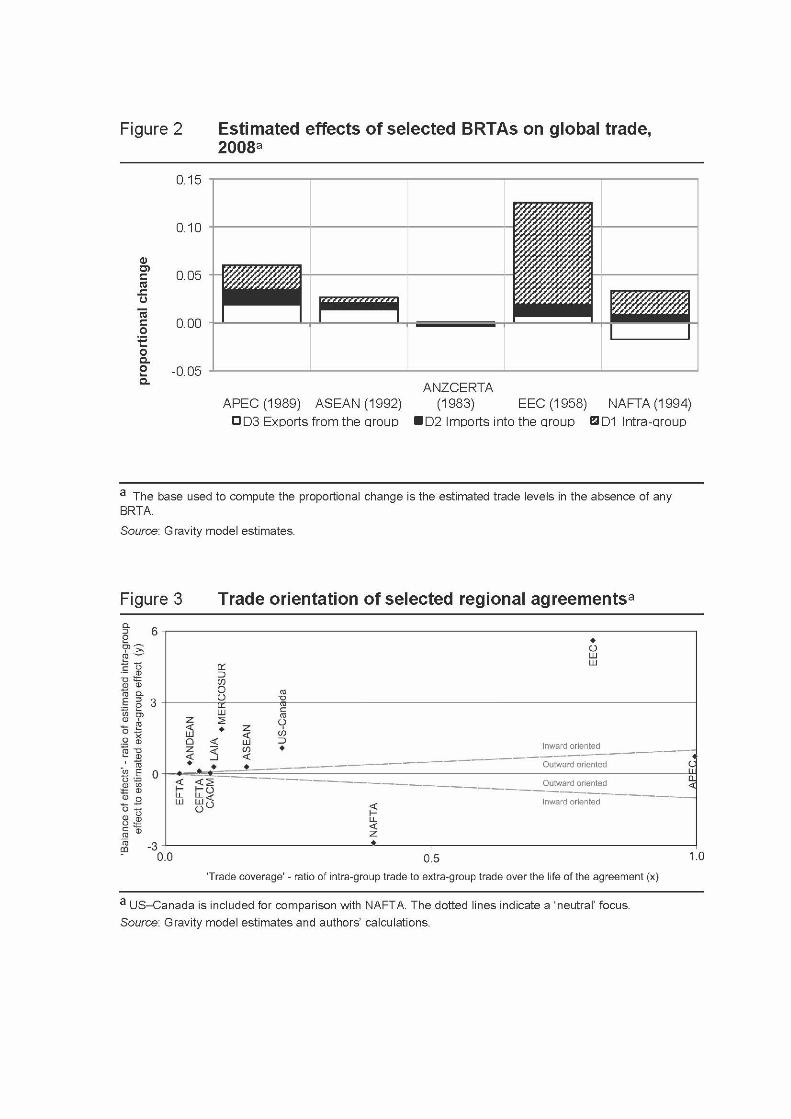
The net effect of agreements on global trade While the impact of agreements on trade between partners is of interest, of greater policy importance is the impact of agreements on global trade after account is taken of intra-bloc and extra-bloc effects. The estimated net impacts of trade agreements on global trade are presented in table 2, with selected agreements shown in figure 2.
[Figure 2 about here]

17
Table 2 Estimated effect of BRTAs on global trade, 2008a Agreement Intra-group: Imports
and exports Extra-group: imports
to the group Extra-group: exports
from the group
% change % change % change APEC (1989) 2.54 1.60 1.88 ASEAN–CEPT (1992) 0.60 0.67 1.42 ANZCERTA (1983) 0.01 -0.12 -0.23 AU–PNG (1977) 0.00 0.08 -0.24 SPARTECA (1981) 0.01 -0.07 -0.28 EEC (1958) 10.65 1.17 0.73 EEC–Poland (1994-03)a 0.17 -0.04 -0.03
EEC–Romania (1995-06)a 0.22 0.01 0.00 EEC–Swiss (1973) -0.10 -0.06 -0.03 EEC–Egypt (1978) -0.04 0.08 0.03 EFTA (1960) 0.01 0.33 0.16 EFTA–Hungary (1993-03)a 0.00 0.12 0.10
EFTA–Poland (1992-03)a -0.00 -0.03 -0.12 EFTA–Israel (1993) -0.01 -0.02 0.06 CEFTA (1994) 0.01 0.06 0.02 US–Canada (1989-93)a 0.72 0.41 0.26 NAFTA (1994) 2.49 0.85 -1.71 Andean (1994) 0.09 0.04 0.16 CACM (1993) 0.00 0.12 -0.00 LAIA (1980) 0.28 -0.28 1.27 MERCOSUR (1991) 0.30 0.29 -0.13 Bolivia–Mexico (1995) 0.00 1.38 0.43 Costa Rica–Mexico (1995) 0.01 0.08 0.83 Chile–Columbia (1993) 0.00 0.20 -0.15 Group of three (1995) 0.01 -0.88 -0.37 MERCOSUR–Bolivia (1996) -0.00 -0.01 -0.01 MERCOSUR–Chile (1996) 0.03 -0.05 0.17 a The effects of 5 agreements not operational in 2008 are estimated for the final year of operation. All estimated BRTA effects in this table are significant at the 1 per cent level. Source: Gravity model estimates and authors’ calculations.
The effects are presented using global trade flows as a common denominator allowing for comparison of components and comparison across agreements.6
The largest impact estimated was for intra-group trade amongst members of the EEC. Major positive impacts are estimated for the ASEAN–CEPT and APEC, while the different effects
6 The effect on world trade is shown as the estimated proportional change in trade flows (dummy
variables D1, D2 and D3) multiplied by the level of trade covered by those flows. The base is taken as the counterfactual — trade levels without the estimated effects of the 27 BRTAs.

18
across components estimated for NAFTA on global trade indicate that, in some cases, a positive effect on trade within the group could be substantially offset by lower exports to countries outside the group. In relation to ANZCERTA, the results suggests that while the agreement is likely to have increased trans-Tasman trade, this is offset by a negative impact on trade with non-members.
Differences between agreement types
To contrast agreement types, the effect of agreement formation on the ‘trade orientation’ of members was analysed. This analysis focuses on the extent of trade between members relative to non-members and how that has changed. We characterize trade orientation of an agreement by a comparison of two measures:
• ‘trade coverage’ of an agreement which measures the average share of trade between members (intra-group trade) in the total trade of members as a ratio of the share of trade between members and non-members (extra-group trade) in that trade; and
• ‘balance of effects’ of an agreement which measures the estimated net effect of an agreement on trade between members (the intra-group effect) as a ratio of the estimated net effect on trade between members and non-members (the extra-group effect) (box 1).
Using these measures, agreements are characterised as either ‘neutrally oriented’, ‘inwardly orientated’, or ‘outwardly oriented’. If the balance of effects is proportional to the trade orientation of members an agreement can be characterised as neutrally oriented. If, on the other hand, the change in trade between members is estimated to be greater than would be expected given the trade orientation of members, an agreement can be characterised as inwardly oriented while if is less than can be expected an agreement can be characterised as outwardly oriented.
The trade orientation of 11 of the larger agreements examined is shown in figure 3. A general trend in the results is that as relative importance of intra-group trade increases (trade coverage, estimated by the ratio of intra-group trade to extra-group trade), so does the relative importance of projected changes in intra-group trade (balance of effects, estimated by the ratio of estimated intra-group to extra-group effects). That is, agreements that cover a greater amount of their members’ trade are generally more ‘inward orientated’ with agreements associated with augmentation of within-area trade.
This pattern is particularly evident for the cases of MERCOSUR, the US–Canada agreement, NAFTA and the EEC agreement. For example:
• the trade coverage ratio of the MERCOSUR agreement was 0.11 while its balance of effects ratio was 1.87;
• the trade coverage ratio of the US-Canada agreement was 0.22 with a balance of effects ratio of 1.09;
19
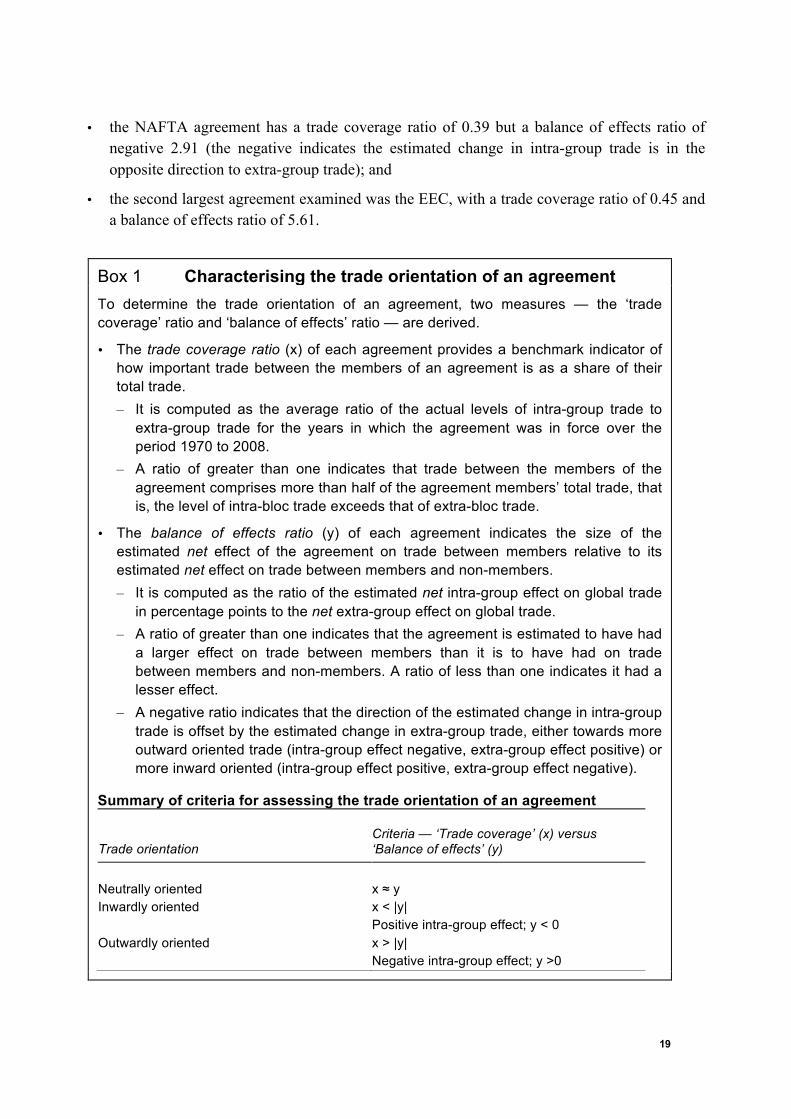
• the NAFTA agreement has a trade coverage ratio of 0.39 but a balance of effects ratio of negative 2.91 (the negative indicates the estimated change in intra-group trade is in the opposite direction to extra-group trade); and
• the second largest agreement examined was the EEC, with a trade coverage ratio of 0.45 and a balance of effects ratio of 5.61.
Box 1 Characterising the trade orientation of an agreement To determine the trade orientation of an agreement, two measures — the ‘trade coverage’ ratio and ‘balance of effects’ ratio — are derived.
• The trade coverage ratio (x) of each agreement provides a benchmark indicator of how important trade between the members of an agreement is as a share of their total trade. – It is computed as the average ratio of the actual levels of intra-group trade to
extra-group trade for the years in which the agreement was in force over the period 1970 to 2008.
– A ratio of greater than one indicates that trade between the members of the agreement comprises more than half of the agreement members’ total trade, that is, the level of intra-bloc trade exceeds that of extra-bloc trade.
• The balance of effects ratio (y) of each agreement indicates the size of the estimated net effect of the agreement on trade between members relative to its estimated net effect on trade between members and non-members. – It is computed as the ratio of the estimated net intra-group effect on global trade
in percentage points to the net extra-group effect on global trade. – A ratio of greater than one indicates that the agreement is estimated to have had
a larger effect on trade between members than it is to have had on trade between members and non-members. A ratio of less than one indicates it had a lesser effect.
– A negative ratio indicates that the direction of the estimated change in intra-group trade is offset by the estimated change in extra-group trade, either towards more outward oriented trade (intra-group effect negative, extra-group effect positive) or more inward oriented (intra-group effect positive, extra-group effect negative).
Summary of criteria for assessing the trade orientation of an agreement
Trade orientation Criteria — ‘Trade coverage’ (x) versus ‘Balance of effects’ (y)
Neutrally oriented x ≈ y Inwardly oriented x < |y| Positive intra-group effect; y < 0 Outwardly oriented x > |y| Negative intra-group effect; y >0

20
In relation to Asia-Pacific regional agreements, the design of the agreements leaned more towards open regionalism, so one would expect these agreements to be neutral or outward oriented. In the case of the ASEAN–-CEPT agreement, the trade coverage ratio of the ASEAN–CEPT agreement was 0.15 but its balance of effects ratio was only 0.29. Although inwardly oriented, it is relatively close to the ‘neutral’ line in figure 3.
[Figure 3 about here]
Table 3 Agreement balance, coverage and orientation Description Trade coverage ratio (x) Balance of effects ratio (y) Trade orientation
EFTA–Hungary 0.00 0.00 Neutral Bolivia–Mexico 0.00 0.00 Neutral Costa Rica–Mexico 0.00 0.01 Neutral EEC–Egypt* 0.01 -0.33 Outward oriented EFTA–Israel * 0.01 -0.28 Outward oriented AU–PNG 0.01 -0.01 Inward oriented Group of three 0.01 -0.01 Inward oriented EFTA–Poland** 0.01 0.01 Neutral Chile–Columbia 0.01 0.01 Neutral MERCOSUR–Bolivia** 0.01 0.14 Inward oriented EEC–Romania 0.01 23.32 Inward oriented EEC–Poland 0.03 -2.23 Inward oriented EFTA 0.03 0.02 Outward oriented MERCOSUR–Chile 0.03 0.26 Inward oriented ANZCERTA (CER) 0.04 -0.04 Inward oriented Andean 0.04 0.45 Inward oriented SPARTECA 0.06 -0.03 Inward oriented CEFTA 0.06 0.11 Inward oriented EEC–Swiss** 0.07 1.08 Inward oriented CACM 0.08 0.03 Outward oriented LAIA 0.09 0.29 Inward oriented MERCOSUR 0.11 1.87 Inward oriented ASEAN–CEPT 0.15 0.29 Inward oriented US–Canada 0.22 1.09 Inward oriented NAFTA 0.39 -2.91 Inward oriented EEC 0.80 5.61 Inward oriented APEC 1.00 0.73 Outward oriented
* indicates agreements with an estimated decrease in intra-group trade. ** indicates agreements with an estimated decrease in both intra- and extra-group trade. Sources: Gravity model estimates, author calculations and UN Comtrade database.

21
For APEC the level of trade between members was approximately the same as the level of trade between members and non-members (giving it a trade coverage ratio of around 1.0). As the estimated increase in trade between members was around one quarter smaller than the increase in trade between members and non-members (balance of effects ratio of 0.73), the agreement is characterised as strongly ‘outward oriented’.
It is interesting to contrast APEC, ASEAN, the EEC and NAFTA. APEC is strongly outward oriented with a very balanced amount of trade within members and between members and non-members. ASEAN is closer to the boundary or inward/outward orientation but has low coverage (0.15) and a balance of effects slight larger (0.29) which makes it slightly inward oriented. Both EEC and NAFTA are strongly inward-oriented. The EEC has huge coverage, covering most of the trade area of EEC countries. NAFTA covers about 40% of the trade of those countries. These two agreements, along with APEC, are the visible outliers on figure 3 that have extremely large coverage but very different inward/outward orientation.
The results for each of the 27 agreements are shown in table 3
Conclusion and discussion
This paper applies a gravity modelling approach to undertake an analysis of the impacts of a range of bilateral and regional trade agreements with differing policy designs and membership structures. The analysis extends earlier studies by: adopting the Poisson estimator to control for biases of other estimators; explicitly controlling for the occurrence of a large number of zero trade flows; implementing a dummy variable approach to capture asymmetric country fixed effects; and applying a three-tiered dummy variable approach to capture trade effects between agreement members, fellow members and non-members.
Our analysis suggests that while participation in BRTAs is likely to increase trade, the extent of any changes depends on the nature of the agreement. Preferential trade agreements are likely to increase trade flows between partner countries but at a cost to trade with other trading partners. The estimates indicate that the balance of effects can be negative. Non-preferential agreements and agreements loosely implemented on an ‘open regionalism’ model, like the Asia-Pacific ASEAN-CEPT and APEC agreements characteristically are associated with increased trade between members and between members and non-members. This approach has the potential to provide broader-based reductions in barriers to trade and deliver greater economic gains both across member countries and globally. A greater positive impact on trade between members is also observed in the case of the European Union’s customs union because of the nature of the agreement and its large regional grouping.
Our main results and broad conclusions are invariant to a range of sensitivity analyses: estimation over different time periods and sub-samples; inclusion/exclusion of country-pair

22
observations for countries who never trade during our sample period; and treatment of differing reports of trade activity between exporters and importers7.
It is important to bear in mind several caveats. The most important is that trade agreements may be endogenous in our model. If trade agreements are implemented due to increases in trade between partners in anticipation of increasing future trade that would occur even in the absence of the agreement, then our results will overstate the effect of trade agreements. Because we control for country-specific effects through dummy variables, we are not able to say much about the types of local country policies which aid or hinder trade openness and the interaction between domestic policies on the implementation of trade agreements. It would also be of interest to control for the impact of the global financial crisis and other factors effecting post-2008 economic changes on country trading patterns — a task beyond the scope of this paper and one that will probably have to wait until a longer post-crisis data set is available. These would be fruitful areas for future research.
7 Details of sensitivity tests available on request from the authors.

23
References Adams, R., Dee, P., Gali, J. and McGuire, G. 2003, The Trade and Investment Effects of
Preferential Trading Arrangements — Old and New Evidence, Productivity Commission Staff Working Paper, Canberra.
Aitken, N. D. 1973, ‘The effect of the EEC and EFTA on European trade: a temporal cross-section analysis’, The American Economic Review, vol. 63, no. 5, pp. 881-92.
Anderson, J. E. 1979, ‘A Theoretical Foundation for the Gravity Equation’, The American Economic Review, vol. 69, no. 1, pp. 106-116.
Anderson, J. E. and van Wincoop, E. 2003, ‘Gravity with gravitas: a solution to the border puzzle’, The American Economic Review, vol. 93, no. 1, pp. 170-92.
Anderson, J. E. and Yotov, Y., 2011, `Terms of Trade and Global Efficiency Effects of Free Trade Agreements’, NBER Working Paper No. 17003.
Arkolakis, C., Costinot, A. and Rodriquez-Clare, A., 2012, `New Trade Models, Same Old Gains?’, The American Economic Review, vol. 102, no. 1, pp. 94-130.
Baier, S. and Bergstrand, J., 2007, `Do Free Trade Agreements Actually Increase Members’ International Trade?’ Journal of International Economics, vol. 71, no. 1, pp. 72-95.
Baldwin, R., and Taglioni, D. 2006 Gravity for dummies and dummies for gravity equations, NBER Working Paper Series, no. 12516.
Bayoumi, T. and Eichengreen, B. 1995, Is regionalism simply a diversion? Evidence from the evolution of the EC and EFTA, NBER Working Paper Series, no. 5283.
Bergstrand, J., Larch, M. and Yotov, Y., 2013, `Economic Integration Agreements, Border Effects, and Distance Elasticities in the Gravity Equation.’ CESifo Working Paper Number 4502.
Burger, M. J., van Oort, F. G. and Linders, Gert-Jan M., 2009, ‘On the Specification of the Gravity Model of Trade: Zeros, Excess Zeros and Zero-Inflated Estimation’, Spatial Economic Analysis, vol. 42, no. 2, pp. 167-190.
Carrere, C. 2006, ‘Revisiting the effects of regional trade agreements on trade flows with proper specification of the gravity model’, European Economic Review, vol. 50, no. 2, pp. 223-247.
Cheng, I-H. and Wall, H. J. 2005, ‘Controlling for Heterogeneity in Gravity Models of Trade and Integration’, Federal Reserve Bank of St. Louis Review, vol. 87, no. 1, pp. 49-63.
Cipollina, M., and Salvatici, L., 2010, ‘Reciprocal trade agreements in gravity models: a meta-analysis’, Review of International Economics, vol. 18, no. 1, pp. 63–80.
Clausing, K. 2001, ‘Trade Creation and Trade Diversion in the Canada-United States Free Trade Agreement’, Canadian Journal of Economics, vol. 34, no. 3, pp. 677-96.

24
Coulibaly, S. 2009, ‘Evaluating the trade effect of developing regional trade agreements: a semi-parametric approach’, Journal of Economic Integration, vol. 24, no. 4, pp. 709-43.
Deardorff, A. V. 1984, ‘Testing trade theories and predicting trade flows’, Chapter in Handbook of International Economics, Volume. I, eds. Jones, R. W. and Kenen, P. B., Elsevier Science Publishers B.V..
Feenstra, R. C., Lipsey, R. E., Deng, H., Ma, A. C. and Mo, H. 2005, World Trade Flows: 1962-2000, NBER Working Paper Series, no. 11040.
Felbermayr, G. J., and Kohler, W. 2004, Exploring the intensive and extensive margins of world trade, CESIFO Working paper series, no. 1276.
Green, W. H. 2008, Econometric Analysis (6th edn.), Pearson Prentice Hall, New Jersey.
Helpman, E. Melitz, M. and Rubinstein, Y. 2008, ‘Estimating trade flows: trading partners and trading volumes’, Quarterly Journal of Economics, vol. 123, no. 2, pp. 441-87.
Liu, X. 2007, GATT/WTO Promotes Trade Strongly: Sample Selection and Model Specification, paper presented at the 10th Annual Conference on Global Economic Analysis, Purdue University.
Magee, C., 2008, `New measures of trade creation and trade diversion’, Journal of International Economics, vol. 75, pp. 349-362.
Martin, W. and Pham, C. 2008, Estimating the Gravity Model When Zero Trade Flows are Frequent, Munich RePEc Archive, Paper 9453, University Library of Munich, Germany.
Medvedev, D. 2010, Preferential Trade Agreements and Their Role in World Trade, Revew of World Economics (Weltwirtschaftliches Archiv), vol. 146, no. 2, pp. 199-222.
Novy, D. 2013, Gravity redux: measuring international trade costs with panel data, Economic Inquiry, vol. 51, no. 1, pp. 101-121.
Poyhonen, P. 1963, A tentative model for the volume of trade between countries, Welwirtschaftliches Archiv, 90 (1) : 93-99.
Romalis, J. 2007, NAFTA’s and CUSFTA’s impact on international trade, The Review of Economics and Statistics, vol. 83, no. 3, pp. 416-435.
Soloaga, I. and Winters, A. 2001, ‘Regionalism in the nineties: What effect on trade’, North American Journal of Economics and Finance, vol. 12, no. 1, pp. 1-29.
Sova, R. and Sova. A. 2009, ‘On the bilateral trade effects of free trade agreements between the EU-15 and the CEEC-4 countries, Review of World Economics, vol. 145, no. 2 (supplement), pp. 189-206.
Tinbergen, J. 1962, Shaping the world economy: Suggestions for an international economic policy. New York, NY: The Twentieth Century Fund.
USITC (U.S. International Trade Commission) 2002, The NAFTA preference and U.S.-Mexico trade, Office of Economics Working Paper, no. 2002-10-A, Washington.

25
Westerlund, J. and Wilhelmsson, F. 2009, ‘Estimating the gravity model without gravity using panel data’, Applied Economics, vol. 43, no. 6, pp. 641-649.
World Bank 2005, Global Economic Prospects: Trade, regionalism and development, Washington, DC.