
Exploring the Future: is HTML5 the solution for GIS...
88
Exploring the Future: is HTML5 the solution for GIS Applications on the World Wide Web? Mats Taraldsvik December 18, 2011
Transcript of Exploring the Future: is HTML5 the solution for GIS...

Exploring the Future: is HTML5 thesolution for GIS Applications on the World
Wide Web?
Mats Taraldsvik
December 18, 2011

���������A��B��C�DE�FC���������D��������E
�����D���D�F��B�����D���C���D�����������
������D�����
�������� �!�F"�"����#�D��$�!�#��"����%����C�����&'����#��
�!�����(��(���)*
�'�����&�+)��,-�!./,,
�"+)���%�' �#0��&�1'����(�&�#2�-3
�'#���D!�#�# ���4�&����5 6
�'+��C�"(1��&!�1�'�#D'�'�(#7�5
���%�##����&!'� �8#"���7�#���D��4���(�)9
��!��������'����%�##���'�&���'&�#8#"���7�#��#�
�)#��'&��
D!�"�%���"�'�����(��(�7����+"�������'��7�'����&'����#!'#�+�� �(:��!�!���&��������#�����+�)���(�7�&�"#' �;'�(
�D��$���+�#�#��)�'&�++����'�%��+%��'����&'����(�7����+�����:'�(#+"������(�%%�����(�7�&�#:��!(�%%�����
����'��7�#<#��+#1�����&'����#���!���C(�+'���#����#�(���!�#���'���&"�'�;)�&'"#���&'����=)'#�('����&'����#'��
�#��&�'��<"#�%"���+�)���(�7�&�#;'�()<(�7������ �!���C'����&'����:��!�D��$;��&'�)�"#�(��'�<(�7�&��!'�
#"�����#�!��'��#�%�D��$�!'�'��"#�(1
���#�+����'����"�(��#�'�(�!'��D��$�#'#�'�('�(�!'�&��#�#�#�%#�7��'�;��(�7�("'����&�#==#�+�'��:���#"������(
'&��##)��:#��#;'�(#�+�'�����1D!�#�'����������#���+���#�%�D��$0'�(#��&�%�&'����#���'��(���D��$2;'�(�!���"#�
��:�)'����&'����(�7����+����!���C(�+'��;'�(�#��&�'��<��&!���� <:��!�##����'�%�'�"��#%����C'����&'����#�!'�!'#
������7��"#�<)����'���%�!�����:�)1D!���'�����#�%���#��� ;������C#�'�('�(#'�(��C��)�'���#'���'(<'7'��')��;�!'�
(�&��'#�#(�7����+�����+�%����C'����&'����#���!�:�);'�(���+���&�����'����'�(&�+�'��)����<)��:�����C
'����&'����#1
D!����#'��7��7��:'�('���=(���!'�'�<#�#�%������#��� ��##�)������#'7'��')��:��!�!���:��&!���� <;'�('&&�+�'���#
+�#����+���#:��!��'+���#�����7��:�!����+���#��'��C'����&'������7����+���1C�+����+���#�!'���%�"��&�
���%��+'�&����'���&"�'�;�#��#��(��=(���!����'+����!�)���%��#'�(�+���7�+���#��##�)��:��!�!���:��&!���� <1
B�#"'��#'����:��!�!�&'�7'#���+�����������#7 �#�#��&�'��<������#��� %��+'���� '����&'����#;'�(���7�(�#(�7������#
:��!����#��:��5:��!�'#���'�(7�&���('�'1D!� ����&'����#��&�%�&'�����#'#�'�('�(:'<��������7��!�"#��#>��&'����1
�D��$��!'�&�#���%��+'�&�)<(�&��'#�� �'���&<'�()'�(:��!:��!�!���)C�&5��#���'�(C��7��=C����7���#;'�()<
�'"�&!�� ���=)��&5�� ���&�##�#:��!�!���)���5��#���1�D��$%��'��<�����("&�#�'��7�#"�����%��+�(�':��!�!�7�(��
'�('"(�����+���#?#����� '����&'����('�'�#�'#���'�(+���#�&"��:��!�!���&'�C���' ����'�(&��'��� �%%����
'����&'����#==�#��&�'��<%��+�)���(�7�&�#�!'��%���'��:��!�"���������'&&�##==�#��##�)��:��!�����&'�����'&!�1
���!�" !�D��$�#'<�"� #�'�('�(;#�+���C'����&'����#!'7�'���'(<)���(�7�����("#�� �!���:��&!���� ��#;'�(�!�
�'������7�(�#'��7��7��:�%!�:�!�#�'����&'����#"����@��D��$1
��&��&�"#���;:��!�!���:�D��$#�'�('�(;�!�����:�)!'#�'5��'+'4��#���%��:'�(%�����7�(�� (�7������#'�(
&�+�'���#:��!�!�+�'�#��&�##�'�<��&��'����C'����&'����#�!'�+'<&�+����:��!�!���(�#5���=)�"�(&�"�����'��#1�!���
�!��(=�'��<��" ��#��5��(�)�F�'#!'�(��&��#�%�C��7���� !�'��<�'�#'!�'(�����+#�%+'�"���<;�D��$�'<#'#���(
%�"�('����%���!�%"�"������:�);'�(���#��� ��C'����&'����#�!'�"#��D��$��&!���� ��#'���+���##�7�)��!:��!�� '�(#
���!������%��+'�&�;'�(�!���"#�������%'&�#1
A�<:��(#�
,1�D��$;��C;��'�%��+��(����(��&�;+�)���(�7�&�#
.1&'�7'#;������#7 ;:�)#�&5��#;:�):��5��#; ����&'����
B1���D��;��B
CCCCCCCCCCCCCCCCCCCCCCCCCCCCCCCCCCCCCCCCC
0#� �'�"��2

ii

Abstract
The unfortunate need to develop multiple native applications has emerged with the recentexplosion in mobile device usage, and HTML5 promises to be a common platform forapplication development towards multiple different devices with different operative systems.Applications in the GIS domain is exposed to this in particular, because location-basedapplications are especially useful in mobile devices, and by developing the GIS applicationwith HTML5, it can be used on any device that supports the parts of HTML5 that are used.
It is important to understand that HTML5 is a standard that consists of several, individualpieces – some are well supported across browsers, and some are not. This paper exploreselements of HTML5 (and specifications related to HTML5), and their use in web applicationdevelopment the GIS domain, and especially technology with essential features for GISapplications that has not previously been part of the open web. There are lots of existing,open GIS standards and GIS libraries already available, that decreases development timefor GIS applications on the web, and promote cooperation and compatibility between GISapplications.
There is an overview and an in-depth analysis of interesting possibilities available with thenew technology, and accompanies most elements with examples to preview the elements ina GIS application environment. Some elements that influence performance in particular, istested in-depth to examine the benefits and improvements possible with the new technology.
Visualisation with the canvas element or inline svg is especially interesting for mappingapplications, and provides developers with tools to work with raster and vector data. Thegeolocation specification is a standard way to retrieve the users’ location. HTML5 enhancesperformance by decreasing latency and bandwidth with the Web Sockets API and Server-SentEvents, and by launching non-blocking processes with the Web Workers API. HTML5 finallyintroduces native support for media with the video and audio elements; storing applicationdata is easier and more secure with the Local Storage API and creating offline applications– especially for mobile devices that often are without internet access – is possible withApplication Cache.
Although HTML5 is a young standard, some GIS applications have already been developedusing the new technologies, and the paper provides an overview of how these applicationsutilize HTML5.
In conclusion, with the new HTML5 standard, the open web has taken a major step forwardfor providing developers and companies with the means necessary to create GIS applicationsthat may compete with their desktop-bound counterparts. While third-party plugins likeAdobe Flash and Microsoft Silverlight are years ahead in terms of maturity, HTML5 lays asolid foundation for the future open web, and existing GIS applications that use HTML5technologies are impressive both with regards to their performance, and their user interfaces.
iii

iv

��������AABCDE�D�
��������ABCDAEFBF�D�A��A�����ABCDA���FB���A���A���A�������B����A��ABCDA�����A���DA�D !
FBA�B��BD��A����"A#��B����C$
���C���D��������A���A�D��BD�ABD�C�����D�A��D�A���A%��DA�F��B������B$A&�BC��A�A�D ' ��&�D�AD�(����%D�B)A��ABC��A���BD�BA�BA��A��BD�D�B��AB�A�BF�$AC�&ABC��ABD�C����$A���A DAD%���$D�A���A���A�������B����)
�A��A*���F��ABCDA%�B�(�B���A���A%�+��A���A�������B����A�(���� �DA��A�D A���AD�����DAC�&ABCDA�����ABD�C����$ABC�BA���A DAFB���,D�A���ABC��A�F����D)A�BA��AD��D�BD�ABC�BA��%��DA���B�B$�DA�������B����A��DA�D(D���D�AB�A���F�B��BDAC�&A�����A�D��BD�ABD�C����$A���A DAF�D�A��A����D�B���A&�BCAD����C����A�����%�B���)A
�D�-DA���B .�D�BD% D�A/011

vi

Preface
This paper, Exploring the Future: is HTML5 the solution for GIS Applications on the World
Wide Web?, is the result of the in-depth project assignment in the course TBA4560 at thedivision of Geomatics at the Norwegian University of Science and Technology (NTNU), witha timespan constrained to five months in the autumn of 2011.
My primary advisers during the project, which I would like to thank especially for their valuablecontributions and assistance, were Terje Midtbø and Alexander Nossum at the division ofGeomatics.
I would also like to thank Sverre Wisløff at Norkart Geoservice AS for contributions andcomments on the paper and HTML5 applications, and Atle Frenvik Sveen at Geomatikk IKTAS for sharing knowledge of existing HTML5 implementations.
March 12, 2012Mats Taraldsvik
vii

viii

License
This work is licensed under a Creative Commons Attribution-ShareAlike 3.0 UnportedLicense[1]. You may share and distribute this work freely under the same or similar li-cense, only if you attribute the work to the author, who is Mats Taraldsvik.
ix

x

Contents
1. Introduction 31.1. Source code for the examples . . . . . . . . . . . . . . . . . . . . . . . . . . 3
2. What is HTML5? 42.1. History . . . . . . . . . . . . . . . . . . . . . . . . . . . . . . . . . . . . . . 4
3. The motivation of HTML5 43.1. Replacing proprietary standards . . . . . . . . . . . . . . . . . . . . . . . . . 53.2. Moving desktop applications to the web . . . . . . . . . . . . . . . . . . . . 63.3. Providing a service with open standards . . . . . . . . . . . . . . . . . . . . 7
3.3.1. Open Web Standards for use in GIS . . . . . . . . . . . . . . . . . . 73.4. JavaScript – the language of the web . . . . . . . . . . . . . . . . . . . . . . 123.5. Thinking GIS in JavaScript . . . . . . . . . . . . . . . . . . . . . . . . . . . 13
4. HTML5 components suitable for GIS 134.1. Overview . . . . . . . . . . . . . . . . . . . . . . . . . . . . . . . . . . . . . 134.2. Canvas . . . . . . . . . . . . . . . . . . . . . . . . . . . . . . . . . . . . . . 14
4.2.1. History . . . . . . . . . . . . . . . . . . . . . . . . . . . . . . . . . . 144.2.2. Basics . . . . . . . . . . . . . . . . . . . . . . . . . . . . . . . . . . 154.2.3. Usage . . . . . . . . . . . . . . . . . . . . . . . . . . . . . . . . . . 164.2.4. Encoding binary data . . . . . . . . . . . . . . . . . . . . . . . . . . 174.2.5. WebGL . . . . . . . . . . . . . . . . . . . . . . . . . . . . . . . . . . 18
4.3. Scalable Vector Graphics (SVG) . . . . . . . . . . . . . . . . . . . . . . . . 204.3.1. History . . . . . . . . . . . . . . . . . . . . . . . . . . . . . . . . . . 204.3.2. Basics . . . . . . . . . . . . . . . . . . . . . . . . . . . . . . . . . . 204.3.3. Usage . . . . . . . . . . . . . . . . . . . . . . . . . . . . . . . . . . 22
4.4. Geolocation . . . . . . . . . . . . . . . . . . . . . . . . . . . . . . . . . . . 234.5. Web Sockets and Server-Sent Events . . . . . . . . . . . . . . . . . . . . . . 26
4.5.1. Example of usage . . . . . . . . . . . . . . . . . . . . . . . . . . . . 274.5.2. Server-Sent Events . . . . . . . . . . . . . . . . . . . . . . . . . . . 28
4.6. Offline Storage . . . . . . . . . . . . . . . . . . . . . . . . . . . . . . . . . . 294.6.1. Local Storage . . . . . . . . . . . . . . . . . . . . . . . . . . . . . . 304.6.2. Application Cache . . . . . . . . . . . . . . . . . . . . . . . . . . . . 304.6.3. Offline Storage Example . . . . . . . . . . . . . . . . . . . . . . . . . 324.6.4. Future . . . . . . . . . . . . . . . . . . . . . . . . . . . . . . . . . . 35
4.7. Web Workers . . . . . . . . . . . . . . . . . . . . . . . . . . . . . . . . . . 354.7.1. Dedicated Workers . . . . . . . . . . . . . . . . . . . . . . . . . . . 364.7.2. Shared Workers . . . . . . . . . . . . . . . . . . . . . . . . . . . . . 37
4.8. Video and Audio . . . . . . . . . . . . . . . . . . . . . . . . . . . . . . . . . 37
5. Existing GIS tools built with HTML5 395.1. Simple Educational GIS . . . . . . . . . . . . . . . . . . . . . . . . . . . . . 39
1

5.2. Cartagen . . . . . . . . . . . . . . . . . . . . . . . . . . . . . . . . . . . . . 405.3. Leaflet . . . . . . . . . . . . . . . . . . . . . . . . . . . . . . . . . . . . . . 425.4. KothicJS . . . . . . . . . . . . . . . . . . . . . . . . . . . . . . . . . . . . . 435.5. tile5 . . . . . . . . . . . . . . . . . . . . . . . . . . . . . . . . . . . . . . . 455.6. giscloud . . . . . . . . . . . . . . . . . . . . . . . . . . . . . . . . . . . . . 47
6. Performance of HTML5 GIS tools 486.1. Measuring performance . . . . . . . . . . . . . . . . . . . . . . . . . . . . . 486.2. Defining performance . . . . . . . . . . . . . . . . . . . . . . . . . . . . . . 486.3. Web Sockets . . . . . . . . . . . . . . . . . . . . . . . . . . . . . . . . . . . 49
6.3.1. Latency test . . . . . . . . . . . . . . . . . . . . . . . . . . . . . . . 526.4. Web Workers . . . . . . . . . . . . . . . . . . . . . . . . . . . . . . . . . . 57
7. Can HTML5 serve the requirements of future GIS applications? 59
8. Conclusion 60
Appendices 61
A. HTML5 Support in Web Browsers 62
B. Code Examples 63
List of figures 65
List of tables 66
List of listings 67
References 77
2

1. Introduction
The past has given us desktop applications for GIS operations, requiring powerful computersfor every user. Today, it’s all about putting applications on the web, and an emergingtechnology, to free us from proprietary, third-party plugins, is HTML5.
The goal in this paper is to examine the new technologies that the HTML5 specification makesavailable, look at possible uses in GIS, and investigate current GIS applications that have beenimplemented with HTML5. The definition of HTML5 in this paper does not strictly adhereto the specification, but also includes important parts or modules that are important for webapplications, although they were not standardized by the the Web Hypertext ApplicationTechnology Working Group (WHATWG)[2].
1.1. Source code for the examples
The examples that were developed by the author for this paper – either to illustrate thefunctionality of HTML5 modules, or for performance testing – is publicly available on thecollaboration site github[3]. The url to the source code repository, is http://www.github.com/meastp/html5andgis/
3

2. What is HTML5?
2.1. History
HTML was created by Tim Berners-Lee – widely acknowledged as the ”father of the web“ –in 1989. It was created to ease collaboration between researchers at geographically distantlocations, by enabling sharing of large amounts of data electronically. The methods formarking up content into structural units (paragraphs, headings, list items etc.) was inheritedfrom an older markup language, while the genius idea of hypertext links was purely Tim’sinvention[4].
In the following years, a number of competing web browsers were developed. Most of themsupported the HTML standard correctly, but some also added various extensions to thecapabilities of HTML. This led to major problems where a page designed for one browserwouldn’t display correctly – or indeed work at all – in other browsers. Thus, the World WideWeb Consortium (W3C)[5] was formed ”to lead the World Wide Web to its full potential bydeveloping protocols and guidelines that ensure the long-term growth of the Web“[6].
Even though there were several widely adopted versions of HTML in the wild by 1998 (HTML,HTML 2.0, HTML+, HTML 3.0), none of them were officially codified as standards. Thefirst true standard for HTML – HTML 4 – was published by the W3C in 1998. HTML 4added a lot of new features (style sheets, frames, embedded objects, complex forms etc.) andmade the HTML standard more complex. Later, in 2000 and until today, newer standardsbased on Extensible Markup Language (XML) were developed (XHTML 1.0, 1.1, Basic and2.0).
The demands for what the web should provide has changed dramatically in the short timethat there have been standards for HTML. It was created merely as a tool for researchersto communicate across geographical boundaries, but has evolved to something no-one canlive without. What users want nowadays is a web that behaves more like applications thandocuments, which is a tremendous effort with the existing standard, forcing web developers toimplement the features through third-party (often proprietary) plugins, requiring installationof software and compatibility issues for the user.
As early as 2004, when the W3C was focusing future developments on XHTML 2.0, theWeb Hypertext Application Technology Working Group was formed to update the HTML 4standard, which had not been updated since 2000. The W3C abandoned the XHTML 2.0work, and instead joined WHATWG in their work to update the HTML standard, namedHTML5.
3. The motivation of HTML5
With the increasing sale of mobile devices, alongside steady growth in ”traditional“ desktopand laptop computers, companies providing GIS services and software are getting interested
4

in moving software to the web platform, targeting more users and several devices at once,with a single, common codebase. With proprietary extensions and third-party plugins, one isat the mercy of the providers with regards to device support.
Since the adoption of mobile devices has exploded[7], there is major advantage in havingan application available to the mobile device market. This market is split between severalplatforms, however, and it is costly to develop native applications for several operative systems.HTML5 solves this by being a common platform that is accessible for every mobile devicewith a modern web browser and an internet connection.
When moving an application to the web, there is also a possibility of using it to collectcontributions from users[8]. Using lots of users to collect or process data – also known as”crowdsourcing“ is a good way to distribute the work load, and GIS/map based applicationsare already popular for crowdsourcing[9][10]. Using HTML5 means that a lot of devices canaccess the application, and thus a lot of users are able to contribute[11][12].
HTML5 is based on open standards, and introduces impressive technologies that easeimplementation of GIS applications and services on the web. There are existing open formatsfor exchanging geographic data, which reduces the need for proprietary formats, and makes ittrivial to exchange data between (competing) companies’ GIS applications.
3.1. Replacing proprietary standards
Browser plugins and extensions emerged when the browsers were not as capable as theyhave become today and made it possible to create richer web sites than were possible withexisting standards, in plain html, as well as games and applications. These plugins were eitherdeveloped independently by browser vendors, who wanted to attract users and developers totheir browser, or they were developed by a third-party company, who wanted to extend webfunctionality with their own product. Microsoft’s ActiveX[13], which only worked with theInternet Explorer browser[14], is an example of the former, and Adobe Flash[15], which is aproprietary animation framework with no way to make an independent implementation, is anexample of the latter.
With an open standard, one is free to implement support on even the least popular systems.On the other hand, since the technical specification is not available – at least for free – toanyone, one can not implement support on a specific system for a closed standard. Since itdoes not make sense for a company to support other systems than the most popular, that isexactly what will happen. A great example is standards for e-mail. If these were not open,one wouldn’t be able to send e-mail between different providers (which actually was the casein e-mail’s infancy, where several incompatible implementations were in use[16]).
One of the most fundamental ideas behind the web is to be accessible. With open standards,everyone is able to use and implement these standards and also compete on equal terms.Another important issue is accessibility, which often suffer in non-open standards[17]. Theopen standards that the W3C develop, however, are required to go through a process to verify
5

that they are sufficiently accessible. Trying to create accessible content in e.g. Adobe Flashis difficult compared to HTML[18][19].
3.2. Moving desktop applications to the web
For several years, there has been several incentives to move desktop applications to the web,where the largest might be by Google and their Chrome OS (a linux based operative systemwith a minimal native environment, focused on delivering applications and content throughGoogle’s own browser, Chrome[20])[21]. Most of the successful attempts have been madeby Google (Maps[22], Docs[23], Reader[24], Plus[25]) or startup companies (Evernote[26],Remember the Milk[27], Sketchpad[28], Facebook[29]), and today these applications are usedjust like the ”normal“ desktop applications we use daily.
Web based applications can access data stored on the server directly, and there is no need forthe client to download a complete copy of the data. By keeping a single, central copy on aserver, the cpu and memory requirements are loosened, and devices such as smartphones andtablets – which are not very powerful – become appropriate as clients[30].
There has always been demand for platform independent applications that work on all themost popular operative systems (Windows, OS X, Linux), but since Microsoft Windows isdominating the market, this demand hasn’t been critical for companies. However, the lastfew years has seen an explosive growth in powerful and capable mobile devices (smartphones,tablets) which is gaining quite a bit of market share very fast[7]. This, and especially theneed to develop (native applications) for at least two platforms (Android OS, iOS), has ledto companies looking for other solutions to reduce development cost. Development cost isreduced when one can make a single app based on standards that are supported across alltarget platforms, which is the case with HTML5.
This is why HTML5 is so promising and unifying for everyone. Open standards that work onall (or most) platforms desired, all with no extra or duplicated code required, since there isonly a single platform. Unfortunately, all of HTML5’s elements isn’t supported by all majorbrowsers yet (see Section 4.1), but it is a very young standard, and have gained a lot ofmomentum from major players (e.g. Google[31], Apple[32][33]).
There hasn’t been a place for heavy GIS applications as pure web applications in the past (asopposed to simple map viewers, in which there are plenty of on the web), mostly for technicalreasons which are now nearly overcome. GIS applications deal with mapping data, whichoften are tied to various licensing restrictions – therefore a hassle to get hold of – and oftenconsume a non-trivial amount of space. There is also a lot of complex interaction involved inGIS applications while manipulating objects, and before HTML5 there was no standard wayof providing this as vector graphics to the user.
6

3.3. Providing a service with open standards
With one of the primary motivations behind HTML5 being portability and independence(from a single company) by using open standards and open source languages (JavaScript),it would only be natural to encourage this at the application layer level as well. In additionto applications targeted for the end-user, there are also other possibilities, like creatingservices and libraries, while taking advantage of the new technology that the HTML5 standardprovides.
For maximum exposure and reach, it is crucial for these services – and applications that usethem – to communicate through open standards. The amount of users on mobile devicessuch as tablets, are increasing at a rapid phase. Since these devices use different operatingsystems, the easiest way to reach them is through the web browser, in an application writtenonce, with HTML5.
Developing proprietary formats for every GIS system from scratch would mean that they wereincompatible with each other and no geometric data could be exchanged (i.e. prone to datalock-in), and it would be a lot of unnecessary work. Even proprietary vendors support openstandards already for precisely this reason (and anti-monopoly laws).
3.3.1. Open Web Standards for use in GIS
There are two groups of open standards, each with it’s own definition of the term ”open“.For standards used in GIS, the Open Geospatial Consortium (OGC)[34], and the Interna-tional Organization for Standardization (ISO)[35] are the most relevant, and represent bothdefinitions. Standards developed by the International Organization for Standardization costmoney[36].
For developers working on open source applications, collecting or donating the money requiredto buy the standards, is a hindrance – and essentially affects the standards themselves.Fortunately, the Open Geospatial Consortium develops standards[37] that are free for everyoneto access and use[38]. Only standards developed or provided by the Open GeospatialConsortium – as well as other (truly) open and free standards to acquire and implement –will be examined in this paper.
Geography Markup Language Geography Markup Language (GML) is an XML gram-mar for expressing geographical features[39]. It is made as an interchangeable format fortransferring geographic elements over the web, but is also intended as a base for specializedderivations, that define less generic objects. An example of the latter is CityGML, a derivationthat defines roads, highways and bridges, instead of the generic points, lines and polygons[40].
Code Example 1: GML
// A snippet of GML embeded in a custom name space (cns)
7

<cns : Bui ld ing gml : i d="EiffelTower"><gml : name>E i f f e l Tower</gml : name><cns : height>50</cns : height><cns : p o s i t i o n>
<gml : Point><gml : pos>63.414751 10.406435</gml : pos>
</gml : Point></cns : p o s i t i o n>
</cns : Bui lding>
GeoJSON GeoJSON is based on – and even ”backwards compatible“ (i.e. parsers forJSON work equally well with GeoJSON) with – the widely known JavaScript Object Notation(JSON) open format[41], and extends it with geographic elements.
Code Example 2: GeoJSON
{"type" : "Feature" ,"id" : "Sears Tower" ,"properties" :{} ,"geometry" :{
"type" : "Point" ,"coordinates" : [ 6 3 . 4 1 4 7 51 , 10 . 406435 ]
} ,}
It aims to be more compact and less verbose than XML (and thus also GML3.3.1), althoughit does not support the application schemas that derivatives of GML do.
Web Map Service Web Map Service is a simple HTTP interface that delivers map imageson request [42]. The map images boundaries are specified in the request, and (if theimplementation supports it) whether the map image should be transparent, making it possibleto combine multiple images as layers. One may retrieve information about particular featureson a map, but this is optional to implement.
8

Figure 1: An example Web Map Service frontend by http://osm-wms.de/
Web Feature Service Web Feature Service delivers, and optionally works with, data invector format – Geography Markup Language by default, although this is not a requiredformat[43]. The interface is similar to what Web Map Service offers, i.e. HTTP-based with aspecific set of commands, and optional interfaces for manipulating (create, update, delete)data.
Code Example 3: WFS GetFeature Request
<wfs : GetFeature s e r v i c e="WFSV" v e r s i o n="1.0.0"xmlns : topp="http://www.openplans.org/topp"xmlns : wfs="http://www.opengis.net/wfs"xmlns : ogc="http://www.opengis.net/ogc"xmlns : x s i="http://www.w3.org/2001/XMLSchema -instance"x s i : schemaLocat ion="http://www.opengis.net/wfs
http://schemas.opengis.net/wfs/1.0.0/WFS-basic.xsd">
<wfs :Query typeName="building:features"><ogc : F i l t e r>
<ogc : F e a t u r e I d f i d="Feature1"/></ogc : F i l t e r>
</wfs :Query>
</wfs : GetFeature>
Code Example 4: WFS GetFeature Response)
<?xml v e r s i o n="1.0" encod ing="UTF-8"?>
9

<wfs : F e a t u r e C o l l e c t i o n ( . . . ) >
( . . . )
<gml : featureMember><bu i l d i ng : f e a t u r e s f i d="Feature1">
<bu i l d i ng : name>Sample Bui lding</bu i l d i ng : name><bu i l d i ng : geometry>
<gml : Point srsName="http://www.opengis.net/gml/srs/epsg.xml#900913"><gml : c o o r d i n a t e s
xmlns : gml="http://www.opengis.net/gml"dec ima l="." c s="," t s=" ">
63 .414876 ,10 .406321</gml : c o o r d i n a t e s>
</gml : Point></bu i l d i ng : geometry>
</bu i l d i ng : f e a t u r e s></gml : featureMember>
</wfs : F e a t u r eCo l l e c t i o n>
The difference from Web Map Service is that the data results (see Code Example 3 and 4)(this example was shortened, see Appendix B for complete text ) are not visual, but in vectorformat, and therefore more suitable for further processing in e.g. custom GIS applications, orfor sending through to a Web Processing Service.
WPS The Web Processing Service standard defines a way to implement geospatial dataprocessing as a web service, often used by client GIS applications, and not directly by users[44].Like Web Map Service and Web Feature Service, the interface is exposed through HTTP (orSOAP). The data can be sent as input, or exist on the server, and – after processing – iseither received, or changed on the server.
10

Figure 2: Simple illustration of a Web Processing Service
The processes are mostly used for spatial operations, although there is no limitation in thestandard that enforces the Web Processing Service only working on spatial data. Examples ofprocesses (working on geospatial data) are raster to vector (or vector to raster) conversion,transformation between coordinate systems, Delaunay triangulation and finding shortestpaths.
Simple Features Access for SQL Simple Feature Access specifies a common storagemodel and naming scheme for geometry objects (e.g. point, polygon, multi-point)[45], andalso specific implementation details for different formats (e.g. SQL[46]). They specify thewell-known text5 and binary6 formats as the internal, as well as common serialization formatsfor input and output.
The coordinate reference system part of the object. Since most GIS systems – both on theweb and desktop – need to store geographical data in SQL databases, the Simple FeatureAccess specification plays a very important role, since most of the value is in the data.
Code Example 5: Well-known text format (WKT)
POINT(1 .2345 2 .3456)
Code Example 6: Well-known binary format (WKB)
0001FFFFFFFF8D976E1283C0F33F16FBCBEEC9C302408D976E1283C0F33F16FBCBEEC9C302407C010000008D976E1283C0F33F16FBCBEEC9C30240FE
However, there are a lot of geometry objects the Simple Feature Access standard does notcover. It only specifies objects in two dimensions, and does not have support for any non-linearcurves, circles or arcs. Most of these are necessary in a modern GIS system, which regrettablyresults in vendor-specific implementations.
11

3.4. JavaScript – the language of the web
Hand in hand with the HTML5 standard, enjoying wide support and enabling developers toprogram the web, is JavaScript (other ”web languages“ (such as PHP, Ruby and Python) areused server-side, or have special requirements to function properly) – in fact, HTML5 relieson JavaScript for interaction and animation. JavaScript got ahead of other programminglanguages of the web by being invented as early as 1995 by Netscape, and quickly becamewidespread as a client-side programming language for web sites.
Some vendors were hesitant to use JavaScript, as it was not standardised, because they fearedtrademark issues (for example, Microsoft created their own implementation of JavaScript,called JScript, prior to the standardization process.[47]). Fortunately, JavaScript quicklybecame popular, and it was handed over to ECMA International in 1996 for standardization.ECMA International accepted it as a standard under the name ECMAScript, after whichbrowser vendors could implement support without risking legal trouble[48].
Although JavaScript is primarily a client-side scripting language, recent years has seen itevolve, and it is now used server-side (e.g. node.js[49]), as well as for writing desktopapplications (GObject introspection[50], GNOME (Shell)[51]).
Despite the name, JavaScript has nothing to do with the well-known, object orientedprogramming language Java. JavaScript does not have classes – with which you caninstantiate a handful of objects with the same behaviour – but instead uses objects andprototypes[52]. Unfortunately, JavaScript is one of very few prototype-based languages withwide adoption[53], and most other widespread programming languages use classes.
Class-based languages are what developers are taught in universities and schools, what theyknow. Since this knowledge can not be used directly in JavaScript, this makes JavaScripthard (and sometimes frustrating) to work with. Efforts like CoffeScript – a language thatcompiles to JavaScript – has been created to make JavaScript easier to work with, but thefundamental issues still remain[54]. The lack of a module system makes it hard to createlarge applications in JavaScript.
There has been a lot of work put into performance and speed optimization of JavaScript, butthe design of JavaScript makes this particularly challenging. While the execution speed ofJavaScript has improved twentyfold in the last three years, traditional compiled languages likeC and C++, are still acknowledged as (slightly) faster in benchmarks[55]. This will probablychange as JIT compiler optimizations improve, which will probably happen sooner rather thanlater, as most interpreted languages (C#, Java), including JavaScript, use JIT as one of theprimary ways of improving efficiency. (A Just-In-Time (JIT) compiler is an optimization thatcompiles and optimizes small portions of the program to machine code while the program isrunning.)
”First and foremost, we believe that speed is more than a feature. Speed is the most importantfeature. If your application is slow, people won’t use it. I see this more with mainstream usersthan I do with power users. I think that power users sometimes have a bit of sympathetic eye
12

to the challenges of building really fast web apps, and maybe they’re willing to live with it,but when I look at my wife and kids, they’re my mainstream view of the world. If somethingis slow, they’re just gone.“[56]
For enhancing performance, the Google v8 JavaScript engine[57] supports a native API forcalling C/C++ code, that developers could use to improve execution speed[58]. However,since one of the major motivations of HTML5 is platform independence, and using the v8engine’s native API would break this platform independence and introduce incompability withother JavaScript engines, it is a feature that should be used with caution.
JavaScript is still the only language that is out there and widely supported. JavaScript ishere to stay, and an existing language, or new languages, for that matter, will struggle anextremely steep uphill battle to replace JavaScript, even though that language is ”better“.(Google is, at the time of writing, trying to push it’s own web language, Dart[59], to thepublic, and is facing all of these issues.)
3.5. Thinking GIS in JavaScript
Since JavaScript has had such a long time to mature, and is the only widely supportedprogramming language across all browsers, quite a substantial amount of useful librarieshas emerged, making development with JavaScript easier. In GIS, there are a lot of openstandards and libraries developed for use in geographic applications.
The open standards in a previous section, and the Open Geospatial Consortium, are obviouslyimportant as well, because they enable standard implementations to be shared betweendevelopers. The Open Source Geospatial Foundation (OSGeo) promotes and supports thedevelopment of open source geospatial software[60]. Some of the supported projects areimplemented in JavaScript, or for consumption on the web.
Even though there is a lot of media attention on the HTML5 specification, the functionality ofthe specification itself is not enough – nor intended to – cover domains like GIS applicationscompletely (there is no library for coordinate systems in HTML5, for example). What HTML5does, is to expose and make accessible a lot of the native elements’ functionality in JavaScript,precisely to ease integration with external tools and libraries written in JavaScript. In thisway, existing JavaScript libraries and tools are even more useful with HTML5 technology.
4. HTML5 components suitable for GIS
4.1. Overview
Before discussing HTML5, it is important to emphasize that the HTML5 standard is composedof a number of independent modules, that are implemented more or less individually and canbe used independently from each other. This means that while every part of HTML5 is not
13

fully supported across all browsers yet, some modules already have wide support, and can beused successfully today.
In the wake of lacking support and implementation across browsers, a handful of tools haveappeared to check if specific features are supported in the browser – the most popular isprobably Modernizr[61]. Libraries that backport several features for use in ageing browsersare also available, a great win for companies on the fence because of lacking support. Sincethe support status change rapidly, use of online sources to examine current browser supportis encouraged (html5test.com[62], html5readiness.com[63] and caniuse.com[64]).
This part of the paper examines modules that are considered (by the author) as particularlyinteresting for use in a HTML5 GIS application, modules that solve major issues with webapplications, and provide the developer with tools that previously have required third-partyplugins or platform/browser specific code.
There were not room for every relevant bit from HTML5, because there are a lot of usefultechnology for GIS developers. Forms[65] are widely used, e.g. when the user needs to submitinformation, or query for information. HTML5 provide validation and widgets for forms, suchas a date input field with a calendar pop-up to choose the date, without any additional coderequired.
There are a lot of extra text attributes[66] that could be useful for an application, likeaccesskey for keyboard shortcuts, tabindex for input field focus order (when continuouslypressing the tab key), and even menu and command for defining toolbars and context menus(although not well supported yet). HTML5 drag and drop API [67] was not included becauseit is not considered mature yet, and not recommended for use. When it matures, however,creating interactive interfaces can be done natively with html elements.
The Messaging API[68] is not examined in detail, but used as part of Web Workers andServer-Sent Events. It also provides methods for passing text strings between domains (whichhas traditionally not been allowed, to prevent Cross Site Scripting[69] attacks).
4.2. Canvas
4.2.1. History
It was Apple who invented the concept of the canvas for use in the Mac OS X Dashboardand their web browser, Safari[70]. Before canvas was invented, one needed third-party plugins(Flash, Scalable Vector Graphics, Vector Markup Language) to be able to use a drawing API.Apple intended to keep it as a proprietary extension, but changed their mind, and handed thepatents and standard over to the World Wide Web Consortium (W3C), and it became a partof the official HTML5 specification[71].
14

4.2.2. Basics
The canvas element has become the most celebrated module that the HTML5 standardprovides, because it provides the developer with incredibly powerful tools, while still beingrelatively simple. Perhaps the best statement of its capabilities is the WebGL (see Section4.2.5), which is an OpenGL-like implementation done in the canvas element itself.
What separates canvas from being – frankly – a very boring and inflexible element, is thatthe actual drawing and manipulation of this simple API, is done through JavaScript. Thismakes it possible to do a lot beyond simple drawings, albeit not as effortlessly as with thesvg standard, since everything has to be done manually, where the svg element has a treestructure and native support for interaction and animation.
Canvas is often confused with the svg element (examined in Section 4.3), where graphicsbecomes part of the DOM, and have a defined relationship, and interfaces for animation andinteraction[72]. The canvas element is a bitmap canvas, and no structure or relationshipbetween the elements is maintained by the canvas element – when something is drawn on thecanvas, it is simply part of a bitmap image. However, the API is vector based, which makesit possible to transfer ”drawing instructions“ from the server to the client, to save bandwidth.The perception of animation in the canvas element, is created by repeatedly drawing objects,and clearing the canvas, illustrated in Figure 3.
Figure 3: Animating in canvas (from left to right): (1) drawing a circle, (2) clearing thecanvas and (3) drawing a (new) circle left of the circle in (1), creating a perceptionof movement
With the canvas API being such a simple one, developing complex animations and inter-actions from scratch require a lot of boilerplate code (i.e. code that is common to mostimplementations, and needs to be written over and over). Following the release, quite anumber of frameworks emerged to simplify development with the canvas (HTML CanvasLibrary[73], EaselJS[74], gury[75], jCanvaScript[76], ocanvas[] ...), often by introducing anobject-like development model with events. The libraries can be seen as analogous to theiroffline siblings, that were developed for exactly the same reason(s).
15

At the time of writing, there are a vast number of libraries in development, but none of themcan be considered complete, stable and mature at present. Like is common with projectsin their infancy, the documentation is also lacking, which makes the gain in using thesedebatable. However, as time progresses and the libraries mature, they will be very valuabletools for development with the canvas element.
4.2.3. Usage
There are multiple ways to use the canvas element in a GIS application, because the canvaselement can be used at widely different levels in the application stack (see Figure 4). Oneway of using the canvas is to render tiles in multiple canvas elements, or implement the wholemap in a single canvas element. An advantage with limiting canvas usage to static tilesor images, is that the functionality (i.e. drawing objects or rendering images) is supportednatively through the canvas API.
The other way is to create the entire application – or a major part of its functionality – in asingle canvas element, and even though this approach is more complex, since the developerwill at least need to extend the canvas API with support for interaction, the canvas element’ssimple API is implemented in most browsers, and the resulting application will therefore workconsistently across more platforms than more complex technologies (such as svg).
Figure 4: Canvas can either be a part of the application, or the application itself can beimplemented completely in canvas
Some implementations of the canvas element are hardware accelerated[77] – i.e. the renderingis done on the GPU – and this can be used to load and manipulate images – e.g. load, andrun image algorithms on bitmap tiles – with less of a performance impact than the traditionalimg-element.
Since the canvas element has had a lot of exposure in the media as one of the most interestingand visual parts of HTML5, it has gotten a lot of uptake among ”ordinary“ developers. The
16

flexibility of the element has lead to multiple games and all kinds of software projects, whichhave been developed almost entirely within one or several canvas elements. There are evenmultiple sites dedicated to showcasing web applications made with canvas.
4.2.4. Encoding binary data
Central to the web domain is the efforts to transfer of data between client and server faster.The most obvious way to make a transfer faster, is to transfer less data, i.e. decrease thesize of the data. The two most popular formats for sending and receiving data are XML[78](or GML[79], which extends XML with geographical definitions) and JSON[41], and they areboth text-based, human-readable and easy to parse. Note that pure XML and JSON areused in this example instead of GML and GeoJSON to reduce the size of the examples and(structural, redundant) data.
Code Example 7: XML
<geometry><po i n t>
<type>ca r</ type>< l a t>63.414751</ l a t>< l o n>10.406435</ l on>
</ po i n t><po i n t>
<type>bus</ type>< l a t>63.414914</ l a t>< l o n>10.406263</ l on>
</ po i n t></ geometry>
Code Example 8: JSON
{"geometry" :[
"point" : { "type" : "car" ,"lat" : 63 .414751 ,"lon" : 10 .406435
} ,"point" : { "type" : "bus" ,
"lat" : 63 .414914 ,"lon" : 10 .406263
}]
}
17

With the UTF-8 encoding, where each character is a single byte, the XML example’s size is163 bytes, and the JSON example’s size is 121 bytes, and a single point, respectively, 70and 50 bytes. These numbers does not look very high, but one rarely needs only a handfulof points. If one want to transfer a 1024x1024 map, where one point is a single pixel, onewould need 1 048 576 points, which is (when using JSON) 1048576 · 50 = 52428800bytes,and 52428800
1024= 51200kB, which is quite a lot.
The most obvious way to decrease their size is to compress the data or represent the data inbinary format. Unfortunately, neither XML nor JSON can handle binary data, and compressionand decompression algorithms that work with them e.g. base64 adds a noticeable performanceoverhead, and makes the achieved faster data transfer rates unnecessary as the end result(i.e. the perceived performance of our application) remains more or less the same.
A way to work around these limits is to transfer binary data in raster format, and processingthem through the canvas element, although this remains a proprietary approach, as an openstandard is currently lacking. With a 1024x1024 raster image, we can choose betweengreyscale, colours and colours+transparency, respectively 1x255, 3x255 and 4x255 values tostore data in.
In the example, our points only have a single variable (type), so greyscale is the leastdemanding option (wrt. data size). Each pixel in greyscale only consume a single byte, sowith this approach, the data’s size is 10242 = 1048576 bytes, or 1048576
1024= 1024kB. Quite an
improvement when comparing to JSON’s 51MB, and a way to utilize the canvas element fordecreasing data size.
4.2.5. WebGL
For GIS applications requiring 3D visualization, the canvas element itself is not sufficient,as it only provides 2D functionality. One needs 3D for virtual reality scenarios, e.g. a mapstreet view where the user can move around and se the environment in 3D, and for any 3Denvironment (see Figure 5 for an example of the WebGL Globe[80] ). WebGL (Web-basedGraphics Library) is an extension to the canvas element[81], and provides a ”low-level 3Dgraphics API based on OpenGL ES 2.0“[82].
18

Figure 5: Example showing the world population in 1990, 1995 and 2000 using WebGL
WebGL is managed by the non-profit Khronos Group, which also hosts the rest of the OpenGLspecifications, and was not developed by the WHATWG, but it is still considered a HTML5technology. Since the OpenGL ES 2.0 is supported by hardware in both mobile devices aswell as desktops, this not only gives the developers access to 3D functionality in the browser,but hardware accelerated 3D functionality on the web, with wide support on a lot of devices.This aids the primary goal of moving applications from the desktop to the web.
Care has been made to develop the API for JavaScript programmers that are not experiencedwith languages where one has to manually manage memory (such as C and C++). A lotof third party libraries (such as three.js[83]) have emerged to further close the gap between(traditional) JavaScript code and WebGL code, to make development easier and faster.
Security One major browser that has yet to implement support for WebGL (at the time ofwriting), is Microsoft Internet Explorer. The main reason given for not implementing WebGLis ”lack of security“, as this low level component may introduce ways to compromise thebrowser or computer it is running on[84].
The concerns are certainly valid, but not really more so than any other young technology thatenters the web. Other major browser vendors have implemented support (Mozilla Firefox,Google Chrome, Opera, Safari), and continue to discover and improve issues and concerns,as well as performance.
19

4.3. Scalable Vector Graphics (SVG)
4.3.1. History
The Scalable Vector Graphics (SVG) specification has been in development since 1999, afterPrecision Graphics Markup Language (Adobe, IBM, Netscape and Sun), and Vector MarkupLanguage (Microsoft, HP, Macromedia and Visio) were submitted as proposals for openstandardization to the W3C[85]. SVG reached ”recommended“ status in 2001[86].
Unfortunately, native support for SVG across all of the most popular browsers were notachieved until Microsoft implemented support for SVG in version 9 of Internet Explorer (olderbrowsers only had support for Microsoft’s VML). Limited support in browsers (especially themobile browser segment, which is becoming very relevant) might be the primary reason whyadoption of the SVG format has been moving at a slow pace.
The HTML5 specification introduced inline SVG[87], which meant that authors did not haveto include their (external) SVG files with the object-element, but instead keep the SVG codedirectly in their HTML document.
4.3.2. Basics
SVG is a language where two-dimensional graphics is described in XML[86]. Each graphicsobject, which may be either a vector shape, raster image or text, are all valid graphic objects,is retained in a hierarchy and thus easy to reference. All elements support attributes (location,size, colour), transformations and styling (e.g. with CSS). SVG also support collectingelements into groups, where e.g. transformation can be applied to the group as a whole.
Because the standard has been in use for years (on the desktop), there are several maturevector graphics applications suitable for producing SVG files, like Inkscape[88] and AdobeIllustrator[89]. There is therefore no need to learn or develop new software for creating SVGgraphics.
An SVG document is not static, but interactive and dynamic, and animations are defined(and triggered) ether as SVG animation elements[90][91], or with scripting languages such asJavaScript. The retained document object model makes SVG very appropriate for dynamiccontent where elements should interact with the user.
20

Figure 6: Example of pixel-based and vector-based scaling: raster graphics (left) and vectorgraphics (right)[92]
Vector graphics are defined by mathematical formulas, shapes and paths, instead of pixelvalues, and support indefinite scaling (see Figure 6). For applications that require the abilityto view the graphics in different sizes while retaining quality, vector graphics is the best fit.
An SVG file is smaller than the corresponding bitmap image, on average[93]. Many webbrowsers support delivering web pages as compressed files, and since SVG is (text based)XML with repetitive patterns, it is a key candidate for compression. An SVG tree that iscompressed with gzip[94] consumes only 20%-50% of the uncompressed file[95].
SVG is very capable by itself, and it does not need support from a library for most uses, sincethe standard already support dynamic and interactive graphics. When developing rich userinterfaces with canvas (Section 4.2), one need to develop (or find a library that supports)an object model to reference the interface objects, and events on these objects, before evenstarting to develop the actual application.
The largest drawback with SVG is its complexity. An XML-like document which is a part ofthe DOM itself, makes SVG much harder to implement correctly than the (simpler) canvas,and the performance suffers from this complexity as well[96]. If a vendor can not deliver aconsistent experience across all target platforms, or the technology is too resource hungry,that vendor will look for a different solution.
The complexity of SVG currently limit the amount of objects and complexity that can beused without noticeable delay. Therefore, there is an ongoing effort to hardware-acceleratethe drawing, and offload the CPU, to get better performance. Especially manufacturers oflow-powered devices such as mobile phones and tablets want this to save power. Microsofthas implemented hardware accelerated vector graphics in their Internet Explorer 9[97], andthe rest of the browser vendors are expected to implement similar functionality, e.g. withOpenVG[98], which is a standard for acceleration of 2D vector graphics
21

4.3.3. Usage
The support for inline SVG makes a great difference from including external SVG files. InlineSVG elements easily integrate into the existing application, instead of having to keep thewhole – or a distinct subset of – the application in the contained svg element (like canvas,Section 4.2, does). For example, interactive list elements and forms can trigger events ona selection of the svg paths, or touch events on svg objects can trigger events on the htmlelements (see Figure 8).
Figure 7: Overview of the example SVG application
An example application was developed (see Section 1.1 for source code), that show variousways to provide interaction with SVG. Through the element itself, all the buildings can bemoved with the mouse pointer, and will show the building name on hover (see Figure 7).The inline SVG was developed with the library Raphael[99], the buildings were taken directlyfrom a raw SVG file imported from OpenStreetMap[100] and jQuery UI[101] was used toimplement support for events and styling the list of buildings.
The example contains a selection of buildings (from campus Gløshaugen, NTNU, Norway)that are interactive – they will show a pop-up window with the building’s name when hoveringthe mouse pointer over the building, the buildings can be moved (see Figure 8a) by dragging(click and hold the mouse pointer, then move the pointer), and double clicking a buildingwill remove it from view. This is ”self-contained“ functionality – all done in the inline SVGelement itself.
22

(a) Moving buildings (b) Select (group of) buildings from the list
Figure 8: Interacting with the example through both SVG and HTML elements
There is also a list of building groups (although some groups only consist of a single building)in a separate, standard HTML, unordered list element, and the elements are selectable byclicking and clicking while holding the ctrl-key or drawing a rectangle with the mouse to selectmultiple list elements at once. Selected groups are coloured red (see Figure 8b). This is anexample of how to integrate functionality with inline SVG into existing html web elements, andusing existing html elements as part of an application, thus utilizing the many improvementsthat the html5 specification has in other areas. It saves work for the developer, and makesbetter use of the standards (opposed to inventing the elements anew inside the SVG element).
4.4. Geolocation
The geolocation API of HTML5 lets you share your location (as latitude, longitude) withweb applications[102]. The standard requires the geolocating function to be implemented asopt-in, i.e. the user must explicitly give his or her permission before use. This is important,as privacy is a major concern when using such a feature. Although geolocation is not strictlypart of the HTML5 standard – it was developed as a separate W3C specification[103], andnot by the WHATWG – it is commonly referenced as a HTML5 feature.
23

Figure 9: Example showing geolocation used to (somewhat accurately) pinpoint a visitor’sposition on a map
Locating the computer is done with the best means available. Mobile devices often havemore options, but also the most important to position accurately means geolocation bylookup (IP address or WiFi access point database) or a triangulation technique such as GPSor cell phone towers. Application developers also need to keep in mind that most desktopcomputers/laptops does not have a GPS, unless the application is targeting a very specificgroup of users.
Code Example 9: Sample geolcation API use
n a v i g a t o r . g e o l o c a t i o n . g e tC u r r e n tP o s i t i o n (funct ion ( p o s i t i o n ) {
c u r r e n t p o s i t i o n = p o s i t i o n ;ma r k e r l o c a t i o n = new L . LatLng (
c u r r e n t p o s i t i o n . coo rd s . l a t i t u d e ,c u r r e n t p o s i t i o n . coo rd s . l o n g i t u d e) ;
24

p o s i t i o n = new L . Marker ( ma r k e r l o c a t i o n ) ;
map . se tV iew ( ma r k e r l o c a t i o n , 1 6 ) . addLayer ( p o s i t i o n ) ;
p o s i t i o n . bindPopup ("<b>Accuracy </b>:<br/><small>" +c u r r e n t p o s i t i o n . coo rd s . a c cu racy +" m" ). openPopup ( ) ;
} ,funct ion ( e r r o r ) {
a l e r t (’Error occurred. Error code: ’ + e r r o r . code ) ;// error.code can be:
// 0: unknown error
// 1: permission denied
// 2: position unavailable
// (error response from locaton provider)
// 3: timed out
}) ;
In the example implementation (Figure 9) (see Section 1.1 for source code), the method usedwas probably IP address-based, because of the low accuracy (done at the University campusthrough a wired network connection). A snippet of the example source code (see CodeExample 9), show that the geolocation API is not terribly difficult to use, mostly because themethods and properties available are not extensive.
The API supports separate querying with getCurrentPosition, and continuous tracking withwatchPosition and clearWatch. Using the Position object(s) that is aquired, one may querythe altitude (height above the reference ellipsoid), accuracy (in metres, one for coordinatesand one for accuracy), travel direction, speed and the timestamp (when the position wascaptured)[104].
Despite the simplicity of the geolocation API, it provides the developer with an incrediblyimportant piece of information – the location of the user. Knowing where the user is canbe used in a number of ways e.g as a hint for default language, currency and other regionalsettings. A solution for desktop computers could be providing GIS tools with an approximatearea that would (statistically) be most useful to cache, based on the user’s location. Locationsare perhaps even more popular and appropriate in mobile applications, as people tend tomove around a lot with mobile devices – with the opportunity for more active use of thelocation – and be more stationary in front of a desktop computer.
25

4.5. Web Sockets and Server-Sent Events
While the canvas element (and SVG) solves a lot of the limits of creating rich interfaces, ahuge problem when dealing with web applications and the server-client architecture, is latencyand bandwidth. When a browser visits a web page, an HTTP request is sent to the webserver which hosts that page, and the server sends back the response (known as polling).When dealing with web pages, this is normal behaviour, and is how the web has operated foryears[105].
However, in applications where information is continuously updated – such as a GIS toolshowing real-time air traffic on a map for use by air traffic control – the delay that occursbetween the browser’s request and the server’s response, could lead to outdated informationon the map (which, in the case of air traffic control, could be outright dangerous)[106].
There are two current available strategies to create real-time web applications, known as server-side push, where Comet is the most widespread. Server-side push uses either long-polling orstreaming as it’s strategy to avoid the problems discussed[107].
Long-polling is like a normal poll, except the connection between the client and server is keptopen for a set amount of time before it is closed, and the server sends all the data responsesthat occur in this timespan. This eliminates the need to send requests for each response, andthe inevitable time delay this causes.
The second technique is called streaming, and the difference from long-polling is not thatgreat. The connection is kept open like with long-polling, upon a request, but the responsesthat are sent is never completed (i.e. the server never sends an ”end of response“). Theproblem with streaming is that a proxy server or firewall may buffer the response, increasingthe latency.
There is a lot of unnecessary overhead with the HTTP header information for each requestand response, since an application that updates continuously generates a lot of headers, andthus a lot of data and bandwidth wasted. This applies to all of the techniques mentioned,since all of them go through HTTP requests and responses.
The request/response behaviour is half-duplex, meaning one can send or receive data, butnot both at once. Keeping two open connections to simulate this, is expensive and will notscale. One can conclude that HTTP is not suitable for real-time applications, which isn’tthat surprising – after all, there were no demand for this when HTTP was designed.
The lack of an API (Application Programmer’s Interface) for high-performing communicationbetween client and server in web applications is the reason that WebSockets is part of HTML5.WebSocket provides native full-duplex communication through a single socket over the Web,eliminating the latency and overhead with prior solutions[108].
After an initial handshake (see Code Example 15), the upgrade from the HTTP protocol tothe WebSocket protocol is done, and WebSocket data frames can be sent back and forthbetween the client and the server through the defined interface. The connection is open until
26
explicitly closed by the client, saving even more unnecessary overhead of opening and closingconnections.
Currently, there is no supported way of sending binary data to JavaScript through WebSockets (Web Sockets support binary, but JavaScript has no byte type, and therefore can nothandle data in binary format), so text based JSON strings is the best option (for more onbinary data, see 4.2.4). When the socket is closed by the client, there is no way to reopenthat socket – a new socket connection needs to be created.
The importance of HTML5 Web Sockets for the establishment of software on the web,especially real-time applications, should not be taken lightly.
”HTML5 Web Sockets provides such a dramatic improvement from the old, convoluted”hacks“ that are used to simulate a full-duplex connection in a browser that it promptedGoogle’s Ian Hickson—the HTML5 specification lead—to say: ”Reducing kilobytes of data to2 bytes. . . and reducing latency from 150ms to 50ms is far more than marginal. In fact, thesetwo factors alone are enough to make Web Sockets seriously interesting to Google.““[107]
4.5.1. Example of usage
A map application was developed (see Section 1.1 for source code) that uses, and tests thelatency of, HTML5 Web Sockets. When the user clicks on the map, the coordinates are sentwith Web Sockets through to the server[109]. The server sends the data back, and the timeused from sending the data packet, to receiving it, is measured. The marker is placed on themap only after it has been received from the Web Socket server.
27

Figure 10
Even though the markers are placed on the map after the data has been sent betweenthe client and server twice (first to the server, then back), the application does not feelunresponsive. The latency between sending and receiving data is sufficiently low in thisexample for a server to process data and send the data back (e.g. find nearest bus stop inthe server spatial database, and send it back quickly enough that the user perceives it asnear ”real-time“). Further testing with this example is found in Section 6.3.1. Similar resultshave been found by others as well[110].
4.5.2. Server-Sent Events
Server-Sent Events fits usage where one only needs one-way communication[111]. The APIis similar to Web Sockets, but only able to deliver data from the server, to the client. A
28

difference from Web Sockets is that a Server-Sent Event connection conveniently reconnectsif the connection is interrupted, and resends any updates that were interrupted or not sentduring the disconnect [112].
Server-Sent Events have not received as much exposure as Web Sockets, but using it doesnot require more than traditional HTTP and thus does not require special implementationsto work. Although it uses HTTP, the implementation is as efficient as Web Sockets, anddoes not require polling and request/response patterns. If it is only listening that is required,consider using of Server-Sent Events instead of Web Sockets.
4.6. Offline Storage
Storage in web applications has traditionally been solved using cookies, a tiny dictionaryof data values that are stored in the browser and sent with every http request (to the webserver) and response (see Section4.5 for more on HTTP request/response)[113]. This isclearly not an optimal model, which is why the amount of data in cookies are restricted insize (to reduce the overhead upon request/response). This limit is about 4kB in practice –too small for documents or larger data structures. By exposing the network to the storedinformation on every request/response, the security is also decreased if the cookies are notproperly decrypted[114].
There have been attempts to solve these problems by third-party plugins, however, to becompatible across browsers is very important for these technologies, so developers may relyon them, and use them at the very core of their application(s). So, instead of cookies, thestorage solution needs to be able to handle more data and the data must not use bandwidthwhen not needed. Which is what the HTML5 Local Storage[115] solves, technically. There isalso HTML5 Application Cache[116], which allows an application to be developed for offlineuse. Since they complement each other nicely, the umbrella term offline storage is used forboth of them.
Obviously, this gives us storage we can rely and save bandwidth on, and save data during oracross sessions. However, perhaps even more important – especially since the mobile devicemarket is increasing at such a rapid pace – is the possibility to develop reliable GIS applicationsand services that work without an internet connection, either short-term (unreliable wifi,driving through a tunnel) or more long-term (working a whole day in the field without aconnection, uploading results/data when necessary).
Some privacy concerns have been raised regarding the storage API[117]. The HTML5 storageAPI specification increases security compared to cookies – increased security was a primaryconcern when the storage API was made – primarily by not sending data back and forth likecookies do, but also preventing domains from accessing data from other domains than theirown. However, it is unclear how well this is implemented by the browser vendors, and thisshould be investigated before storing sensitive data.
Data not being stored on the server, means that user data will not be compromised, even if
29

the web server has a security breach. The storage API is vulnerable to the following types ofattack:
DNS Spoofing Compromise DNS server(s) and make domains point to different servers.This would give the attacker access to other domains local data.
Multi-user environments If a browser is shared by multiple users, the local data can beaccessed by every user, since the browser only differentiates on domain, not per user.
There are other concerns, such as the fact that sensitive data should be stored encrypted,which is always valid, although it is more of a general security issue, which is not influencedparticularly by the storage API.
4.6.1. Local Storage
The Storage interface of HTML5 Local Storage has a sessionStorage attribute, and alocalStorage attribute. The former stores data while a window or tab is open, and deletesthe data as soon as it is closed; while the second is useful for indefinite data storage, or datashared between more than a single window or tab. The API (for both storage types) is simplya (key,value) dictionary-like data structure which you can write items to and read or deleteitems from.
There is also a method for clearing the database, since there is no way to loop through thedata structure. Unfortunately, the specification recommends a minimum amount of only 5MBstorage space (per origin), optionally prompting the user to grant more space. This meansthat while the amount of data one is allowed to store is increased manifold compared tocookies, it is still far from unlimited, and something the developer must be aware of – dataloss during offline use must be avoided.
4.6.2. Application Cache
Although the Application Cache also provides an API, the functionality is primarily accessedthrough a configuration file (see Code Example 10, and Figure 11) – for example mani-
fest.appcache (the official recommended extension for manifest files is .appcache) – that islinked to from the html tag. The file begins with CACHE MANIFEST, and after is dividedinto the three sections: explicit (the CACHE header), fallback (the FALLBACK header) andonline whitelist (the NETWORK header)[118]. If there are no sections defined, the explicitsection is used for all content – it defines files to be cached explicitly.
Code Example 10: manifest file
CACHE MANIFEST
# Ve r s i o n s a r e kept i n the comment# to t r i g g e r a cache update when
30

# the v e r i o n number i s i n c r e a s e d## ve r 1
CACHE:# the ’ index ’ page i s cached i m p l i c i t l yj q u e r y . min . j sl e a f l e t / l e a f l e t . c s sl e a f l e t / l e a f l e t . i e . c s sl e a f l e t / l e a f l e t . j sl e a f l e t / images /marker . pngl e a f l e t / images /marker−shadow . pngl e a f l e t / images /popup−c l o s e . pngl e a f l e t / images /zoom−i n . pngl e a f l e t / images /zoom−out . pngg lo sh wgs84 . j s o ng l o s h b u i l d wg s 8 4 . j s o n
NETWORK:∗
FALLBACK:s t o r a g e . j s s t o r a g e o f f l i n e . j so n l i n e . j pg o f f l i n e . j pg
Some scripts will not work when not connected to the internet, and needs alternate imple-mentations when the user goes offline. This is what the fallback section is for; to specifyfallback files or modules. The last section, online whitelist, specifies resources that mustnever be cached, and only available when the user is online.
The Application Cache’s API provides events for the different caching states one can hook intothrough JavaScript, for example forcing a page refresh when the cache is updated, becausethe page content is not automatically replaced when the cache is updated – it is only doneon the next page refresh. An example of hooking into the cache JavaScript events is in CodeExample 11
Code Example 11: event hook
// An event that fires if (from the specification):
// "The manifest was a 404 or 410 page, so the attempt to
// cache the application has been aborted."
// "The manifest hadn’t changed, but the page referencing
// the manifest failed to download properly."
// "A fatal error occurred while fetching the resources
// listed in the manifest."
31

// "The manifest changed while the update was being run."
//
appCache . a ddEv en tL i s t e n e r (’error’ ,funct ion ( e )
{a l e r t ("Error: Could not update the cache" ) ;
}, f a l s e ) ;
4.6.3. Offline Storage Example
An example application developed for this paper, illustrate some techniques and possibilitieswith both Local Storage and Application Cache in a GIS setting. While the Local StorageAPI behaved mostly as expected, the Application Cache standard did not behave consistentlyor as expected across browsers. One example is the window.navigator.onLine property, whichis supposed to return a boolean that indicate whether the client is connected to the internetor not.
In some browsers (Mozilla Firefox), the property only returns false when the user manuallysets the browser to work in ”offline mode“, and other browsers (Google Chrome, Safari)just ignore the property – i.e. it always return true. The fact that it is a caching standardmakes debugging worse, so one should be careful when developing advanced applicationswith Application Cache, at least at the time being, or only use the manifest file (see CodeExample 10), which seem to work reliably.
The example (see Section 1.1 for source code) is a simple mapping application that createsmarkers on a map, and stores the last created marker in localStorage. It works equally welleven if the user is not connected to the internet (obviously though, the application need tobe cached before going offline), using a simple local vector layer map, instead of the updatedOpenStreetMap[119] tiles from a MapQuest[120] server. Figure 11 gives an overview of howthe Application Cache features work, what is kept locally, and what will not load without aninternet connection (some files excluded for clarity, see Code Example 10 for a complete list).
32

Figure 11: An illustration of the manifest file in Code Example 10
The local vector layer was downloaded from OpenStreetMap as an ESRI shape file, andconverted to GeoJSON and WGS84 with the very useful MyGeodata Converter onlineapplication[121]. It is very simple, and shows how an offline solution could store and load asimple map with a low footprint (see Figure 12 and Figure 13).
Figure 12: If the user disconnects from the internet, the tiles are no longer available, and alocally cached vector layer is used instead
33

Figure 13: When the user is connected to the internet, the tiles from MapQuest are used asthe background map
Since the last marker is saved to offline storage immediately, and is not dependent on aninternet connection in any way, the user can retrieve and replace the marker in local storageduring both online and offline use (see Figure 14). In a larger GIS application, the markerdata could be saved to local storage if the application is used without an internet connection,and uploaded to a server when the user gets back online.
34

Figure 14: When the marker is moved, it replaces the current marker in localStorage, and isloaded into the map on page refresh
4.6.4. Future
Although the local storage tools are a great boost compared to previous solutions, thetraditional way for storing data on the web is in a SQL database. Adapting this to asimple dictionary-like API isn’t always sufficient. This is why there are plans for an SQLlocal storage solution, with familiar SQL queries and possibility for more complex datastorage[122]. However, this isn’t really part of the HTML5 specification, since it still isn’tproperly standardized yet – on the contrary neither supported nor alive as a standard[123].However, there are efforts to create an SQL like storage solution.
4.7. Web Workers
Most computers these days are multicore (i.e. they manage do to several things at once),and more performance is often achieved by introducing more cores, instead of making eachcore of the CPU faster. Desktop applications are written to spawn several processes insteadof one to take advantage of processors with more than one core, and GUI (Graphical UserInterface) applications have the user interface in its own thread, so it does not freeze whencomputationally intensive tasks are run in the background.
HTML5 introduces Web Workers to solve this for web applications as well, and provides
35

developers with a tool for working in a multicore/multithreaded environment with tasksthat should be executed independently of e.g. the main user interface[124]. From a user’sperspective, this means that the web application is responsive, instead of hanging on pagerefresh (while the task is executed), and warnings of an unresponsive page popping up (seeFigure 15). In GIS applications, which may use time and resource consuming algorithms forcertain tasks, being able to run these without freezing the CPU is very important, if not arequirement.
With Web Workers, developers no longer need to mimic this behaviour themselves. Currentefforts that do not utilize Web Workers, mimic concurrency in JavaScript by using setTime-out(), setInterval() and XMLHttpRequest, but it comes with a whole lot of problems, mostlysince JavaScript was not designed with multi-threaded environments in mind.
Figure 15: Firefox warning when a script is slow (or unresponsive)
It is important to keep in mind that the Web Workers – running in separate threads – doesnot have access to the DOM (Document Object Model – the node tree on the web page) orother UI objects, and therefore can not directly manipulate any of them. However, one isable to set up a callback function that listens for messages from the worker, which the mainthread may respond to by updating the UI appropriately. Note that there is a high start-upperformance and memory cost[124] for Web Workers, and they are expected to be long-livedand few (at the same time).
4.7.1. Dedicated Workers
The type of Web Workers known as Dedicated Workers, run in an isolated thread, separatefrom the main program[125]. Because JavaScript was designed as a single-thread language(and to avoid user error), this means that the task that is to be executed separately fromthe main thread, needs to be contained in a separate file. The Worker object is constructedwith the path to the JavaScript file that shall be executed in a separate thread, and the taskexecution can then be managed through the Worker object.
The ability to communicate with Dedicated Workers is realized through message passing.Messages are sent to the worker with postMessage, and received through a custom definedmethod in the Worker.onmessage event callback.
36

4.7.2. Shared Workers
Shared Workers are more complicated than Dedicated Workers, because any window on thesame domain can share the use of a worker thread between them. This is an advantagefor applications where it is common to use multiple windows, and for saving the memoryand start-up performance cost that creating multiple Dedicated Workers would consume.However, one needs to consider if the saved memory and CPU is worth the added complexityof Shared Workers.
The main difference with Shared Workers is that each window needs a separate identification– a port – when communicating with the Worker, and if one wants multiple Shared Workers,they need to be constructed with a name[126]. The rest is almost identical to DedicatedWorkers, and handled ”behind the scenes“. A Shared Worker is active as long as there isat least one open connection to it (e.g. when you close some of the windows attached to ashared worker).
4.8. Video and Audio
HTML5 introduces new elements for embedding video and audio without needing to usethird-party software[127]. While the usefulness of these new elements for GIS applications maynot be immediately apparent, they provide a very simple way to add media to applications.GIS developers might, for example, want to add interactive ”get started“-tutorials and-walkthroughs for new users, and this is trivial with the new video and audio elements.
The elements also provide a set of controls, auto play etc., which are easily added with minimalamount of code[128]. For those wanting to add advanced controls, such as a timeline[129],both elements provide standardized APIs to enable custom behaviour.
However, despite the video and audio elements being standardized, which codecs to use on theweb were never standardized. Therefore, different browsers/browser vendors support differentsets of video and audio codecs, and, unfortunately, there are no codecs with ubiquitoussupport, and one need to provide media in more than one format (the creators were pragmaticenough to add support for multiple video files in a single video element).
37

(a) Video markers on a map (b) Clicking on a marker reveals the video and controls
Figure 16: Multiple markers on a map which contains video clips that can be controlled bythe user
The video example (Figure 16) (see Section 1.1 for source code) shows a map with multiplemarkers. Clicking on a marker (Figure 16b) reveals a pop-up that contains a video. There isalso an additional JavaScript function, hooking into the video API, to fix problems in earlyversions of Android OS[130] in the code. Users of Microsoft Internet Explorer prior to version9, and other browsers without support for the video element, will be presented with thedownload link (support for Internet Explorer could be implemented with a custom ActiveXapplet, and transcoding the video file to .wmv-format) instead.
Figure 17: Example showing an audio element with styled html elements as controls
The audio example (Figure 17) (see Section 1.1 for source code) does not use the provided,default controls, but uses ordinary html elements styled with css as the interface, andinteraction is defined in JavaScript via the audio API. This is obviously just a simple example,but shows the possibilities of customisation through the API. For more advanced examples ofcustomizing the audio element, visit the PagePlayer[131].
38

5. Existing GIS tools built with HTML5
The last couple of months has seen some early adopters building new GIS tools built withHTML5 technology. Also, some existing libraries and applications have been (partly) rewrittento make use of HTML5 technology. With HTML5 being such a young standard, however,at the time of writing, the existing base of GIS applications and libraries using it, is rathersparse. This section contains a selection of GIS tools that are known to use parts of HTML5with success.
5.1. Simple Educational GIS
The author is developing a simple GIS system for educational purposes[132] using HTML5technology while this paper is being written. The system works with raster data, and thegoal is to teach simple boolean data operations and other common concepts (reclassify etc.).The idea is burrowed from existing GIS systems, that use a binary tree to manipulate data(see Figure 18).
(a) The data tree (b) Visualisation of a data layer
Figure 18: A simple, educational GIS system
39

The inline SVG JavaScript library Raphael[99] is used for most of the program, and providessvg features for interaction in a way that is easy to work with through JavaScript.
Libraries using the canvas element was initially used for development, but after several bugsand a resulting slow interface, Raphael and inline svg was chosen instead. Compared – andin contrast – to most (competing) libraries that rely on the canvas element, Raphael is botheasier to use, covers a lot of uses, and feels more mature and bug-free.
5.2. Cartagen
Cartagen[133] is a mapping framework, developed at the MIT Media Lab, that uses thecanvas element for rendering maps from various sources, using JavaScript. Instead of usingpre-rendered and cached tiles on a server, that are transferred to the client on demand,Cartagen downloads the raw vector data from the server, and uses the client to render anddisplay the map.
Using the client for map rendering has a couple of key advantages. The data is downloadedonce, instead of every time the user interacts with the map (zoom, pan), and rendering onlyconsumes CPU processing power on the client, which means that the server can handle moreclients simultaneously, or during a given period of time, because they avoid repeated requestsfor new data.
40

Figure 19: Example of a GSS style that retrieves localized building names
Cartagen further exploits the client rendering by using a custom styling format for maps –Geographic Style Sheets (GSS) . The GSS format is derived from Cascading Style Sheets(CSS), which are known to all modern web developers, and the goal is to make map stylingmore accessible. It also expands on CSS since it includes support for JavaScript callbacksand functions (see Code Example 12 from the cartagen web site). For developers, this meansthat a lot can be achieved just by creating a Geographic Style Sheet, e.g. localization (seeFigure 19 from the cartagen web site).
Code Example 12: GSS file with JavaScript function
b u i l d i n g : {op a c i t y : 1 ,l i n eW id th : 0 . 001 ,f i l l S t y l e : "#444" ,t e x t : funct ion ( ) {
i f ( t h i s . t a g s . ge t (’name:’+Conf i g . g e t u r l p a r am s ( ) . l anguage )
41

)return th i s . t a g s . ge t (
’name:’+Conf i g . g e t u r l p a r am s ( ) . l anguage)
e l s ereturn th i s . t a g s . ge t (’name’ )
} ,hove r : {
f i l l S t y l e : ’#222’ ,a c t i o n : funct ion ( ) {
c on s o l e . l o g (’hover’ )}
} ,mouseDown : {
l i n eW id th : 18 ,s t r o k e S t y l e : "red" ,a c t i o n : funct ion ( ) {
c on s o l e . l o g (’mousedown’ )}
}} ,l a ndu s e : {
f i l l S t y l e : "#ddd"
} ,r a i l : {
l i n eW id th : 4 ,s t r o k e S t y l e : "purple"
}
For a client – browser – that is less powerful, handing raw data and expecting it to do all thework may result in a slow and choppy experience when interacting with the map. Browsers orcomputers that do not have or support hardware rendering on the graphics processor, will nothave a pleasant experience (tested first-hand by the author, on a browser without hardwareacceleration support).
5.3. Leaflet
Leaflet is a modern mapping library developed by Cloudmade[134]. It is a tile-based library, andsupports both canvas and svg technologies for rendering raster and vector tiles, respectively(and also VML, for older versions of Internet Explorer). The different rendering backends aremainly supported for platform compatibility reasons, but may also be forced[135].
With the map library being tile-based, the actual map rendering and caching of the tiles isdone on the server, and this is displayed in the client. There is support for vector objects that
42

are either individual or part of a vector layer – polygons, circles, markers, lines – and they arestyled with CSS3. While the vector layers are static, the rendering of vector objects are doneby the client, and also support custom behaviour on mouse, touch or keyboard events.
Figure 20: The official leaflet mobile example[136] on an Android mobile phone
One of the strengths of Leaflet, is that it is well supported across a lot of platforms, and thatit supports mobile phones and tablets. Creating a fullscreen web application using Leafletthat correctly reacts to touch events is very straightforward (see Figure ). Geolocation is alsowell supported through a custom function to zoom and center the detected location of theuser.
Most of the examples in this article use Leaflet, because it makes it very straightforward tocreate examples that combine background tile maps with custom features and vector layers.
5.4. KothicJS
Kothic JS[137] is a map rendering engine for generating and presenting vector based tiles inHTML5 canvas elements, written in JavaScript. Leaflet5.3 supports using Kothic JS as abackend, for using true vector tiles rendered in canvas.
43

Figure 21: Example use of Kothic JS rendering vector tiles with Leaflet used as the mapfrontend
The tiles in Kothic JS have a similar naming scheme to traditional raster tile engines (i.e.grouped into /x/y/zoom tiles), and use vector data in GeoJSON format(see Section 3.3.1)for rendering the tiles. With Kothic JS being a javscript rendering engine, it can be used torender tiles on-the-fly from GeoJSON vector data, based on a user-supplied MapCSS file.
MapCSS[138] is a simple and declarative stylesheet language for maps (see Code Example 13),and is – like GSS (see Section 5.2) – derived from Cascading Style Sheets (CSS). The goal isto create an easier experience for amateurs and professionals that want to make customisedmaps without the barrier of e.g. creating a mapnik[139] style. The language only supportsarithmetics through very simple JavaScript through the eval-function, and not variables, likeGSS, and is therefore somewhat limited for projects that need complex features. It is also
44
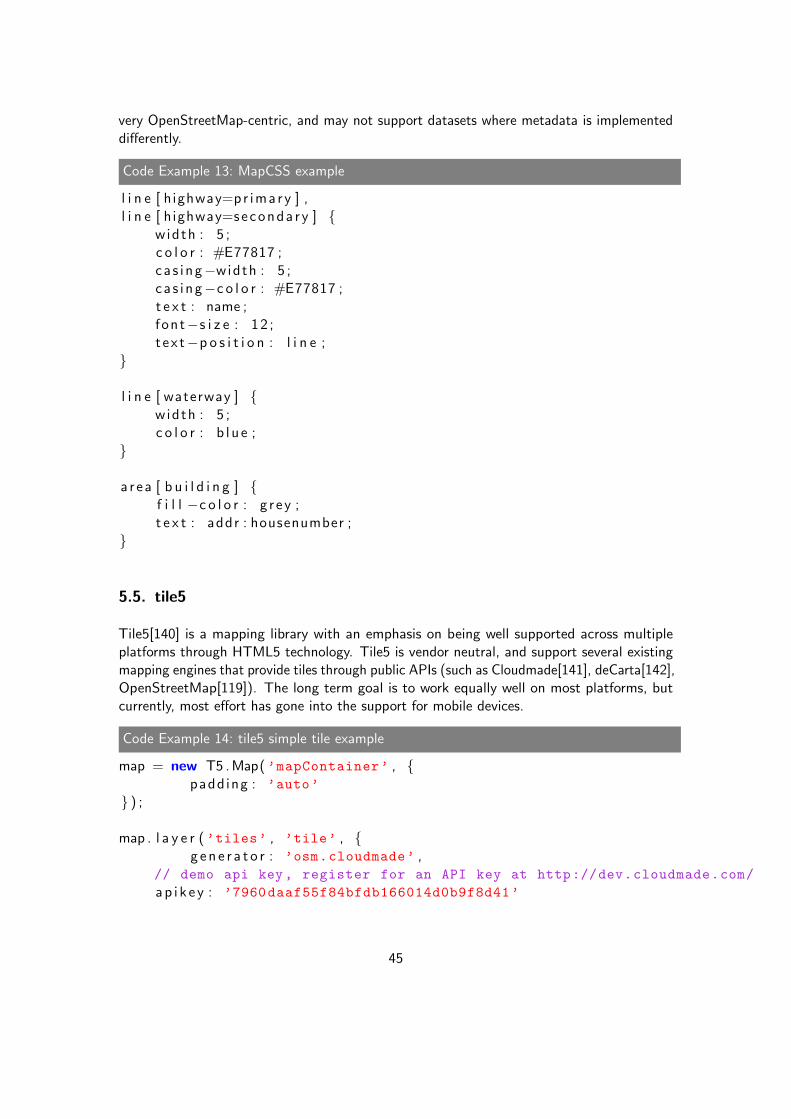
very OpenStreetMap-centric, and may not support datasets where metadata is implementeddifferently.
Code Example 13: MapCSS example
l i n e [ h ighway=pr imary ] ,l i n e [ h ighway=seconda ry ] {
width : 5 ;c o l o r : #E77817 ;ca s i ng−width : 5 ;ca s i ng−c o l o r : #E77817 ;t e x t : name ;font−s i z e : 12 ;t ex t−p o s i t i o n : l i n e ;
}
l i n e [ waterway ] {width : 5 ;c o l o r : b l u e ;
}
a r ea [ b u i l d i n g ] {f i l l −c o l o r : g r e y ;t e x t : addr : housenumber ;
}
5.5. tile5
Tile5[140] is a mapping library with an emphasis on being well supported across multipleplatforms through HTML5 technology. Tile5 is vendor neutral, and support several existingmapping engines that provide tiles through public APIs (such as Cloudmade[141], deCarta[142],OpenStreetMap[119]). The long term goal is to work equally well on most platforms, butcurrently, most effort has gone into the support for mobile devices.
Code Example 14: tile5 simple tile example
map = new T5 .Map(’mapContainer’ , {padd ing : ’auto’
} ) ;
map . l a y e r (’tiles’ , ’tile’ , {g en e r a t o r : ’osm.cloudmade’ ,
// demo api key, register for an API key at http://dev.cloudmade.com/
ap i k e y : ’7960daaf55f84bfdb166014d0b9f8d41’
45

} ) ;
map . zoom ( 8 ) . c e n t e r (’-27.4695 153.0201’ ) ;
Figure 22: Simple example of tile5 rendering OpenStreetMap data from Cloudmade
Since there are a lot of mobile frameworks for providing user interfaces, tile5 tries tocomplement them, rather than compete with them. To ensure a smooth experience, integrationtesting is done with the most widespread and popular of them (jQTouch[143], jQueryMobile[144], Sencha Touch[145]).
46

Tile5 supports several backends built on HTML5 technology. The most prominent – andmost stable – is the backend using the canvas element, but rendering through svg is alsoavailable as a beta feature through Raphael, which is a third party library to increase crossbrowser support for SVG.
5.6. giscloud
Giscloud[146] is a collection of tools for storing, accessing and manipulating spatial data onthe web. The stack uses the HTML5 canvas element both on the server and in their client –apparently (since the source is not available for examination, this is based on examination ofwhat’s available from third parties, they (among other techniques) process binary data (seeSection 4.2.4) through the canvas element to achieve an impressive performance boost[147].
Figure 23: Example of giscloud client which uses html5 canvas for rendering ele-ments that are individually selectable http://www.giscloud.com/map/16594/germany-6000000-features
Although giscloud is a collection of tools, the map engine – which is interesting for its use ofcanvas – is very similar to Kothic JS (see Section 5.4) because it uses vector data to rendertiles in real-time instead of relying on cached raster tiles.
47

6. Performance of HTML5 GIS tools
6.1. Measuring performance
There are a lot of ways to measure performance, since it means different things depending onthe software, the requirements of the software and those who are going to use it. While in areal-time application it is crucial that the delay from the GPS to the rest of the system is asshort as possible, an offline GIS application might value the application’s ability to handlelarge amounts of data higher (a responsive application with large amounts of data).
Requirements and importance of the different ways to measure performance will also beprioritised differently based on the actual subset of HTML5 technology the application isusing. Knowing the performance ”cost(s)“ of a particular module during development willcertainly be an advantage if the resulting application is required to satisfy a specific set ofperformance requirements.
6.2. Defining performance
Performance has been the driving factor for software engineering for years, which hascompromised a lot of other important software qualities (such as security, modifiability,testability)[148]. This is fortunately changing along with the price
performance -ratio dropping, andthe cost of developing software rising. Because JavaScript is a relatively young language 3.4,performance is still the major concern when moving GIS applications to the web. However,even though this section focuses on performance, it is important not to forget other qualityattributes.
Performance is about managing resources, to receive and respond to events. The time ittakes to respond after an event is received, is called latency, and increasing performance isdefined as minimizing latency[149]. Previous literature divide performance issues into twocategories, depending on the way they delay the response (and thus increase latency); theamount of resources the process consumes (where resources include network bandwidth,memory, CPU) is called resource consumption; the time a process needs to wait because itneeds to use a resource that is unavailable, the time delay that is caused by sharing a resourcewith other processes, or the time a process needs to wait for a computation to finish (and thecomputation itself might need another computations result to initiate) is called blocked time.
To emphasise other important points when one considers moving from the desktop to the web,this definition is loosened a little, to include things that indirectly influences the performance– the performance as it is percieved by the user – where this makes sense.
48

6.3. Web Sockets
Web Sockets has a very simple API, that only supports opening and closing a connection,sending and receiving data, and retrieving the connection state and also an error handler.The only overhead is the handshake footprint, and the start and end bytes for each datatransfer, which both consume only a single byte. This is significantly better than normalHTTP communication.
Code Example 15: WebSockets handshake (request and response)
GET / t e x t HTTP/1 .1Upgrade : WebSocketConnect ion : UpgradeHost : www. websocket . org( . . . )
HTTP/1 .1 101 WebSocket P r o t o co l HandshakeUpgrade : WebSocketConnect ion : Upgrade( . . . )
To compare the older, HTTP-based approaches up against WebSockets, a traditional im-plementation was made[107] that continuously (once per second) polls real-time stock-datafrom a RabbitMQ message broker, and this application was also built with WebSockets forcomparison.
Code Example 16: HTTP request header
GET / Po l l i n g S t o c k // Po l l i n g S t o c k HTTP/1 .1Hos t : l o c a l h o s t : 8 0 8 0User−Agent : Mo z i l l a /5 .0 (Windows ;
U;Windows NT 5 . 1 ;en−US ;r v : 1 . 9 . 1 . 5 )
Gecko /20091102 F i r e f o x / 3 . 5 . 5Accep t : t e x t /html ,
a p p l i c a t i o n / xhtml+xml ,a p p l i c a t i o n /xml ; q=0.9 ,∗/∗ ; q=0.8
Accept−Language : en−usAccept−Encod ing : gz ip , d e f l a t eAccept−Cha r s e t : ISO−8859−1, u t f −8;q=0.7 ,∗ ; q=0.7Keep−A l i v e : 300Connec t i on : keep−a l i v eR e f e r e r : h t t p : //www. example . com/ Po l l i n g S t o c k /
49
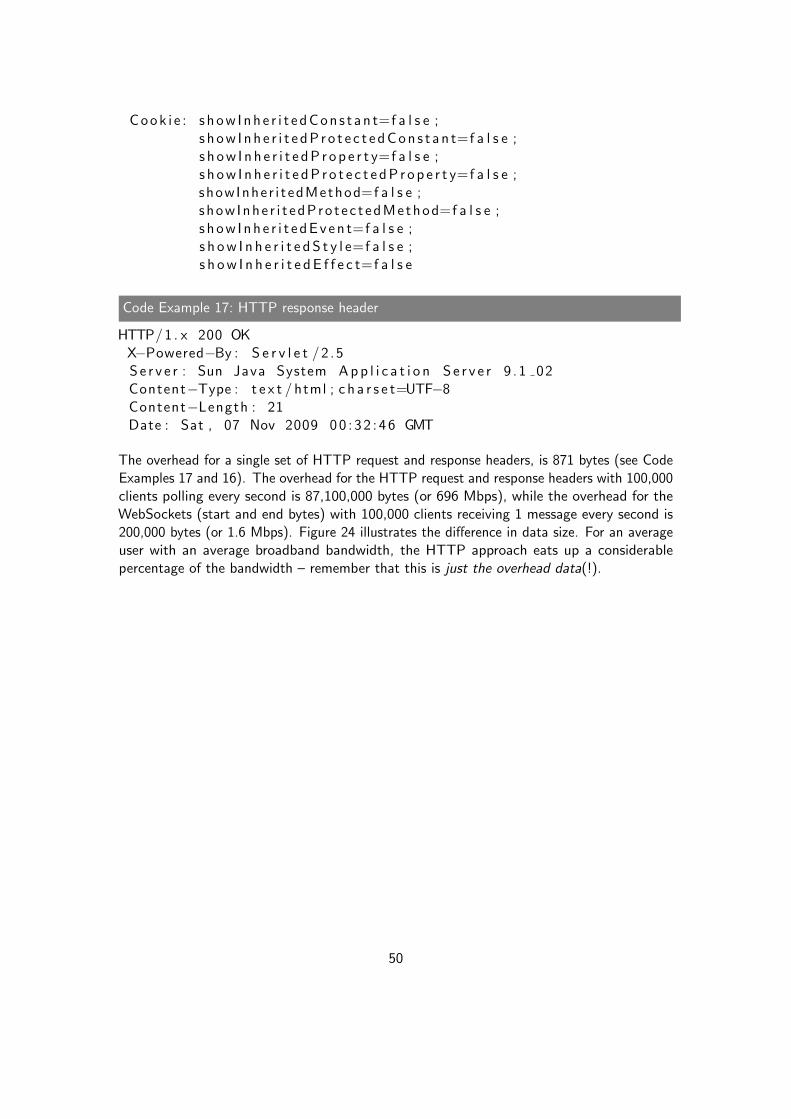
Cook i e : s h ow I nh e r i t e dCon s t an t=f a l s e ;s h ow I nh e r i t e dP r o t e c t e dCon s t an t=f a l s e ;s h ow I n h e r i t e dP r op e r t y=f a l s e ;s h ow I n h e r i t e dP r o t e c t e dP r o p e r t y=f a l s e ;showInhe r i t edMethod=f a l s e ;show Inhe r i t edPro t e c t edMethod=f a l s e ;s h ow I nh e r i t e dEv en t=f a l s e ;s h ow I n h e r i t e d S t y l e=f a l s e ;s h ow I n h e r i t e d E f f e c t=f a l s e
Code Example 17: HTTP response header
HTTP/1 . x 200 OKX−Powered−By : S e r v l e t /2 .5S e r v e r : Sun Java System App l i c a t i o n S e r v e r 9 . 1 02Content−Type : t e x t / html ; c h a r s e t=UTF−8Content−Length : 21Date : Sat , 07 Nov 2009 00 : 32 : 46 GMT
The overhead for a single set of HTTP request and response headers, is 871 bytes (see CodeExamples 17 and 16). The overhead for the HTTP request and response headers with 100,000clients polling every second is 87,100,000 bytes (or 696 Mbps), while the overhead for theWebSockets (start and end bytes) with 100,000 clients receiving 1 message every second is200,000 bytes (or 1.6 Mbps). Figure 24 illustrates the difference in data size. For an averageuser with an average broadband bandwidth, the HTTP approach eats up a considerablepercentage of the bandwidth – remember that this is just the overhead data(!).
50

Figure 24: The difference in data transfer overhead and bandwidth requirements with HTTPand Web Sockets
The substantial savings in bandwidth is only one benefit of Web Sockets – there is also areduction in latency because one does not have to poll for new data, and the server may sendthe data immediately (see Figure 25). To simplify the illustration, and make the point moreclearly, the packets arrive immediately on the illustration, although there will be a 50ms delayin reality (in our case the latency is 50ms between client and server). With HTTP, one firstsends a request, then receives the response. If the latency between client and server is 100ms,the time from the request is sent, until the response is received, is 2 · 100ms = 200ms.
51

Figure 25: The difference in latency with HTTP and Web Sockets, where [1] is the firstupdate on the server, (1) is the first update received by the client and ( ) is anempty (and redundant) packet
A Web Socket does not use this pattern – after the handshake is established, the server cansend the data directly. It is important to note that while the client will always be busy sendingrequests and receiving responses, just to check if there is new data, the server only sendsdata through the established Web Socket when it has an update to send, and is free to doso immediately (i.e. not wait for the next HTTP request). The client using Web Socketstherefore has more resources to do other work, since it does not need to poll constantly.
6.3.1. Latency test
The Web Sockets example (see Section 4.5.1) was used as a starting point to develop arealistic test for examining the latency overhead in Web Sockets (see Section 1.1 for sourcecode). The Web Sockets server used[109] just relays the data immediately, sending it backto the client. The latency results in the tests are therefore the time it takes from the clientsends the data to the server until it receives the data back (from the server).
52

The tests are performed manually, to avoid erroneous results because of the client, andtechnical limitations. The actual interaction works exactly like the Web Sockets example (seeSection 4.5.1, Figure 26), i.e. by clicking on the map and placing markers, and the resultsare stored for later analysis.
Figure 26: The user interacts with the map by placing markers, and the latency betweenclient and server is measured and stored
A lot of markers were created (see Figure 27) to make sure that temporary speed increasesand decreases did not influence the results. The tests were also done on different hardware,operative systems and browsers.
53

(a) (b)
Figure 27: Markers that were made in the web browsers during testing
Before analysing, abnormal latency due to hangs or freezes in the JavaScript engine on theclient (here, after inspecting the results to determine the ”normal“ range, latency above350ms) caused by either the client or server, were removed.
For each of the collected results, mean value (µ) and standard deviation[150] (σ) wereestimated. Then the normal distribution was created with the probability density function (seeEquation 1)[151]. (There were 586 observations for Chromium on Linux and 808 observationsfor Chrome on Windows, which means that n should be large enough to approximate normaldistribution, in both cases[152].)
f(x) =1√2πσ2
e−
(x−µ)2
2σ2 (1)
A JavaScript plotting library, flot[153], was used to visualise the results. As we can see in theresults (Figure 28 and 29), the standard deviation differences between the two collected resultsare marginal (linux: σ ≈ 16ms, windows: σ ≈ 17ms). The mean latency for Chromium onLinux and Chrome on Windows was 134ms and 136ms, respectively.
We observe that the latency results are fairly low. Generally, users are less tolerant ofunresponsive desktop applications[154] compared to web pages[155] (i.e. information retrieval).Since our intention is to evaluate Web Sockets for use in web applications that replace desktopapplications, the requirement for responsiveness should be as strict as the latter, for theformer (Jakob Nielsen says[154] ”These guidelines have been the same for 37 years now, sothey are also not likely to change with whatever implementation technology comes next.“).
54

Figure 28
Figure 29
The responsiveness requirement for users to feel that they are manipulating directly in real-time (this is typical for GIS applications where spatial objects are edited and/or queried) is0.1 second. Our results show that the mean values are sufficient to satisfy this requirement,and as long as we are below 150ms (with the precision chosen, all values below 150ms iswithin 0.1s).
A quick look at Figures 28 and 29 relieves that the limit is approximately a single standarddeviation from the mean value.The probability that the request and response is below this(artificial) limit of 150 ms (P (X ≤ 150)), is sensible to examine. To be able to use the valuesfrom the table[152], the data need to be converted to standard normal distribution ( N(1,0)), with the function Y = X−µ
σ , where X is our existing variable.
Calculating the probability that X is 150 ms or less using Chromium on Linux :
55

P (X ≤ 150ms) = P (X − µ
σ≤ 150− µ
σ)
= P (X − 134
16≤ 150− 134
16)
= P (Y ≤ 1)
= φ(1)
= 0.8413
and with Chrome on Windows :
P (X ≤ 150ms) = P (X − µ
σ≤ 150− µ
σ)
= P (X − 136
17≤ 150− 136
17)
= P (Y ≤ 0.82)
= φ(0.82)
= 0.7939
Most requests and responses will be perceived as ”real-time“ by the user in this application.The longest time spent between client and server in most cases, is found by constructing aconfidence interval of 99% :
Z =X − µ
σ∼ N(1, 0)
P (Z < zα/2) = 1− α
α = 0.01
zα = 2.326
By choosing an α of 0.01, we get zα = 2.326 from[152]. The results for Chromium on Linux :
P (X − µ
σ< 2.326) = 1− 0.01
P (µ < 134 + 2.326 · 16) = 0.99
P (µ < 134 + 37) = 0.99
P (µ < 171)
and Chrome on Windows :
56

P (X − µ
σ< 2.326) = 1− 0.01
P (µ < 136 + 2.326 · 17) = 0.99
P (µ < 134 + 40) = 0.99
P (µ < 174)
The results show that in most cases, the time from a request is sent from the client, untilthe response is received, is less than 171 ms and 174 ms. Even though some results will beabove the 150 ms limit, most will be below (see above) 150 ms, and the user probably willnot notice a substantial difference in the few cases where it is.
However, this is only a test of one server. While the results will vary depending on distance andbandwidth between client and server, and also the amount of data transferred and processingetc., it still gives an impression of the capabilities of Web Sockets, and the improvementcompared to HTTP request/response.
Other studies of Web Sockets A simple collaboration drawing application was developed[110]for testing Web Sockets on real-time and collaboration application purposes. The resultsindicate that Web Sockets outperform other standards-based technologies, and that WebSockets has made the web a reliable platform for real-time systems.
6.4. Web Workers
JavaScript was not designed for running in multi-threaded environments, but Web Workerswere designed to solve this – each Worker runs in a separate thread. There are lots ofsoftware that can benefit from running multiple processes that are time-consuming and wouldotherwise freeze the web UI in the GIS domain. An obvious gain would be saving resourcesby running e.g. a large Delaunay-triangulation algorithm on a local machine with multiple,otherwise idle, cores.
Processes that need to communicate over the network, and need to wait for its request tocomplete before returning the result, would freeze the UI in a single-threaded application.This is especially prevalent in GIS applications, that often need to query a server for a tinysubset of its geographical data. The need to keep the data in a central location might be forlicensing, storage or computational issues, but the fact is that web GIS applications need toaccommodate this.
Web Workers avoid this by separating the process, and thus decrease the percieved latency– the task may not be processed faster in this scenario than without Web Workers, sincethe actual work is done on the server, but since it is non-blocking with Web Workers, it isperceived as faster (also freeing the user to du other things in the ui).
57

A third way to take advantage of the Web Worker API is to distribute resource demandingtasks from server to the clients – distributed computing. A real-time web application wasimplemented[156] to test the performance gain with Web Workers on both low-end (consumer)and high-end (commercial) server hardware (see Table 1).
low-end server high-end server
CPU Intel A110@800 MHz 2 x Intel Xeon(R) [email protected] GHzRAM 1 GB 4 GBOS Fedora 12 Fedora 11
Table 1: Specifications of the servers used in the study
The system was a game with characters distributed in a shared world, and each client wouldupdate its view through the server. This application was implemented in two ways, onewhere the server did all the calculations, and a second where the server distributed eachrequest back to the client to process, with required information (information about the othercharacters). Requests were sent from the clients every 500ms, and there were an average of18 non-playable characters visible for each client at all times.
Figure 30: Figures that show network and CPU usage on the high-end server (from [156])
Results (see Figure 30) show that even with the low-end server, the latency is reduced with10% when using web workers. Although the use of Web Workers places higher load on thenetwork (because of all the extra information that is transferred to the clients), the amountof data transferred is low, and the savings in CPU usage with Web Workers are more of abottleneck than the transfer rate limit from server to client (20 concurrent players consumeda total of 130kB/s, or 1Mb/s).
The results with the high-end server show a noticeable decrease in CPU usage when distributingthe load with Web Workers – with 50 clients, the load for using and not using Web Workersis 11% and 17%, respectively. The transfer rate increases with Web Workers in the samemanner as the low-end server, which is expected.
58

7. Can HTML5 serve the requirements of future GIS
applications?
Early in 2011, the WHATWG group announced[157] that the HTML specification will just beknown as ”HTML”. This means that the WHATWG HTML specification[158] is now a ”livingstandard”, and removes the artificial barrier for browser vendors to delay implementationsbecause of the new version not being finished (actually, looking at how HTML5 was and isadopted, this has been going on for some time).
One needs to keep in mind, when thinking of HTML5 as a technology, that it is not limiting inthe way that e.g. Adobe Flash is. HTML5 is a part of the open web, and while it standardizesa lot of technology previously hard to develop and maintain across browsers, use of HTML5encourages use of external JavaScript libraries to implement the features that HTML5 itselfdoes not cover. With closed technologies such as Flash, it is not as easy to rely on externalresources.
The future of HTML5 – or just HTML – (GIS) applications therefore gains from theadvancement of web technologies in general, and not only the specification itself. NewJavaScript libraries and frameworks that ease development, or use optimized algorithms;JavaScript engines with increased performance or new JIT compiler optimizations; existinggraphical user interface frameworks that adds support for rendering on the web; how and howfast the web browser vendors implement support for new technologies, and also hardwareacceleration, are all influencing the degree of success that HTML5 will have in providing GISapplications on the web.
Additionally, by trying to add support for the web and HTML5 into an existing user interfaceframework, the GTK+ Broadway project[159][160], which renders applications written withthe GTK+ framework in a HTML5 canvas element, any existing GIS application writtenwith GTK+[161] – such as the libchamplain mapping widget – will ”automatically“ alsobecome a web application. It is a very interesting approach which makes a desktop applicationweb capable without a complete rewrite to HTML5, but although applications such as theLibreOffice productivity suite[162] are already planning running on GTK+ Broadway[163],GTK+ Broadway is not currently ready for production use. Depending of the success ofGTK+ Broadway, other frameworks and GIS applications such as QT[164] and QuantumGIS[165] may follow this approach too.
In the end, the driving factor is the demand for accessing GIS web applications in a browser.With great demand, innovation and improved performance will follow – although performanceis a barrier right now, it will probably improve rapidly. Cross-compatibility between browsers,and browser vendors willingness to cooperate, is more critical, because the goal of HTML5as a common platform – in the author’s opinion HTML5’s perhaps strongest argument –will not work without the compatibility this requires. If HTML5 continues to evolve into aneffective solution for any application that needs to work on multiple platforms, it certainlyshould have a bright future for application development in the GIS domain.
59

8. Conclusion
With the new HTML5 standard, the open web has taken a major step forward for providingdevelopers and companies with the means necessary to create GIS applications that maycompete with their desktop-bound counterparts. While third-party plugins like Adobe Flashand Microsoft Silverlight are years ahead in terms of maturity, HTML5 lays a solid foundationfor the future open web, and existing GIS applications that use HTML5 technologies areimpressive both with regards to their performance, and their user interfaces.
While the Web Sockets API shows a tremendous decrease in redundant bandwidth usage, andlow enough latency for real-time application use, other parts of HTML5 are clearly at a veryearly adoption phase, and not supported across major browsers. However, the opportunityHTML5 provides by being a common platform that is independent of operative systems, andonly rely on a recent web browser, is why HTML5 in the authors opinion should – and will –be adopted by major GIS application vendors, either now or as the standard progresses, andHTML5 matures.
The increase in mobile device usage, and thus multiple operative systems with large marketshares, increase demand for a solution where a single application can be deployed to multipledevices, independent of the type of device. HTML5 only relies on a web browser, and isperfect for this scenario, which is a common situation in the GIS domain with location-awareapplications, or any application that targets mobile devices. This major selling point ofHTML5 looks very promising, and might make or break the large scale adoption of HTML5as a choice for large application vendors.
There is need for further work on various applications of the HTML5 elements, and moreresearch on performance and possibilities in realistic GIS environments (mapping applications,GIS systems etc.). Since the HTML5 – and its ”successor“ HTML – is a moving target,there is additionally a need to assess the standard’s support across browsers as it progressesand matures. Although there are not a high number of GIS applications made with HTML5available, many will emerge as the standard gets older and more widespread, and research onthe implementations of GIS applications on the web with HTML5 is also needed.
It will be interesting to monitor the adoption rate as HTML5 matures. In the author’sopinion, HTML5 is a technology that is a solution to a problem that an increasing numberof application vendors that target multiple (and mobile) devices encounter. How attractiveHTML is and will become for these companies, will decide if HTML5 gets a major or minorrole for application development in the future, and whether e.g desktop GIS applications willmove to the web. The author believes GIS applications and location awareness will increaseeven more, and that this will happen with HTML5 as the underlying technology.
60

Appendices
61

A. HTML5 Support in Web Browsers
At the time of writing this paper, HTML5 is still a ”young“ standard. The support fordifferent parts of HTML5 varies for each browser, and its status should be examined forevery web browsers the developer intends to target. The support status changes at such arapid phase, that instead of providing a static (and quickly outdated) status report in thispaper, one is encouraged to use online sources instead. Sites such as html5test.com[62],html5readiness.com[63] and caniuse.com[64] provides an up to date overview of browserswith HTML5 support.
In the wake of lacking support and implementation across browsers, a handful of tools haveappeared to check if specific features are supported in the browser – the most popular isprobably Modernizr[61]. Libraries that backport several features for use in aging browsers arealso available, a great win for companies on the fence because of lacking support. Use ofsuch tools in encouraged if supporting legacy browsers is a priority.
62

B. Code Examples
Code Example 18: WFS GetFeature Response
<?xml v e r s i o n="1.0" encod ing="UTF-8"?><wfs : F e a t u r e C o l l e c t i o n
xmlns="http://www.opengis.net/wfs"xmlns : wfs="http://www.opengis.net/wfs"xmlns : topp="http://www.openplans.org/topp"xmlns : gml="http://www.opengis.net/gml"xmlns : x s i="http://www.w3.org/2001/XMLSchema -instance"
x s i : schemaLocat ion="http://www.openplans.org/topphttp://localhost:8080/geoserver/wfs?service=WFS&version=1.0.0
&request=DescribeFeatureType&typeName=topp:archsites
http://www.opengis.net/wfs
http://localhost:8080/geoserver/schemas/wfs/1.0.0/WFS-basic.xsd">
<gml : boundedBy><gml : Box srsName="http://www.opengis.net/gml/srs/epsg.xml#900913">
<gml : c o o r d i n a t e sxmlns : gml="http://www.opengis.net/gml"dec ima l="." c s="," t s=" ">
63 .414751 ,10 .406435 63 .414914 ,10 .406263</gml : c o o r d i n a t e s>
</gml : Box></gml : boundedBy>
<gml : featureMember><bu i l d i ng : f e a t u r e s f i d="Feature1">
<bu i l d i ng : name>Sample Bui lding</bu i l d i ng : name><bu i l d i ng : geometry>
<gml : Point srsName="http://www.opengis.net/gml/srs/epsg.xml#900913"><gml : c o o r d i n a t e s
xmlns : gml="http://www.opengis.net/gml"dec ima l="." c s="," t s=" ">
63 .414876 ,10 .406321</gml : c o o r d i n a t e s>
</gml : Point></bu i l d i ng : geometry>
</bu i l d i ng : f e a t u r e s></gml : featureMember>
</wfs : F e a t u r eCo l l e c t i o n>
63

List of Figures
1. An example Web Map Service frontend by http://osm-wms.de/ . . . . . . 92. Simple illustration of a Web Processing Service . . . . . . . . . . . . . . . . 113. Animating in canvas (from left to right): (1) drawing a circle, (2) clearing
the canvas and (3) drawing a (new) circle left of the circle in (1), creating aperception of movement . . . . . . . . . . . . . . . . . . . . . . . . . . . . . 15
4. Canvas can either be a part of the application, or the application itself can beimplemented completely in canvas . . . . . . . . . . . . . . . . . . . . . . . 16
5. Example showing the world population in 1990, 1995 and 2000 using WebGL 196. Example of pixel-based and vector-based scaling: raster graphics (left) and
vector graphics (right)[92] . . . . . . . . . . . . . . . . . . . . . . . . . . . . 217. Overview of the example SVG application . . . . . . . . . . . . . . . . . . . 228. Interacting with the example through both SVG and HTML elements . . . . 239. Example showing geolocation used to (somewhat accurately) pinpoint a
visitor’s position on a map . . . . . . . . . . . . . . . . . . . . . . . . . . . 2410. . . . . . . . . . . . . . . . . . . . . . . . . . . . . . . . . . . . . . . . . . . 2811. An illustration of the manifest file in Code Example 10 . . . . . . . . . . . . 3312. If the user disconnects from the internet, the tiles are no longer available, and
a locally cached vector layer is used instead . . . . . . . . . . . . . . . . . . 3313. When the user is connected to the internet, the tiles from MapQuest are used
as the background map . . . . . . . . . . . . . . . . . . . . . . . . . . . . . 3414. When the marker is moved, it replaces the current marker in localStorage,
and is loaded into the map on page refresh . . . . . . . . . . . . . . . . . . . 3515. Firefox warning when a script is slow (or unresponsive) . . . . . . . . . . . . 3616. Multiple markers on a map which contains video clips that can be controlled
by the user . . . . . . . . . . . . . . . . . . . . . . . . . . . . . . . . . . . . 3817. Example showing an audio element with styled html elements as controls . . 3818. A simple, educational GIS system . . . . . . . . . . . . . . . . . . . . . . . . 3919. Example of a GSS style that retrieves localized building names . . . . . . . . 4120. The official leaflet mobile example[136] on an Android mobile phone . . . . . 4321. Example use of Kothic JS rendering vector tiles with Leaflet used as the map
frontend . . . . . . . . . . . . . . . . . . . . . . . . . . . . . . . . . . . . . 4422. Simple example of tile5 rendering OpenStreetMap data from Cloudmade . . . 4623. Example of giscloud client which uses html5 canvas for rendering elements that
are individually selectable http://www.giscloud.com/map/16594/germany-6000000-features 4724. The difference in data transfer overhead and bandwidth requirements with
HTTP and Web Sockets . . . . . . . . . . . . . . . . . . . . . . . . . . . . 5125. The difference in latency with HTTP and Web Sockets, where [1] is the first
update on the server, (1) is the first update received by the client and ( ) isan empty (and redundant) packet . . . . . . . . . . . . . . . . . . . . . . . 52
26. The user interacts with the map by placing markers, and the latency betweenclient and server is measured and stored . . . . . . . . . . . . . . . . . . . . 53
27. Markers that were made in the web browsers during testing . . . . . . . . . . 54
64

28. . . . . . . . . . . . . . . . . . . . . . . . . . . . . . . . . . . . . . . . . . . 5529. . . . . . . . . . . . . . . . . . . . . . . . . . . . . . . . . . . . . . . . . . . 5530. Figures that show network and CPU usage on the high-end server (from [156]) 58
65

List of Tables
1. Specifications of the servers used in the study . . . . . . . . . . . . . . . . . 58
66
List of Code Examples
1. GML . . . . . . . . . . . . . . . . . . . . . . . . . . . . . . . . . . . . . . . 72. GeoJSON . . . . . . . . . . . . . . . . . . . . . . . . . . . . . . . . . . . . 83. WFS GetFeature Request . . . . . . . . . . . . . . . . . . . . . . . . . . . . 94. WFS GetFeature Response) . . . . . . . . . . . . . . . . . . . . . . . . . . . 95. Well-known text format (WKT) . . . . . . . . . . . . . . . . . . . . . . . . 116. Well-known binary format (WKB) . . . . . . . . . . . . . . . . . . . . . . . 117. XML . . . . . . . . . . . . . . . . . . . . . . . . . . . . . . . . . . . . . . . 178. JSON . . . . . . . . . . . . . . . . . . . . . . . . . . . . . . . . . . . . . . 179. Sample geolcation API use . . . . . . . . . . . . . . . . . . . . . . . . . . . 2410. manifest file . . . . . . . . . . . . . . . . . . . . . . . . . . . . . . . . . . . 3011. event hook . . . . . . . . . . . . . . . . . . . . . . . . . . . . . . . . . . . . 3112. GSS file with JavaScript function . . . . . . . . . . . . . . . . . . . . . . . . 4113. MapCSS example . . . . . . . . . . . . . . . . . . . . . . . . . . . . . . . . 4514. tile5 simple tile example . . . . . . . . . . . . . . . . . . . . . . . . . . . . . 4515. WebSockets handshake (request and response) . . . . . . . . . . . . . . . . 4916. HTTP request header . . . . . . . . . . . . . . . . . . . . . . . . . . . . . . 4917. HTTP response header . . . . . . . . . . . . . . . . . . . . . . . . . . . . . 5018. WFS GetFeature Response . . . . . . . . . . . . . . . . . . . . . . . . . . . 63
67

References
[1] “Creative Commons Attribution-ShareAlike 3.0 Unported License.” http://
creativecommons.org/licenses/by-sa/3.0/.
[2] “Web Hypertext Application Technology Group.” http://www.whatwg.org.
[3] “GitHub.” http://www.github.com.
[4] Matthew B. Hoy, “HTML5: A New Standard for the Web,” Medical Reference Services
Quarterly, vol. 30:1, pp. 50–55, 2011.
[5] “World Wide Web Consortium.” http://www.w3.org.
[6] World Wide Web Consortium, “A History of HTML.” http://www.w3.org/People/
Raggett/book4/ch02.html, 2011.
[7] Matthew Marshall, “Gartner Press Release (on mobile device growth).” http://www.
gartner.com/it/page.jsp?id=1543014, 2011. Accessed 03.12.2011.
[8] Gareth Cook, “How crowdsourcing is changing science.” http://bostonglobe.
com/ideas/2011/11/11/how-crowdsourcing-changing-science/
dWL4DGWMq2YonHKC8uOXZN/story.html, 2011. Accessed 12.11.2011.
[9] “Capital bikeshare crowdsourcing map.” http://www.bikearlington.com/pages/
bikesharing/capital-bikeshare-crowdsourcing-map/. Accessed 08.12.2011.
[10] “crowdmap.com.” http://www.crowdmap.com. Accessed 08.12.2011.
[11] D. Sui and M. Goodchild, “The convergence of gis and social media: challenges forgiscience,” International Journal of Geographical Information Science, vol. 25, no. 11,pp. 1737–1748, 2011.
[12] M. Foth, B. Bajracharya, R. Brown, and G. Hearn, “The second life of urban planning?using neogeography tools for community engagement,” Journal of Location Based
Services, vol. 3, no. 2, pp. 97–117, 2009.
[13] Microsoft, “Introduction to ActiveX Controls.” http://msdn2.microsoft.com/
en-us/library/aa751972(VS.85).aspx, 2008. Accessed 03.12.2011.
[14] Chris Ilias, “ActiveX.” http://msdn2.microsoft.com/en-us/library/
aa751972(VS.85).aspx, 2009. Accessed 03.12.2011.
[15] Adobe, “Adobe - Flash Player.” http://www.adobe.com/software/flash/about/,2011. Accessed 03.12.2011.
[16] Wikipedia, “Email : Host-based mail systems.” http://en.wikipedia.org/wiki/
Email#Host-based_mail_systems, 2011. Accessed 09.11.2011.
68

[17] S. M. (WebWorkerDaily), “Open vs. closed: Why open standards matter.” http://
gigaom.com/collaboration/open-vs-closed-why-open-standards-matter/,2010.
[18] C. Asakawa, T. Itoh, H. Takagi, and H. Miyashita, “Accessibility evaluation for mul-timedia content,” Proceedings of Universal Access in Human-Computer Interaction,pp. 11–19, 2007.
[19] D. Sato, H. Miyashita, H. Takagi, and C. Asakawa, “Automatic accessibility transcodingfor flash content,” in Proceedings of the 9th international ACM SIGACCESS conference
on Computers and accessibility, Assets ’07, (New York, NY, USA), pp. 35–42, ACM,2007.
[20] Google, “Introducing Google Chrome OS.” http://googleblog.blogspot.com/
2009/07/introducing-google-chrome-os.html.
[21] Matthew Marshall, “How HTML5 wil kill the native app.” http://venturebeat.
com/2011/04/07/how-html5-will-kill-the-native-app/, 2011.
[22] “Google Maps.” http://maps.google.com.
[23] “Google Docs.” http://docs.google.com.
[24] “Google Reader.” http://reader.google.com.
[25] “Google Plus.” http://plus.google.com.
[26] “Evernote.” http://www.evernote.com.
[27] “Remember the Milk.” http://www.rememberthemilk.com.
[28] “Sketchpad.” http://www.sketchpad.com.
[29] “Facebook.” http://www.facebook.com.
[30] M. Farber, M. Cameron, C. Ellis, and J. Sullivan, “Massive data analytics and thecloud: A revolution in intelligence analysis,” 2011.
[31] Tim O’Reilly, “Google Bets Big on HTML 5: News from Google I/O.” http:
//radar.oreilly.com/2009/05/google-bets-big-on-html-5.html, 2009. Ac-cessed 18.12.2011.
[32] Steve Jobs, “Thoughts on Flash.” http://www.gartner.com/it/page.jsp?id=
1543014, 2011. Accessed 18.12.2011.
[33] “HTML5 and web standards.” http://www.apple.com/html5/, 2011. Accessed18.12.2011.
[34] “Open Geospatial Consortium.” http://www.ogc.org.
[35] “International Organization for Standardization.” http://www.iso.org.
69

[36] International Organization for Standardization, “Standards FAQs.” http://www.iso.
org/iso/iso_catalogue/faq_standards_2.htm, 2011. Accessed 08.11.2011.
[37] Open Geospatial Consortium, “About OGC.” http://www.opengeospatial.org/
ogc, 2011. Accessed 08.11.2011.
[38] Open Geospatial Consortium, “OGC Standards and Specifications.” http://www.
opengeospatial.org/standards, 2011. Accessed 08.11.2011.
[39] Open Geospatial Consortium, “Geography Markup Language.” http://www.
opengeospatial.org/standards/gml, 2007. Accessed 09.11.2011.
[40] Open Geospatial Consortium, “CityGML.” http://www.opengeospatial.org/
standards/citygml, 2008. Accessed 09.11.2011.
[41] D. Crockford, “The application/json Media Type for JavaScript Object Notation(JSON).” http://tools.ietf.org/html/rfc4627, 2006. Accessed 06.11.2011.
[42] Open Geospatial Consortium, “Web Map Service (WMS).” http://www.
opengeospatial.org/standards/wms, 2006. Accessed 09.11.2011.
[43] Open Geospatial Consortium, “Web Feature Service (WFS).” http://www.
opengeospatial.org/standards/wfs, 2010. Accessed 14.11.2011.
[44] Open Geospatial Consortium, “Web Processing Service (WPS).” http://www.
opengeospatial.org/standards/wps, 2007. Accessed 14.11.2011.
[45] Open Geospatial Consortium, “Simple Feature Access - Part 1: Common Architecture.”http://www.opengeospatial.org/standards/sfa, 2011. Accessed 15.11.2011.
[46] Open Geospatial Consortium, “Simple Feature Access - Part 2: SQL Option.” http:
//www.opengeospatial.org/standards/sfs, 2010. Accessed 15.11.2011.
[47] Microsoft, “JScript (ECMAScript3).” http://msdn.microsoft.com/en-us/
library/hbxc2t98(v=vs.85).aspx, 2011. Accessed 08.11.2011.
[48] Ecma International, “ECMAScript Language Specification.” http://www.
ecma-international.org/publications/standards/Ecma-262.htm, 2011.Accessed 08.11.2011.
[49] “node.js.” http://www.nodejs.org.
[50] “GObject Introspection.” http://live.gnome.org/GObjectIntrospection.
[51] “Gnome.” http://www.gnome.org.
[52] Peter Bright, “JavaScript has problems. Do we need Dart tosolve them?.” http://arstechnica.com/business/news/2011/10/
JavaScript-has-problems-can-googles-dart-solve-them.ars, 2011.
[53] “Prototype-based languages.” http://en.wikipedia.org/wiki/
Prototype-based_programming#Languages, 2011. Accessed 09.12.2011.
70
http://arstechnica.com/business/news/2011/10/JavaScript-has-problems-can-googles-dart-solve-them.ars
[54] Peter Wayner, “From PHP to Perl: What’s hot, what’s not in scriptinglanguages.” http://www.infoworld.com/d/application-development/
php-perl-whats-hot-whats-not-in-scripting-languages-175867?page=
0,1, 2011.
[55] “Computer Language Benchmarks Game.” http://shootout.alioth.debian.org/
u32/benchmark.php?test=all&lang=all, 2011. Accessed 09.12.2011.
[56] “Fred Wilson’s 10 Golden Principles of Successful Web Apps – Fu-ture of Web Apps (Conference).” http://thinkvitamin.com/web-apps/
fred-wilsons-10-golden-principles-of-successful-web-apps/, 2011.Accessed 09.12.2011.
[57] “Introduction - V8 JavaScript Engine.” http://code.google.com/apis/v8/intro.
html, 2011. Accessed 09.12.2011.
[58] “Embedder’s Guide - V8 JavaScript Engine.” http://code.google.com/apis/v8/
embed.html, 2011. Accessed 09.12.2011.
[59] “dartr: Google Dart Programming Resources.” http://dartr.com/.
[60] Open Source Geospatial Foundation, “About the Open Source Geospatial Founda-tion.” http://www.osgeo.org/content/foundation/about.html, 2011. Accessed09.11.2011.
[61] “Modernizr.” http://www.modernizr.com/.
[62] “html5test.” http://www.html5test.com/.
[63] “html5readiness.” http://www.html5readiness.com/.
[64] “caniuse.” http://www.caniuse.com/.
[65] B. Lawson and R. Sharp, “Forms,” in Introducing HTML5, New Riders, 2011.
[66] B. Lawson and R. Sharp, “Text,” in Introducing HTML5, New Riders, 2011.
[67] B. Lawson and R. Sharp, “Drag and drop,” in Introducing HTML5, New Riders, 2011.
[68] Web Hypertext Application Technology Working Group, “Communication,” in HTML,ch. 10, 2011.
[69] Robert Auger, “Cross Site Scripting.” http://projects.webappsec.org/w/page/
13246920/Cross%20Site%20Scripting, 2011. Accessed: 08.12.2011.
[70] Ian Hickson, “Extending HTML.” http://ln.hixie.ch/?start=
1089635050&count=1, 2004. Accessed: 30.10.2011.
[71] Web Hypertext Application Technology Working Group, “The canvas element,” inHTML, ch. 4.8.11, 2011.
71

[72] P. Lubbers, B. Albers, F. Salim, P. Lubbers, B. Albers, and F. Salim, “Using the html5canvas api,” in Pro HTML5 Programming, pp. 25–63, Apress, 2010. 10.1007/978-1-4302-2791-5 2.
[73] “HTML Canvas Library.” http://www.html-canvas-lib.sourceforge.net.
[74] “EaselJS.” http://www.easeljs.com.
[75] “gury.” http://www.guryjs.org.
[76] “JCanvaScript.” http://www.jcscript.com.
[77] Cameron Laird, “Unleash the Power of Hardware-Accelerated HTML5 Canvas.” http:
//msdn.microsoft.com/en-us/hh562071, 2011. Accessed 18.12.2011.
[78] W3C, “Extensible Markup Language (XML).” http://www.w3.org/XML/, 2011. Ac-cessed 06.11.2011.
[79] ISO, “Geography Markup Language (ISO 19136:2007).” http://www.iso.org/iso/
iso_catalogue/catalogue_tc/catalogue_detail.htm?csnumber=32554, 2011.Accessed 08.11.2011.
[80] “The WebGL Globe.” http://www.chromeexperiments.com/globe, 2011. Accessed17.12.2011.
[81] Chris Martin, “WebGL Specification.” https://www.khronos.org/registry/
webgl/specs/1.0/, 2011. Accessed 15.11.2011.
[82] Khronos, “WebGL - OpenGL ES 2.0 for the Web.” http://www.khronos.org/
webgl/, 2011. Accessed 15.11.2011.
[83] “three.js.” http://github.com/mrdoob/three.js/, 2011. Accessed 17.12.2011.
[84] Microsoft Security Response Center (MSRC) Engineering, “WebGL Consid-ered Harmful.” http://blogs.technet.com/b/srd/archive/2011/06/16/
webgl-considered-harmful.aspx, 2011. Accessed 01.12.2011.
[85] W3C, “The Secret Origin of SVG.” http://www.w3.org/Graphics/SVG/WG/wiki/
Secret_Origin_of_SVG, 2010. Accessed 27.11.2011.
[86] W3C, “SVG.” http://www.w3.org/TR/SVG/, 2011. Accessed 16.11.2011.
[87] Web Hypertext Application Technology Working Group, “SVG,” in HTML, ch. 4.8.16,2011. Accessed 27.11.2011.
[88] Inkscape Community, “Inkscape.” http://www.inkscape.org, 2011. Accessed27.11.2011.
[89] Adobe, “Illustrator.” http://www.adobe.com/products/illustrator.html, 2011.Accessed 27.11.2011.
[90] W3C, “Animation,” in SVG, ch. 19, 2011. Accessed 27.11.2011.
72

[91] W3C, “Synchronized Multimedia Integration Language (SMIL 3.0).” http://www.w3.
org/TR/2008/REC-SMIL3-20081201/, 2008. Accessed 27.11.2011.
[92] Wikimedia Commmons, “Bitmap VS SVG.” http://en.wikipedia.org/wiki/File:Bitmap_VS_SVG.svg, 2006. Accessed 27.11.2011.
[93] Adobe, “Scalable Vector Graphics.” http://www.adobe.com/svg/overview.html,2011. Accessed 27.11.2011.
[94] Jean-loup Gailly and Mark Adler, “The gzip home page.” http://www.gzip.org,2011. Accessed 27.11.2011.
[95] Adobe, “Saving Compressed SVG (SVGZ).” http://www.adobe.com/svg/
illustrator/compressedsvg.html, 2011. Accessed 27.11.2011.
[96] Boris Smus, “Performance of Canvas versus SVG.” http://smus.com/
canvas-vs-svg-performance, 2009. Accessed 27.11.2011.
[97] IEBlog, “HTML5, Hardware Accelerated: First IE9 Platform Preview Avail-able for Developers.” http://blogs.msdn.com/b/ie/archive/2010/03/16/
html5-hardware-accelerated-first-ie9-platform-preview-available-for-developers.
aspx, 2010. Accessed 01.12.2011.
[98] Khronos Group, “OpenVG - The Standard for Vector Graphics Acceleration.” http:
//www.khronos.org/openvg/, 2011. Accessed 01.12.2011.
[99] Dimitry Baranovsky, “Raphael – JavaScript Library.” http://www.raphaeljs.com,2011. Accessed 01.12.2011.
[100] OpenStreetMap Foundation, “OpenStreetMap.” http://www.osm.org, 2011. Ac-cessed 01.12.2011.
[101] jQuery Contributors, “jQuery UI.” http://www.jqueryui.com, 2011. Accessed01.12.2011.
[102] Mark Pilgrim, “You are here (and so is everybody else),” in Dive Into HTML5, ch. 6,2011. Accessed 20.10.2011.
[103] W3C, “Geolocation API Specification.” http://dev.w3.org/geo/api/
spec-source.html, 2010. Accessed 20.10.2011.
[104] Ian Devlin, “Finding your position with Geolocation.” http://html5doctor.com/
finding-your-position-with-geolocation/, 2011. Accessed 20.10.2011.
[105] P. Lubbers, B. Albers, F. Salim, P. Lubbers, B. Albers, and F. Salim, “Using the html5websocket api,” in Pro HTML5 Programming, pp. 137–167, Apress, 2010.
[106] Simon E Spero, “Analysis of HTTP Performance problems.” http://www.w3.org/
Protocols/HTTP/1.0/HTTPPerformance.html, 1994. Accessed 08.11.2011.
73

[107] Peter Lubbers and Frank Greco (Kaazing Corporation), “HTML5 Web Sockets: AQuantum Leap in Scalability for the Web.” http://websocket.org/quantum.html,2011.
[108] GISRUK 2011: Effective Vector Data Transmission and Visualization Using HTML5,2011.
[109] WebSocket.org, “Echo Test.” http://websocket.org/echo.html, 2011. Accessed02.12.2011.
[110] C. A. Gutwin, M. Lippold, and T. C. N. Graham, “Real-time groupware in the browser:testing the performance of web-based networking,” in Proceedings of the ACM 2011
conference on Computer supported cooperative work, CSCW ’11, (New York, NY,USA), pp. 167–176, ACM, 2011.
[111] Ian Hickson (Google), “Server-Sent Events.” http://dev.w3.org/html5/
eventsource/, 2011. Accessed 25.11.2011.
[112] Eric Bidelman, “Stream Updates with Server-Sent Events.” http://www.html5rocks.
com/en/tutorials/eventsource/basics/, 2011. Accessed 25.11.2011.
[113] A. Barth (Internet Engineering Task Force, IETF), “RFC 6265 - HTTP State Man-agement Mechanism.” http://tools.ietf.org/html/rfc6265, 2011. Accessed28.10.2011.
[114] P. Lubbers, B. Albers, F. Salim, P. Lubbers, B. Albers, and F. Salim, “Using thehtml5 web storage api,” in Pro HTML5 Programming, pp. 213–241, Apress, 2010.10.1007/978-1-4302-2791-5 9.
[115] Web Hypertext Application Technology Working Group, “Web storage,” in HTML,ch. 12, 2011.
[116] Web Hypertext Application Technology Working Group, “Offline Web applications,” inHTML, ch. 6.6, 2011.
[117] W. West and S. M. Pulimood, “Analysis of privacy and security in html5 web storage,”The Journal of Computing Sciences in Colleges, vol. 27, no. 3, pp. 80–87, 2011.
[118] M. Casario, P. Elst, C. Brown, N. Wormser, C. Hanquez, M. Casario, P. Elst, C. Brown,N. Wormser, and C. Hanquez, “Html5 local storage,” in HTML5 Solutions: Essential
Techniques for HTML5 Developers, pp. 281–303, Apress, 2011. 10.1007/978-1-4302-3387-9 11.
[119] “OpenStreetMap.” http://www.osm.org.
[120] “MapQuest.” http://www.mapquest.co.uk.
[121] “MyGeodata Converter.” http://mygeodata.eu/apps/converter/index_en.
html.
74

[122] D. Oehlman, S. Blanc, D. Oehlman, and S. Blanc, “Html5 storage apis,” in Pro Android
Web Apps, pp. 47–63, Apress, 2011. 10.1007/978-1-4302-3277-3 3.
[123] Ian Hickson (W3C), “Web SQL Database.” http://www.w3.org/TR/webdatabase/,2010. Accessed 29.10.2011.
[124] Web Hypertext Application Technology Working Group, “Web Workers,” in HTML,ch. 10, 2011.
[125] C. Gerard Gallant, “An Introduction to HTML5 Web Workers.” http://cggallant.
blogspot.com/2010/08/introduction-to-html-5-web-workers.html, 2011.
[126] C. Gerard Gallant, “A Deeper Look at HTML5 Web Workers.” http://cggallant.
blogspot.com/2010/08/deeper-look-at-html-5-web-workers.html, 2011.
[127] M. Casario, P. Elst, C. Brown, N. Wormser, C. Hanquez, M. Casario, P. Elst, C. Brown,N. Wormser, and C. Hanquez, “Html5 media elements: Audio and video,” in HTML5
Solutions: Essential Techniques for HTML5 Developers, pp. 97–136, Apress, 2011.
[128] Mozilla Foundation, “Using HTML5 audio and video.” https://developer.mozilla.org/En/Using_audio_and_video_in_Firefox, 2011.
[129] P. Lubbers, B. Albers, F. Salim, P. Lubbers, B. Albers, and F. Salim, “Working withhtml5 audio and video,” in Pro HTML5 Programming, pp. 65–86, Apress, 2010.
[130] Peter Gasston, “Making HTML5 Video work on An-droid phones.” http://www.broken-links.com/2010/07/08/
making-html5-video-work-on-android-phones/, 2010.
[131] “PagePlayer.” http://www.jezra.net/projects/pageplayer.
[132] “Simple Educational GIS.” https://github.com/meastp/
Simple-Educational-GIS.
[133] “Cartagen.” http://www.cartagen.org.
[134] “LeafletJS.” http://leaflet.cloudmade.org.
[135] “Leaflet and HTML5.” https://github.com/CloudMade/Leaflet/issues/368.
[136] “Leaflet on Mobile.” http://leaflet.cloudmade.com/examples/
mobile-example.html.
[137] “KothicJS.” https://github.com/kothic/kothic-js.
[138] “MapCSS.” http://www.mapcss.org.
[139] “mapnik.” http://mapnik.org/.
[140] “Tile5.” http://www.tile5.org.
[141] “Cloudmade.” http://www.cloudmade.com.
[142] “deCarta.” http://www.decarta.com.
75

[143] “jQTouch.” http://www.jqtouch.com.
[144] “jQuery Mobile.” http://www.jquerymobile.com.
[145] “Sencha Touch.” http://www.sencha.com/touch/.
[146] “Giscloud.” http://www.sencha.com/touch/.
[147] NetConstructor.com, “How to create vector polygons atthe same amazing speeds giscloud is able to renderthem?.” http://gis.stackexchange.com/questions/15240/
how-to-create-vector-polygons-at-the-same-amazing-speeds-giscloud-is-able-to-ren.
[148] L. Bass, P. Clements, and R. Kazmann, “Understanding Quality Attributes,” in Software
Architecture in Practice, ch. 4, second ed., 2009.
[149] L. Bass, P. Clements, and R. Kazmann, “Performance Tactics,” in Software Architecture
in Practice, ch. 5.4, second ed., 2009.
[150] Wikipedia, “Standard deviation.” http://en.wikipedia.org/wiki/Standard_
deviation, 2011. Accessed 03.12.2011.
[151] Wikipedia, “Normal distribution.” http://en.wikipedia.org/wiki/Normal_
distribution, 2011. Accessed 03.12.2011.
[152] Institutt for matematiske fag, NTNU, Tabeller og formler i statistikk. 2000.
[153] Ole Laursen, “flot - Attractive JavaScript plotting for jQuery.” http://code.google.
com/p/flot/, 2011. Accessed 03.12.2011.
[154] J. Nielsen, “Response Times: The 3 Important Limits,” in Usability Engineering, ch. 5,1993.
[155] F. F.-H. Nah, “A study on tolerable waiting time: how long are web users willing towait?,” Behviour & Information Technology, 2004.
[156] S. Okamoto and M. Kohana, “Load distribution by using web workers for a real-timeweb application,” in Proceedings of the 12th International Conference on Information
Integration and Web-based Applications & Services, iiWAS ’10, (New York, NY,USA), pp. 592–597, ACM, 2010.
[157] WHATWG, “HTML is the new HTML5.” http://blog.whatwg.org/
html-is-the-new-html5, 2011. Accessed 09.12.2011.
[158] WHATWG, “HTML.” http://www.whatwg.org/specs/web-apps/current-work/
multipage/, 2011. Accessed 09.12.2011.
[159] Alexander Larsson, “Gtk3 vs HTML5.” http://blogs.gnome.org/alexl/2010/11/
23/gtk3-vs-html5/, 2011. Accessed 18.12.2011.
[160] Alexander Larsson, “tag: gtk+.” http://blogs.gnome.org/alexl/category/
general/gtk/, 2011. Accessed 18.12.2011.
76

[161] “GTK+.” http://www.gtk.org/.
[162] “LibreOffice.” http://www.libreoffice.org/.
[163] Ryan Paul, “LibreOffice gaining momentum, heading to Android, iOS,and the Web.” http://arstechnica.com/open-source/news/2011/10/
libreoffice-gaining-momentum-heading-to-android-ios-and-the-web.
ars, 2011. Accessed 18.12.2011.
[164] “QT.” http://qt.nokia.com/.
[165] “Quantum GIS.” http://www.qgis.org/.
77


![[MS-HTML5]: Microsoft Edge / Internet Explorer HTML5 ......2.1.55 [HTML5] Section 4.9.5 The tbody element ..... 55 2.1.56 [HTML5] Section 4.9.8 The tr element..... 55 2.1.57 [HTML5]](https://static.fdocuments.net/doc/165x107/5fb29d840f1bb936bf5a22fb/ms-html5-microsoft-edge-internet-explorer-html5-2155-html5-section.jpg)


![HTML5 Semantics, Accessibility & Forms [Carsonified HTML5 Online Conference]](https://static.fdocuments.net/doc/165x107/54c70c8c4a79593f288b465a/html5-semantics-accessibility-forms-carsonified-html5-online-conference.jpg)


![[HTML5 CONVERSION] BEST HTML5 TEMPLATES TO INSPIRE YOU](https://static.fdocuments.net/doc/165x107/548cfd0eb47959e70c8b6512/html5-conversion-best-html5-templates-to-inspire-you.jpg)
