EXPLORING THE EFFECTS OF TIME LIMIT AND DISCOUNT SIZE …
160
EXPLORING THE EFFECTS OF TIME LIMIT AND DISCOUNT SIZE ON SALES PROMOTION EFFECTIVENESS: THE ROLES OF BRAND EQUITY AND PERCEIVED LUXURIOUSNESS A THESIS SUBMITTED TO THE GRADUATE SCHOOL OF SOCIAL SCIENCES OF MIDDLE EAST TECHNICAL UNIVERSITY BY EDA CEREN GÜNGÖR IN PARTIAL FULFILLMENT OF THE REQUIREMENTS FOR THE DEGREE OF MASTER OF BUSINESS ADMINISTRATION IN THE DEPARTMENT OF BUSINESS ADMINISTRATION DECEMBER 2019
Transcript of EXPLORING THE EFFECTS OF TIME LIMIT AND DISCOUNT SIZE …

EXPLORING THE EFFECTS OF TIME LIMIT AND DISCOUNT SIZE ON
SALES PROMOTION EFFECTIVENESS: THE ROLES OF BRAND EQUITY
AND PERCEIVED LUXURIOUSNESS
A THESIS SUBMITTED TO
THE GRADUATE SCHOOL OF SOCIAL SCIENCES
OF
MIDDLE EAST TECHNICAL UNIVERSITY
BY
EDA CEREN GÜNGÖR
IN PARTIAL FULFILLMENT OF THE REQUIREMENTS
FOR
THE DEGREE OF MASTER OF BUSINESS ADMINISTRATION
IN
THE DEPARTMENT OF BUSINESS ADMINISTRATION
DECEMBER 2019


Approval of the Graduate School of Social Sciences
Prof. Dr. Yaşar Kondakçı
Director
I certify that this thesis satisfies all the requirements as a thesis for the degree of
Master of Business Administration.
Prof. Dr. Nuray Güner
Head of Department
This is to certify that we have read this thesis and that in our opinion it is fully
adequate, in scope and quality, as a thesis for the degree of Master of Business
Administration.
Prof. Dr. Cengiz Yılmaz
Supervisor
Examining Committee Members
Assoc. Prof. Dr. Berna Tarı Kasnakoğlu (TOBB ETU, İŞL)
Prof. Dr. Cengiz Yılmaz (METU, BA)
Assist. Prof. Dr. Forrest Watson (METU, BA)


iii
PLAGIARISM
I hereby declare that all information in this document has been obtained and
presented in accordance with academic rules and ethical conduct. I also declare
that, as required by these rules and conduct, I have fully cited and referenced all
material and results that are not original to this work.
Name, Last Name : Eda Ceren Güngör
Signature :

iv
ABSTRACT
EXPLORING THE EFFECTS OF TIME LIMIT AND DISCOUNT SIZE ON
SALES PROMOTION EFFECTIVENESS: THE ROLES OF BRAND EQUITY
AND PERCEIVED LUXURIOUSNESS
Güngör, Eda Ceren
MBA, Department of Business Administration
Supervisor: Prof. Dr. Cengiz Yılmaz
December 2019, 140 pages
The aim of this thesis is to explore the effects of time constraint and discount size on
the effectiveness of sales promotions and to discuss the role of perceived brand equity
and perceived luxuriousness on those effects.
The research data were collected through randomly submitting 12 different offers
about laptops to 411 participants who are active computer users. For the analysis of
the data, various methods including exploratory factor analysis (EFA), independent t-
test, Mann-Whitney U test, Kruskal Wallis test, and Factorial ANOVA were used. As
a result of the analyses, it was seen that the discount applied to the same product type
of two different brands had different effects, and the difference between products of
two brands was analyzed regarding consumers’ purchasing behavior in terms of their
brand equity and luxury perception. It was also concluded that the time constraint and
the size of the discount influenced the consumer's willingness to purchase a product
on sale. When those effects are compared in terms of the brands, the effect of discount
size varies for two different brands but the effect of time constraint on the customer's
willingness to purchase does not change depending on the brand.
v
Previously, brand equity, perceived luxuriousness, discount size, and time constraint
have been discussed in previous marketing researches in terms of the effectiveness of
sales promotions. When these factors are taken into consideration as a whole, it can
be said that this study offers a new approach.
Keywords: Time-Limited Promotions, Discount Size, Brand Equity, Luxury
Perception, Purchase Intention

vi
ÖZ
SATIŞ PROMOSYONLARININ ETKİNLİĞİNİN İNCELENMESİNDE ZAMAN
KISITI VE İNDİRİM ORANININ ETKİSİ: MARKA DEĞERİ VE ALGILANAN
LÜKSLÜĞÜN ROLÜ
Güngör, Eda Ceren
Yüksek Lisans, İşletme Bölümü
Tez Yöneticisi: Prof. Dr. Cengiz Yılmaz
Aralık 2019, 140 sayfa
Bu tezin amacı, zaman kısıtı ve indirim büyüklüğünün satış promosyonlarının
etkinliği üzerindeki etkisini keşfetmek ve algılanan marka değeri ile algılanan
lükslüğün bu etkiler üzerindeki rolünü tartışmaktır.
Araştırma verisi, indirim uygulanan dizüstü bilgisayarlarla ilgili 12 farklı teklifin
anket aracılığıyla aktif bilgisayar kullanıcısı toplamda 411 katılımcıya rasgele
sunulmasıyla toplanmıştır. Bu verinin analizi için açımlayıcı faktör analizi (AFA),
Mann-Whitney U testi, Kruskal Wallis testi ve faktöriyel varyans analizinin de
aralarında bulunduğu çeşitli yöntemler kullanılmıştır. Yapılan analizler sonucunda,
iki farklı markanın aynı ürün çeşidine uygulanan indirimin farklı etkiler yarattığı
görülmüş, marka değeri ve lükslük algısı açısından aralarında fark bulunan bu iki
marka ürüne uygulanan indirimin tüketicinin satın alma isteğinde oluşan fark
karşılaştırılmıştır. Ayrıca, zaman kısıtının ve indirim büyüklüğünün tüketicinin
indirimdeki bir ürünü satın alma isteğini etkilediği sonucuna ulaşılmıştır. Bu etkiler
markalar hesaba katılarak karşılaştırıldığında ise, indirim büyüklüğünün etkisi iki
farklı marka için değişiklik gösterirken, zaman kısıtının müşterinin satın alma isteğine
olan etkisinde markaya bağlı olarak bir değişiklik ortaya çıkmadığı görülmüştür.

vii
Bu araştırmanın bugüne kadar yapılmış benzer çalışmalara bir katkı niteliğinde
olduğu ve satış promosyonlarının etkinliği konusunda daha önce defalarca ayrı ayrı
ele alınmış faktörlerin birlikte ele alındığında ne şekilde etkiler oluşacağı konusunda
bir yol gösterici niteliğinde olacağı söylenebilir.
Anahtar Kelimeler: Zaman Kısıtlamalı Promosyonlar, İndirim Büyüklüğü, Marka
Değeri, Lüks Algısı, Satın Alma Niyeti

viii
DEDICATION
To my family

ix
ACKNOWLEDGMENTS
Firstly, I would like to thank my dear advisor Prof. Dr. Cengiz Yılmaz for his
invaluable support and contributions to the development of ideas for this thesis. I
would like to extend my gratitude to thesis jury members, Assoc. Prof. Dr. Berna Tarı
Kasnakoğlu and Assist. Prof. Dr. Forrest Watson for their precious comments and
advice.
I would like to thank professors who taught me during the years I spent at Middle East
Technical University. I am very grateful to the Mathematics Department giving me
an analytical approach to life and the Business Administration Department broadening
my horizon teaching how to use that perspective in business life.
I would like to thank Merve Asiler, my first university friend who always stand next
to me as my close friend during the most important years of my life. In addition, I
would particularly like to extend my appreciation to Merve Biroğlu, who was with me
at every stage of the thesis-writing period and has always given me moral support.
Moreover, Pelin Çetin and Mutlu Önen deserve special thanks for encouraging me
with precious support. Lastly, I would like to thank my managers in TÜBİTAK since
they facilitated my MBA process.
Finally, yet importantly, my family deserves the greatest thanks. I would like to
express my endless appreciation to my father Güner Haluk Güngör and my mother
Atiye Güngör, who always believed that I would succeed, and supported me to
achieve my goals and to work hard. And, I also thank my sister and best friend Seda
Güngör being there for me at every important moment in my life and never left me
alone.

x
TABLE OF CONTENTS
PLAGIARISM ........................................................................................................... iii
ABSTRACT ............................................................................................................... iv
ÖZ...... ......................................................................................................................... vi
DEDICATION ......................................................................................................... viii
ACKNOWLEDGMENTS .......................................................................................... ix
TABLE OF CONTENTS ............................................................................................ x
LIST OF TABLES ................................................................................................... xiv
LIST OF FIGURES ................................................................................................. xvii
CHAPTER
LIST OF ABBREVIATIONS ................................................................................ xviii
1. INTRODUCTION ................................................................................................... 1
2. LITERATURE REVIEW ........................................................................................ 5
2.1. Sales Promotions .............................................................................................. 5
2.1.1. Promotion Techniques ............................................................................... 6
2.1.2. Price Discount ............................................................................................ 8
2.2. Time-Limited Promotions .............................................................................. 10
2.2.1. Time-Limited Promotions of Short Duration .......................................... 10
2.2.2. Time-Limited Promotions of Long Duration ........................................... 11
2.2.3. Time-Independent Promotions................................................................. 11
2.2.4. Effects of Time-Limited Promotions to Customer .................................. 12

xi
2.3. Brand Equity ................................................................................................... 13
2.4. The Concept of Luxury .................................................................................. 18
3. RESEARCH DESIGN AND METHODOLOGY ................................................ 20
3.1. Variables of the Study .................................................................................... 20
3.1.1. Independent Variables ............................................................................. 20
3.1.1.1. Perceived Brand Equity ..................................................................... 21
3.1.1.2. Perceived Luxuriousness ................................................................... 21
3.1.1.3. Time Constraint ................................................................................. 21
3.1.1.4. Discount Size .................................................................................... 22
3.1.2. Dependent Variable ................................................................................. 22
3.2. Hypotheses ..................................................................................................... 22
3.2.1. Effect of Brand on Purchasing Decision of a Product on Discount......... 23
3.2.2. Effect of Discount Size on Purchasing Decision of a Product on
Discount ............................................................................................................. 24
3.2.3. Effect of Time Constraint on Purchasing Decision of a Product on
Discount ............................................................................................................. 24
3.2.4. Composite Effect of Time-Limit and Discount Size Factors on
Purchasing Decision .......................................................................................... 24
3.3. Survey Design ................................................................................................ 25
3.3.1. Demographic Information Form .............................................................. 27
3.3.2. Measurements for Brands ........................................................................ 27
3.3.2.1. Perceived Brand Equity Measurement .............................................. 28
3.3.2.2. Perceived Luxuriousness Measurement ............................................ 31
3.3.3. Measurement for Offers ........................................................................... 33

xii
3.4. Participants and Data Collection .................................................................... 36
4. ANALYSES AND RESULTS .............................................................................. 38
4.1. Data Screening and Cleaning ......................................................................... 38
4.2. Descriptive Statistics ...................................................................................... 40
4.3. Tests of Normality .......................................................................................... 44
4.3.1. Perceived Brand Equity Scale .................................................................. 45
4.3.2. Perceived Luxuriousness Scale ................................................................ 48
4.3.3. Willingness to Purchase Scale ................................................................. 49
4.4. Exploratory Factor Analysis ........................................................................... 58
4.4.1. Perceived Brand Equity Scale .................................................................. 58
4.4.2. Perceived Luxuriousness Scale ................................................................ 60
4.4.3. Willingness to Purchase Scale ................................................................. 62
4.5. Reliability Analysis ........................................................................................ 63
4.5.1. Perceived Brand Equity Scale .................................................................. 63
4.5.2. Perceived Luxuriousness Scale ................................................................ 64
4.5.3. Scale for Willingness to Purchase............................................................ 64
4.6. Analyses.......................................................................................................... 65
4.6.1. Perceived Brand Equity ........................................................................... 65
4.6.2. Perceived Luxuriousness ......................................................................... 67
4.6.3. Willingness to Purchase ........................................................................... 68
4.6.3.1. Impact of Brand on Willingness to Purchase .................................... 68
4.6.3.2. Impact of Discount Size on Willingness to Purchase ....................... 69
4.6.3.3. Impact of Time Restriction on Willingness to Purchase ................... 71
4.6.3.4. Impact of the Composite Factor on Willingness to Purchase ........... 72

xiii
4.7. Results ............................................................................................................ 80
5. DISCUSSION AND CONCLUSION ................................................................... 85
5.1. Discussion of the Results................................................................................ 85
5.2. Contributions of the Study.............................................................................. 91
5.3. Limitations ...................................................................................................... 94
5.4. Suggestions for Future Research .................................................................... 97
REFERENCES .......................................................................................................... 98
APPENDICES
A. APPROVAL OF METU HUMAN SUBJECTS ETHICS COMMITTEE ........ 109
B. QUESTIONNAIRES IN ENGLISH .................................................................. 110
C. QUESTIONNAIRES IN TURKISH / TÜRKÇE ANKETLER ......................... 117
D. TURKISH SUMMARY / TÜRKÇE ÖZET....................................................... 124
E. TEZ İZİN FORMU / THESIS PERMISSION FORM ....................................... 140

xiv
LIST OF TABLES
Table 3.1 Questionnaire Types .................................................................................. 26
Table 3.2 Scale Used in Questionnaires for Perceived Brand Equity ...................... 29
Table 3.3 Scale Used in Questionnaires for Perceived Luxuriousness ..................... 32
Table 3.4 Scale Used in Questionnaires for Willingness to Purchase ...................... 35
Table 3.5 Number of Questionnaires Completed for Apple ...................................... 37
Table 3.6 Number of Questionnaires Completed for HP .......................................... 37
Table 4.1 The Highest Level of Education Completed * Age .................................... 39
Table 4.2 Age Characteristics of the Participants .................................................... 40
Table 4.3 Gender Characteristics of the Participants .............................................. 40
Table 4.4 Marital Status of the Participants ............................................................. 41
Table 4.5 Education Status of the Participants ......................................................... 42
Table 4.6 Working Status of the Participants ........................................................... 43
Table 4.7 Income Status of the Participants ............................................................. 44
Table 4.8 Test of Normality of Errors for Brands with respect to Perceived
Brand Equity ............................................................................................................. 46
Table 4.9 Test of Normality of Errors for Brands with respect to Perceived
Luxuriousness ............................................................................................................ 48
Table 4.10 Test of Normality of Errors for Brands with respect to Willingness to
Purchase .................................................................................................................... 49
Table 4.11 Test of Normality of Errors for Discount Size with respect to
Willingness to Purchase ............................................................................................ 50
Table 4.12 Test of Normality of Errors for Time Limitation with respect to
Willingness to Purchase ............................................................................................ 52

xv
Table 4.13 Descriptive for Six Cases for Brand Apple Separately with respect to
Willingness to Purchase ............................................................................................ 54
Table 4.14 Test of Normality of Errors for 6 Cases for Brand Apple Separately
with respect to Willingness to Purchase ................................................................... 55
Table 4.15 Descriptive for Six Cases for Brand HP Separately with respect to
Willingness to Purchase ............................................................................................ 56
Table 4.16 Test of Normality of Errors for 6 Cases for Brand Apple Separately
with respect to Willingness to Purchase ................................................................... 57
Table 4.17 Exploratory Factor Analysis for Perceived Brand Equity ...................... 59
Table 4.18 Exploratory Factor Analysis for Perceived Luxuriousness .................... 61
Table 4.19 Exploratory Factor Analysis for Willingness to Purchase ..................... 62
Table 4.20 Reliability Analysis for Brand Equity Factors ........................................ 63
Table 4.21 Reliability Analysis for Perceived Luxuriousness ................................... 64
Table 4.22 Reliability Analysis for Willingness to Purchase Factor ........................ 64
Table 4.23 Independent t-test for Brand's Effect on Perceived Brand Equity .......... 66
Table 4.24 Mann-Whitney U Test for Brand's Effect on Perceived Luxuriousness .. 67
Table 4.25 Mann-Whitney U Test for Brand's Effect on Willingness to Purchase ... 69
Table 4.26 Mann-Whitney U Test for Discount Size's Effect on Willingness to
Purchase .................................................................................................................... 70
Table 4.27 Kruskal Wallis Test for Time Constraint's Effect on Willingness to
Purchase .................................................................................................................... 71
Table 4.28 Tests of Between-Subjects Effects on Willingness to Purchase
(Factorial ANOVA) ................................................................................................... 73
Table 4.29 Factorial ANOVA Descriptive Statistics for the Composite of All
Factors with respect to Willingness to Purchase ...................................................... 74

xvi
Table 4.30 Factorial ANOVA Descriptive Statistics for Discount Size and Brand
Name with respect to Willingness to Purchase ......................................................... 75
Table 4.31 Factorial ANOVA Descriptive Statistics for Discount Size and Time
Constraint with respect to Willingness to Purchase ................................................. 77
Table 4.32 Factorial ANOVA Descriptive Statistics for Brand Name and Time
Constraint with respect to Willingness to Purchase ................................................. 79
Table 4.33 Evaluation of Hypotheses Regarding Analyses ....................................... 84

xvii
LIST OF FIGURES
Figure 2.1 Estimated marginal means of search intention ........................................ 13
Figure 3.1 Theoretical Framework ........................................................................... 23
Figure 4.1 Normal Q-Q Plot of Brand Equity for Apple .......................................... 47
Figure 4.2 Normal Q-Q Plot of Brand Equity for HP ............................................... 47
Figure 4.3 Estimated Marginal Means of Willingness to Purchase with respect to
Discount Size ............................................................................................................ 70
Figure 4.4 Estimated Marginal Means of Willingness to Purchase with respect to
Time Constraint ......................................................................................................... 72
Figure 4.5 Estimated Marginal Means of Willingness to Purchase with respect to
Brand and Discount Size ........................................................................................... 76
Figure 4.6 Estimated Marginal Means of Willingness to Purchase with respect to
Time Constraint and Discount Size ........................................................................... 78
Figure 4.7 Estimated Marginal Means of Willingness to Purchase with respect to
Brand and Time Constraint ....................................................................................... 80
Figure 5.1 Distribution of Questionnaires by Number ............................................. 95
Figure 5.2 The Final Distribution of Questionnaires by Number ............................. 96

xviii
LIST OF ABBREVIATIONS
ANOVA Analysis of Variance
df degrees of freedom
EFA Exploratory Factor Analysis
FMCG Fast Moving Consumer Goods
IT Information Technologies
KMO Kaiser- Meyer-Olkin
POS Point-of-Sale
SPSS Statistical Package for the Social Sciences

1
CHAPTER 1
1.INTRODUCTION
The aim of the present thesis is to explore and discuss the effects of the time limit and
discount size on sales promotion effectiveness and the role of brand equity and
perceived luxuriousness on those effects. Five hypotheses are determined to
understand those effects, and it is targeted to contribute to marketing literature by
examining the reliability of those hypotheses.
In previous studies, the effects of sales promotions on consumers’ purchasing
behaviors have been scrutinized many times (Blattberg, Briesch, & Fox, 1995).
However, it is aimed to understand whether those effects change when other factors
are included and if so, what types of changes occur. For the present study, 12 different
cases were designed, and 411 participants were randomly asked to answer the survey
questions to find an answer to the research question of the present thesis.
First of all, it is investigated that the brand effect of sales promotions on the customers’
purchasing intentions. While the brand effect is examined, the roles of brand equity
and perceived luxuriousness are evaluated. The brand equity and perceived
luxuriousness of two predetermined different brands are measured separately and the
purchasing behavior of consumers after sales promotion is observed. Apple and HP
were selected as laptop computer brands since Apple is the most valuable (Brand
Finance, 2019) and HP is the most preferred laptop brand (TrendForce, 2018, 2019).
Secondly, the role of the discount size of sales promotion on purchasing behavior is
explored. The purchasing behavior of consumers against two different discount sizes

2
is evaluated individually and their reactions are compared and it is tested whether the
difference between those is significant or not.
Thirdly, it is intended to set whether the time limit of the sales promotion, whose
effect on purchasing behavior was determined before, is important in the purchasing
decisions of consumers. Also, the question whether the application of time limit plays
a role in the behaviors of customers is answered.
Lastly, the combinations of three factors aforementioned above, brand, discount size,
and time-limit are examined and analyzed in groups consisting of two or three factors.
Moreover, the effect level of those factors is ranked according to their magnitude.
The present thesis mainly consists of five main chapters. In the first chapter,
Introduction, the purpose of the research is explained in detail while in the second
chapter, the previous studies, in which the marketing researchers discussed sales
promotions’ role in consumers’ purchasing behavior is reviewed. The concepts that
are used in the thesis are explained in the second chapter by referring to the significant
studies of marketing researchers. Briefly, the Literature Review chapter consists of
four headings. In the first part of the literature review, the term of sales promotions,
how it is defined is shown. The concerns of previous studies and the research
questions of researchers are summarized. The focus of the second part of the literature
review, as a sub-heading, is time-limited promotions. We intend to define what the
time-limited promotions are and the studies with the subject of time-limited
promotions are summarized and discussed. Furthermore, in the third chapter, we delve
into the term of brand equity and the studies with the concern of measuring techniques
of brand equity. In the last part of the literature review of this study, the main focus is
on the concept of luxury and its components. It is explored how marketers measured
the perceived luxuriousness of costumers within the scope of related literature.

3
The third chapter of the present study, Research Design and Methodology, starts with
the variables of the study after that the research objectives and hypotheses are
individually determined. To measure the aforementioned effects, the most preferred
research method is quantitative research design (Creswell, 2013). So, we also
preferred quantitative research design to answer our research question. Surveying is
one of the most preferred quantitative research technique as Babbie (1991), Fink
(1995), and Fowler (1992) guided. In the section of survey design, it is explained how
the factors are measured and why the measures are used in each part of the
questionnaires. The questionnaire types and questions used in the field of marketing
are introduced to the reader. Lastly, the profile of the questionnaire participants is
clarified and how research has been conducted is told in detail.
The fourth chapter, Analyses and Results, comprises the analyses and results of the
thesis. Firstly, the data screening and cleaning phase is conveyed to the reader in
detail. The scale of the collected data set and analysis tools are told consequently.
With the help of descriptive statistics, the demographic profile of participants is
expressed. Later on, in the phase of pre-analysis, the tests of normality and reliability
are applied. In the process of measuring the reliability of each scale, exploratory factor
analysis for each is implemented. Furthermore, the reliability of each scale is
evaluated with the method of Cronbach’s Alpha. By taking into consideration the
results of pre-analysis, the accuracy of the definitions in the hypotheses is tested. The
results are shared with the readers by implementing the tests such as Independent t-
test, Mann-Whitney U Test, Kruskal Wallis Test, and Factorial ANOVA. Their results
are summarized in the section of Findings.
In the chapter of Discussion and Conclusion, the limitations confronted during the
analysis and the impediments which prevent the present study from being ideal are
presented. The results of the analysis are compared with the previous studies. While

4
evaluating the contributions of the present study to marketing literature, the
significance of the thesis for the market players is emphasized. Lastly, the
implications which are useful in the field according to the results of the analysis is
provided to market actors.

5
CHAPTER 2
2.LITERATURE REVIEW
2.1. Sales Promotions
Kotler and Armstrong (2017) defined sales promotions as “short-term incentives to
encourage the purchase or sales of a product or a service” (p. 496). They also asserted
that sales promotion is a tool of inducement that arouses the interest of the customer
to a product or a service in order to make him/her buy it (2017). According to Kotler
and Keller (2016), the main three advantages of sales promotions are (1) sales
promotions call the attention of the customer to the product, (2) procure
encouragement which attributes value to the customer and (3) persuade the customer
to attend shopping (p. 254).
It will be good to compare promotions and advertising at this point. Kotler and Keller
(2016) claimed that promotion suggests an incentive where advertising suggests a
reason to purchase a product for a customer. In other words, advertising tells the
customer why s/he should buy the product, on the other hand, promotion encourages
the customer to take action (Kotler & Keller, 2016, p. 265). Similarly, Kotler and
Armstrong (2017) stated that “Whereas advertising offers reasons to buy a product or
service, sales promotion offers reasons to buy now.” (p. 496).
The effects of sales promotions to purchase intent of costumer have been studied over
the years. Gupta’s research in 1988 indicated a positive effect of sales promotions to
customer actions. After about 30 years from Gupta’s findings, Alvarez and Casielles
came to a similar conclusion in their study (2005). Thereafter; Santini, Sampaio,
Perin, and Vieira (2015) studied this issue and they found that price discount increases

6
the purchase intent of the customer. In light of all these researches, it is obvious that
one of the essential components to increase the buying intention of customers is sales
promotions (Blattberg & Neslin, 1990).
Additionally, if we look at the emotional effects of promotions, it can be seen that the
emotions in the customer differ when the customer buys a promoted product. The
consumer may have positive or negative feelings such as being satisfied or feeling
unhappy due to a product that is on sale at a discount: S/he can feel appreciation and
gratitude to the brand and the product, and s/he can feel confident inward. Conversely,
there may be negative effects such as feeling angry and insecure against the brand and
product, and internally self-doubt (Honea & Dahl, 2005).
In addition to these reactions created by sales promotion in the buying behavior of the
consumer, there may be cases where sales promotion has no effect on the purchase
intention of the customer. Some customers are not interested in the promotion
whatever its type or size if the discounted product is not in the “brand preferred set”
(Clow & Baack, 2018).
2.1.1. Promotion Techniques
Monetary sales promotions were defined as promotions providing money-saving
advantage for a customer (Sinha & Verma, 2017). Although nonmonetary promotions
provide more relational benefits between consumer and brand than monetary
promotions (Mussol, Aurier, Lanauze, 2019), the opposite is true when it comes to
increasing sales, according to Makienko (2006). Monetary promotions increase the
consumer's willingness to purchase even more when the price of the product is first
increased and then promoted, compared to the non-promoted normal priced product.
Nevertheless, this is not the case when a nonmonetary promotion is applied. The

7
consumer's intent to purchase does not change due to the promotion and the consumer
prefers the normal priced product to the nonmonetary promotional higher-priced
product (Makienko, 2006).
Additionally, Eisenbeiss, Wilken, Skiera, and Cornelissen (2015) measured the effect
of discount level and time constraint on the intention of buying due to sales promotion
in their study by applying the DoD (Deal of the Day) concept. During this research,
they carried out several studies on two different product types and obtained different
results depending on whether the product type is utilitarian and hedonic. For hedonic
products, the time constraint is more effective than discount size to increase
willingness to purchase, while it is not the case for utilitarian products. In the case of
a discount applied to a utilitarian product, the effect of the discount size was found to
be greater than the effect of time constraint in terms of increasing willingness to
purchase (Eisenbeiss, Wilken, Skiera, & Cornelissen, 2015).
Another study investigating the effects of monetary and nonmonetary promotions on
the willingness to buy was made by Roll and Pfeiffer (2017). This study was
conducted on two types of products: utilitarian and hedonic. The cold remedy was
chosen as the utilitarian product and a flower bouquet was selected as a hedonic
product. The effects of price discounts and free gifts on these two products were
compared. Hence, the free gift has been found to be more effective in increasing
consumer intention to purchase. Furthermore, Chandon, Wansink, and Laurent (2000)
conducted a similar study, in which a third dimension was also discussed compared
to the previous studies. In this study, the effects of monetary and nonmonetary
promotions applied to utilitarian and hedonic products were examined separately for
the high-equity and low-equity brands. Nonmonetary promotions were found to be
more effective in hedonic products for both brand equity levels. On the other hand,
while monetary promotion significantly increased the sales of hedonic products with
low-equity brands, the same was not the case for high-equity brands. When the

8
promotions were applied for high-equity brands, although monetary promotions
considerably increased the purchase intention of the utilitarian product, for the
hedonic product, purchase intention reduced (Chandon, Wansink, & Laurent, 2000).
Another research that compares the effects of monetary and nonmonetary promotions
through price discounts and free gifts belongs to Manalel, Jose, and Zachairas (2007).
When we look at their research, we see that if we compare price discounts with free
gifts, a price discount increases the customer's intent to buy the product more than a
free gift. All of the above-mentioned studies have shown that price discount is
generally preferred over other promotion types. Therefore, the price discount is worth
considering specifically.
2.1.2. Price Discount
Shi, Cheung, and Prendergast (2005) studied different sales promotion types and they
measured their effects to purchase intent separately. In this research, they asserted
price discounts are simple, ordinary, and most understandable techniques (Shi,
Cheung & Prendergast, 2005).
In the past, a lot of research on price discounts have been conducted. In those studies,
the different ways of applying price discounts were evaluated and the effects of those
methods on consumer buying behavior were compared. For example, Woodside and
Waddle (1975) conducted a study on the implementation of price promotion as point-
of-sale (POS). The results of this study showed that the POS technique has much more
positive impact on the customer's intention to purchase, and increased this demand
more than twice as compared to other techniques (Woodside & Waddle, 1975).

9
Moreover, Howell, Lee, and Allenby (2015) compared effects of the price promotion
applied in three different conditions in their empirical study: (1) applying an
unconditional discount to the product, (2) limiting the number of products that can be
utilized from the discounted product, and (3) applying the discount only if the
purchase is above a certain number. When the discount is made without any
conditions, the sale of the product has increased considerably. In the case where a
certain number of discounted products are allowed to be purchased, it has also
generated a high purchase intent, similar to the first case. On the other hand, the
increase in the purchase intention of the customers who can benefit from the discount
after deciding to buy more than a certain amount has not been as high as in other cases
(Howell, Lee, & Allenby, 2015).
Similarly, Akaichi, Nayga, and Gil (2015) conducted another study in which the effect
of a discount limited to the amount was measured. In this empirical study, when the
size of the discount varied according to the quantity of the product, the consumer's
response was measured and these two situations were compared. In the first case, a
20% discount was applied to the total amount provided that three products were
purchased; in the second case, if three products were purchased, 10% discount for the
second product and 20% discount for the third product were applied. The results of
the study showed that applying a fixed size of discount for all parts increased the
customer's willingness to purchase more, as the number of purchased parts increased,
instead of increasing the discount size per piece (Akaichi, Nayga, & Gil, 2015).
Furthermore, Gong, Huang, and Goh (2019), in their study, observed the effect of
double discount and measured whether the order of offering discounts made a
significant difference in the consumer's willingness to purchase. The results of the
study showed that the order of offering discounts made a significant difference on the
purchase intention of customers. They applied a 10% and a 40% discount on the
product, with ascending (firstly 10% and secondly 40%) and descending order (firstly

10
40% and secondly 10%) both. As a result, the ascending order was more effective
than the descending order. (Gong, Huang, & Goh, 2019).
2.2. Time-Limited Promotions
The time limit was defined by Teng and Huang (2007) as “the time available for a
consumer to use a promotion.”, and at the end of the time, a time-limited promotion
becomes unavailable. These promotions are beneficial in the provided time interval
and because of that, it is worth to search the effects of time-limited promotions on
consumer behavior (Teng & Huang, 2007).
Time-limited promotions can be short, long or limitless in terms of their durations,
additionally, a promotion may not have a time-limit.
2.2.1. Time-Limited Promotions of Short Duration
Aggarwal and Vaidyanathan defined promotions of short duration as promotions that
are usable for a week or less (2002). Online coupons, store coupons, and price cuts
can be an example of time-limited promotions of short duration. Aggarwal and
Vaidyanathan asserted that these promotions stimulate the customer to buy the
product in an instant (2002). Compared to long-term promotions, customers have less
time to think and decide about the offer. In fact, it will be much more difficult to
decide if the time is limited to a few hours. Customers may see the promotion as an
inevitable opportunity due to time constraints and may wish to take advantage of it.
Therefore, short-term promotions can put more pressure on the customer than long-
term and time-independent promotions.

11
According to Kotler and Keller (2016), sales promotions are useful for short-terms
mainly (p. 246). In addition, Teng and Huang (2007) proclaimed that time constraint
allows customers to connect more to promotions and want to use them more. As a
result, customers face the "use it or lose it" dilemma. The customer either has chosen
to use the discount offered within the specified time period or have missed the
opportunity (Teng & Huang, 2007). Therefore, in addition to benefiting from the
discount opportunity providing the consumer with monetary savings, the consumer
may also want to avoid the bad effect of missing the offered opportunity (Van Putten,
Zeelenberg, & Van Dijk, 2013). When one misses the discount, s/he has nothing to do
but wait for another opportunity or postpones the purchasing. For this reason, time
constraint has a positive effect on the willingness to buy.
2.2.2. Time-Limited Promotions of Long Duration
Considering Aggarwal and Vaidyanathan's (2002) definition of short-term
promotions, the promotions longer than a week can be called long-term promotions.
This type of promotion gives customers more time to decide to buy or not to buy.
Hence, customers who encounter such promotions may be more comfortable. On the
other hand, they may have more time to conclude with not benefitting from the
promotion. Therefore, these promotions provided for a long time may also diminish
the customer's interest in the promotion and product.
2.2.3. Time-Independent Promotions
Aggarwal and Vaidyanathan (2002) coined the term of time-independent promotions
for those lasting one month or longer. All promotions are somehow limited since the
time eventually ends. Although the name of these promotions is time-independent,
they also have a duration that is not needed to be taken into account.

12
2.2.4. Effects of Time-Limited Promotions to Customer
It is possible that some of the customers who go to the stores for discounts may be
visiting these stores for the first time just for the provided discounts. Those who have
not tried a product of that brand before can find the opportunity to try it thanks to the
promotion. In fact, that store would be a new address for potential customers. As
stated in Morrison’s article, Chapman says that “Limited-time offers to help the goal
of always having news - it keeps a brand at the forefront of the consumers’ minds.”
(Morrison, 2014). Time-limited promotions end up with customer loyalty and new
potential customers for companies that use them.
As it can be seen in Figure 2.1, the results of Devlin’s (2007) research showed that
when a discount is not specified with an offer, the time-limited offers bring higher
search intention compared to the non-time-limited offers. On the other hand, when
there is a discount with low size, a time-limited offer causes lower search intention
compared to an offer with a higher discount. When the research is conducted by
applying an offer of discount with a high rate, search intention does not differ
depending on the time-limit.

13
Figure 2.1 Estimated marginal means of search intention
Reprinted from “A Study of Time Limited Price Promotions” by J. Devlin, C.
Ennew, S. McKechnie, and A. Smith, 2007, Journal of Product & Brand
Management 16(4), p. 283.
According to Zamir (2014), promotions with a time limit are more effective than
promotions without a time limit. This is related to consumer psychology. People have
a tendency to buy scarce products (Lynn, 1991). If there is a limited time that a product
can be purchased at a discount, it seems more impressive to buy it (Zamir, 2014). For
example, according to the research of Dhal and Nowlis (1999), when there is time
pressure, customers tend to accept the offer rather than postponing decision-making.
2.3. Brand Equity
Gilbert (2003) defined brand equity as the amount of money that customer consents
to pay for a product or service over its actual value and he termed it as price premium.
Similarly, according to Kotler and Keller (2012), brand equity can be defined as the
14
added value of a product or the service bestowed by customers. On the other hand,
Kotler and Armstrong (2017) stated that brand equity is the effect of creating a
difference in knowing the customer’s reaction in return for a brand’s name and its
marketing power.
Kotler and Keller (2016) also emphasized that brand equity is constituted by feelings,
thoughts, and behaviors of the customer about the brand and it is influenced by price,
market share, and profitability of the brand. When somebody approaches the brand
equity concept from a customer’s point of view, s/he can easily see that brand equity
is related to what customers see, read, hear, learn, think and feel about a brand in time
(Kotler & Keller, 2016).
Within years, marketers and scientists have approached many different perspectives
to brand equity as follows, the effects of brand equity regarding economic principles
(Erdem & Swait, 1998); the sociological, anthropological or biological reactions to
brand (McCracken, 2005); and the psychological response of customer to brand and
its marketing activity (Schmitt, 2012).
In addition to these approaches, Kamakura and Russell (1993) proclaimed that brand
equity can be seen in two different perspectives: Company and customer. When we
look from a company’s perspective, it can be easily seen that brand equity is the
financial value of the brand provided for the company (Kamakura & Russell, 1993).
Alternatively, on the customer side, brand equity is the value the brand provides to
the customer.
Furthermore, Keller (2012) described customer-based brand equity as an awareness
that is comprised when a brand is marketed. As stated by him, whether positive or
negative customer-based brand equity can be understood by looking how the

15
marketing of brands affects consumers in similar cases. According to him, if a
marketing action implemented to a brand makes that product preferable for customer
than another brand at a similar position, then it means that customer-based brand
equity of that brand is positively influenced (Keller, 2012). Consequently, customer-
based brand equity basically depends on customer response to marketing action about
the brand (Keller, 2012).
Customer-based brand equity constitutively consists of three different elements:
Firstly, changes in the reaction of consumer to marketing action is one of the
predictive factors of brand equity since at the moment when there is a lack of
difference in customer reaction to the marketing of the brand, the competition of the
product or service must continue at the monetary dimension. Secondly, changes in
attention, such as excitements, ideas in mind, acceptances, and judgments, in short,
brand knowledge, with reference to the brand are also important factors for brand
equity as brand knowledge impresses the forthcoming situation of the brand. Lastly,
changes in understandings, choices, and attitudes about the brand and its marketing
action affect brand equity of the product (Kotler & Keller, 2016).
According to Gilbert (2003), if prestigious brands, with their higher brand equity, are
directed and positioned well, they get feedback from their customers and they provide
a competitive advantage for their companies. Ailawadi, Lehmann, and Neslin (2003)
also stated that powerful brands earn more.
Kamakura and Russell (1993) regarded brand equity as perceived brand equity with
its impalpable constituents in addition to the palpable constituents. They handled
brand equity as customer-based brand equity from every specific consumer’s
viewpoint (Kamakura & Russell, 1993). With the effect of this approach; Lassar,
Mittal, and Sharma (1995) asserted that there are five main dimensions to measure
brand equity. Firstly, the performance dimension shows the quality perception of the

16
customer towards the brand and trust in the manufacturing of a product of the brand.
Secondly, social image is another important dimension for customer-based brand
equity. Whether a brand reflects the personality of the customer or it does not fit
him/her enough is a fact about the social image. More precisely, what customers think
and more importantly feel about a brand is important. Thirdly, the financial value of
the brand as a dimension refers to suitability about the pricing of products of the brand.
Are they worth the price they are labeled or are products mispriced (low-
priced/overpriced) and how does customer rate brand on his/her mind? It is worth to
be measured. Fourthly, trustworthiness as another dimension is more about people
and the company behind the brand. The image of a company affects this dimension
quietly. Lastly, the dimension of customer’s attachment to the brand is about loyalty
measurement. It is about the inner world of the customer, for example, personal
feelings towards the brand (Lassar, Mittal, & Sharma, 1995).
Furthermore, Clow and Baack (2014) categorized the measuring methods of brand
equity into four groups, namely monetary value, stock market value, revenue
premium, and customer value. According to their explanations, while calculating the
monetary value of a brand, marketers predicate on the net present financial value of
future estimated cash flows depending on the power of the brand. Differently, stock
market value is determined by stock valuation. On the other hand, revenue premium
is generally about the comparison of revenue gained by a particular product which is
labeled of a brand with revenue earned form similar products labeled of other brands.
Lastly and most importantly, customer value is determined by the interaction of a
customer with the brand. In other words, customer’s quality perception, intimacy,
pleasure, buying action about brand and readiness to search for alternatives are some
of the main factors. Financial numbers are not taken into consideration in the approach
of customer value (Clow & Baack, 2014). Therefore, we will use the customer value
approach to determine brand equity.

17
According to Lassar, Mittal, and Sharma (1995), measuring brand equity allows
companies to review their marketing campaigns. They can determine performance
problems with products, advertisements and positioning in the market thanks to their
study. Thus, they become aware of some changes that need to be made (Lassar, Mittal,
& Sharma).
Moreover, According to Keller (1993), customer-based brand equity can be
determined by using direct or indirect methods. Besides that, these two methods can
be applied separately or they can be used together. The indirect method is based on
measuring brand knowledge of the customer, evaluating a customer’s perception of
brand image. On the other hand, the direct method generally measures consumer’s
reactions to the brand and its marketing activities.
Martin and Brown (1990) worked on this issue and designed a scale for perceived
brand equity. They also used a 5-dimension scale and measured perceived quality,
perceived value, image, trustworthiness, and commitment of customers. A few years
later, Park and Srinivasan (1994), used product-based scales to measure brand equity.
In addition to these methods; Lassar, Mittal, and Sharma (1995) used a different
method with reference to the customer-based brand equity definition of Kamakura
and Russell (1993). Lassar, Mittal, and Sharma (1995), with the aim of improving past
studies, developed a new scale by making some changes on the scales used before.
They changed the dimension of quality with performance because the unknown
products of a brand cannot be precisely known by consumers despite other known
products’ experienced quality. On the other hand, performance, which is defined as
“beliefs about quality”, is more predictable for the customers who did not use the
product asked about (Brucks & Zeithaml, 1991). In addition, they changed
commitment in the Martin and Brown’s scale with an attachment and they defined it
as “the relative strength of a consumer’s positive feelings toward the brand” (Lassar,

18
Mittal, & Sharma, 1995). To sum up, Lassar, Mittal, and Sharma (1995) handled
customer-based brand equity in terms of five main dimensions, namely performance,
social image, (monetary) value, trustworthiness, and attachment. They determined
these factors after their pilot studies containing open-ended questions. In the first step,
they stated 83 items for the scale, after the second and the third turn of the pilot studies,
they finally reduced the number of items to 17.
2.4. The Concept of Luxury
Luxuriousness has been examined by many researchers that have been studying in
different fields of science over the years. In time, scientists with expertise in the fields
of philosophy, economics, sociology or psychology have been interested in the
concept of luxury in their researches and luxury has become the focus of the attention
of the management researchers (De Barnier, Falcy, & Valette-Florence, 2012).
How a luxury brand can be defined or established, as a question has been an attractive
topic over the years. Beverland (2006), for example, stated that luxuriousness consists
of six characteristics, namely “heritage and pedigree”, “stylistic consistency”, “quality
commitments”, “relationship to place”, “method of production”, and “downplaying
commercial motives”.
Many different scales have been developed in the literature in order to measure luxury
perception. To illustrate, as can be understood from De Barnier, Falcy, and Valette-
Florence’s (2012) study, with reference to Kapferer’s (1998) luxury structure;
Vickers, and Renand (2003) suggested a model composed of “creativity”, “renown”,
and “elitism” in order to measure luxury perception. Vigneron and Johnson (1999)
used a five-factor scale for measuring perceived luxuriousness. They tested “elitism”,
“uniqueness”, “quality”, “refinement”, and “power”. In 2001, Dubois, Laurent, and

19
Czellar discussed the concept of luxury perception over three features: “Distinction”,
“elitism”, and “hedonism” (De Barnier, Falcy, & Valette-Florence, 2012). Finally, De
Barnier, Falcy, and Valette-Florence brought these three scales together and used 5
types of products chosen from three levels of luxury brands. Those were accessible,
intermediate, and inaccessible luxury products. To sum up, it may be evaluated as
extensive research because of its range of products and brands.
At this point, it would be good to explain what accessible luxury is. Normally, luxury
refers to products that are both scarce and only a few people have the purchasing
power of those products (Nueno & Quelch, 1998). Brun and Castelli (2013) stated
that in the last century, the concept of the democratization of luxury emerged, and
products that were only available for a limited number of elites became available to
everyone. As a result, the term accessible luxury has emerged (Okonkwo, 2007;
Thomas, 2008). According to Guyon (as cited in Brun & Castelli, 2013), accessible
luxury products are relatively low-priced versions of enviable, special, and expensive
goods.

20
CHAPTER 3
3.RESEARCH DESIGN AND METHODOLOGY
3.1. Variables of the Study
Five variables consisting of four independent and one dependent were used for this
study. The independent variables are “perceived brand equity”, “perceived
luxuriousness”, “time constraint”, and “discount size” while the dependent variable is
“willingness to purchase”.
3.1.1. Independent Variables
There are four independent variables consisting of perceived brand equity, perceived
luxuriousness, time constraint, and lastly discount size to measure. Two of these
independent variables, perceived brand equity and perceived luxuriousness, were
measured separately for the two brands identified at the beginning of the study. These
brands were identified based on the results of some reports. Apple was selected
because according to Brand Finance Global Forum (2019), Apple is the most valuable
laptop brand. On the other hand, HP, which is another selected brand, is the most sold
laptop brand in the world in recent years (TrendForce, 2018, 2019).
The other two independent variables were determined at the beginning and presented
to the respondents through questionnaires. Three options for time constraint and two
options for discount size were designated.

21
3.1.1.1. Perceived Brand Equity
For perceived brand equity, the scale in section 3.3.2.1 will be used, and the perceived
brand equity of two different brands which are Apple MacBook Pro and HP Pavilion
will be measured and compared. Then, by using this comparison the effect of this
variable on dependent variables will be evaluated and it will be tested whether it is
significant or not.
3.1.1.2. Perceived Luxuriousness
For perceived luxuriousness, the scale in section 3.3.2.2 will be used and the
consumer's perception of luxury created by two different brands (Apple MacBook Pro
and HP Pavilion in our case) will be measured and compared. Then, by using this
comparison, the effect of this variable on dependent variables will be evaluated and it
will be tested whether its effect is significant or not.
3.1.1.3. Time Constraint
This variable is defined in the beginning of the research and is indicated before the
offer is submitted to the consumer via questionnaire. When submitting the offer, the
time limit indicating the validity period of the proposal is explained by the sentences
such as “The discount is limited to one day only.”, “The discount will last three days.”
or the offer does not contain a statement about the duration. In other words, the offers
submitted are available for 1 day, available for 3 days or indefinitely. The dependent
variables, which are measured according to the answers given against the offers
submitted, will be evaluated on the basis of the x independent variable and necessary
tests will be performed.

22
3.1.1.4. Discount Size
The discount size is defined in the beginning of the survey and is indicated before the
offer is submitted to participants via questionnaires. Participants received an offer
with a discount size of 40% or 10%. The decisions of the participants regarding the
offers which are measured through dependent variables will be evaluated and tested
to see if the discount size on these decisions creates a significant change.
3.1.2. Dependent Variable
We have only one dependent variable which is the willingness to purchase to measure.
The willingness to purchase the product under the conditions presented in an offer
submitted to the consumer is measured through the scale in section 3.3.3.1. It is aimed
to measure the consumer's willingness to buy in response to the offers and to observe
whether significant effects occur as a result of the differences in independent
variables.
3.2. Hypotheses
There have been many studies exploring the effects of sales promotions on customer
purchasing behavior with different points of view (Alvarez & Casielles, 2005; Schultz
& Block, 2014; Soni & Verghese, 2018). In the present study, the effects of sales
promotions on willingness to purchase are investigated by considering three factors;
brand, time constraint, and discount size, individually and collectively. With such an
aim, five hypotheses are formed in the present study.

23
Figure 3.1 Theoretical Framework
3.2.1. Effect of Brand on Purchasing Decision of a Product on Discount
In this section, the role of the brand in evaluating the sales promotions effect on
customer purchasing behaviors is shown. In hypothesis H1, how customer behavior is
affected when the same type of sale promotion is applied to two different brands is
analyzed. For instance, it is targeted to see the reaction of the customers when they
are subject to the same discount for different brands in the same product band.
H1a: A discount applied to a higher-equity brand increases the consumer’s intention
to buy more compared with another brand.
H1b: A discount applied to a more luxurious brand increases the consumer’s intention
to buy more compared with another brand.

24
3.2.2. Effect of Discount Size on Purchasing Decision of a Product on
Discount
In this section, we analyzed the effect of the discount size on consumer purchasing
behavior. The results of predetermined discount sizes are compared to each other to
detect the accuracy of the hypothesis.
H2: The discount size influences the consumer’s purchasing behavior positively.
3.2.3. Effect of Time Constraint on Purchasing Decision of a Product on
Discount
In that section, the effect of time constraint on the consumer’s purchasing decision of
a product on discount is analyzed. We intend to measure whether the time of the
provided promotions affects the purchasing decisions of customers. We desire to
understand whether time constraint increases or decreases the purchasing intentions
of consumers.
H3: The effect of sales promotion on purchase intention differs with respect to the
time-limit of the promotion.
3.2.4. Composite Effect of Time-Limit and Discount Size Factors on
Purchasing Decision
In this section, the composite effect of time restriction and discount size on
willingness to purchase a product on a sale. We proposed hypothesis H4 in order to

25
investigate the effects of two dimensions, which are discount size and time effect, on
costumers’ purchasing behavior.
H4: The discount size has different effects on a consumer’s purchase intention of a
product on time-limited and time-independent discounts.
3.3. Survey Design
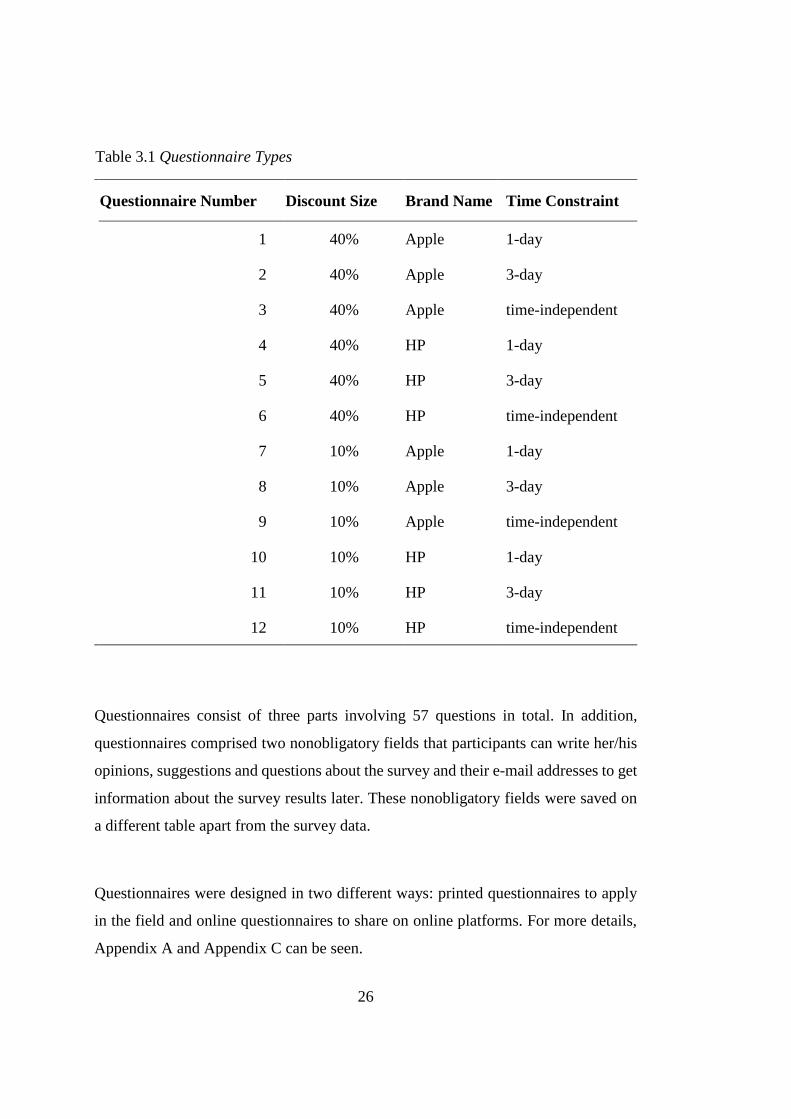
We prepared 12 different questionnaires using the same questions. Questionnaires
were numbered from 1 to 12 and two brands were used in questionnaires. The
questionnaires consist of three parts. The first part contains the demographic
information form and the same questions were used for all questionnaires. The second
part of the questionnaire was applied for two brands, namely Apple and HP. Besides,
questions were prepared for Apple in questionnaires 1, 2, 3, 7, 8, and 9; questionnaires
numbered as 4, 5, 6, 10, 11, and 12 were prepared for HP.
On the other hand, the last part of the questionnaire contained 12 different cases for
12 different questionnaires. Again, six of them were about Apple and the remaining
ones are about HP. Three of the six questionnaires about Apple were designed for a
40% discount size and the remaining three were for 10%. These three questionnaires
designed for Apple in a state of 40% discount were applied for the cases of 1-day, 3-
day, and time-independent discounts. In the other questionnaires, a similar way was
followed. Detailed information for all questionnaires can be seen in Table 3.1.
26
Table 3.1 Questionnaire Types
Questionnaire Number Discount Size Brand Name Time Constraint
1 40% Apple 1-day
2 40% Apple 3-day
3 40% Apple time-independent
4 40% HP 1-day
5 40% HP 3-day
6 40% HP time-independent
7 10% Apple 1-day
8 10% Apple 3-day
9 10% Apple time-independent
10 10% HP 1-day
11 10% HP 3-day
12 10% HP time-independent
Questionnaires consist of three parts involving 57 questions in total. In addition,
questionnaires comprised two nonobligatory fields that participants can write her/his
opinions, suggestions and questions about the survey and their e-mail addresses to get
information about the survey results later. These nonobligatory fields were saved on
a different table apart from the survey data.
Questionnaires were designed in two different ways: printed questionnaires to apply
in the field and online questionnaires to share on online platforms. For more details,
Appendix A and Appendix C can be seen.

27
3.3.1. Demographic Information Form
The first part is about demographic information of attendees and comprises seven
questions about age, gender, marital status, education status, working status, and
income status depending on working status. The question of income status is a
conditional question. While monthly disposable income was asked to students and
people who were out of work, monthly household income was asked to working
people. In this part, questions about gender, marital status, education status, and
working status are multiple-choice. On the other hand, age, monthly disposable
income, and monthly household income questions were prepared as open-ended, in
order to do analysis more sensitive. Questionnaire samples can be seen in Appendix
A and Appendix C.
3.3.2. Measurements for Brands
The second part was designed in order to measure perceived brand equity and
perceived luxuriousness of two brands. We asked 22 questions to measure perceived
brand equity and 18 questions to measure perceived luxuriousness; totally 40
questions were used in the second part of the questionnaire. Questions in the second
part were shuffled while preparing questionnaires in order to increase the sensitivity
of measurement and easily establish careless participants.
The Likert scale was developed by a psychologist, Rensis Likert, to satisfy a
continuum of choices (Encyclopaedia Brittanica, n.d.). Moreover, Albaum (1997)
states that “In an analysis-of-variance context the standard Likert scale measures
directly the interaction and indirectly, the main effects of direction and intensity.”
Because of these reasons, the Likert scale fitted well for the survey. In line with that,

28
questions were asked in a 1-7 one-stage Likert scale where 1 represents “strongly
disagree” and 7 represents “strongly agree”.
3.3.2.1. Perceived Brand Equity Measurement
There are 22 questions in the perceived brand equity scale. Five of them were added
to scale by the aim of increasing the reliability of the scale. And for this aim, reversed
questions were used in the scale. The remaining 17 questions were used by Lassar,
Mittal, and Sharma on their research named “Measuring customer‐based brand
equity” in 1995. They used this scale for three different brands of television monitors
and three different brands of watches. Since the scale got successful for technological
devices in this study, we thought that it would also work on a notebook computer
brand in order to measure its perceived brand equity. The items used for this scale can
be found in Table 3.2.

29
Table 3.2 Scale Used in Questionnaires for Perceived Brand Equity
Variables N of
Items
SPSS
code Items
Performance 7
P1 From this brand of a notebook computer,
I can expect superior performance.
P2 This brand of a notebook computer is
useful.
P3 This brand will work very well.
P4_R* This brand of a notebook computer is not
good in terms of performance.
P5_R* The quality of this brand of a notebook
computer is below the average.
P6 This brand is one of the best notebook
computer brands.
P7 The quality of this brand is stable.
Social Image 4
I1 This brand of notebook computer fits my
personality.
I2 I would be proud to own a notebook
computer of this brand.
I3 This brand of notebook computer will be
well regarded by my friends.
I4 In its status and style, this brand matches
my personality.

30
Table 3.2 Scale Used in Questionnaires for Perceived Brand Equity (Cont’d)
Variables N of
Items
SPSS
code Items
Value 4
V1 This brand is well priced.
V2
Considering what I would pay for this
brand of a notebook computer, I will get
much more than my money’s worth.
V3
I consider this brand of a notebook
computer to be a bargain because of the
benefits I receive.
V4_R* Notebook computers of this brand are
overpriced.
Trustworthiness 3
T1
I consider the company and the people
who stand behind these notebook
computers to be very trustworthy.
T2 In regard to consumer interests, this
company seems to be very caring.
T3 I believe that this company does not take
advantage of consumers.
Attachment 4
A1
After watching this brand of a notebook
computer, I am very likely to grow fond
of it.
A2 For this brand of a notebook computer, I
have positive personal feelings.
A3
With time, I will develop a warm feeling
toward this brand of a notebook
computer.
A4_R* I do not recommend this brand to others.
Total 22
*P4_R, P5_R, V4_R and A4_R are reversed questions.

31
3.3.2.2. Perceived Luxuriousness Measurement
There are 18 questions in the perceived luxuriousness scale. These questions were
used by De Barnier, Falcy, and Valette-Florence on their research named “Do
consumers perceive three levels of luxury? A comparison of accessible, intermediate
and inaccessible luxury brands” in 2012. They used this scale for a wide range of
product types comprising of perfumes for women, pens for men, watches, cars for
men and jewels for women. In addition, they used brands that can be categorized into
three levels of luxury, namely accessible, intermediate and inaccessible luxury (De
Barnier, Falcy, & Valette-Florence, 2012). Thus, the brands and the product chosen
in our survey are included in both this wide range of brand types in terms of
accessibility and product type in terms of market. The items used for this scale can be
found in Table 3.3.

32
Table 3.3 Scale Used in Questionnaires for Perceived Luxuriousness
Variables N of
Items
SPSS
code Items
Distinction 7
D1 This is a brand to dream about.
D2 This is a gratifying brand.
D3 This brand is for refined people.
D4 This brand makes life more beautiful.
D5 Owning this brand lets me differentiate
myself from other people.
D6 This brand is full of sensuality.
D7 This brand shows who one is.
Elitism 6
E1 This is a select brand.
E2 This brand represents luxury.
E3 This is an elitist brand.
E4 This is a very expensive brand.
E5 Not many people own this brand.
E6 This brand is not mass-produced.
Hedonism 5
H1 It’s a real pleasure to own this brand.
H2 This brand is aesthetic.
H3 People who own this brand have good
taste.
H4 This is an outstanding brand.
H5 This is a top-quality brand.
Total 18

33
3.3.3. Measurement for Offers
The last part of the survey was designed in order to measure customer’s purchasing
actions in response to the offers. We have 12 different offers for 12 different
subsamples. Offers may change with respect to brands, time constraint and the size of
the discount being applied for the product.
In this part, there are 10 questions, six questions of which were asked to measure
willingness to purchase and the remaining four questions were asked to measure the
intent to search further of the participant as a response to offer. For nine questions, we
benefitted from the study of Aggarwal and Vaidyanathan’s (2002) study. One
reversed question was added to the scale by the aim of increasing the reliability of the
scale. Finally, 10 questions were shifted in order to eliminate careless participants
more easily. All questions were translated to Turkish before applying in the survey.
All items were measured on a one-stage 1-7 Likert scale to satisfy a continuum of
choices (Likert, 1932). For five of the questions in this part; one represents “strongly
disagree” and seven represents “strongly agree”. For the remaining five questions, one
represents “very low” where seven represents “very high”. For questionnaires, see
Appendix A and Appendix C.
Questions used in scale for willingness to purchase can be seen in Table 3.4. Items
coded by W1, W2, W3, W4, and W6 were taken from the research of Aggarwal and
Vaidyanathan (2002), and W5 was added to scale as a reverse item in order to increase
the reliability of the scale.
The following six questions were asked for 12 different offers through 12 different
questionnaires. The questionnaires differentiate according to two brands, three time

34
contraints, and two discount sizes. To illustrate, the following text was used for
questionnaire 1:
“You are in a technology store and Apple MacBook Pro laptops are available at a
40% discount. The discount is limited to one day only . It is said to be an opportunity
not to be missed by the seller. So what will you do?”
The offer is for Apple MacBook Pro in questionnaires number of 1, 2, 3, 7, 8, and 9;
for HP Pavilion laptops in questionnaires number of 4, 5, 6, 10, 11, and 12.
The discount size was identified as 40% in questionnaires number of 1, 2, 3, 4, 5, and
6; 10% in questionnaires number of 7, 8, 9, 10, 11, and 12.
Time constraints were stated using the sentences “The discount is limited to one day
only.” in questionnaires number of 1, 4, 7, and 10; “The discount will last three days.”
in questionnaires number of 2, 5, 8, and 11. In questionnaires number of 3, 6, 9, and
12, any statement about time constraint was not used.

35
Table 3.4 Scale Used in Questionnaires for Willingness to Purchase
Variables N of
Items
SPSS
code Items
Willingness
to Purchase 6
W1
My attitude towards the deal offered in
the advertisement for the notebook
computer is good.
strongly agree--strongly disagree
W2
At the price shown, I would consider
buying the advertised product.
strongly agree--strongly disagree
W3
The probability that I would consider
buying the advertised notebook
computer is…
very low--very high
W4
My willingness to buy this notebook
computer at the advertised price is…
very low--very high
W5_R*
This promotion does not affect my
willingness to purchase this product.
strongly agree--strongly disagree
W6
The likelihood that I would purchase the
advertised product at this price is…
very low--very high
Total 6
*W5_R is a reversed question.

36
3.4. Participants and Data Collection
Data were collected from 18-year-old individuals living in Ankara. Target groups
were (1) university students and (2) people who work or worked in the IT sector
before, since the aim was to apply the survey to participants whose information level
about the product is required to be as high as possible.
When applying the questionnaires to respondents, whether they recognize the brands
was checked firstly and the questionnaires distributed randomly in order to eliminate
the occurrence of bias.
Questionnaires were applied to 66 individuals in the field via printed papers and 345
individuals on an online platform. Totally, 411 participants have attended the survey.
Consequently, the number of questionnaires in terms of types can be found in Table
3.5 and Table 3.6.

37
Table 3.5 Number of Questionnaires Completed for Apple
Apple
MacBook Pro
Time Constraint
1-day 3-day Time-
independent Total
Dis
cou
nt
Siz
e 10% 32 28 30 90
40% 26 81 46 153
Total 58 109 76 243
Table 3.6 Number of Questionnaires Completed for HP
HP Pavilion
Time Constraint
1-day 3-day Time-
independent
Total
Dis
cou
nt
Siz
e 10% 32 28 26 86
40% 31 25 26 82
Total 63 53 51 168

38
CHAPTER 4
4.ANALYSES AND RESULTS
4.1. Data Screening and Cleaning
Data collected from 411 respondents were entered into SPSS 25.0 (IBM Corp., 2017)
to be analyzed. Out of 411 respondents whose information was collected via online
and paper-printed questionnaires, 391 respondents questionnaires were considered as
valid. After an analysis of the comparison between negatively stated questions with
others, 11 participants were omitted. These are involved in the same dimension in
order to observe the consistency of respondents and some of them were eliminated
after exploratory factor analysis.
In addition to this, the highest level of education completed was compared with the
age of every single respondent to detect and omit inconsistent data. To analyze that,
the minimum ages of respondents at all education degrees were considered (Table
4.1). Therefore, any inconsistent data was detected at that point. Furthermore, nine
outliers were determined and eliminated from the data set before the reliability test.

39
Table 4.1 The Highest Level of Education Completed * Age
Frequency Age Mean Age Range
High School Graduate 65 21.14 18 - 45
Associate Degree 6 26.17 20 - 36
Bachelor's Degree 178 27.35 21 - 65
Master's Degree 104 30.51 23 - 50
Doctorate Degree 47 40.83 29 - 77
Total 400 28.73 18 - 77
According to Hair, Black, Babin, and Anderson (2014); missing data under 10 percent
can be ignorable. Thus, missing data was ignored, and analyses were done by
excluding missing values since the rate of missing data is below 10 percent of all data.
For the purpose of detecting inconsistency, we have 5 reverse coded items in the test:
P4, P5, V4, A4, and W4. The values of these items were transformed to reverse value
on the 1-7 scale when entering data to SPSS.

40
4.2. Descriptive Statistics
400 admissible respondents attended the survey with a wide range of ages differing
from 18 to 77. Respondents’ age average was nearly 29 with a standard deviation of
8.59 (Table 4.2).
Table 4.2 Age Characteristics of the Participants
Frequency Mean Std. Dev. Range
400 28.73 8.59 18 – 77
Among 400 respondents, 205 were female with 51.2 percentage while 193 were male
with 48.3 percentage. Remaining two respondents, who constitute .5 percent of the
sample, were defined themselves as another gender (Table 4.3).
Table 4.3 Gender Characteristics of the Participants
Frequency Percentage
Female 205 51.25
Male 193 48.25
Other 2 .50
Total 400 100.00
297 respondents who were almost three-quarters of the sample were single with 74.25
percentage while the married 94 respondents constituted 23.5 percent of the sample.
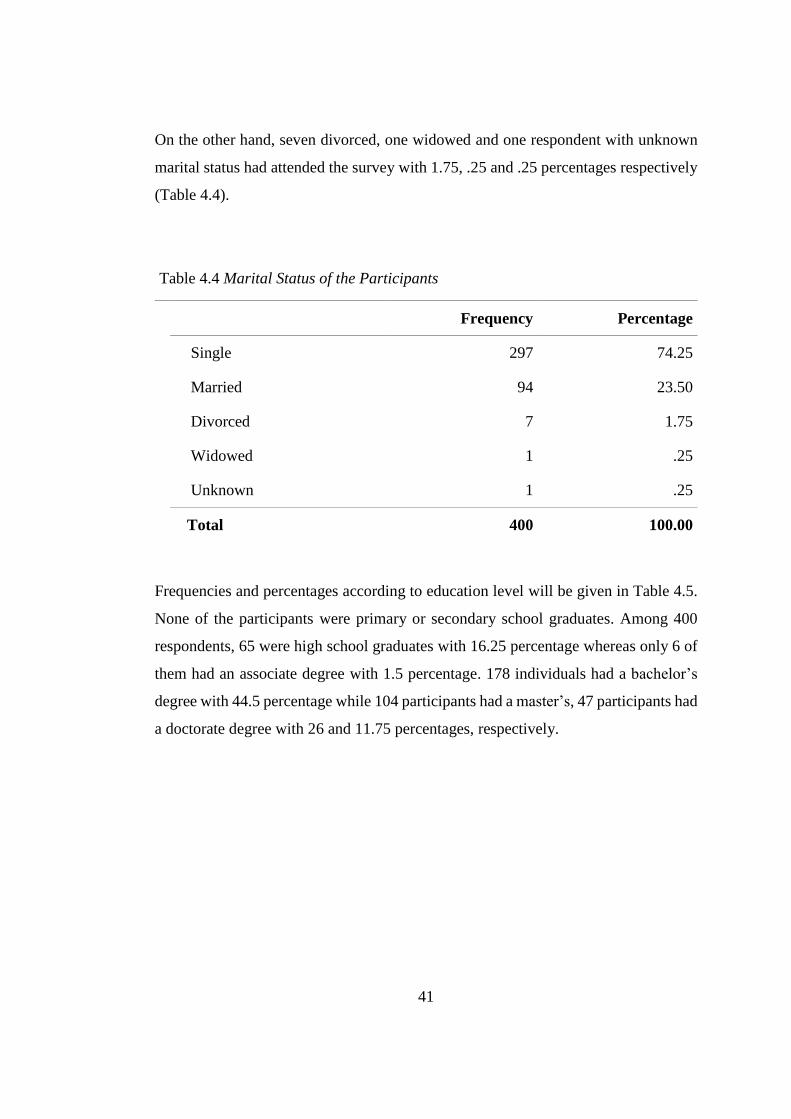
41
On the other hand, seven divorced, one widowed and one respondent with unknown
marital status had attended the survey with 1.75, .25 and .25 percentages respectively
(Table 4.4).
Frequencies and percentages according to education level will be given in Table 4.5.
None of the participants were primary or secondary school graduates. Among 400
respondents, 65 were high school graduates with 16.25 percentage whereas only 6 of
them had an associate degree with 1.5 percentage. 178 individuals had a bachelor’s
degree with 44.5 percentage while 104 participants had a master’s, 47 participants had
a doctorate degree with 26 and 11.75 percentages, respectively.
Table 4.4 Marital Status of the Participants
Frequency Percentage
Single 297 74.25
Married 94 23.50
Divorced 7 1.75
Widowed 1 .25
Unknown 1 .25
Total 400 100.00
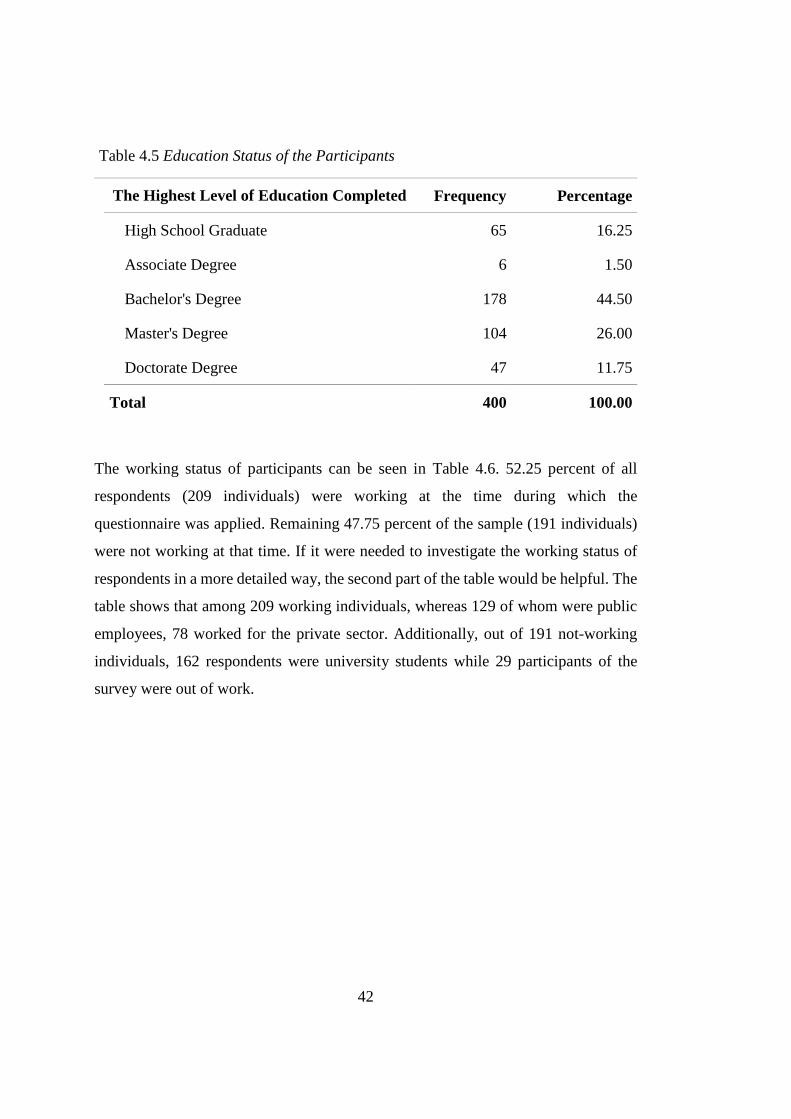
42
Table 4.5 Education Status of the Participants
The Highest Level of Education Completed Frequency Percentage
High School Graduate 65 16.25
Associate Degree 6 1.50
Bachelor's Degree 178 44.50
Master's Degree 104 26.00
Doctorate Degree 47 11.75
Total 400 100.00
The working status of participants can be seen in Table 4.6. 52.25 percent of all
respondents (209 individuals) were working at the time during which the
questionnaire was applied. Remaining 47.75 percent of the sample (191 individuals)
were not working at that time. If it were needed to investigate the working status of
respondents in a more detailed way, the second part of the table would be helpful. The
table shows that among 209 working individuals, whereas 129 of whom were public
employees, 78 worked for the private sector. Additionally, out of 191 not-working
individuals, 162 respondents were university students while 29 participants of the
survey were out of work.

43
Table 4.6 Working Status of the Participants
Frequency Percentage
Working 209 52.25
Not Working 191 47.75
Total 400 100.00
Working Status of the Participants (More Detailed)
Frequency Percentage
Public Employee 129 32.25
Private Sector Employee 78 19.50
Student 162 40.50
Out of work 29 7.25
Unknown 2 .50
Total 400 100.00
Income status was investigated by taking into consideration the respondents’ working
status. While monthly household income was asked to working individuals, monthly
disposable income was asked to students and people who were out of work. Although
most of the participants stated their income in Turkish lira, a few of them stated their
income as Euro or United States dollars. Other currencies were translated to Turkish
Liras by using the exchange rate of that time. The mean monthly household income
was calculated ₺8,739 by using inputs of 209 respondents. It was determined that the
income level had a wide range from ₺1,000 to ₺40,000. On the other hand, the
remaining 191 participants’ responses showed that the mean of monthly disposable

44
income of the respondents was ₺1,658, with the range from ₺0 to ₺12,000. Table 4.7
can be seen for detailed information about the income status of the participants.
Table 4.7 Income Status of the Participants
Frequency Mean Std. Dev. Range
Monthly
Household
Income
209 ₺8,738.71 ₺5,864.51 ₺1,000 - ₺40,000
Monthly
Disposable
Income
191 ₺1,658.12 ₺1,480.02 ₺0 - ₺12,000
Total 400
4.3. Tests of Normality
Normality was checked for all scales. For these tests, Kim’s (2013) research was taken
as reference. Firstly, skewness and kurtosis values were checked whether they are in
the ±1 interval. Secondly, Z scores were checked for both skewness and kurtosis
values. Z score was calculated with Equation (1) and Equation (2). According to Kim
(2013), if the sample size is small (n<50), it should be in ±1.96 interval. If the sample
size is medium (50≤n<300) then it is required to check whether it is in the interval
±3.29 (Kim, 2013).
𝑍 =𝑆𝑘𝑒𝑤 𝑉𝑎𝑙𝑢𝑒
𝑆𝐸𝑠𝑘𝑒𝑤𝑛𝑒𝑠𝑠 (1) 𝑍 =
𝐸𝑥𝑐𝑒𝑠𝑠 𝐾𝑢𝑟𝑡𝑜𝑠𝑖𝑠
𝑆𝐸𝑒𝑥𝑐𝑒𝑠𝑠 𝑘𝑢𝑟𝑡𝑜𝑠𝑖𝑠 (2)

45
Finally, Kolmogorov-Smirnova and Shapiro-Wilk significances were checked. For
small size samples (n<50), Kolmogorov-Smirnova significance; for the samples
whose size is ≥50, Shapiro-Wilk significance was checked.
4.3.1. Perceived Brand Equity Scale
Normality was checked for the perceived brand equity scale to determine the method
that will be used for data analysis. skewness and kurtosis values were checked whether
they are between -1 and +1. After that, z values of skewness and kurtosis were checked
whether they are between -3.29 and 3.29 because the sample is was medium-sized. As
a result, these two criteria were met. Finally, Kolmogorov-Smirnova and Shapiro-
Wilk normality tests were applied. Since the sample size was greater than 50, the
Shapiro-Wilk significance value was taken into consideration and it was seen that it
was greater than .05 and it was not significant. This means data is normally distributed
for both brands; Apple and HP. It can also be seen in Table 4.8, Figure 4.1 and Figure
4.2 to maintain a piece of detailed information.

46
Table 4.8 Test of Normality of Errors for Brands with respect to Perceived Brand
Equity
Statistic Std. Error z-
value*
Apple
Frequency 237
Skewness - .04 .16 - .24
Kurtosis - .22 .32 - .68
HP
Frequency 154
Skewness .03
.20 .14
Kurtosis - .21 .39 - .55
Kolmogorov-Smirnova Shapiro-Wilk
Brand
Name Statistic df Sig. Statistic df Sig.
Apple .05 237
.20 1.00 237 .80
HP .04 154 .20 .99 154 .80
* z-value is calculated with the formula Statistic / Std. Error for Skewness and
Kurtosis separately in order to check normality.

47
Figure 4.1 Normal Q-Q Plot of Brand Equity for Apple
Figure 4.2 Normal Q-Q Plot of Brand Equity for HP

48
4.3.2. Perceived Luxuriousness Scale
Normality was checked for the perceived luxuriousness scale to determine the method
that will be used for data analysis. Skewness and kurtosis values were checked whether
they are between -1 and +1, and it was validated. After that, z-value for skewness and
kurtosis were checked whether they are between -3.29 and 3.29. It was observed also
that these values were almost in the interval. Finally, Kolmogorov-Smirnova and
Shapiro-Wilk normality tests were applied. Since the sample size was greater than 50,
the Shapiro-Wilk significance value was taken into consideration and it was seen that
it was less than .05 and significant. This means data is not normally distributed. It can
also be seen in Table 4.9 for detailed information.
Table 4.9 Test of Normality of Errors for Brands with respect to Perceived
Luxuriousness
Statistic Std. Error z-value*
Apple
Frequency 237
Skewness - .10 .16 - .62
Kurtosis - .62 .32 - 1.97
HP
Frequency 154
Skewness .13 .20 .68
Kurtosis - .54 .39 - 1.40
Kolmogorov-Smirnova Shapiro-Wilk
Brand
Name Statistic df Sig. Statistic df Sig.
Apple .05 237 .20 .99 237 .02
HP .07 154 .05 .99 154 .10
* z-value is calculated with the formula Statistic / Std. Error for Skewness and Kurtosis
separately in order to check normality.
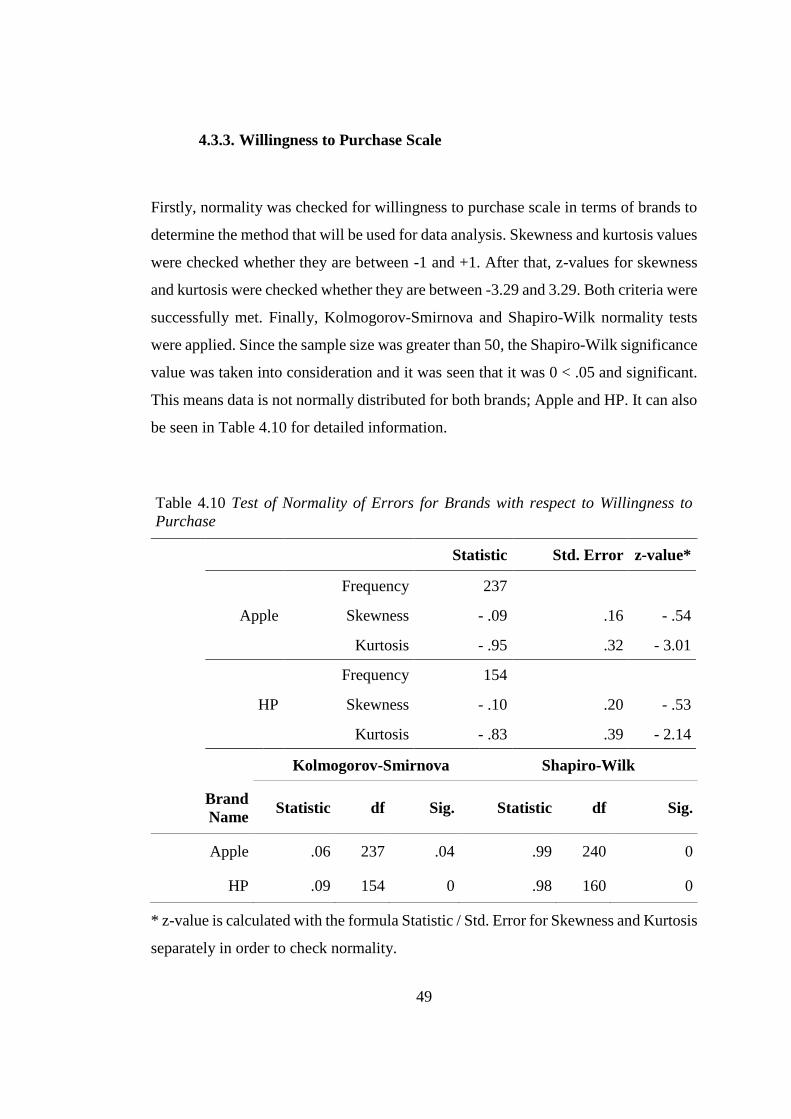
49
4.3.3. Willingness to Purchase Scale
Firstly, normality was checked for willingness to purchase scale in terms of brands to
determine the method that will be used for data analysis. Skewness and kurtosis values
were checked whether they are between -1 and +1. After that, z-values for skewness
and kurtosis were checked whether they are between -3.29 and 3.29. Both criteria were
successfully met. Finally, Kolmogorov-Smirnova and Shapiro-Wilk normality tests
were applied. Since the sample size was greater than 50, the Shapiro-Wilk significance
value was taken into consideration and it was seen that it was 0 < .05 and significant.
This means data is not normally distributed for both brands; Apple and HP. It can also
be seen in Table 4.10 for detailed information.
Table 4.10 Test of Normality of Errors for Brands with respect to Willingness to
Purchase
Statistic Std. Error z-value*
Apple
Frequency 237
Skewness - .09 .16 - .54
Kurtosis - .95 .32 - 3.01
HP
Frequency 154
Skewness - .10 .20 - .53
Kurtosis - .83 .39 - 2.14
Kolmogorov-Smirnova Shapiro-Wilk
Brand
Name Statistic df Sig. Statistic df Sig.
Apple .06 237 .04 .99 240 0
HP .09 154 0 .98 160 0
* z-value is calculated with the formula Statistic / Std. Error for Skewness and Kurtosis
separately in order to check normality.

50
Secondly, normality was checked for willingness to purchase scale in terms of discount
size to determine the method that will be used for data analysis. Skewness and kurtosis
values were checked whether they are between -1 and +1, and it was validated. After
that, z-value for skewness and kurtosis were checked whether they are between -3.29
and 3.29 and, it was observed that these values were in the interval. Finally,
Kolmogorov-Smirnova and Shapiro-Wilk normality tests were applied. Since the
sample size was greater than 50, the Shapiro-Wilk significance value was taken into
consideration and it was seen that it is 0 < .05 and significant. This means data is not
normally distributed for both discount size; 10% and 40%. It can also be seen in Table
4.11 for detailed information.
Table 4.11 Test of Normality of Errors for Discount Size with respect to Willingness
to Purchase
Statistic Std. Error z-value*
10%
Frequency 170
Skewness .19 .19 1.04
Kurtosis - .92 .37 - 2.49
40%
Frequency 220
Skewness - .38 .16 - 2.34
Kurtosis - .44 .33 - 1.35
Kolmogorov-Smirnova Shapiro-Wilk
Discount
Size Statistic df Sig. Statistic df Sig.
10% .08 170 .01 .96 170 0
40% .08 221 0 .97 221 0
* z-value is calculated with the formula Statistic / Std. Error for Skewness and Kurtosis
separately in order to check normality.

51
Thirdly, normality was checked for willingness to purchase scale in terms of a time
constraint to determine the method that will be used for data analysis. Skewness and
kurtosis values were checked whether they are between -1 and +1, and it was validated.
After that, z-values for skewness and kurtosis were checked whether they are between
-3.29 and 3.29 and, it was observed that these values were in the interval. Finally,
Kolmogorov-Smirnova and Shapiro-Wilk normality tests were applied. Since the
sample size was greater than 50, the Shapiro-Wilk significance value was taken into
consideration and it was seen that it is 0 < .05 and significant. This means data is not
normally distributed for all time restrictions. It can also be seen in Table 4.12 for
detailed information.

52
Table 4.12 Test of Normality of Errors for Time Limitation with respect to
Willingness to Purchase
Statistic Std. Error z-value*
1-day
Frequency 118
Skewness .16
.22 .70
Kurtosis - .59 .44 - 1.33
3-day
Frequency 158
Skewness - .02
.19 - .10
Kurtosis - .95 .38 - 2.48
No Rest.
Frequency 115
Skewness - .17
.23 - .76
Kurtosis - .77 .45 - 1.72
Kolmogorov-Smirnova Shapiro-Wilk
Time
Restriction
Statisti
c df Sig. Statistic df Sig.
1-day
.08 118 .06 .97 118 .01
3-day .06 158 .20 .97 158 0
No Rest.
.07 115 .20 .98 115 .03
* z-value is calculated with the formula Statistic / Std. Error for Skewness and Kurtosis
separately in order to check normality.

53
Finally, normality was checked for willingness to purchase scale in terms of six cases
for Brand Apple separately to determine the method that will be used for data analysis.
Skewness and kurtosis values were checked whether they are between -1 and +1, and
it was validated. After that, z-values for skewness and kurtosis were checked whether
they are between -1.96 and 1.96 because sample sizes were small. As a result, it was
observed that these values are in the interval. Finally, Kolmogorov-Smirnova and
Shapiro-Wilk normality tests were applied. Since the sample size was less than 50,
Kolmogorov-Smirnova significance value was taken into consideration and it was seen
that it is over .05 and not significant. This means data is normally distributed for these
six cases in terms of willingness to purchase. It can also be seen in Table 4.13 and
Table 4.14 for detailed information.

54
Table 4.13 Descriptive for Six Cases for Brand Apple Separately with respect to
Willingness to Purchase
Case
Number Statistic Std. Error z-value*
1 Skewness - .30 .46 - .66
Kurtosis - .18 .90 - .20
2
Skewness - .37 .27 - 1.37
Kurtosis - .66 .53 - 1.26
3
Skewness - .70 .37 - 1.92
Kurtosis .14 .72 .19
7
Skewness .33 .41 .80
Kurtosis - .81 .81 - 1.00
8
Skewness - .01 .44 - .02
Kurtosis - 1.08 .86 - 1.26
9
Skewness .23 .43 .52
Kurtosis - 1.26 .85 - 1.49
* z-value is calculated with the formula Statistic / Std. Error for Skewness and Kurtosis
separately in order to check normality.

55
Table 4.14 Test of Normality of Errors for 6 Cases for Brand Apple Separately with
respect to Willingness to Purchase
Kolmogorov-Smirnova Shapiro-Wilk
Case
Number Statistic df Sig. Statistic df Sig.
1 .10 25 .20 .96 25 .45
2 .07 81 .20 .97 81 .03
3 .11 42 .20 .95 42 .06
7 .10 32 .20 .95 32 .13
8 .13 28 .20 .95 28 .19
9 .14 29 .18 .94 29 .08
Similarly, normality was checked for willingness to purchase scale in terms of 6 cases
for Brand HP separately to determine the method that will be used for data analysis.
Skewness and kurtosis values were checked whether they are between -1 and +1, and
it was validated. After that, z-values for skewness and kurtosis were checked whether
they are between -1.96 and 1.96 because sample sizes were small. As a result, it was
observed that these values are in the interval. Finally, Kolmogorov-Smirnova and
Shapiro-Wilk normality tests were applied. Since the sample size was less than 50,
Kolmogorov-Smirnova significance value was taken into consideration and it was seen
that it is over .05 and it is not significant. This means data is normally distributed for
these 6 cases in terms of willingness to purchase. It can also be seen in Table 4.15 and
Table 4.16 for detailed information.

56
Table 4.15 Descriptive for Six Cases for Brand HP Separately with respect to
Willingness to Purchase
Case
Number Statistic Std. Error z-value*
4 Skewness - .41 .43 - .97
Kurtosis - .33 .83 - .40
5
Skewness - .17 .48 - .35
Kurtosis - 1.20 .94 - 1.28
6
Skewness - .47 .49 - .96
Kurtosis - .56 .95 - .58
10
Skewness - .27 .42 - .64
Kurtosis - 1.18 .82 - 1.44
11
Skewness .16 .46 .36
Kurtosis - 1.18 .89 - 1.33
12
Skewness - .04 .49 - .08
Kurtosis - 1.09 .95 - 1.14
* z-value is calculated with the formula Statistic / Std. Error for Skewness and Kurtosis
separately in order to check normality.

57
Table 4.16 Test of Normality of Errors for 6 Cases for Brand Apple Separately with
respect to Willingness to Purchase
Kolmogorov-Smirnova Shapiro-Wilk
Case
Number Statistic df Sig. Statistic df Sig.
4 .19 30 .11 .96 30 .07
5 .14 23 .20 .97 23 .13
6 .15 22 .20 .95 22 .26
10 .16 31 .15 .95 31 .02
11 .11 26 .20 .95 26 .15
12 .13 22 .20 .94 22 .31

58
4.4. Exploratory Factor Analysis
Exploratory factor analysis was used for all measures to determine the power of scale.
Hair, Black, Babin, and Anderson (2014) were taken as references while using this
method.
4.4.1. Perceived Brand Equity Scale
As mentioned before, the perceived brand equity scale firstly was designed as it
comprises five factors, namely performance, social image, value, trustworthiness and
attachment, and 22 items were used in the scale. Exploratory factor analysis was
applied to these 22 items to affirm the factors. After this analysis, it was determined
that the attachment factor could not be measured well with chosen items. The items
were loaded for four factors which are performance, social image, value,
trustworthiness. Reversed questions, P4 and P5, which were used to measure
performance, were also eliminated, since they were misunderstood by the participants.
After eliminating P4 and P5 items and items used for the attachment factor;
performance, social image, value, and trustworthiness were used to measure perceived
brand equity.
Firstly, exploratory factor analysis was applied to scale by using the remaining 16
factors and it was successfully loaded as we had foreseen before. The principal
component analysis was conducted and test results in Table 4.17 showed that scale is
significant, KMO value is .91 which is greater than .60. As a conclusion, the analysis
explains 70 percent of the total variance. In addition, factor loadings of all items are
over the threshold level.

59
Table 4.17 Exploratory Factor Analysis for Perceived Brand Equity
Kaiser-Meyer-Olkin Measure of Sampling Adequacy .91
Significance of Bartlett's Test of Sphericity .00
Total Variance Explained .70
Items
Factor
Loadings for
Component 1
Factor
Loadings for
Component 2
Factor
Loadings for
Component 3
Factor
Loadings for
Component 4
P1 .746
P2 .700
P3 .757
P6 .498
P7 .502
I1 - .884
I2 - .747
I3 - .663
I4 - .872
V1 .828
V2 .420
V3 .529
V4 (R) .869
T1 - .651
T2 - .778
T3 - .730

60
4.4.2. Perceived Luxuriousness Scale
As perceived luxuriousness comprises three factors, namely distinction, elitism, and
hedonism; its scale was firstly designed and 18 items were used in the scale. When
exploratory factor analysis was applied to these 18 items, it was seen that many of the
items were loaded for only one factor with large values. Because of this matter,
perceived luxuriousness was accepted as one factor itself and therefore biggest 10
items were chosen to be used in analyses. As a result, the items consisting of D3, D5,
D7, E2, E3, E4, E5, and E6 were eliminated before the reapplication of exploratory
factor analysis.
Exploratory factor analysis was applied to scale by using the remaining 10 items again
and it was successfully loaded as it was foreseen. Test results in Table 4.18 show that
scale is significant, KMO value is .73 which is greater than .60 and the analysis
explains 54 percent of the total variance. Last of all, the principal component analysis
shows factor loadings of all items are over the threshold level.

61
Table 4.18 Exploratory Factor Analysis for Perceived Luxuriousness
Kaiser-Meyer-Olkin Measure of Sampling Adequacy .73
Significance of Bartlett's Test of Sphericity .00
Total Variance Explained .54
Items Factor Loadings
D1 .802
D2 .806
D4 .812
D6 .862
E1 .802
H1 .849
H2 .743
H3 .740
H4 .812
H5 .808

62
4.4.3. Willingness to Purchase Scale
Willingness to purchase scale was designed as it comprised only one factor containing
six items. When exploratory factor analysis was applied to these six items, they were
successfully loaded. Test results in Table 4.19 show that scale is significant, KMO
value is .88 which is greater than .60 and the analysis explains 70 percent of the total
variance. In addition, it can be easily seen in the table that factor loadings of all items
are over the threshold level.
Table 4.19 Exploratory Factor Analysis for Willingness to Purchase
Kaiser-Meyer-Olkin Measure of Sampling Adequacy .88
Significance of Bartlett's Test of Sphericity .00
Total Variance Explained .70
Items Factor Loadings
W1 .858
W2 .850
W3 .838
W4 .929
W5 .667
W6 .868

63
4.5. Reliability Analysis
Cronbach’s alpha method was applied to all factors for reliability analysis. Hair, Black,
Babin, and Anderson (2014) were taken as references while using this method.
4.5.1. Perceived Brand Equity Scale
Cronbach’s alpha was calculated for four factors separately (Table 4.20). Firstly,
Cronbach’s alpha for the Performance factor was founded as .89. This shows that the
five items that constitute the factor are adequate to measure the performance of the
brands. Secondly, Cronbach’s alpha was calculated for social image and it was
founded .87. Thus, this shows that the four items of this factor are adequate to measure
the social image of the brands. Thirdly, reliability analysis was done for four items of
Value factor and Cronbach’s alpha was calculated as .72 and it was seen that the
components of the Value factor are enough to measure this factor. Finally, Cronbach’s
alpha method was applied for the trustworthiness factor and the value was founded
.73, which is greater than the threshold.
Table 4.20 Reliability Analysis for Brand Equity Factors
Factor Cronbach's Alpha N of Items
Performance .889 5
Social Image .871 4
Value .715 4
Trustworthiness .725 3

64
4.5.2. Perceived Luxuriousness Scale
Perceived luxuriousness scale consists of 10 items in Table 4.18 and Cronbach’s alpha
was found .94 using those items (Table 4.21). If we think that the lower limit of
acceptability is .60 (Hair, Black, Babin, & Anderson, 2014), .94 is a great value and it
shows that items can measure the perceived luxuriousness perfectly.
Table 4.21 Reliability Analysis for Perceived Luxuriousness
Cronbach's Alpha N of Items
.939 10
4.5.3. Scale for Willingness to Purchase
We used six items to measure the willingness to purchase of the customer. Reliability
analysis was done with these items and Cronbach’s alpha was calculated .91 (Table
4.22). This shows the success of the scale.
Table 4.22 Reliability Analysis for Willingness to Purchase Factor
Cronbach's Alpha N of Items
.910 6

65
4.6. Analyses
As stated before, a 1-7 one-stage Likert scale was used on the second and the last parts
of the questionnaires. Likert scale items were evaluated by calculating the mean values
of related Likert-type items for each participant separately and they were analyzed at
the interval measurement scale. Mean values were calculated to test the central
tendency and standard deviation to test the variability of the data (Boone & Boone,
2012).
The following methods were used in the analysis in this section:
Independent t-test
Mann-Whitney U Test
Kruskal Wallis Test
Factorial ANOVA
4.6.1. Perceived Brand Equity
After applying normality check, factor analysis, and reliability analysis consecutively;
parametric analysis was used for the perceived brand equity scale. Since the sample
was normally distributed (Section 4.3), an independent t-test was applied for brands’
effect on perceived brand equity on SPSS.
Firstly, the average values of all items’ results were calculated for each participant and
for 4 factors of the scale separately. Then, the average values of these four factors were
calculated in order to find the perceived brand equity rate of each participant.
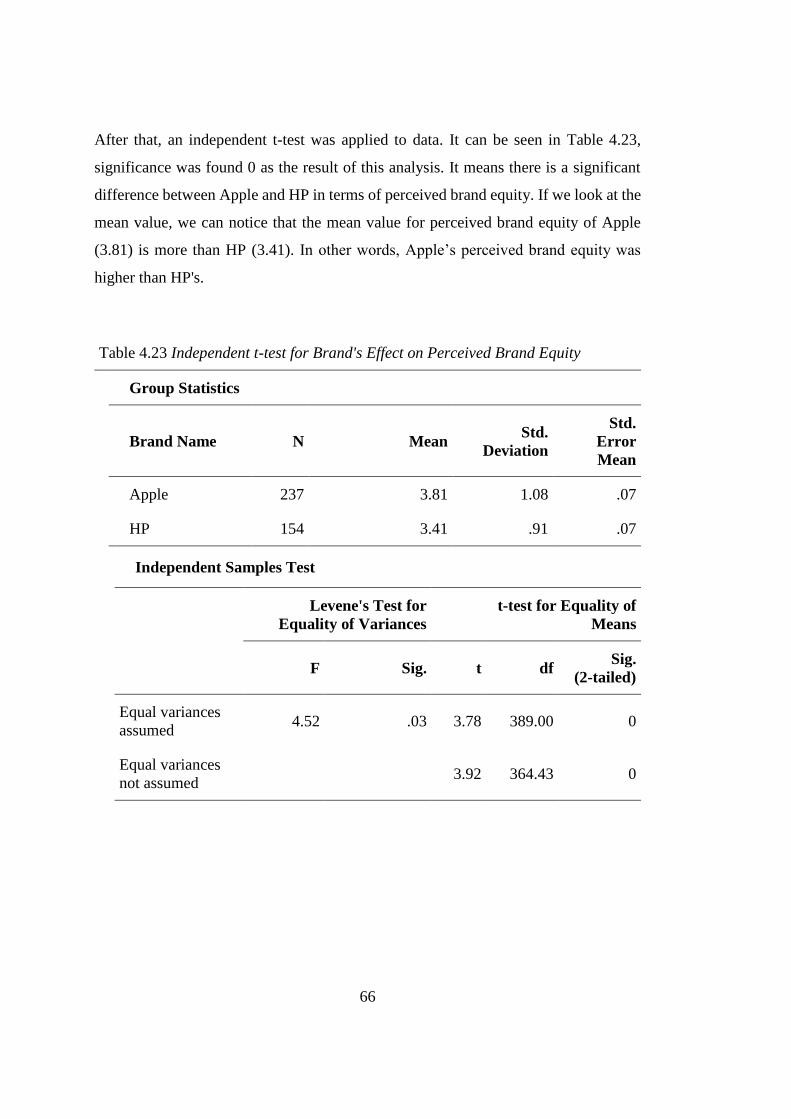
66
After that, an independent t-test was applied to data. It can be seen in Table 4.23,
significance was found 0 as the result of this analysis. It means there is a significant
difference between Apple and HP in terms of perceived brand equity. If we look at the
mean value, we can notice that the mean value for perceived brand equity of Apple
(3.81) is more than HP (3.41). In other words, Apple’s perceived brand equity was
higher than HP's.
Table 4.23 Independent t-test for Brand's Effect on Perceived Brand Equity
Group Statistics
Brand Name N Mean Std.
Deviation
Std.
Error
Mean
Apple 237 3.81 1.08 .07
HP 154 3.41 .91 .07
Independent Samples Test
Levene's Test for
Equality of Variances
t-test for Equality of
Means
F Sig. t df Sig.
(2-tailed)
Equal variances
assumed 4.52 .03 3.78 389.00 0
Equal variances
not assumed 3.92 364.43 0

67
4.6.2. Perceived Luxuriousness
When we investigate the perceived luxuriousness scale in terms of normality, it can be
seen the sample was not distributed normally (Section 4.3), so we decided to do a
nonparametric analysis for this scale in terms of brands. Since two brands were used
for this scale, the Mann-Whitney U test was applied in order to detect the difference
between the two brands in terms of perceived luxuriousness (Balcı, 2018).
First of all, the average values were calculated for 10 items which were used for
measuring perceived luxuriousness for each participant. Then, these values were used
by doing the Mann-Whitney U test.
The result of the Mann-Whitney U test is significant (p=0), and this means there is a
remarkable difference between Apple and HP in terms of perceived luxuriousness.
Apple has a greater perceived luxuriousness than HP by far.
Table 4.24 Mann-Whitney U Test for Brand's Effect on Perceived Luxuriousness
Discount Size N Mean Ranks Sum of Ranks
Apple 237 235.44 55,798.50
HP 154 135.31 12,837.50
Total 391
Mann-Whitney U 8,902.50
Asymp. Sig. (2-tailed) 0

68
4.6.3. Willingness to Purchase
4.6.3.1. Impact of Brand on Willingness to Purchase
After normality tests (Section 4.3), it was determined that the sample is not distributed
normally with respect to the willingness to purchase scale in terms of brands.
Moreover, after exploratory factor analysis (Section 0), and reliability analysis
(Section 4.5), it was seen from the items of the scale that they were sufficient to
measure willingness to purchase in response to the offer. In the beginning of the
analysis, the average of the item values was calculated one by one. After that, since
the sample was not normally distributed, a nonparametric analysis was conducted.
Considering that there were two brands to be used, the Mann-Whitney U test was
performed to test the effects of directly brands, indirectly perceived brand equity and
perceived luxuriousness.
There was a significant effect of the brand on willingness to purchase (p=.001). The
mean rank value of willingness to purchase for Apple is much higher than HP’s mean
rank value for willingness to purchase. This means that the purchase intention for
Apple is higher than HP's.

69
Table 4.25 Mann-Whitney U Test for Brand's Effect on Willingness to Purchase
Discount Size N Mean Ranks Sum of Ranks
Apple 237 211.10 50,031.00
HP 154 172.76 26,605.00
Total 391
Mann-Whitney U 14,670
Asymp. Sig. (2-tailed) .001
4.6.3.2. Impact of Discount Size on Willingness to Purchase
To determine the impact of the discount size on the willingness to purchase, the Mann-
Whitney U test was applied. Because normality tests for the data in Section 4.3 showed
that the sample was not normally distributed and nonparametric analysis should have
been used. First of all, the average values of items were calculated for each participant
separately. After that, the Mann-Whitney U test was performed and it was determined
there is a significant difference between 40% and 10% discounts in terms of the impact
of willingness to purchase (p=0).
When we investigate the mean ranks, it is obvious that a 40% discount size makes the
customer want to purchase the product much more than a 10% discount size (Table
4.26). It can be seen in Figure 4.3 that the higher discount size leads to more
willingness to purchase.

70
Table 4.26 Mann-Whitney U Test for Discount Size's Effect on Willingness to
Purchase
Discount Size N Mean Ranks Sum of Ranks
10% 170 139.03 26,635.50
40% 221 239.82 53,000.50
Total 391
Mann-Whitney U 9,100.50
Asymp. Sig. (2-tailed) 0
Figure 4.3 Estimated Marginal Means of Willingness to Purchase with respect to
Discount Size

71
4.6.3.3. Impact of Time Restriction on Willingness to Purchase
Kruskal Wallis test was conducted to examine the impact of time limit on willingness
to purchase. Normality tests in Section 4.3 showed that data was not normally
distributed. Thus, we were better to conduct a nonparametric analysis in this part. Since
we had more than two alternatives for the time restriction variable, the Kruskal Wallis
test was appropriate to measure its effect on willingness to purchase.
When we performed the test, we are able to recognize that there is a significant effect
of time constraints on willingness to purchase (p=.038). Comparing different durations
of discounts, time-independent promotions is the most effective one. 3-day discount is
the second and the last one is the 1-day discount. It is seen in Table 4.27 multiple
comparisons, 1-day discount and time-independent discount are significantly different
from each other in terms of their impact on willingness to purchase (p=.04). At this
point, it is not wrong to say the longer time limit leads to more willingness to purchase
(Figure 4.4).
Table 4.27 Kruskal Wallis Test for Time Constraint's Effect on Willingness to
Purchase
Descriptive Statistics
Time Constraint N Mean Rank
1-day 118 174.86
3-day 158 200.52
Time-independent 115 211.48
Kruskal-Wallis 6.55
Asymp. Sig. (2-tailed) .038

72
Figure 4.4 Estimated Marginal Means of Willingness to Purchase with respect to
Time Constraint
4.6.3.4. Impact of the Composite Factor on Willingness to Purchase
Factorial ANOVA was performed for time, discount, and brand factors in terms of
willingness to purchase in this part. When we investigated between-subjects effects in
Table 4.28, we saw that the discount (p=0) and the brand (p=.025) were significantly
effective on willingness to purchase separately, and together (p=.027). On the other
hand, time*discount (p=.65) and time*brand (p=.94) pairs’ impact could not be
observed significantly.

73
Table 4.28 Tests of Between-Subjects Effects on Willingness to Purchase (Factorial
ANOVA)
Source df Mean Square F Sig.
Corrected Model 11 20.35 10.16 0
Intercept 1 4,536.35 2,265.33 0
Time 2 4.00 2.00 .137
Discount 1 150.38 75.10 0
Brand 1 10.18 5.09 .025
Time * Discount 2 .88 .44 .646
Time * Brand 2 .13 .07 .936
Discount * Brand 1 9.90 4.94 .027
Time * Discount * Brand 2 .67 .34 .715
Table 4.29 shows descriptive statistics obtained as a result of Factorial ANOVA. The
greatest mean value for willingness to purchase is acquired in consequence of an
application of a time-independent discount on Apple MacBook Pro notebook
computer with a discount size of 40%. It continues with 1-day and 3-day limited
promotions. The table shows that the most effective factor is the discount size for
promotions on willingness to purchase. The best six in the 12 cases have a 40%
discount size. The greatest three mean values in these six cases with a 40% discount
size are obtained from the offers proposed for Apple MacBook Pro. This shows that
the second effective factor is brand perception in the three main factors used in the
analysis.

74
Table 4.29 Factorial ANOVA Descriptive Statistics for the Composite of All Factors
with respect to Willingness to Purchase
Discount Size Brand
Name
Time
Constraint Mean Std. Deviation N
40% Apple time-
independent 4.84 1.43 42
40% Apple 1-day 4.59 1.56 25
40% Apple 3-day 4.44 1.57 81
40% HP time-
independent 4.25 .74 20
40% HP 1-day 3.89 1.51 30
40% HP 3-day 3.68 1.65 23
10% Apple time-
independent 3.25 1.56 29
10% HP 3-day 3.05 1.41 26
10% HP time-
independent 3.03 1.21 24
10% Apple 3-day 2.83 1.18 28
10% Apple 1-day 2.82 1.33 32
10% HP 1-day 2.80 1.14 31
When we do not take into account time constraints and conduct analysis with discount
size and brand perception factors, we get the results in Table 4.30 and Figure 4.5. As

75
it can be seen in Table 4.30, when the discount is applied to the product, the effect of
the discount size on the customer's buying behavior is more effective than the brand.
So if one of the two factors had to be chosen, focusing on the discount size would have
been much more effective.
According to the interesting results of the analysis shows that: When a 40% discount
is applied to both branded products, it is seen that the discount increases the
consumer’s intent to buy the product brand of Apple MacBook Pro which is higher-
equity and relatively more luxurious brand compared to HP Pavilion. On the other
hand, this is not the case when a 10% discount is applied. When a 10% discount is
applied to the laptop brand of Apple MacBook Pro, which has high brand equity and
a sense of luxury, the customer has a greater intent to purchase this product compared
to the other brand of product, which is HP Pavilion. However, this difference is very
little, and not significant as in the case of 10% discount size.
Table 4.30 Factorial ANOVA Descriptive Statistics for Discount Size and Brand
Name with respect to Willingness to Purchase
Discount Size Brand Name Mean Std. Deviation N
40% Apple 4.58 1.53 148
40% HP 3.93 1.39 73
10% Apple 2.96 1.36 89
10% HP 2.95 1.24 81

76
Figure 4.5 Estimated Marginal Means of Willingness to Purchase with respect to
Brand and Discount Size
If Factorial ANOVA is conducted by using a discount size and time constraint, the
results shown in Table 4.31 and Figure 4.6 are obtained.
The discount size plays a more important role than the time constraint in the customer's
intention to purchase the product created by the sales promotion. A product with a 40%
discount can be sold more than a 10% discount. Considering that the discount size is
a fixed value, the role of time constraint on the impact of sales promotion can be
evaluated.
As a result of this analysis, if a 40% or a 10% discount is applied to the product, the
time limitation of sales promotions is the most effective factor in increasing sales in
both cases. The second most important factor is the 3-day discount and the last one is

77
the 1-day discount. The present study which was conducted with laptops shows that
firstly the size of the discount and secondly the length of the discount period positively
affect the willingness to buy.
Table 4.31 Factorial ANOVA Descriptive Statistics for Discount Size and Time
Constraint with respect to Willingness to Purchase
Discount Size Time Constraint Mean Std. Deviation N
40% time-independent 4.65 1.27 62
40% 3-day 4.28 1.61 104
40% 1-day 4.21 1.56 55
10% time-independent 3.15 1.40 53
10% 3-day 2.94 1.29 54
10% 1-day 2.81 1.23 63

78
Figure 4.6 Estimated Marginal Means of Willingness to Purchase with respect to
Time Constraint and Discount Size
Finally, if we take into account brand perception and time constraints, we get the
results in Table 4.32.
When the consumer's intent to purchase for the discounted product is evaluated in
terms of brand and discount period, it is seen that the brand has a more important role.
The discount on the product of Apple MacBook Pro, which has a higher perceived
brand equity and a higher perception of luxury, increases the consumer's intent to
purchase more dramatically compared with HP Pavilion. On the other hand, when a
comparison is made according to the discount periods for the same brand, the time-
independent discount has the advantage over the application of the discount for a
limited time, and the 3-day discount was found to be more effective than the 1-day
discount.

79
As a result, when a discount is applied to laptops, the brand primarily plays an
important role in increasing the consumer's desire to purchase. Secondly, the duration
of the discount applied is of great importance.
Table 4.32 Factorial ANOVA Descriptive Statistics for Brand Name and Time
Constraint with respect to Willingness to Purchase
Brand Name Time Constraint Mean Std. Deviation N
Apple time-independent 4.19 1.67 71
Apple 3-day 4.03 1.64 109
Apple 1-day 3.60 1.67 57
HP time-independent 3.59 1.19 44
HP 3-day 3.35 1.54 49
HP 1-day 3.34 1.44 61

80
Figure 4.7 Estimated Marginal Means of Willingness to Purchase with respect to
Brand and Time Constraint
4.7. Results
After data screening and cleaning, 391 of the 411 participant data were found suitable
for analysis while 20 out of 411 were dismissed because of inconsistent data. Firstly,
a descriptive statistic was performed and a demographic profile of the participants was
maintained.
Then, the distribution of the answers in the groups was examined and their normality
status was checked. Analysis methods were determined by considering the answers’
normality condition. In the next step, exploratory factor analysis was performed and
the items were classified on a factor basis, and any items that were found to be

81
unnecessary or insufficient were eliminated. Cronbach’s Alpha values were found for
each factor and the reliability of the scales was checked by means of the obtained data.
The analyzes started with perceived brand equity and perceived luxuriousness, which
are independent variables. In section 4.6.1, the Independent t-test was used to measure
and compare the perceived brand equity of two brands (Apple and HP) as the sample
is normally distributed and there are two brands as the subjects of the research. On the
other hand, for the perceived luxuriousness scale, it was found that the sample was not
normally distributed and therefore in section 4.6.2, the Mann-Whitney U test was
applied to the data to measure and compare the perceived luxuriousness of two brands.
Both analyses showed that the Apple brand was perceived to have higher equity and
seemed more luxurious than the HP brand.
In order to test H1a and H1b hypotheses, in section 4.6.3.1, the Mann-Whitney U test
was applied for the scale of the brands’ willingness to purchase, since the sample is
not normally distributed and we there are two brands as subject matter. As a result of
the analysis, a significant difference was observed between the levels of increase in
willingness to purchase two brands. It was seen that the high brand value (Apple) has
a greater effect on increasing sales than the low brand value (HP). As a result, H1a
hypothesis was confirmed. In the test, regarding perceived luxuriousness, there was a
difference between brands in terms of promotion sales, so the H1b hypothesis was
similarly validated.
With the H2 hypothesis, the role of discount size in the effect of sales promotion on
the purchase intention was questioned and the data was analyzed to determine whether
it had a positive impact on this effect. Since the sample is not normally distributed, the
Mann-Whitney U test was performed for this analysis in section 4.6.3.2. Results show
that the discount size has a significant positive effect on the consumer's willingness to
buy. In other words, the higher the discount size, the greater the willingness of the

82
consumer to purchase created by the sales promotions. As a result, the H2 hypothesis
was also confirmed.
In the H3 hypothesis, the effect of the time constraint is concerned and whether the
time constraint creates a change in the purchase intention is questioned. In order to test
this, Kruskal Wallis test was applied in section 4.6.3.3. This test showed that the time
constraint made a significant difference. Moreover, when the discount period
increased, the consumer's willingness to purchase scaled up. So, it can be concluded
that the H3 hypothesis was also confirmed.
In the H4 hypothesis, the combined effect of discount size and time constraint on the
consumer’s willingness to purchase was analyzed. It is seen that their combined effect
does not produce an effect on the consumer’s willingness to purchase. As a result, it is
concluded that our research did not confirm that hypothesis.
Additionally, the combined effects of brand and discount size on willingness to
purchase were examined. We applied Factorial ANOVA to understand how these
dimensions act together on the intent of consumer's purchasing behavior. In addition
to the fact that they have a significant effect on willingness to purchase separately,
their combined effect is significant (Table 4.28). To explain it more, in the case where
the discount size is high, i.e. 40%, the intent of the consumer to buy the brand high-
equity and relatively luxurious brand, which is Apple MacBook Pro, is quite higher
than the low-equity and relatively not luxurious brand, which is HP Pavilion. On the
other hand, in the case where the discount size is low, i.e. 10%, a significant difference
is not seen between Apple MacBook Pro, which is higher-equity and relatively
luxurious brand, compared with HP Pavilion in terms of the intent of the consumer to
buy. As it can be seen in the Table 4.30, when the discount size is 40%, estimated the
marginal mean of the willingness to purchase value was 4.58 for Apple, that value was

83
3.93 for HP. On the other hand, in the case the discount size is 10%, the estimated
marginal means were found to be very close to each other for both brands (Figure 4.5).
After that, the effect of the brand on willingness to purchase is tested by approaching
together with the time constraint factor. We conducted Factorial ANOVA to analyze
the effectiveness of these factors. The results showed that there was not a significant
relationship in terms of willingness to purchase. Similarly, the combined effects of the
brand, discount size, and time constraint on the willingness to purchase of customers
were testified by using Factorial ANOVA in order to see whether the difference is
significant or not. Hence, any significant relationship could not be found.
As a result, as it can be seen in Table 4.33, four of the five hypotheses proposed at the
beginning of the study were confirmed and one of them was not confirmed.

84
Table 4.33 Evaluation of Hypotheses Regarding Analyses
Hypotheses Method Result
H1a
A discount applied to a higher-equity brand
increases the consumer’s intention to buy
more compared with another brand.
Mann-
Whitney U
Test
H1b
A discount applied to a more luxurious
brand increases the consumer’s intention to
buy more compared with another brand.
Mann-
Whitney U
Test
H2 The discount size influences the
consumer’s purchasing behavior positively.
Mann-
Whitney U
Test
H3
The effect of sales promotion on purchase
intention differs with respect to the time-
limit of the promotion.
Kruskal
Wallis Test
H4
The discount size has different effects on a
consumer’s purchase intention of a product
on time-limited and time-independent
discounts.
Factorial
ANOVA

85
CHAPTER 5
5.DISCUSSION AND CONCLUSION
5.1. Discussion of the Results
Several types of research have been conducted over the years in order to understand
how sales promotions influence consumer purchasing behavior (Alvarez & Casielles,
2005; Schultz & Block, 2014; Soni & Verghese, 2018). Some researchers have tried
to compare different promotion techniques and analyzed their results in terms of
purchasing behaviors of consumers (Howell, Lee, & Allenby, 2015; Gong, Huang, &
Goh, 2019). Some authors used different tools in order to determine the effectiveness
of sales promotions tools on consumer behavior (Makienko, 2006; Manalel, Jose, &
Zacharias, 2007). On the other hand, some researchers have conducted their research
by using different promotion techniques and different tools in order to find out the
combined effects of particular factors of sales promotions on purchasing action
(Eisenbeiss, Wilken, Skiera, & Cornelissen, 2015; Kuo & Nakhata, 2016). As a
contribution to those researches, in the present study, we investigated the effects of
sales promotions on willingness to purchase and analyzed them by considering three
factors, brand, time constraint, and discount size, individually and collectively.
The effect of sales promotion on the buying behavior of the consumer has been
investigated in different dimensions by many researchers over time. Looking at a
number of the previous studies, we can see the effect of sales promotion on consumer
buying behavior (Alvares & Casielles, 2005; Blattberg & Neslin, 1990; Gupta 1988;
Santini et al., 2015). More specifically, when we look at the effects of monetary sales
promotions on purchasing behavior, Makienko's (2006) study can be counted
remarkable. The result of this study shows that the consumer's intention to purchase

86
becomes higher when we sell a product with its real price, after increasing and
applying a monetary promotion, rather than selling it to its real price by applying no
action. In other words, instead of selling a product with its actual price, promoting at
a higher price to its actual price is more effective on customers’ purchase intention.
The effect of sales promotions on the consumer's buying behavior cannot be denied
(Blattberg & Neslin, 1990). The brand has a significant impact on consumer’s decision
making as much as the pricing (Kazmi, 2015). For this reason, the role of the brand in
the effect of discount on a product purchase is also debatable and worth being
investigated.
First of all, the role of brand equity on the effectiveness of sales promotions is
investigated. Previously, we have seen different results from sales promotions applied
to products, in relation to brand equity. The study of Chandon, Wansink, and Laurent
(2000) is an example of it. They applied sales promotions both to low-equity and high-
equity products. When a monetary promotion was applied to a utilitarian product, it
was seen that it was much more effective on high-equity brands than low-equity brands
(Chandon, Wansink, & Laurent, 2000). We encountered a similar result in the present
research when we applied a sales promotion, which is also a monetary promotion, to a
utilitarian product, which is a notebook computer (Lu, Liu, & Fang, 2016). We saw
that customers’ willingness to purchase increased for the high-equity brand, which is
Apple MacBook Pro, more than the low-equity brand, which is HP Pavilion.
Additionally, we analyzed the same situation in terms of perceived luxuriousness.
Similarly, sales promotion increased the purchase intention of the buyer for the brand
of Apple MacBook Pro which has a higher perceived luxuriousness than the product
of HP Pavilion.
As a result of this research, as the discount size applied to the luxury brand increased,
a decrease in sales was expected. According to Yeoman (2014), luxury must be

87
expensive, and as it becomes accessible, a paradox emerges. Therefore, in accordance
with Guyon's (as cited in Brun & Castelli, 2013) definition, we are able to explain this
result with the product we have selected as an accessible luxury.
When examining the effect of sales promotion on the consumer's purchasing intention,
another factor that can be taken into account should be the size of the discounts. When
the previous studies on this subject are examined, it is seen that the role of the discount
size in the promotion of the consumer's intent to purchase can vary. For example,
according to Lee and Chen-Yu (2018), when the consumer meets the discount, there
will be a perception of monetary saving according to the consumer and an increase in
the consumer's intent to purchase may arise. On the other hand, as the discount size
increases, customers may think they will face lower product quality, although the idea
of greater monetary savings occurs.
On the other hand, if we look at the psychological effects of sales promotions on the
consumer ideas, Honea, and Dahl (2005) argued that as the price discount increases,
positive emotional effects such as happiness, pleasure, excitement, satisfaction
increase. Additionally, according to Schindler (1998), behavioral positive emotions
resulting from a reduction may outweigh positive emotions provided economically. In
other words, the positive emotional impact of benefiting from discounts rather than the
desire to save economically can lead to an increase in the intent to buy. These positive
feelings are expected to increase as the discount size increases.
When the effect of the discount size on the purchase intention of the consumer was
measured for our product and in our sample, a positive relationship was observed
between the size of the discount and the purchase intention of the consumer. The
purchase intention of the consumer arising from the 40% discount offered to the
product was considerably higher than the consumer's intention to purchase for the 10%
discount.

88
When the previous studies were examined, it is seen that researches have been
conducted about sales restrictions such as time, place, or the number of units of the
product available for sale in order to measure their effects on consumer behavior. As
mentioned in commodity theory (Brock, 1968) and unavailability theory (Folger,
1992; Inman, et al., 1997; Lynn, 1991), an intuitive perception, that the product is more
valuable and indispensable, occurs and it positively affects the customer's purchasing
behavior. Brock (1968) stated that “any commodity will be valued to the extent that it
is unavailable” (p. 246). Cialdini (1999) similarly argued that “people find objects and
opportunities more attractive to the degree that they are scarce, rare, or dwindling in
availability.” (p. 92).
Contrary to the results obtained in these past researches, in the present study, the effect
of time constraint on the purchase of a discounted product was found to be negative.
The longer the discount was available, the greater the consumer's intent to purchase.
Although the time constraint has made an impact for the customer to feel that the
product is valuable and indispensable; a situation at which the offer is not restricted
with time, the comfort of the customer and making more confident decisions
suppressed the indispensability of that product as s/he knew that s/he had time to think.
Additionally, the reason for this reaction of consumers may be related to our choice of
product type. When someone buys a laptop, unlike some other product types such as
FMCG (Karthikeyan & Natarajan, 2013), forcing the consumer to make a quick
decision may have the opposite effect and decreases the willingness to buy contrarily.
As there are a lot of qualitative and quantitative features that need to be considered for
choosing the laptop computer, it requires long thinking, research, and analysis process
to choose the right computer (Srichetta & Thurachon, 2012).
When the composite effects of variables for willingness to purchase are checked,
different results may be encountered. Some researches were conducted by handling

89
the combined effect of time constraint and discount size on willingness to purchase.
To illustrate, when the discount is short-term, even a small discount is effective in
increasing the consumer's intention to purchase. While the discount period is relatively
long, a small discount is not sufficient to determine the customer's purchase decision
(Kuo & Nakhata, 2016). Furthermore, Eisenbeiss, Wilken, Skiera, and Cornelissen
(2015) measured the effect of discount level and time constraint on the willingness to
purchase due to sales promotion. They carried out studies on two different product
types and obtained different results depending on whether the product type is utilitarian
and hedonic. For hedonic products, the time constraint is more effective than discount
size to increase willingness to purchase. However, when the same discounts were
applied to a utilitarian product, the effect of the discount size in terms of increasing
willingness to purchase was greater than the time constraint (Eisenbeiss, Wilken,
Skiera, & Cornelissen, 2015).
In the present thesis, we handled all the factors two by two, and at the final all at once.
When we investigate the brand effect and the size of the discount together, we had the
result in which their combined effect was significant. In other words, for different sizes
of discounts, effects of perceived brand equity and perceived luxuriousness varied. In
the situation of the high size of the discount, for the high-equity brand which is Apple
MacBook Pro, the higher customers’ purchase intention occurred, compared with HP
Pavilion. On the other hand, in the small size of discount situation, the effect of the
brand is not significant. In other words, when the discount size was 10% there was no
significant difference between the two brands in terms of purchasing intention of
customers (Table 4.30).
We did not have any significant difference between different combinations of the
brand and the time constraint options. Similarly, discount size and time constraints did
not create a significant difference in terms of their combined effect. Finally, brand,
discount size, and time constraint factors did not have any significant effect together.

90
Furthermore, we analyzed all the data in terms of 12 cases separately by conducting
Factorial ANOVA. We sorted the estimated marginal means of willingness to purchase
from top to bottom (Table 4.29). As a result, we obtained an interesting picture. The
table showed that the most effective factor was the discount size for promotions on
willingness to purchase because the largest six values in the 12 cases belonged to cases
of 40% discount size. When we investigated these six cases, we saw that the second
most important factor was the brand choice in terms of the effectiveness of the
promotions on willingness to purchase because the largest three values belonged to the
cases of Apple. Finally, when we check the three columns for the first six cases, we
realized that the biggest estimated marginal means belonged to time-independent
cases. The possible reason for that was that for the time-independent case, we did not
use any statement about time constraints. Because of that, although customers did not
feel any time urgency, there was no certainty about time and they did not know when
the offer would end. Hence, this uncertainty created more pressure on the customer
than time urgency.
When we handle the second half of Table 4.29, we came across a different view. For
the cases with the smallest six estimated marginal means, we had different results. The
discount size was 10% for these six cases so we actually compared the results in terms
of the combined effect of brand and time constraints. At this point, we saw that the
estimated marginal mean values were very close to each other because there was not a
significant combined effect of brand and time constraints. As it can be seen in Table
4.28, the significance of Time*Brand was .646, which is lower than the threshold level.
Additionally, when we compare the results of Table 4.29 with the results in Table 4.30,
Table 4.31, and Table 4.32; we see different results. The possible reason is that these
four tables were constructed by using different data groups and the sample sizes of
those groups were not the same. For example, when we were constructing Table 4.29,
we handled all the cases separately, but we divided the data into four groups with

91
respect to brand and discount size situations for Table 4.30. These groups were as
follows:
{{𝑐𝑎𝑠𝑒 1, 𝑐𝑎𝑠𝑒 2, 𝑐𝑎𝑠𝑒 3}, {𝑐𝑎𝑠𝑒 4, 𝑐𝑎𝑠𝑒 5, 𝑐𝑎𝑠𝑒 6},
{𝑐𝑎𝑠𝑒 7, 𝑐𝑎𝑠𝑒 8, 𝑐𝑎𝑠𝑒 9}, {𝑐𝑎𝑠𝑒 10, 𝑐𝑎𝑠𝑒 11, 𝑐𝑎𝑠𝑒12}}
For Table 4.31, we used the following six groups of cases:
{{𝑐𝑎𝑠𝑒 1, 𝑐𝑎𝑠𝑒 4}, {𝑐𝑎𝑠𝑒 2, 𝑐𝑎𝑠𝑒 5}, {𝑐𝑎𝑠𝑒 3, 𝑐𝑎𝑠𝑒 6},
{𝑐𝑎𝑠𝑒 7, 𝑐𝑎𝑠𝑒 10}, {𝑐𝑎𝑠𝑒 8, 𝑐𝑎𝑠𝑒 11}, {𝑐𝑎𝑠𝑒 9, 𝑐𝑎𝑠𝑒 12}}
Finally, for Table 4.32, we used the following six groups of cases:
{{𝑐𝑎𝑠𝑒 1, 𝑐𝑎𝑠𝑒 7}, {𝑐𝑎𝑠𝑒 2, 𝑐𝑎𝑠𝑒 8}, {𝑐𝑎𝑠𝑒 3, 𝑐𝑎𝑠𝑒 9},
{𝑐𝑎𝑠𝑒 4, 𝑐𝑎𝑠𝑒 10}, {𝑐𝑎𝑠𝑒 5, 𝑐𝑎𝑠𝑒 11}, {𝑐𝑎𝑠𝑒 6, 𝑐𝑎𝑠𝑒 12}}
5.2. Contributions of the Study
Although there are many pieces of research about the effects of sales promotions on
consumer’s willingness to purchase, these effects have been evaluated from different
points of view, in the present thesis.
First of all, the role of brand equity and perceived luxuriousness in this effect was
found to be worth investigating. Chandon et al. (2000) applied a monetary promotion
to a utilitarian product and found that sales promotion was more effective for a high-
equity brand than a low-equity brand. In the present study, we have obtained a result
that supports it and by strengthening the previous findings, the thesis made a
contribution to the literature.

92
Similarly, sales promotion was found to be more effective for the brand which is
relatively more luxurious, and the customer's willingness to buy that product to be
higher than the other brand. When literature studies were evaluated, this was not an
expected result. Considering the general definition of luxury, sales promotion could
not always be expected to be successful in a luxury product. Yeoman (2014) claimed
that a luxury product should have been expensive, and as the product was discounted
and made accessible, a paradox occurred. Therefore, we could only explain the result
for this product being an accessible luxury product. Because accessible luxury was
defined as low-priced versions of products that only a segment can obtain a limited
number of (Guyon, 2004). As a result of the present research, we have seen that the
monetary promotions applied for accessible luxury products increase the consumer's
willingness to purchase, and hence we have made a valuable contribution to the
literature.
In the next stage, when we examined the effect of discount size, we found that when
the discount size was chosen higher, the effect of sales promotion on the consumer's
willingness to purchase became higher. Considering the study of Honea and Dahl
(2005), we concluded that increment of the positive feelings of the customer due to the
increase in discount size may be related to this result. However, we deduced that the
discount size factor could have different effects on different brands, which may be
related to brand equity. In other words, as the discount size applied to a product of a
high-equity brand was increased, the consumer's willingness to purchase increased
more, compared with the situation of the same condition was applied to a product of a
low-equity brand.
Additionally, as Chandon et al. (2000) pointed out in his research, sales promotions
were known to be more effective for high-equity brands, and in our study, this result
was valid for the 40% discount case. On the other hand, when a 10% discount was
applied, the high-equity brand did not make a significant difference from the low-

93
equity brand. As a result, the role of brand equity on the impact of sales promotion on
purchasing behavior did not always the same. To illustrate, only when the discount
was above a certain size, different brands could be affected differently by the discount,
and this difference could be associated with brand equity.
The last and even the most important factor discussed in the study was the time
constraint. With reference to previous studies, the time constraint of sales promotion
would have been expected to have a positive impact on the increase in consumer's
willingness to purchase. Brock (1968) and Cialdini (1999) claimed that the short-term
discount was expected to look more attractive and increase the customer's willingness
to purchase the product, in relation to the scarcity of the product. But it was not the
result of our study. As time constraints increased, the customer's intent to benefit from
sales promotion, in other words, willingness to purchase the discounted product
decreased. It was due to the fact that the product group offered to the customer with a
discount in our study was not qualified to be purchased in a short time and was not a
fast consuming product. In addition, one could not force the customer to make a quick
purchase decision for a laptop (Karthikeyan & Natarajan, 2013). Indeed, as Srichetta
and Thurachon (2012) asserted, buying a laptop required a long-term process of
thinking, research, and analysis.
As a result, in the present study, we have found that the time constraint of a sales
promotion does not have the same effect on every product in terms of consumers’
purchasing behavior.
With the present thesis, by contributing to the studies carried out in the academic field;
in addition to supporting some of the previously identified situations, we aimed to
provide a new point of view that has not been emphasized before. In addition, we
aimed to provide new perspectives for brand managers and decision-makers, and to
contribute to the application of promotion tools more effectively, taking into account
94
the brand and product characteristics, and through right discount sizes and time
constraints.
5.3. Limitations
Although the research process was meticulously planned and realized, there were
inevitably several limitations. The first limitation was about the sample. The aim of
the study was to conduct a study on a group of participants who had to use computers
actively and who were often dabbling in computers. For this reason, university
students, IT sector employees or people who previously worked in the IT sector were
identified as the target audience. In application, the survey group was asked to people
same in quantity to provide a balanced number of participation as much as possible.
This balance could be achieved for gender and working status but not for the education
level of the participants. Although it was ensured that the participants were at least
high school graduates, they were composed of participants groups with different sizes
from five different educational levels. In addition, although 18-year old and older
participants were targeted, no upper limit was set and the range of age of the
participants was quite wide which is between 18-77. These two conditions were
ignored in order to find whether the participants fit the profile defined in the beginning.
The second limitation is about the distribution of data according to the questionnaire
number. Although 12 questionnaires were distributed randomly to the participants in
the field, unfortunately the uniform distribution could not be maintained for online
participants. While shared on the online platform, the questionnaires were numbered
from 1 to 12 and the participants were asked to fill out one of those numbered
questionnaires. On the first shared online platform, a result in Figure 5.1 was
encountered.
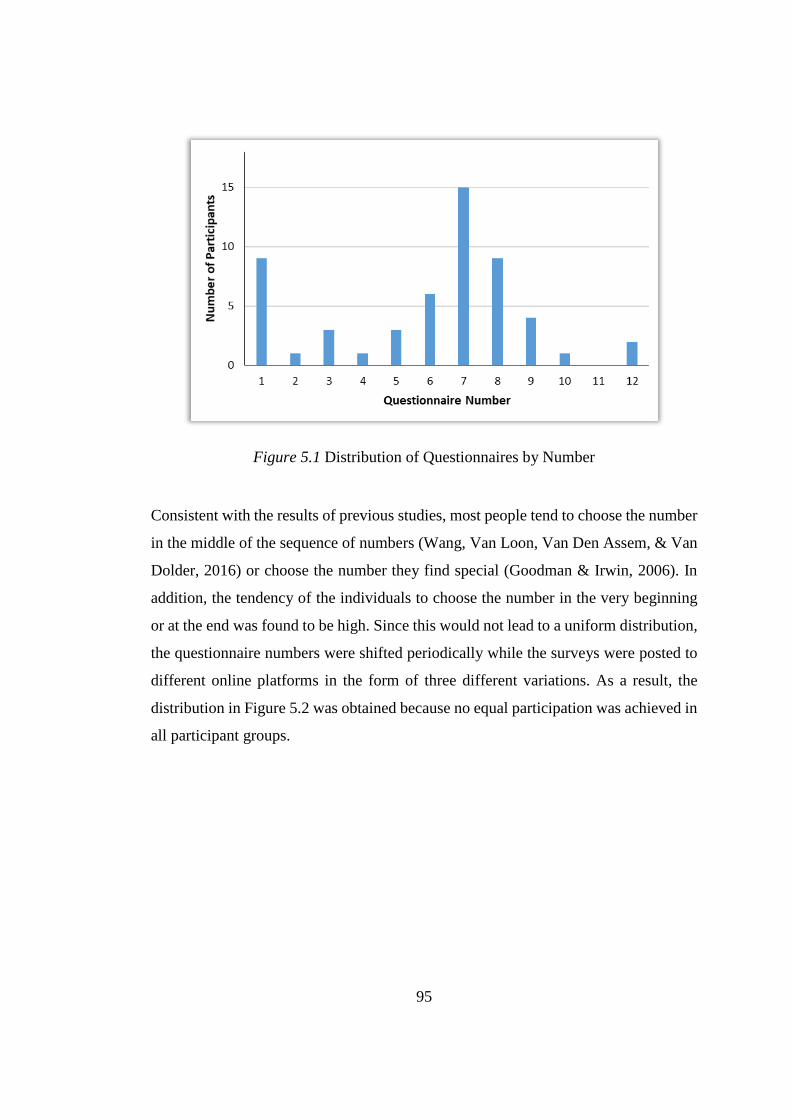
95
Figure 5.1 Distribution of Questionnaires by Number
Consistent with the results of previous studies, most people tend to choose the number
in the middle of the sequence of numbers (Wang, Van Loon, Van Den Assem, & Van
Dolder, 2016) or choose the number they find special (Goodman & Irwin, 2006). In
addition, the tendency of the individuals to choose the number in the very beginning
or at the end was found to be high. Since this would not lead to a uniform distribution,
the questionnaire numbers were shifted periodically while the surveys were posted to
different online platforms in the form of three different variations. As a result, the
distribution in Figure 5.2 was obtained because no equal participation was achieved in
all participant groups.

96
Figure 5.2 The Final Distribution of Questionnaires by Number
Thirdly, for the research design, the very well-known brands of technological devices
in Turkey were chosen. The products with low brand equity may also be preferred to
answer the research question of the present study. On the other hand, as it can be seen
in the previous articles in the field (Dhar & Nowlis, 1999; De Barnier, Falcy, &
Valette-Florence, 2012; Srcihetta & Thurachon, 2012), the most known brands are
generally determined to conclude the research.
Lastly, there were some survey participants who find the use of well-known brands in
the survey irritating. They told that this research may be sponsored by the companies
in the survey. Contrastly, since the consumers can instantly recognize the brands and
make decisions consciously, the marketers have also used famous brands to conduct
their research (Srcihetta & Thurachon, 2012).

97
5.4. Suggestions for Future Research
It is suggested to apply the survey to a sample in a different location with a different
demography. The professions of the participants may change or the respondents may
also include the people who do not use PC as frequently as the current respondents or
the education level of the participants may be lower.
In addition, another promotion tool may be selected for further studies. Nonmonetary
tools such as free gift can be given as an example. On the other hand, these
aforementioned approaches can be applied simultaneously. The results may be
compared when the free gift and discount are provided with the same product.
Lastly, different product groups may be chosen such as FMCG. Packaged food would
be a good candidate product for new research. Moreover, as it was mentioned before,
the researchers such as Chandon, Wansink, & Laurent (2000) studied the utilitarian
and hedonic products. For the next time, alternatively, hedonic products can be used
in a similar concept and the results of the time constraints of sales promotions on the
intention of purchasing the hedonic products can be compared to the utilitarian
products.

98
REFERENCES
Aggarwal, P., & Vaidyanathan, R. (2003). Use it or lose it: purchase acceleration
effects of time-limited promotions. Journal of Consumer Behaviour, 2(4).
Ailawadi, K. L., Lehmann, D. R., & Neslin, S. A. (2003). Revenue premium as an
outcome measure of brand equity. Journal of Marketing, 67(Oct2003), pp. 1-
17.
Akaichi, F., Nayga, R. M., & Gill, J. M. (2015). Effect of price-discount distribution
in multi-unit price promotions on consumers’ willingness to pay, sales value,
and retailers’ revenue. Agribusiness, 31(1), pp. 14-32. doi:10.1002/agr.21389
Albaum, G. (1997). The Likert scale revisited. International Journal of Market
Research, 39(2), pp. 1-21.
Alvarez, B. A., & Casielles, R. V. (2005). Consumer evaluations of sales promotion:
the effect on brand choice. European Journal of Marketing, 39(1/2), pp. 54-70.
doi:10.1108/03090560510572016
Babbie, E. (1991). Survey research methods. Belmont, CA: Wadsworth.
Balcı, A. (2018). Sosyal bilimlerde araştırma: yöntem, teknik ve ilkeler. Ankara:
Pegem Akademi. doi:10.14527/9789756802403
Beverland, M. (2006). The freal thing: Branding authenticity in the luxury wine trade.
Journal of Business Research, 59(2006), pp. 251-258.
doi:10.1016/j.jbusres.2005.04.007

99
Blattberg, R. C., & Neslin, S. (1990). Sales promotion concepts, methods, and
strategies. New Jersey: Prentice Hall.
Blattberg, R. C., Blattberg, R. C., Briesch, R., & Fox, E. J. (1995). How promotions
work. Marketing Science, 14(3), pp. G122-G132. Retrieved from
http://dx.doi.org/10.1287/mksc.14.3.G122
Boone, H. N., & Boone, D. A. (2012). Analyzing Likert data. Journal of Extension,
50(2), pp. 1-5. Retrieved from
http://www.joe.org/joe/2012april/tt2p.shtml[8/20/2012 9:07:48 AM]
Brock, T. C. (1968). Implications of commodity theory for value change.
Psychological Foundations of Attitudes, 1968, pp. 243-275.
Brucks, M., & Zeithaml, V. A. (1991). Price and brand name as indicators of quality
dimensions, report number 91-130. Cambridge, MA: Marketing Science
Institute.
Brun, A., & Castelli, C. (2013). The nature of luxury: a consumer perspective.
International Journal of Retail and Distribution Management, 41(11/12), pp.
823-847. doi:10.1108/IJRDM-01-2013-0006
Chandon, P., Wansink, B., & Laurent, G. (2000). A benefit congruency framework of
sales promotion effectiveness. Journal of Marketing, 64(2000), pp. 65-81.
Cialdini, R. B. (1999). Of tricks and tumors: some little-recognized costs of dishonest
use of effective social influence. Psychology & Marketing, 16(2), pp. 91-98.

100
Clow, K. E., & Baack, D. (2014). Integrated advertising promotion and marketing
communications. Upper Saddle River, New Jersey: Pearson Education, Inc.
Creswell, J. W. (2013). Research design: Qualitative, quantitative, and mixed methods
approaches. Thousand Oaks, California: Sage Publications.
De Barnier, V., Falcy, S., & Valette-Florence, P. (2012). Do consumers perceive three
levels of luxury? A comparison of accessible, intermediate and inaccessible
luxury brands. Journal of Brand Management, 19(7), pp. 623-636.
doi:10.1057/bm.2012.11
Devlin, J., Ennew, C., McKechnie, S., & Smith, A. (2007). A study of time limited
price promotions. Journal of Product & Brand Management, 16(4), pp. 280 -
285. Retrieved from http://dx.doi.org/10.1108/10610420710763967
Dhar, R., & Nowlis, S. M. (1999). The effect of time pressure on consumer choice
deferral. Journal of Consumer Research, 25(1999), pp. 369-384.
Dubois, B., Laurent, G., & Czellar, S. (2001). Consumer rapport to luxury: analyzing
complex and ambivalent attitudes. HEC Research Papers Series, 736, pp. 1-
56.
Eisenbeiss, M., Wilken, R., Skiera, B., & Cornelissen, M. (2015). What makes deal-
of-the-day promotions really effective? The interplay of discount and time
constraint with product type. International Journal of Research in Marketing,
32(2015), pp. 387-397. Retrieved from
http://dx.doi.org/10.1016/j.ijresmar.2015.05.007

101
Erdem, T., & Swait, J. (1998). Brand equity as a signaling phenomenon. Journal of
Consumer Psychology, 7(2), pp. 131-157.
Erickson, G. M., & Johansson, J. K. (1985). The role of price in multi-attribute product
evaluations. Journal of Consumer Research, 12(1985), pp. 195-199.
Brand Finance (2019). Brand Finance Global 500. Retrieved from
https://www2.deloitte.com/content/dam/Deloitte/cn/Documents/about-
deloitte/deloitte-cn-global-500-2019-en-190215.pdf
Fink, A. (1995). The survey handbook. Thousand Oaks, CA: Sage Publications.
Folger, R. (1992). On wanting what we do not have. Basic and Applied Social
Psychology, 13(1), pp. 123-133.
Fowler, F. J. (1992). Survey research methods. Thousand Oaks, CA: Sage
Publications.
Gilbert, D. (2003). Retail marketing management. London, England: Financial Times-
Prentice Hall.
Gong, H., Huang, J., & Goh, K. H. (2019). The illusion of double-discount: using
reference points in promotion framing. Journal of Consumer Psychology, pp.
1-9. doi:10.1002/jcpy.1102
Goodman, J. K., & Irwin, J. R. (2006). Special random numbers: Beyond the illusion
of control. Organizational Behavior and Human Decision Processes,
99(2006), pp. 161-174.

102
Gupta, S. (1988). Impact of sales promotions on when, what, and how much to buy.
Journal of Marketing Research, 25(1988), pp. 342-355. Retrieved from
http://www.jstor.org/stable/3172945
Guyon, J. (2004). The magic touch. Fortune, 150(4), pp. 34-39.
Hair, J. J., Black, W. C., Babin, B. J., & Anderson, R. E. (2014). Multivariate data
analysis. New Jersey: Pearson.
Hasnain, S., & Kazmi, A. (2015). Developments in promotion strategies: review on
psychological streams of consumers. Munich Personal RePEc Archive, 7(3),
pp. 1-12. Retrieved from http://dx.doi.org/10.5539/ijms.v7n3p129
Honea, H., & Dahl, D. W. (2005). The promotion affect scale: defining the affective
dimensions of promotion. Journal of Business Research, 58(2005), pp. 543-
551. doi:10.1016/S0148-2963(03)00145-0
Howell, J. R., Lee, S., & Allenby, G. M. (2015). Price promotions in choice models.
Marketing Science, 35(2), pp. 1-16. doi:10.1086/209494
IBM Corp. Released 2017. IBM SPSS Statistics for Windows, Version 25.0. Armonk,
NY: IBM Corp.
Inman, J. J., Peter, A. C., & Raghubir, P. (1997). Framing the deal: the role of
restrictions in accentuating deal value. Journal of Consumer Research , 24(1),
pp. 68-79.
Kamakura, W. A., & Russell, G. J. (1991). Measuring brand value with scanner data.
International Journal of Research in Marketing, 10(1993), pp. 9-22.

103
Kamakura, W. A., & Russell, G. J. (1991). Measuring consumer perceptions of brand
quality with scanner data: Implications for brand equity, report number 91-
122. Cambridge, MA: Marketing Science Institute.
Kapferer, J. -N. (1998). Why are we seduced by luxury brands? The Journal of Brand
Management, 6(1), pp. 44-49.
Karthikeyan, B., & Natarajan, P. (2013). Impact of Sales Promotion Techniques on
Consumers towards FMCG. International Research Journal of Business and
Management, 5(2013), pp. 128-135.
Keller, K. L. (2009). Managing the growth tradeoff: Challenges and opportunities in
luxury branding. Journal of Brand Management, 16(5/6), pp. 290-301.
doi:10.1057/bm.2008.47
Keller, K. L. (2012). Strategic brand management: Building, measuring, and
managing brand equity. London, England: Prentice Hall.
Kim, H. -Y. (2013). Statistical notes for clinical researchers: assessing normal
distribution (2) using skewness and kurtosis. Restorative Dentistry &
Endodontics, 38(1), pp. 52-54. Retrieved from
http://dx.doi.org/10.5395/rde.2013.38.1.52
Kotler, P. T., & Armstrong, G. (2017). Principles of marketing. London, England:
Pearson.
Kotler, P. T., & Keller, K. L. (2016). A framework for marketing management.
London, England: Pearson.

104
Kuo, H. -C., & Nakhata, C. (2016). Price promotions and products with low consumer
ratings. Journal of Consumer Marketing, 33(7), pp. 517-527. Retrieved from
http://dx.doi.org/10.1108/JCM-04-2016-1767
Lassar, W., Mittal, B., & Sharma, A. (1995). Measuring customer-based brand equity.
Journal of Consumer Marketing, 12(4), pp. 11-19. Retrieved from
https://doi.org/10.1108/07363769510095270
Lee, J. E., & Chen-Yu, J. H. (2018). Effects of price discount on consumers’
perceptions of savings, quality, and value for apparel products: mediating
effect of price discount affect. Fashion and Textiles, 5(13), pp. 1-21. Retrieved
from https://doi.org/10.1186/s40691-018-0128-2
Likert, R. (1932). A technique for the measurement of attitudes. Archives of
Psychology, 22(140), pp. 5-55.
Lu, J., Liu, Z., & Fang, Z. (2016). Hedonic products for you, utilitarian products for
me. Judgement and Decision Making, 11(4), pp. 332-341.
Lynn, M. (1991). Scarcity effects on value: a quantitative review of the commodity
theory literature. Psychology & Marketing, 81(1), pp. 43-57.
Makienko, I. (2006). Too good to be true vs. too high to be good: The role of product’s
price and form of ıncentive in sales promotion evaluations. Advances in
Consumer Research, 33, pp. 330-331.
Manalel, J., Jose, M. C., & Zacharias, S. (2007). Sales Promotions – Good or Bad?
International Marketing Conference on Marketing & Society, pp. 325-329.

105
Martin, G. S., & Brown, T. J. (1990). Marketing theory and applications. Chicago, IL:
American Marketing Association.
McCracken, G. (2005). Culture and Consumption II: Markets, Meaning and Brand
Management. Bloomington: Indiana University Press.
Morrison, M. (2014). Best practices: how to create a limited time offer. Advertising
Age. Retrieved from http://adage.com/article/bestpractices/practicescreatea-
limitedtimeoffer/294230/
Mussol, S., Aurier, P., & Lanauze, G. S. (2019). Developing in-store brand strategies
and relational expression through sales promotions. Journal of Retailing and
Consumer Services, 47(2019), pp. 241–250. Retrieved from
https://doi.org/10.1016/j.jretconser.2018.11.020
Nueno, J. L., & Quelch, J. A. (1998). The mass marketing of luxury. Business
Horizons, 41(6), pp. 61-68. Retrieved from https://doi.org/10.1016/S0007-
6813(98)90023-4
Okonkwo, U. (2007). Luxury fashion branding: trends, tactics, techniques. New York,
NY: Palgrave Macmillan.
Park, C. S., & Srinivasan, V. (1994). A survey-based method for measuring and
understanding brand equity and its extendibility. Journal of Marketing
Research, 31(5), pp. 271-288.
Rensis Likert: American Social Scientist. (n.d.). Retrieved from Encyclopaedia
Brittanica: https://www.britannica.com/biography/Rensis-Likert

106
Roll, O., & Pfeiffer, E. (2017). Are your consumers variety seekers? The moderating
impact on the effectiveness of free gift promotions vs. price discounts. The
International Review of Retail, Distribution and Consumer Research, 27(4),
pp.352-368. Retrieved from https://doi.org/10.1080/09593969.2017.1299781
Santini, F. O., Sampaio, C. H., Perin, M. G., & Vieira, V. A. (2015). An analysis of
the influence of discount sales promotion in consumer buying intent and the
moderating effects of attractiveness. Revista de Administração, 50(4), pp. 416-
431. doi:10.5700/rausp1210
Schindler, R. M. (1998). Consequences of perceiving oneself as responsible for
obtaining a discount: evidence for smart-shopper feelings. Journal of
Consumer Psychology, 7(4), pp. 371-392.
Schmitt, B. (2012). The consumer psychology of brands. Journal of Consumer
Psychology, 22(2012), pp. 7-17.
Schultz, D. E., & Block, M. P. (2014). Sales promotion influencing consumer brand
preferences/purchases. Journal of Consumer Marketing, 31(3), pp. 212-217.
doi:10.1108/JCM-01-2014-0822
Shi, Y. -Z., Cheung, K. -M., & Prendergast, G. (2005). Behavioural response to sales
promotion tools. International Journal of Advertising, 24(4), pp. 469-489.
Retrieved from http://dx.doi.org/10.1080/02650487.2005.11072939
Sinha, S. K., & Verma, P. (2017). Consumer’s response towards non-monetary and
monetary sales promotion: a review and future research directions.
International Journal of Economic Perspectives, 11(2), pp. 500-507.

107
Soni, N., & Verghese, M. (2018). Analyzing the impact of online brand trust on sales
promotion and online buying decision. The IUP Journal of Marketing
Management, 17(3), pp. 7-24.
Srichetta, P., & Thurachon, W. (2012). Applying fuzzy analytic hierarchy process to
evaluate and select product of notebook computers. International Journal of
Modeling and Optimization, 2(2), pp. 168-173.
Teng, C. -I., & Huang, L. -S. (2007). Designing time-limited cyber promotions: effects
of time limit and involvement. Cyberpsychology & Behavior, 10(1), pp. 141-
144. doi:10.1089/cpb.2006.9979
Thomas, D. (2008). Deluxe: how luxury lost its luster. London: Penguin Books.
TrendForce. (2018, 11 20). Global Notebook Shipments to Increase Slightly by 3.9%
QoQ in 3Q18, Lower than Expected due to Intel CPU Shortage, Says
TrendForce. Retrieved from TrendForce:
https://press.trendforce.com/press/20181120-3181.html
TrendForce. (2019, 5 9). Global Notebook Market 1Q Not So Bleak After All, Thanks
to Excellent Shipment Performance by American Brands, Says TrendForce.
Retrieved from TrendForce: https://press.trendforce.com/press/20190509-
3240.html
Van Putten, M., Zeelenberg, M., & Van Dijk, E. (2013). How consumers deal with
missed discounts: Transaction decoupling, action orientation and inaction
inertia. Journal of Economic Psychology, 38(2013), pp. 104-110. Retrieved
from http://dx.doi.org/10.1016/j.joep.2012.09.008

108
Vickers, J. S., & Renand, F. (2003). The marketing of luxury goods: An exploratory
study - three conceptual dimensions. The Marketing Review, 3(4), pp. 459-478.
Vigneron, F., & Johnson, L. (1999). A review and a conceptual framework of prestige-
seeking consumer behaviour. Academy of Marketing Science Rewiew, 3(1), pp.
1-17.
Wang, T. V., Van Loon, R. D., Van Den Assem, M. J., & Van Dolder, D. (2016).
Number Preferences in Lotteries. Judgment and Decision Making, 11(3), pp.
243-259. doi:11. 243-259. 10.2139/ssrn.2657776
Woodside, A. G., & Waddle, G. L. (1975). Sales effects of in-store advertising.
Journal of Advertising Research, 15(3), pp. 29-33.
Yeoman, I. (2014). Luxury. Journal of Revenue and Pricing Management, 13(1), p.
12. doi:10.1057/rpm.2013.45
Zamir, E. (2014). Law, psychology, and morality: The role of loss aversion.
Oxford,UK: Oxford University Press.

109
APPENDICES
A. APPROVAL OF METU HUMAN SUBJECTS ETHICS COMMITTEE

110
B. QUESTIONNAIRES IN ENGLISH
Questionnaire No. 1
VOLUNTEER PARTICIPATION FORM
This research is carried out by Eda Ceren Güngör, a graduate student of the METU Business
Administration Department, under the supervision of Prof. Dr. Cengiz Yılmaz. This form is
designed to inform you about the research conditions.
What is the purpose of the study?
This survey is designed to measure the impact of the duration of sales promotions applied to
products on marketing management to the consumer's buying behavior.
How do we ask you to help us?
We expect you to answer a survey of 57 questions. The first seven questions are demographic
information and the next questions are for a given brand. If you want to be informed after the
study, you can write your e-mail address.
How will we use the information we collect from you?
Your participation in the research must be entirely voluntary. No information is required from
you in determining the identity or the institution. Your answers will be kept completely
confidential and will only be evaluated by the researchers. The information obtained from the
participants will be evaluated collectively and used in scientific publications.
What You Need to Know About Your Participation
In general, the questionnaire does not contain any questions or practices that may cause
personal discomfort. However, if you feel uncomfortable for questions or any other reason
during participation, you are free to interrupt the survey.
If You Want to Learn More About the Research
Thank you in advance for participating in this study. For more information about the study,
please contact Eda Ceren Güngör (e-mail: [email protected]).
Your e-mail address (not compulsory): ____________________

111
1st Part: Demographic Questions
Age? _______________________
Gender? Female ☐ Male ☐ Other ☐
Marital Status? Single ☐ Married ☐ Divorced ☐ Widowed ☐
Education Status? (Please answer this question based on the highest level of education you
have completed.)
Literate ☐ Primary/Secondary School Graduate ☐ High School Graduate ☐
Associate Degree ☐ Bachelor’s Degree ☐ Master’s Degree ☐ Doctorate Degree ☐
Working Status?
Public Employee ☐ Private Sector Employee ☐ Out of Work ☐ Student ☐
Monthly Household Income? (Please answer this question if you work.) _______________
Monthly Disposable Income? (Please answer this question if you do not work.)
_______________
2nd Part: Product Evaluation
In this part, we are asking questions about the Apple MacBook Pro1 series laptops in order to
figure out your opinions about the brand. Please answer the following questions on the scale
from 1 to 7.
Strongly Neutral
Strongly
Disagree Agree
1 2 3 4 5 6 7
From this brand of a notebook
computer, I can expect superior
performance.
◯ ◯ ◯ ◯ ◯ ◯ ◯
This is an outstanding brand. ◯ ◯ ◯ ◯ ◯ ◯ ◯
1 In questionnaires number of 1, 2, 3, 7, 8, and 9, Apple MacBook Pro; in questionnaires number of 4,
5, 6, 10, 11, and 12, HP Pavilion were identified as the brand of laptop to be evaluated.

112
Strongly Neutral
Strongly
Disagree Agree
1 2 3 4 5 6 7
In its status and style, this brand
matches my personality. ◯ ◯ ◯ ◯ ◯ ◯ ◯
With time, I will develop a warm
feeling toward this brand of a notebook
computer.
◯ ◯ ◯ ◯ ◯ ◯ ◯
This is a very expensive brand. ◯ ◯ ◯ ◯ ◯ ◯ ◯
This brand is for refined people. ◯ ◯ ◯ ◯ ◯ ◯ ◯
Not many people own this brand. ◯ ◯ ◯ ◯ ◯ ◯ ◯
For this brand of a notebook computer,
I have positive personal feelings. ◯ ◯ ◯ ◯ ◯ ◯ ◯
This brand of the notebook computer is
useful. ◯ ◯ ◯ ◯ ◯ ◯ ◯
People who own this brand have good
taste. ◯ ◯ ◯ ◯ ◯ ◯ ◯
This brand will work very well. ◯ ◯ ◯ ◯ ◯ ◯ ◯
This brand of notebook computer fits
my personality. ◯ ◯ ◯ ◯ ◯ ◯ ◯
This brand of notebook computer will
be well regarded by my friends. ◯ ◯ ◯ ◯ ◯ ◯ ◯
This brand is well priced. ◯ ◯ ◯ ◯ ◯ ◯ ◯
This is a select brand. ◯ ◯ ◯ ◯ ◯ ◯ ◯
It is a real pleasure to own this brand. ◯ ◯ ◯ ◯ ◯ ◯ ◯

113
Strongly Neutral
Strongly
Disagree Agree
1 2 3 4 5 6 7
I do not recommend this brand to
others. ◯ ◯ ◯ ◯ ◯ ◯ ◯
I consider this brand of the notebook
computer to be a bargain because of the
benefits I receive.
◯ ◯ ◯ ◯ ◯ ◯ ◯
Owning this brand lets me differentiate
myself from other people. ◯ ◯ ◯ ◯ ◯ ◯ ◯
This brand is aesthetic. ◯ ◯ ◯ ◯ ◯ ◯ ◯
Notebook computers of this brand are
overpriced. ◯ ◯ ◯ ◯ ◯ ◯ ◯
I consider the company and the people
who stand behind these notebook
computers to be very trustworthy.
◯ ◯ ◯ ◯ ◯ ◯ ◯
This brand makes life more beautiful. ◯ ◯ ◯ ◯ ◯ ◯ ◯
I would be proud to own a notebook
computer with this brand. ◯ ◯ ◯ ◯ ◯ ◯ ◯
In regard to consumer interests, this
company seems to be very caring. ◯ ◯ ◯ ◯ ◯ ◯ ◯
The quality of this brand is stable. ◯ ◯ ◯ ◯ ◯ ◯ ◯
This is a gratifying brand. ◯ ◯ ◯ ◯ ◯ ◯ ◯
I believe that this company does not
take advantage of consumers. ◯ ◯ ◯ ◯ ◯ ◯ ◯
After watching this brand of a notebook
computer, I am very likely to grow fond
of it.
◯ ◯ ◯ ◯ ◯ ◯ ◯

114
Strongly Neutral
Strongly
Disagree Agree
1 2 3 4 5 6 7
This is a brand to dream about. ◯ ◯ ◯ ◯ ◯ ◯ ◯
This brand of a notebook computer is
not good in terms of performance. ◯ ◯ ◯ ◯ ◯ ◯ ◯
This is an elitist brand. ◯ ◯ ◯ ◯ ◯ ◯ ◯
Considering what I would pay for this
brand of a notebook computer, I will
get much more than my money’s worth.
◯ ◯ ◯ ◯ ◯ ◯ ◯
The quality of this brand of a notebook
computer is below the average. ◯ ◯ ◯ ◯ ◯ ◯ ◯
This brand shows who one is. ◯ ◯ ◯ ◯ ◯ ◯ ◯
This brand represents luxury. ◯ ◯ ◯ ◯ ◯ ◯ ◯
This brand is one of the best notebook
computer brands. ◯ ◯ ◯ ◯ ◯ ◯ ◯
This brand is not mass-produced. ◯ ◯ ◯ ◯ ◯ ◯ ◯
This is a top-quality brand. ◯ ◯ ◯ ◯ ◯ ◯ ◯
This brand is full of sensuality. ◯ ◯ ◯ ◯ ◯ ◯ ◯
3rd Part: Offer Evaluation
In this section, you are asked to consider a proposal for an Apple MacBook Pro series laptop.
Please answer the following questions on the scale from 1 to 7.

115
You are in a technology store and Apple MacBook Pro2 laptops are available at a 40%3
discount. The discount is limited to one day only4. It is said to be an opportunity not to be
missed by the seller. So what will you do?
1 2 3 4 5 6 7
My attitude towards the deal offered in
the advertisement for the notebook
computer is good.
Strongly Strongly
Disagree Agree
◯ ◯ ◯ ◯ ◯ ◯ ◯
At the price shown, I would consider
buying the advertised product.
Strongly Strongly
Disagree Agree
◯ ◯ ◯ ◯ ◯ ◯ ◯
The probability that I would consider
buying the advertised notebook
computer is
Very Very
Low High
◯ ◯ ◯ ◯ ◯ ◯ ◯
My willingness to buy this notebook
computer at the advertised price is
Very Very
Low High
◯ ◯ ◯ ◯ ◯ ◯ ◯
This promotion does not affect my
willingness to purchase this product.
Strongly Strongly
Disagree Agree
◯ ◯ ◯ ◯ ◯ ◯ ◯
2 The offer is for Apple MacBook Pro in questionnaires number of 1, 2, 3, 7, 8, and 9; for HP Pavilion
laptops in questionnaires number of 4, 5, 6, 10, 11, and 12.
3 The discount size was identified as 40% in questionnaires number of 1, 2, 3, 4, 5, and 6; 10% in
questionnaires number of 7, 8, 9, 10, 11, and 12.
4 Time constraints were stated using the sentences “The discount is limited to one day only.” in
questionnaires number of 1, 4, 7, and 10; “The discount will last three days.” in questionnaires number
of 2, 5, 8, and 11. In questionnaires number of 3, 6, 9, and 12, any statement about time constraint was
not used.

116
1 2 3 4 5 6 7
The likelihood that I would purchase
the advertised product at this price is
Very Very
Low High
◯ ◯ ◯ ◯ ◯ ◯ ◯
The likelihood that I can find a lower
price around town on the advertised
notebook computer is
Very Very
Low High
◯ ◯ ◯ ◯ ◯ ◯ ◯
The likelihood that this notebook
computer will be available cheaper
sometime soon is
Very Very
Low High
◯ ◯ ◯ ◯ ◯ ◯ ◯
I think that the advertised notebook
computer would be cheaper somewhere
soon.
Strongly Strongly
Disagree Agree
◯ ◯ ◯ ◯ ◯ ◯ ◯
I think that I could save money by
waiting to purchase this notebook
computer until a later date.
Strongly Strongly
Disagree Agree
◯ ◯ ◯ ◯ ◯ ◯ ◯
Comments, Suggestions or Questions?
__________________________________________________________________________
__________________________________________________________________________
__________________________________________________________________________

117
C. QUESTIONNAIRES IN TURKISH / TÜRKÇE ANKETLER
Anket No. 1
ARAŞTIRMAYA GÖNÜLLÜ KATILIM FORMU
Bu araştırma, ODTÜ İşletme Bölümü yüksek lisans öğrencisi Eda Ceren Güngör tarafından
Prof. Dr. Cengiz Yılmaz danışmanlığındaki yüksek lisans tezi kapsamında yürütülmektedir.
Bu form sizi araştırma koşulları hakkında bilgilendirmek için hazırlanmıştır.
Çalışmanın Amacı Nedir?
Bu anket, pazarlama yönetiminde ürünlere uygulanan satış promosyonlarının süresinin
tüketicinin satın alma davranışına etkisinin ölçülmesi amacıyla tasarlanmıştır.
Bize Nasıl Yardımcı Olmanızı İsteyeceğiz?
Sizden 57 soruluk bir anketi cevaplamanızı bekliyoruz. İlk yedi soru demografik bilgiler,
sonraki sorular ise belirlenmiş bir markaya yönelik sorulardır. Çalışma sonrasında
bilgilendirilmek isterseniz e-posta adresinizi yazabilirsiniz.
Sizden Topladığımız Bilgileri Nasıl Kullanacağız?
Araştırmaya katılımınız tamamen gönüllülük temelinde olmalıdır. Çalışmada sizden kimlik
veya kurum belirleyici hiçbir bilgi istenmemektedir. Cevaplarınız tamamıyla gizli tutulacak
ve sadece araştırmacılar tarafından değerlendirilecektir. Katılımcılardan elde edilecek bilgiler
toplu halde değerlendirilecek ve bilimsel yayınlarda kullanılacaktır.
Katılımınızla İlgili Bilmeniz Gerekenler
Anket, genel olarak kişisel rahatsızlık verecek sorular veya uygulamalar içermemektedir.
Ancak, katılım sırasında sorulardan ya da herhangi başka bir nedenden ötürü kendinizi rahatsız
hissederseniz anketi yarıda bırakıp çıkmakta serbestsiniz.
Araştırmayla İlgili Daha Fazla Bilgi Almak İsterseniz
Bu çalışmaya katıldığınız için şimdiden teşekkürler. Çalışma hakkında daha fazla bilgi almak
için İşletme Bölümü yüksek lisans öğrencisi Eda Ceren Güngör (e-posta:
[email protected]) ile iletişim kurabilirsiniz.
E-posta adresiniz (zorunlu değildir):____________________

118
1. Bölüm: Demografik Bilgiler
Yaşınız? _______________________
Cinsiyetiniz? Kadın ☐ Erkek ☐ Diğer ☐
Medeni Durumunuz? Bekâr ☐ Evli ☐ Boşanmış ☐ Dul ☐
Eğitim Durumunuz? (Lütfen bu soruyu en son tamamladığınız eğitim derecesine göre
yanıtlayınız.)
Okuryazar ☐ İlköğretim ☐ Lise ☐ Ön Lisans ☐
Lisans ☐ Yüksek Lisans ☐ Doktora ve Üstü ☐
İşiniz? Kamu Sektörü Çalışanı ☐ Özel Sektör Çalışanı ☐ Çalışmıyor ☐ Öğrenci ☐
Aylık hane geliriniz nedir? (Çalışıyorsanız lütfen yanıtlayınız.) _______________________
Elinize geçen aylık harcanabilir para miktarı nedir? (Çalışmıyorsanız lütfen yanıtlayınız.)
_______________________
2. Bölüm: Ürün Değerlendirme
Bu bölümde Apple MacBook Pro5 serisi dizüstü bilgisayarlar hakkında görüşleriniz merak
edilmektedir. Lütfen aşağıda yer alan soruları ölçek üzerinde 1’den 7’ye kadar bir değer
vererek yanıtlayınız.
Kesinlikle Kararsızım
Kesinlikle
Katılmıyorum Katılıyorum
1 2 3 4 5 6 7
Bu marka bir dizüstü bilgisayardan
üstün performans bekleyebilirim. ◯ ◯ ◯ ◯ ◯ ◯ ◯
Bu olağanüstü bir markadır. ◯ ◯ ◯ ◯ ◯ ◯ ◯
Prestij ve stil açısından bu marka
kişiliğimle eşleşiyor. ◯ ◯ ◯ ◯ ◯ ◯ ◯
5 Değerlendirilmesi istenen dizüstü bilgisayar markası olarak; 1, 2, 3, 7, 8 ve 9 numaralı anketlerde
Apple MacBook Pro; 4, 5, 6, 10, 11 ve 12 numaralı anketlerde HP Pavilion belirtilmiştir.

119
Kesinlikle Kararsızım
Kesinlikle
Katılmıyorum Katılıyorum
1 2 3 4 5 6 7
Bu bilgisayar markasına karşı zamanla
sıcak duygular edineceğimi
düşünüyorum.
◯ ◯ ◯ ◯ ◯ ◯ ◯
Bu çok pahalı bir markadır. ◯ ◯ ◯ ◯ ◯ ◯ ◯
Bu marka rafine insanlar içindir. ◯ ◯ ◯ ◯ ◯ ◯ ◯
Çoğu kişi bu markaya sahip değildir. ◯ ◯ ◯ ◯ ◯ ◯ ◯
Bu bilgisayar markası için kişisel
olarak pozitif hislere sahibim. ◯ ◯ ◯ ◯ ◯ ◯ ◯
Bu marka dizüstü bilgisayar
kullanışlıdır. ◯ ◯ ◯ ◯ ◯ ◯ ◯
Bu markaya sahip olan insanlar bu
ürünle ilgili iyi bir deneyime
sahiptirler.
◯ ◯ ◯ ◯ ◯ ◯ ◯
Bu marka dizüstü bilgisayar işimi
görür. ◯ ◯ ◯ ◯ ◯ ◯ ◯
Bu marka kişiliğimi yansıtır. ◯ ◯ ◯ ◯ ◯ ◯ ◯
Bu bilgisayar markası arkadaşlarım
tarafından itibar görür. ◯ ◯ ◯ ◯ ◯ ◯ ◯
Bu marka uygun fiyatlandırılmıştır. ◯ ◯ ◯ ◯ ◯ ◯ ◯
Bu seçkin bir markadır. ◯ ◯ ◯ ◯ ◯ ◯ ◯
Bu markaya sahip olmak gerçek bir
zevktir. ◯ ◯ ◯ ◯ ◯ ◯ ◯
Bu markayı başkalarına tavsiye etmem. ◯ ◯ ◯ ◯ ◯ ◯ ◯

120
Kesinlikle Kararsızım
Kesinlikle
Katılmıyorum Katılıyorum
1 2 3 4 5 6 7
Alacağım faydalara bakılırsa bu marka
dizüstü bilgisayarlar sudan ucuzdur. ◯ ◯ ◯ ◯ ◯ ◯ ◯
Bu markaya sahip olmak kendimi diğer
insanlardan ayrıcalıklı hissetmemi
sağlıyor.
◯ ◯ ◯ ◯ ◯ ◯ ◯
Bu marka estetik zevklere hitap eder. ◯ ◯ ◯ ◯ ◯ ◯ ◯
Bu marka dizüstü bilgisayarlar
gereğinden fazla pahalıdır. ◯ ◯ ◯ ◯ ◯ ◯ ◯
Bu marka ürünlerinin arkasındaki
şirket ve insanları güvenilir
buluyorum.
◯ ◯ ◯ ◯ ◯ ◯ ◯
Bu marka hayatı daha da
güzelleştiriyor. ◯ ◯ ◯ ◯ ◯ ◯ ◯
Bu marka dizüstü bilgisayarı
kullanmaktan gurur duyarım. ◯ ◯ ◯ ◯ ◯ ◯ ◯
Bu şirket tüketici çıkarlarını gözetiyor
gibi görünüyor. ◯ ◯ ◯ ◯ ◯ ◯ ◯
Bu marka kalite konusunda
istikrarlıdır. ◯ ◯ ◯ ◯ ◯ ◯ ◯
Bu memnuniyet verici bir markadır. ◯ ◯ ◯ ◯ ◯ ◯ ◯
Bu şirketin tüketicilerinden çıkar
sağlamadığına inanıyorum. ◯ ◯ ◯ ◯ ◯ ◯ ◯
Bu bilgisayar markasını tanıdıktan
sonra onun tutkunu olmamam
imkânsız görünüyor.
◯ ◯ ◯ ◯ ◯ ◯ ◯
Bu düşlediğim bir markadır. ◯ ◯ ◯ ◯ ◯ ◯ ◯

121
Kesinlikle Kararsızım
Kesinlikle
Katılmıyorum Katılıyorum
1 2 3 4 5 6 7
Bu marka dizüstü bilgisayar
performans açısından iyi değildir. ◯ ◯ ◯ ◯ ◯ ◯ ◯
Bu marka ürünler seçkin insanlar için
üretilmiştir. ◯ ◯ ◯ ◯ ◯ ◯ ◯
Bu marka dizüstü bilgisayar için ne
kadar ödeyeceğimi düşününce,
paramın değerinden çok daha fazlasını
alacağımı biliyorum.
◯ ◯ ◯ ◯ ◯ ◯ ◯
Bu marka dizüstü bilgisayar
ortalamanın altında bir kaliteye
sahiptir.
◯ ◯ ◯ ◯ ◯ ◯ ◯
Bu marka kullanan kişinin kim
olduğunu gösterir. ◯ ◯ ◯ ◯ ◯ ◯ ◯
Bu marka lüksü temsil ediyor. ◯ ◯ ◯ ◯ ◯ ◯ ◯
Bu marka en iyi bilgisayar
markalarından biridir. ◯ ◯ ◯ ◯ ◯ ◯ ◯
Bu marka seri üretim ürünü değildir. ◯ ◯ ◯ ◯ ◯ ◯ ◯
Bu en üst kalitede bir markadır. ◯ ◯ ◯ ◯ ◯ ◯ ◯
Bu markayı kullanmak bana büyük bir
haz veriyor. ◯ ◯ ◯ ◯ ◯ ◯ ◯
3. Bölüm: Teklif Değerlendirme
Bu bölümde, Apple MacBook Pro serisi bir dizüstü bilgisayar için sunulan bir teklifi
değerlendirmeniz isteniyor. Lütfen aşağıda yer alan soruları ölçek üzerinde 1’den 7’ye kadar
bir değer vererek yanıtlayınız.

122
Bir teknoloji mağazasındasınız ve Apple MacBook Pro6 dizüstü bilgisayarlar %407
indirimde. İndirim yalnızca bir günle8 sınırlı. Satıcı tarafından kaçırılmayacak bir fırsat olduğu
söyleniyor. Peki ya siz?
1 2 3 4 5 6 7
Teklifle ilgili ne düşünüyorsunuz?
Kötü İyi
◯ ◯ ◯ ◯ ◯ ◯ ◯
Bu dizüstü bilgisayarı gördüğüm anda
önerilen fiyata almaya karar veririm.
Kesinlikle Kesinlikle
Katılmıyorum Katılıyorum
◯ ◯ ◯ ◯ ◯ ◯ ◯
Bu dizüstü bilgisayarı bu fiyata almak
üzerinde düşünme olasılığım
Çok Çok
Düşük Yüksek
◯ ◯ ◯ ◯ ◯ ◯ ◯
Bu dizüstü bilgisayarı bu indirimle
alma isteğim
Çok Çok
Düşük Yüksek
◯ ◯ ◯ ◯ ◯ ◯ ◯
Bu indirim ürünü alma isteğimi hiç
etkilemez.
Kesinlikle Kesinlikle
Katılmıyorum Katılıyorum
◯ ◯ ◯ ◯ ◯ ◯ ◯
6 Sunulan teklif, 1, 2, 3, 7, 8 ve 9 numaralı anketlerde Apple MacBook Pro; 4, 5, 6, 10, 11 ve 12
numaralı anketlerde ise HP Pavilion marka dizüstü bilgisayarlar için sunulmuştur.
7 Sunulan teklifte indirim oranı olarak, 1, 2, 3, 4, 5 ve 6 numaralı anketler için %40; 7, 8, 9, 10, 11 ve
12 numaralı anketler için %10 belirtilmiştir.
8 Sunulan teklifte belirtilen zaman kısıtlaması ile ilgili, 1, 4, 7 ve 10 numaralı anketlerde “İndirim
yalnızca bir günle sınırlı.”; 2, 5, 8 ve 11 numaralı anketlerde “İndirim üç gün sürecek.” cümleleri
kullanılmış; 3, 6, 9 ve 12 numaralı anketlerde zaman kısıtlaması belirten bir ifade kullanılmamıştır.

123
1 2 3 4 5 6 7
Bu dizüstü bilgisayarı bu indirimle
alma olasılığım
Çok Çok
Düşük Yüksek
◯ ◯ ◯ ◯ ◯ ◯ ◯
Bu dizüstü bilgisayarı başka bir yerde
daha düşük bir fiyata bulabilme
ihtimalim
Çok Çok
Düşük Yüksek
◯ ◯ ◯ ◯ ◯ ◯ ◯
İlerleyen zamanlarda bu dizüstü
bilgisayarın daha uygun bir fiyata
satılabileceği olasılığı
Çok Çok
Düşük Yüksek
◯ ◯ ◯ ◯ ◯ ◯ ◯
Bu dizüstü bilgisayarın yakın bir
zamanda tekrar indirime gireceğini
düşünüyorum.
Kesinlikle Kesinlikle
Katılmıyorum Katılıyorum
◯ ◯ ◯ ◯ ◯ ◯ ◯
Bu dizüstü bilgisayarın ilerleyen
zamanlarda tekrar indirime girmesini
beklersem daha çok kar edeceğim.
Çok Düşük Çok Yüksek
İhtimalle İhtimalle
◯ ◯ ◯ ◯ ◯ ◯ ◯
Görüş, Öneri veya Sorularınız?
__________________________________________________________________________
__________________________________________________________________________
__________________________________________________________________________

124
D. TURKISH SUMMARY / TÜRKÇE ÖZET
Bu tezin amacı, zaman kısıtının ve indirim büyüklüğünün satış promosyonlarının
etkinliği üzerindeki etkilerini ve marka değeri ile algılanan lükslüğün bu etkiler
üzerindeki rolünü araştırmak ve tartışmaktır. Bu etkileri anlamak için beş hipotez
belirlenmiş ve bu hipotezlerin geçerliliği incelenerek pazarlama literatürüne katkıda
bulunmak hedeflenmiştir.
Alanda yapılan önceki çalışmalarda, satış promosyonlarının tüketicilerin satın alma
davranışları üzerindeki etkileri birçok kez incelenmiştir (Blattberg, vd., 1995). Ancak,
bu etkenlerin diğer faktörler dâhil edildiğinde değişip değişmediğini ve hangi tür
değişikliklerin meydana geldiğini anlamak amaçlanmaktadır. Bu çalışma için, 12
farklı vaka tasarlanmış ve 411 katılımcıdan, bu tezin araştırma sorusuna bir cevap
bulmak için anket sorularını yanıtlamaları istenmiştir.
Araştırma Tasarımı ve Metodolojisi
a. Değişkenler ve Hipotezler
Bu çalışma için, dördü bağımsız ve biri bağımlı olmak üzere beş değişken
kullanılmıştır. Bağımsız değişkenler “algılanan marka değeri”, “algılanan lükslük”,
“zaman kısıtlaması” ve “indirim büyüklüğü” iken bağımlı değişken “satın alma
istekliliği”dir.
Bağımsız değişkenlerden ikisi, algılanan marka değeri ve algılanan lükslük,
çalışmanın başında tanımlanan iki marka için ayrı ayrı ölçülmüştür. Bu ölçüm için
Apple MacBook Pro ve HP Pavilion markaları seçilmiştir. Bu seçim yapılırken
Apple’ın dünya çapında değeri en yüksek dizüstü bilgisayar markası olması (Brand

125
Finance, 2019), HP’nin ise dünyada en çok satılan dizüstü bilgisayar markası olması
(TrendForce, 2018, 2019) dikkate alınmıştır. Araştırmada kullanılan diğer iki bağımsız
değişken zaman kısıtlaması ve indirim büyüklüğü ise başlangıçta belirlenerek,
katılımcılara anketlerde yer alan teklifler aracılığıyla sunulmuş, zaman kısıtlaması için
üç seçenek ve indirim büyüklüğü için iki seçenek belirlenmiştir. Öte yandan, bağımlı
değişken olan satın alma istekliliği, katılımcılara sunulan bir teklifte, sunulan koşullar
altında alınan yanıtlar temel alınarak ölçülmektedir. Katılımcıların sunulan tekliflere
karşın oluşan satın alma istekliliğini ölçmek ve bağımsız değişkenlerdeki farklılıkların
bir sonucu olarak satın alma istekliliğinde kayda değer değişikliklerin meydana gelip
gelmediğini gözlemlemek amaçlanmaktadır.
Satış promosyonlarının tüketicinin satın alma davranışı üzerindeki etkilerini farklı
bakış açıları ile araştıran birçok çalışma yapılmıştır (Alvarez ve Casielles, 2005;
Schultz ve Block, 2014; Soni ve Verghese, 2018). Bu çalışmada ise özel olarak, satış
promosyonlarının satın alma istekliliği üzerindeki etkileri temelde üç faktör göz
önünde bulundurularak incelenmiştir. Marka, zaman kısıtlaması ve indirim büyüklüğü
faktörlerinin ayrı ayrı ve kolektif etkileri ölçülmek istenmiş ve bu amaçla, beş hipotez
ortaya atılmıştır.
H1a: Yüksek değerli marka bir ürüne uygulanan indirim, tüketicinin ürünü satın alma
istekliliğini, marka değeri daha düşük olan bir ürüne kıyasla daha fazla arttırır.
H1b: Nispeten lüks marka bir ürüne uygulanan indirim, tüketicinin ürünü satın alma
istekliliğini, ilkine göre daha az lüks marka bir ürüne kıyasla daha fazla arttırır.
H2: İndirim büyüklüğü, tüketicinin satın alma davranışını olumlu yönde etkiler.

126
H3: Satış promosyonunun tüketicinin satın alma istekliliğine etkisi, promosyonun
uygulanma süresine (zaman kısıtına) göre farklılık gösterir.
H4: İndirim büyüklüğünün tüketicinin bir ürünü satın alma istekliliği üzerindeki etkisi,
zaman kısıtlaması olan ve sınırsız süreli indirimler uygulandığında farklılık gösterir.
b. Anket Tasarımı
Araştırma için 12 farklı anket hazırlanmış ve bu anketlerin her birinde aynı 57 soru
kullanılmıştır. Anketler üç bölümden oluşmaktadır. İlk bölüm demografik bilgi
formunu içermektedir ve aynı sorular tüm anketler için kullanılmıştır. Anketler 1-12
arasında numaralandırılmış ve anketlerde yer alan sorular, anketin ikinci bölümünde
yer alan iki marka ve üçüncü bölümünde sunulan 12 farklı teklifin değerlendirilmesi
için sorulmuştur. Üçüncü kısımda yer alan teklifler tabloda da görülebileceği üzere iki
farklı indirim büyüklüğü, iki farklı marka ve üç farklı zaman kısıtına göre farklılık
göstermektedir.
Ayrıca anketlerde, daha sonra anket sonuçları hakkında bilgi almak isteyen
katılımcıların anket hakkında görüş, öneri ve soruları ile e-posta adreslerini
yazabilecekleri zorunlu olmayan iki alan bulunmaktadır. Bu zorunlu olmayan alanlar
anket verilerinden ayrı olarak farklı bir tabloda tutulmaktadır. Anketler, sahada
uygulanacak olan kâğıda basılı anketler ve çevrimiçi platformlarda paylaşılabilecek ve
yanıtlanabilecek elektronik anketler olmak üzere iki şekilde tasarlanmıştır.
1. Bölüm: Demografik Bilgi Formu:
Bu form katılımcıların demografik bilgileri ile ilgilidir ve yaş, cinsiyet, medeni durum,
eğitim durumu, çalışma durumu ve çalışma durumuna bağlı olarak gelir durumu

127
hakkında sorulan yedi sorudan oluşmaktadır. Gelir durumu sorusu koşullu bir soru
olup, aylık harcanabilir gelir miktarı öğrencilere ve çalışmayan katılımcılara
sorulurken, aylık hane geliri miktarı çalışan kişilere sorulmuştur. Bu bölümde yer alan
cinsiyet, medeni durum, eğitim durumu ve çalışma durumu ile ilgili sorular çoktan
seçmeli; yaş, aylık harcanabilir gelir ve aylık hane geliri soruları daha hassas bir analiz
yapılabilmesi amacıyla açık uçlu sorular olarak hazırlanmıştır.
2. Bölüm: Marka Değerlendirme Formu:
İkinci bölümde yer alan sorular, algılanan marka değeri ve algılanan lükslüğün
ölçülmesi amacıyla hazırlamıştır. Algılanan marka değeri için 22, algılanan lükslük
için 18 olmak üzere toplamda 40 soru kullanılmıştır. İkinci kısımdaki sorular, ölçümün
hassasiyetini artırmak ve dikkatsiz katılımcıları kolayca kurmak için anket
hazırlanırken karıştırıldı.
Bu bölümde yer alan sorular için, Psikolog Rensis Likert tarafından seçimlerin
sürekliliğini sağlamak amacıyla geliştirilmiş olan Likert ölçeği kullanılmıştır
(Ansiklopedi Brittanica, n.d.). Kullanılan, tek aşamalı 1-7 Likert ölçeğinde, 1
“kesinlikle katılmıyorum” ve 7 “kesinlikle katılıyorum” anlamına gelmektedir.
Algılanan marka değeri ölçeğinde bulunan 22 sorudan 17 tanesi için Lassar, Mittal ve
Sharma (1995) tarafından gerçekleştirilen çalışmada kullanılan ölçekten
faydalanılmış, geriye kalan beş soru ise ölçeğin güvenilirliğini artırmak amacıyla
ölçeğe sonradan eklenmiş olup tersine çevrilerek sorulmuştur. Algılanan lükslük
ölçeğinde yer alan 18 soru ise daha önce De Barnier, Falcy ve Valette-Florence (2012)
tarafından benzer bir çalışmada kullanılan bir ölçekten uyarlanmıştır.

128
3. Bölüm: Teklif Değerlendirme Formu:
Anketin son kısmı olan teklif değerlendirme formunda yer alan altı soru, 12 farklı
anket için hazırlanan 12 farklı teklif için yanıtlanmıştır. Bu teklifler marka, indirim
büyüklüğü ve zaman kısıtı değişkenleri temel alınarak hazırlanmıştır. Bu sorulardan
beş tanesi daha önce Aggarwal ve Vaidyanathan (2002) tarafından kullanılmış bir
ölçekten alınmış ve diğer bir soru ise ölçeğin güvenirliğini artırmak amacıyla ters
anlamlı bir ifade belirten bir soru olarak üretilmiş ve katılımcılara aktarılmıştır. Verilen
cevapların puanlandırılması için 1-7 Likert skalası kullanılmıştır (Likert, 1932).
c. Katılımcılar ve Veri Toplama
Ankara'da yaşayan 18 yaş ve üzerindeki bireylerden veri toplanmıştır. Katılımcı kitlesi
(1) üniversite öğrencileri ve (2) daha önce BT sektöründe çalışmış veya çalışmakta
olan kişilerden oluşmaktadır. Anket uygulanan katılımcıların ürünle ilgili bilgi
düzeyinin olabildiğince yüksek olmasını sağlamak hedeflenmiştir. Ayrıca,
katılımcılara anket uygulanırken, öncelikle markaları tanıyıp tanımadıkları kontrol
edilmiş ve pozitif veya negatif önyargı oluşmasını engellemek için anketler rasgele
dağıtılmıştır. Anketler, 66 sahada, 345 çevrimiçi olmak üzere toplamda 411
katılımcıya uygulanmıştır.
Veri Analizi ve Bulgular
411 katılımcıdan toplanan veriler analiz edilmek üzere SPSS 25.0’a (IBM Corp., 2017)
aktarılmış, 11 katılımcının yanıtlarında çelişkiler tespit edilerek bu katılımcıların
anketleri araştırma dışı bırakılmıştır.

129
Araştırmaya kabul edilen 400 katılımcı, 18 ile 77 arasında değişen geniş bir yaş
skalasına sahip olmakla birlikte, katılımcıların yaş ortalaması 8,59'luk standart sapma
ile yaklaşık 29'dur. Bu katılımcıların yüzde 51,2'si kadın iken %48,3'ü erkektir.
Katılımcıların yaklaşık %74,3’ü bekâr, %23,5'i ise evli olduğunu belirtmiştir. Ayrıca
az sayıda da olsa boşanmış, dul ve medeni durumu hakkında bilgi vermek istemeyen
katılımcılar da mevcuttur.
Eğitim seviyesi ele alındığında, katılımcıların büyük bir çoğunluğunun lisans (%44,5)
ve yüksek lisans (%26) mezunu olduğu ve en düşük eğitim derecesinin ise lise
(%16,25) olduğu görülmektedir. Ayrıca, az da olsa ön lisans mezunları (%1,5) ve hatırı
sayılır miktarda doktora mezunları da (%11,75) araştırmaya katılım sağlamıştır.
Katılımcıların çalışma durumu incelendiğinde ise %52,25'inin çalışan, %40,05'inin
öğrenci, %7,25’inin ise çalışmıyor olduğu görülmüştür. Gelir durumu, katılımcıların
çalışma durumu dikkate alınarak araştırılmıştır. Çalışanlara aylık hane halkı geliri
sorulmuş, ortalama 8,738,71₺ hesaplanırken 1.000₺ ile 40.000₺ aralığında değişiklik
gösterdiği görülmüştür. Öte yandan, aktif olarak çalışmayan katılımcılara aylık
harcanabilir gelirleri sorulmuş ve ortalama 1.658,12 gelirleri olduğu hesaplanmış ve
bu değerin 0₺ ile 12.000₺ arasında değişiklik gösterdiği sonucu elde edilmiştir.
a. Normallik Testleri
Tüm ölçekler için ayrı ayrı normallik testleri gerçekleştirilmiştir. Bu testler için Kim’in
(2013) araştırması referans alınmıştır. İlk olarak, çarpıklık ve basıklık değerlerinin ± 1
aralığında olup olmadıkları kontrol edilmiş, ardından çarpıklık ve basıklık değerleri
için ayrı ayrı Z skorları hesaplanarak, bu değerlerin referans aralıkta yer alıp almadığı
kontrol edilmiştir. Son olarak, Kolmogorov-Smirnova ve Shapiro-Wilk anlamlılıkları

130
kontrol edilmiş; küçük boyutlu örneklemler için (n <50), Kolmogorov-Smirnova,
boyutu ≥50 olan örneklemler için ise Shapiro-Wilk anlamlılığı incelenerek
örneklemlerin normal dağılıp dağılmadığı tespit edilmiştir.
Yapılan testler sonucunda, algılanan marka değeri ölçeği farklı markalar baz alınarak
incelendiğinde örneklemin normal dağıldığı sonucu elde edilmiştir. Öte yandan,
algılanan lükslük ölçeği yine aynı şekilde markalar baz alınarak incelendiğinde
örneklemin normal dağılmadığı görülmüştür.
Satın alma istekliliği ölçeği; farklı markalar, indirim büyüklüğü ve indirim süresi ayrı
ayrı ele alınarak incelendiğinde örneklemin hiçbir koşulda normal dağılmadığı fakat
aynı ölçek 12 farklı anket aracılığıyla sunulan 12 farklı teklife göre ele alındığında ise
örneklemin normal dağıldığı görülmüştür.
b. Açımlayıcı Faktör Analizi ve Güvenirlik Analizi
Ölçeğin gücünü belirlemek amacıyla tüm ölçekler için ayrı ayrı açımlayıcı faktör
analizi uygulanmıştır. Bu yöntem kullanılırken yapılan çalışmalarda, Hair vd. (2014)
referans alınmıştır. Faktörler ve bu faktörlerin öğeleri belirlendikten sonra Cronbach’s
Alpha yöntemi kullanılarak güvenirlik analizi yapılmış ve bu analizlerde de Hair vd.
(2014) yapılan çalışmalar referans alınmıştır.
Algılanan marka değeri ölçeğinde yer alan 22 soru için açımlayıcı faktör analizi
yapıldığında, 16 sorunun ölçüm için başarılı bulunduğu görülmüş, bu ölçümün 4 faktör
aracılığıyla yapılabildiği tespit edilmiştir. Bu 4 faktör için güvenirlik analizi
yapıldığında ise elde edilen Cronbach’s Alpha değerlerinin eşik değerin üzerinde
kaldıkları ve güvenirlik testini sağladıkları görülmüştür. İkinci olarak algılanan
lükslük ölçeğine uygulanan açımlayıcı faktör analizi ile de başarılı bir sonuç elde

131
edilmiş ve ankette kullanılan 18 sorudan 10 tanesinin ölçek için yeterli ve başarılı
olduğu ve algılanan lükslük ölçeğinin tke bir faktör olarak değerlendirilebileceği
sonucuna varılmıştır. Bu faktör bileşenleri için Cronbach’s Alpha değeri
hesaplandığında oldukça yüksek bir skor elde edilmiş ve ölçeğin güvenirlik testini
geçtiği görülmüştür. Son olarak, satın alma istekliliği ölçeği için uygulanan açımlayıcı
faktör analizi sonucunda da anketlerde kullanılan altı sorunun ölçek için uygun ve
başarılı olduğu tespit edilmiş ve Cronbach’s Alpha değerinin eşik değerin üzerinde
olması nedeniyle bu ölçeğin de güvenirlik testini geçtiği değerlendirilmiştir.
c. Analizler ve Bulgular
Önceki bölümlerde bahsedilen normallik testleri, açımlayıcı faktör analizi ve
güvenirlik testlerinde elde edilen sonuçlar dikkate alınarak hipotez testleri için
kullanılacak analiz yöntemleri belirlenmiş ve çalışmalarda aşağıdaki yöntemlere yer
verilmiştir.
• Bağımsız t Testi
• Mann-Whitney U Testi
• Kruskal Wallis Testi
• Faktöriyel ANOVA
Algılanan marka değeri iki farklı marka için bağımsız t testi aracılığı ile
karşılaştırılmış, örneklemin normal dağılması sebebiyle bu yöntem kullanılmıştır. Bu
analiz sonucunda Apple MacBook Pro markasının HP Pavilion markasına göre,
anlamlı bir fark yaratarak, katılımcılar tarafından marka değeri daha yüksek olarak
algılandığı sonucuna varılmıştır.

132
Algılanan lükslük için iki marka arasında kıyaslama yapılmak istenmiş ve bunun için
Mann-Whitney U testi uygulanmıştır. Örneklemin, daha önce de bahsedildiği gibi,
normal dağılmadığının görülmesi sebebiyle Mann-Whitney U testi
gerçekleştirilmiştir. İki marka arasında algılanan lükslük açısından anlamlı bir fark
görülmüş ve Apple MacBook Pro markasının HP Pavilion markasına göre anket
katılımcıları tarafından daha lüks bir marka olarak algılandığı tespit edilmiştir.
H1a ve H1b hipotezlerinin test edilebilmesi için satın alma istekliliğinin iki farklı marka
için karşılaştırılması amacıyla ve örneklemin normal dağılmaması nedeniyle Mann-
Whitney U testi gerçekleştirilmiştir. Bu test sonucunda Apple MacBook Pro markasına
karşı katılımcılarda HP Pavilion markasına kıyasla daha büyük bir satın alma isteği
görülmüştür. Sonuç olarak, H1a hipotezinde ortaya atılan “marka değeri daha yüksek
olan ürüne uygulanan indirimin marka değeri daha düşük ürüne kıyasla müşterinin
satın alma isteğini artırması açısından daha etkili olduğu” iddiası da doğrulanmıştır.
Öte yandan, H1b hipoteziyle ortaya atılan “lüks algısı daha yüksek olan markaya
indirim uygulandığında nispeten daha az lüks algısı yaratan markaya kıyasla
müşterinin satın alma isteğinin daha fazla arttığı” iddiası da benzer şekilde
doğrulanmıştır.
H2 hipotezinde belirtilen “indirim büyüklüğünün satın alma istekliliği üzerinde anlamlı
bir fark yaratıp yaratmadığının” test edilmesi amacıyla Mann-Whitney U testi
gerçekleştirilmiş ve örneklemin normal dağılmıyor olması nedeniyle bu yöntem
seçilmiştir. Bu test sonucunda, indirim büyüklüğü daha yüksek olduğunda
katılımcılarda daha fazla satın alma istekliliği oluştuğu sonucuna varılmış, dolayısıyla
hipotezin de doğrulandığı görülmüştür.
H3 hipotezinin test edilmesi amacıyla örneklemin daha önce de bahsedildiği gibi
normal dağılmaması sebebiyle Kruskal Wallis testi uygulanmıştır. Bu test sonucunda
“ürünlere uygulanan promosyonların süre kısıtıyla bağlantılı olarak müşterinin satın

133
alma istekliliği üzerinde anlamlı bir fark yarattığı” görülmüş ve hipotez
doğrulanmıştır.
Son olarak H4 hipotezi yanıtlanmak istenmiş ve indirim büyüklüğünün ve indirim
kısıtlılığının birlikte ele alınmasıyla Faktöriyel ANOVA uygulanarak sonuçlar
değerlendirilmiştir. Yapılan analiz sonucunda bu iki değişkenin satın alma istekliliği
üzerinde birlikte anlamlı bir etkisi olmadığı görülmüş ve hipotez doğrulanmamıştır.
Faktöriyel ANOVA sonucunda elde edilen tablolar incelendiğine ilginç bir detay
dikkat çekmiş ve ek bir analiz yapılmasına karar verilmiştir. Bu analizde indirim oranı
ve marka değişkenlerinin satın alma istekliliği üzerinde birlikte yarattıkları etki
incelenmiştir. Bu inceleme sonucunda anlamlı bir etki tespit edilmiş ve indirim oranı
yüksek (%40) olduğunda iki markanın satın alma istekliliği arasında anlamlı bir fark
elde edilirken indirim oranının düşük (%10) olması durumunda anlamlı olarak
nitelendirilebilecek herhangi bir fark elde edilmemiştir.
Tartışma ve Sonuç
a. Sonuçların Tartışılması ve Çalışmanın Katkıları
Satış promosyonlarının tüketici satın alma davranışını nasıl etkilediğini anlamak için
yıllar boyunca çeşitli araştırmalar yapılmıştır (Alvarez ve Casielles, 2005; Schultz ve
Block, 2014; Soni ve Verghese, 2018). Bazı araştırmacılar farklı promosyon
tekniklerini karşılaştırmaya çalışmış ve sonuçlarını tüketicilerin satın alma
davranışları açısından analiz etmiştir (Howell, vd., 2015; Gong, vd., 2019). Öte
yandan, bazı araştırmacılar, satış promosyonlarının belirli faktörlerinin satın alma
eylemi üzerinde birlikte yarattığı etkileri bulmak için farklı promosyon teknikleri ve
farklı araçlar kullanarak araştırmalarını gerçekleştirmiştir (Eisenbeiss vd., 2015; Kuo

134
ve Nakhata, 2016). Bu araştırmalara bir katkı olarak, bu çalışmada, satış
promosyonlarının satın alma istekliliği üzerindeki etkileri araştırılarak; marka, zaman
kısıtlaması ve indirim büyüklüğü faktörlerinin ayrı ayrı ve birlikte olan etkileri ele
alınmıştır.
Önceki çalışmaların bir kısmına baktığımızda, satış promosyonunun tüketici satın
alma davranışı üzerindeki etkisini görebiliriz (Alvares ve Casielles, 2005; Blattberg ve
Neslin, 1990; Gupta 1988; Santini vd., 2015). Daha spesifik olarak, parasal satış
promosyonlarının satın alma davranışları üzerindeki etkilerine baktığımızda,
Makienko'nun (2006) çalışması dikkat çekici sayılabilir. Bu çalışmanın sonucu
göstermektedir ki, bir ürünü normal fiyatıyla satmaktansa, önce fiyatı artırıp sonra
promosyon uygulayarak ürünü normal fiyatına satmak tüketicinin satın alma isteğini
artırmaktadır.
İlk olarak, marka değerinin satış promosyonlarının etkinliği üzerindeki rolü
araştırılmaktadır. Chandon vd. (2000) tarafından daha önce yapılan bir çalışmada, satış
promosyonlarının etkinliğinde, marka değeri ile ilgili olarak oluşan farklılıklar
görülmektedir. Faydacı bir ürüne uygulanan parasal promosyonun, marka değeri
yüksek olan ürünlerin satın almasında, marka değeri düşük olan ürünlerin satın
alınmasına göre daha etkili olduğu görülmüştür (Chandon vd., 2000). Mevcut
araştırmada ise parasal bir promosyon olan bir satış promosyonu, faydacı bir ürün
olana dizüstü bilgisayara uygulandığında benzer bir sonuçla karşılaşılmıştır (Lu vd.,
2016). Müşterilerin, marka değeri HP Pavilion’a kıyasla daha yüksek olan Apple
MacBook Pro olan için satın alma isteğinin uygulanan promosyon sonucunda daha
fazla arttığı görülmüştür. Ek olarak, aynı durum, markalarının algılanan lükslükleri
açısından analiz edildiğinde, benzer şekilde, satış promosyonu, HP Pavilion
ürününden daha yüksek algılanan bir lükslüğe sahip olan Apple MacBook Pro markası
için, müşterinin satın alma niyetini daha fazla artırdığı sonucunda varılmıştır.

135
Fakat elde edilen sonucun aksine, araştırmanın başında, nispeten lüks algılanan
markaya uygulanan indirim büyüklüğü arttıkça, satışlarda bir düşüş beklenmekteydi.
Çünkü Yeoman'a (2014) göre, lüks bir ürün pahalı olmalıdır ve erişilebilir hale
geldiğinde bir paradoks ortaya çıkmaktadır. Bu durum, Guyon'un (Guyon’dan aktaran
Brun ve Castelli, 2013) tanımına uygun olarak, araştırmada kullanılan ürünün
erişilebilir bir lüks olarak seçilmesinden kaynaklandığı şeklinde açıklanabilir.
Satış promosyonunun tüketicinin satın alma niyetine etkisini incelerken, göz önünde
bulundurulabilecek bir diğer faktör, indirim büyüklüğü olmalıdır. Bu konuyla ilgili
önceki çalışmalar incelendiğinde, indirim büyüklüğünün tüketicinin satın alma
istekliliğini arttırmasındaki rolünün değişkenlik gösterebildiği görülmektedir.
Örneğin, Lee ve Chen-Yu'ya (2018) göre, tüketici indirimle karşılaştığında, tüketicide
bir parasal tasarruf algısı oluşabilir ve bu algıya bağlı olarak tüketicinin satın alma
istekliliğinde bir artış meydana gelebilir. Öte yandan, indirim büyüklüğü arttıkça, her
ne kadar müşteride daha fazla para tasarrufu algısı ortaya çıksa da, bununla birlikte
daha düşük ürün kalitesiyle karşı karşıya kalacağını düşünebilir.
Ayrıca, satış promosyonlarının tüketici fikirleri üzerindeki psikolojik etkilerine
bakarsak, Honea ve Dahl (2005), fiyat indirimi arttıkça, mutluluk, zevk, heyecan,
memnuniyet gibi olumlu duygusal etkilerin arttığını iddia etmiştir. Ek olarak,
Schindler'e (1998) göre, ekonomik olarak tasarruf etme arzusundan ziyade
indirimlerden yararlanmanın olumlu duygusal etkisi, satın alma niyetinde bir artışa yol
açabilir. Bu olumlu duyguların, indirim büyüklüğü arttıkça da artması beklenir.
İndirim büyüklüğünün tüketicinin satın alma niyeti üzerindeki etkisi ürünümüz ve
örneklemimiz için ölçüldüğünde, indirim büyüklüğü ile tüketicinin satın alma
istekliliği arasında pozitif bir ilişki gözlenmiştir. Tüketicinin ürüne sunulan %40’lık
bir indirimden kaynaklanan satın alma isteğinin, %10 indirimden kaynaklı oluşan satın
alma niyetinden önemli ölçüde daha yüksek olduğu kaydedilmiştir.

136
Tüketicinin satın alma davranışını etkileyip etkilemediği araştırılmak üzere seçilen
faktörlerde biri de zaman kısıtı olarak seçilmiştir. Önceki çalışmalar incelendiğinde,
emtia teorisinde (commodity theory) (Brock, 1968) ve kullanılamazlık teorisinde
(unavailability theory) (Folger, 1992; Inman vd., 1997; Lynn, 1991) belirtildiği gibi,
ürünün daha değerli ve vazgeçilmez olduğuna dair sezgisel bir algı ortaya çıkar ve
müşterinin satın alma isteği artış gösterir. Bu sonuçlar göz önünde bulundurulduğunda
bu çalışmada da benzer bir sonuç beklenmiş fakat zaman kısıtlamasının indirimli bir
ürün satın alma üzerindeki etkisinin olumsuz olduğu sonucuna ulaşılmıştır. İndirim ne
kadar uzun olursa, tüketicinin satın alma niyetinin de o kadar arttığı görülmüştür.
Zaman kısıtı, müşterinin ürünün değerli ve vazgeçilmez olduğunu hissetmesini
sağlarken; teklifin zamanla kısıtlı olmadığı bir durumda müşterinin düşünecek zamanı
olduğunu bilmesinden kaynaklanan rahatı zaman kısıtının yarattığı acele etme zorunda
hissetmesinin önüne geçmiştir. Öte yandan, zaman kısıtı olmayan tekliflerde zamana
dair herhangi bir ifade kullanılmaması da aslında bir belirsizlik hissi uyandırmış ve en
azından zaman kısıtlı olan tekliflerin geçerlilik süreleri bilinirken, zaman kısıtı
olmayan teklifin her an sona erebileceği ihtimali söz konusu olmuştur.
Zaman kısıtı ve indirim büyüklüğünün satın alma istekliliği üzerindeki birlikte
yarattığı etkiyi gösteren çalışmalar mevcuttur. Ku ve Nakhata’ya (2016) göre,
geçerlilik süresinin kısa olduğu durumlarda, tüketicinin satın alma niyetini arttırmada
küçük bir indirim bile etkili olabilmektedir. İndirim süresi nispeten olduğunda ise
küçük bir indirim uygulandığında müşterinin satın alma kararı üzerinde kayda değer
bir etki oluşmamaktadır. Ayrıca, Eisenbeiss vd. (2015) yaptıkları çalışmaya göre,
indirim büyüklüğü ve zaman kısıtının satış promosyonunun satın alma istekliliği
üzerindeki etkisindeki rolü ürün tipine göre değişkenlik göstermektedir. Hedonik bir
ürün seçildiğinde, zaman kısıtı, satın alma isteğini artırmak için indirim boyutundan
daha etkilidir. Öte yandan, aynı indirimler bir faydacı ürüne uygulandığında, indirim
büyüklüğünün satın alma istekliliğini artırma yönündeki etkisi zaman kısıtlamasından
daha büyüktür (Eisenbeiss vd., 2015). Bizim çalışmamızda ise, bu faktörlerin her ne
kadar ayrı ayrı dikkate değer etkileri görülmüş olsa da, zaman kısıtı ve indirim

137
büyüklüğünün satın alma davranışı üzerinde oluşturduğu ikili bir etkiyle
karşılaşılmamıştır.
Ayrıca, bu tez kapsamında, marka ve indirim oranının birlikte yarattığı etki
incelenmiştir ve bu iki faktörün farklı kombinasyonları arasında anlamlı bir fark
oluştuğu görülmüştür. Başka bir deyişle, farklı boyutlarda indirimler için algılanan
marka değerinin ve algılanan lükslüğün etkileri farklılık göstermiştir. İndirim oranının
yüksek olması durumunda (%40), marka değeri daha yüksek olan Apple MacBook Pro
HP Pavilion ile karşılaştırıldığında müşterilerin satın alma niyetinin daha fazla olduğu
görülmüştür. Öte yandan, küçük boyutta indirim (%10) uygulandığında ise, markanın
satın alma üzerinde kayda değer bir etkisi görülmemiştir. Diğer bir deyişle, indirim
büyüklüğü %10 olduğunda, iki marka arasında müşterilerin satın alma niyetleri
açısından anlamlı bir fark oluşmamaktadır.
Faktöriyel ANOVA uygulanarak tüm veriler 12 durum açısından ayrı ayrı analiz
edilmiş ve her bir durum için tahmini marjinal satın alma istekliliği büyükten küçüğe
sıralanmıştır. Bunun sonucunda elde edilen tablo dikkat çekicidir (4.29).
Satın alma istekliliği üzerinde etkisi en büyük olan faktörün indirim büyüklüğü olduğu
sonucuna varılmıştır. İkinci önemli faktörün ise marka olduğu görülmektedir. İndirim
oranı %40 olan durumlar için değerlendirildiğinde zaman kısıtının en etkili üçüncü
faktör olduğu ve zaman kısıtı olmayan durumlarda satın alma istekliliğine ait tahmin
edilen marjinal değerin bu durumlar için en yüksek olduğu görülmüştür. Bunun olası
nedeni, zaman kısıtı tanımlanmayan durumlar için, zaman içeren herhangi bir ifade
kullanılmamış olmasıdır. Bu nedenle, müşteriler herhangi bir zaman baskısı
hissetmemiş olsalar da, zaman konusunda hiçbir kesinlik olmaması da teklifin ne
zaman sonlanacağını bilmemeleri nedeniyle onlar üzerinde baskı yaratmıştır.

138
İndirim oranı %10 olarak tanımlanan durumlar için elde edilen sonuçlar marka ve
zaman kısıtının birlikte yarattığı etki açısından incelendiğinde, tahmini marjinal
ortalama değerlerin birbirine çok yakın olduğu görülmüştür. Bunun nedeni ise tabloda
zaman ve markanın birlikte anlamlı bir etkisinin olmamaı olarak açıklanmıştır (4.28).
Bu tez ile akademik alanda yapılan çalışmalara katkıda bulunarak; Daha önce
tanımlanmış durumlardan bazılarını desteklemenin yanı sıra, daha önce
vurgulanmayan yeni bir bakış açısı sağlamayı amaçladık. Ek olarak, marka yöneticileri
ve karar vericiler için yeni bakış açıları sağlamayı ve marka ve ürün özelliklerini göz
önünde bulundurarak ve doğru indirim boyutları ve zaman kısıtlamaları ile tanıtım
araçlarının daha etkin uygulanmasına katkıda bulunmayı hedefledik.
b. Çalışmanın Sınırlılıkları ve Öneriler
Araştırma süreci titizlikle planlanmış ve gerçekleştirilmiş olsa da bazı sınırlılıklarla
karşılaşılmıştır. Bunlardan ilki veri toplama süreci ve örneklemle ilgilidir. Anketler
katılımcılara uygulanırken mümkün olduğunca dengeli bir katılım sağlaması için çaba
gösterilmiştir. Bu denge cinsiyet ve çalışma durumu için sağlanabilmiş olsa da
katılımcıların eğitim seviyesi için sağlanamamıştır. Her eğitim seviyesinden yaklaşık
aynı sayıda katılımcı katılmasının, verilerin analizi sırasında daha objektif sonuçlar
yaratacağı düşünülerek bu durum çalışmanın bir sınırlılığı olarak değerlendirilmiştir.
Ayrıca, yeterli katılımcı sayısının sağlanabilmesi için katılımcıların yaş aralığının
oldukça geniş tutulması yine benzer şekilde örneklem ile ilgili olarak bir sınırlılık
olarak görülürken, katılımcılar tarafından verilen yanıtların gösterdiği çeşitliliklerin
farklı faktörler nedeniyle artmış olabileceği değerlendirilmiştir.
Çalışmanın uygulanmasında karşı karşıya kalınan ikinci sınırlılık ise anket doldurulma
sayılarının tüm anket numaraları için eşit olmasının sağlanamamış olmasıdır. Sahada

139
yapılan anketler her ne kadar katılımcılara rasgele dağıtılarak dengeli bir dağılım
sağlanmış olsa da, çevrimiçi platformlarda paylaşılan anketleri dolduran katılımcı
sayısı kontrol altında tutulamamıştır.
Üçüncüsü sınırlılık ise araştırmanın tasarımı sırasında seçilen markalardan
kaynaklanmıştır. Daha önce başka çalışmalarda da kullanılan (Dhar & Nowlis, 1999;
De Barnier vd., 2012; Srcihetta & Thurachon, 2012) ve Türkiye'de çok iyi bilinen
dizüstü bilgisayar markaları seçilmiş ve marka değeri daha düşük olan ürünler
çalışmaya dahil edilememiştir. Ayrıca, bu durum bazı katılımcılarda araştırmada
kullanılan markaların reklamının yapıldığına dair soru işaretleri oluşturarak antipati
yarattığı ve bu katılımcıların soruları yanıtlarken ön yargılı bir tavır sergilemiş
olmaları ihtimali olabileceği değerlendirilmiştir.
Bu çalışmada kullanılan araştırma sorularının ve anketin, gelecekte bu alanda
yapılacak çalışmalarda farklı bir demografi ve farklı bir coğrafyada uygulanması
tavsiye edilmektedir. Ayrıca, benzer bir çalışmanın farklı bir promosyon aracı veya
yöntemi ile veya farklı bir ürün grubu üzerinde çalışılmasının da faydalı olabileceği
değerlendirilmektedir.

140
E. TEZ İZİN FORMU / THESIS PERMISSION FORM
ENSTİTÜ / INSTITUTE
Fen Bilimleri Enstitüsü / Graduate School of Natural and Applied Sciences
Sosyal Bilimler Enstitüsü / Graduate School of Social Sciences
Uygulamalı Matematik Enstitüsü / Graduate School of Applied Mathematics
Enformatik Enstitüsü / Graduate School of Informatics
Deniz Bilimleri Enstitüsü / Graduate School of Marine Sciences
YAZARIN / AUTHOR
Soyadı / Surname: Güngör
Adı / Name: Eda Ceren
Bölümü / Department: Business Administration
TEZİN ADI / TITLE OF THE THESIS (İngilizce / English):
Exploring the Effects of Time Limit and Discount Size on Sales Promotion Effectiveness: The Roles of
Brand Equity and Perceived Luxuriousness
TEZİN TÜRÜ / DEGREE: Yüksek Lisans / Master Doktora / PhD
1. Tezin tamamı dünya çapında erişime açılacaktır. / Release the entire
work immediately for access worldwide.
2. Tez iki yıl süreyle erişime kapalı olacaktır. / Secure the entire work for
patent and/or proprietary purposes for a period of two years. *
3. Tez altı ay süreyle erişime kapalı olacaktır. / Secure the entire work for
period of six months. *
* Enstitü Yönetim Kurulu kararının basılı kopyası tezle birlikte kütüphaneye teslim edilecektir.
A copy of the decision of the Institute Administrative Committee will be delivered to the library
together with the printed thesis.
Yazarın imzası / Signature ............................ Tarih / Date …………………………