1835 Report on Eastern Frontier of British India by Pemberton S_2

Exploring the Eastern Frontier: A First Look at Mobile App
Tracking in ChinaZhaohua Wang Zhenyu Li Minhui Xue Gareth Tyson

Table of contents• Why study the mobile app tracking in China?• Dataset and methodology• How prevalent are ATSes? • What’s the community structure of ATSes? • How are users impacted by ATSes? • Conclusion

Table of contents• Why study the mobile app tracking in China?• Dataset and methodology• How prevalent are ATSes? • What’s the community structure of ATSes? • How are users impacted by ATSes? • Conclusion

Rising concerns about mobile app tracking• CISCO projected: by 2022, there will be 1.5
mobile devices per capita and monthly global mobile data traffic will be 77 EB
• Many mobile apps are bundled with mobile Advertising and Tracking Services (ATSes) for various purposes
• Concerns: • Rich and sensitive user data• Beyond users’ control

• One of the fastest-growing countries in mobile data traffic• By 2022, the mobile data will reach 17.5 EB per month
• Unique local regulations and network policies• Many western services (e.g. Google, Facebook) are not accessible
• Chinese tracking market is poorly understood• Who are the major players?• What kind of mobile apps do trackers prefer? • . . . . . .
How about China?
Source:marketingtochina.com,2017

Table of contents• Why study the mobile app tracking in China?• Dataset and methodology• How prevalent are ATSes? • What’s the community structure of ATSes? • How are users impacted by ATSes? • Conclusion
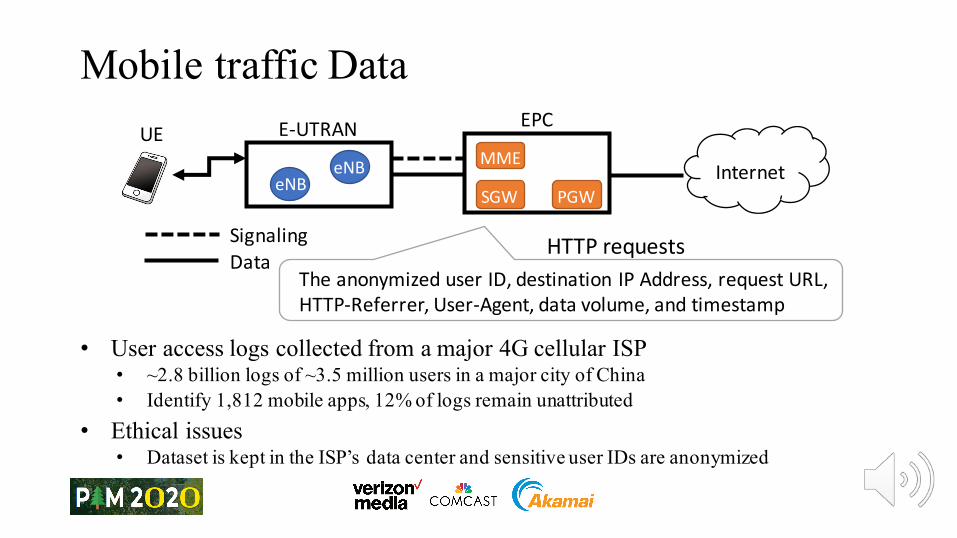
Mobile traffic Data
• User access logs collected from a major 4G cellular ISP• ~2.8 billion logs of ~3.5 million users in a major city of China• Identify 1,812 mobile apps, 12% of logs remain unattributed
• Ethical issues• Dataset is kept in the ISP’s data center and sensitive user IDs are anonymized
E-UTRAN EPC
SignalingData
Internet
UE
eNBeNB
SGW PGW
MME
Theanonymized userID,destinationIPAddress,requestURL,HTTP-Referrer,User-Agent,datavolume,andtimestamp
HTTPrequests

• Identify ATS domains• 4 ATS-specific lists: AdBlock-Plus (the easylist, easyprivacy lists, and easylist China) and
hpHosts (the ATS lists)• Apply the rules to both the URL and HTTP-Referrer • 260M HTTP requests (9.2%) are from ATS domains, 24,985 FQDNs and 8,773 SLDs
• Associate ATS domains to apps :• We focus on the top-500 apps that account for 99% of traffic• Heuristic approach: associate an ATS request to the closest app’s request that precedes it• Intuition: ATS’s requests should happen at a time close to the app’s access (<1s)• Problem
• background traffic from other mobile apps• periodic requests issued by some trackers
Data processing

• Associate ATS domains to apps : heuristic approach
Data processing
… …
intervalτ
session:ifτ >T
Requestsofauser
Apprequest(user’sactivity)
Backgroundtraffic Periodicrequests
T=1min >1apps Seenbyfewusers
Userrequests
SessionsSessionparsing AssociateeachATStoitsclosetapp
CandidateATS-apppairs
Sessionfiltering
Pairsfiltering
< 1second
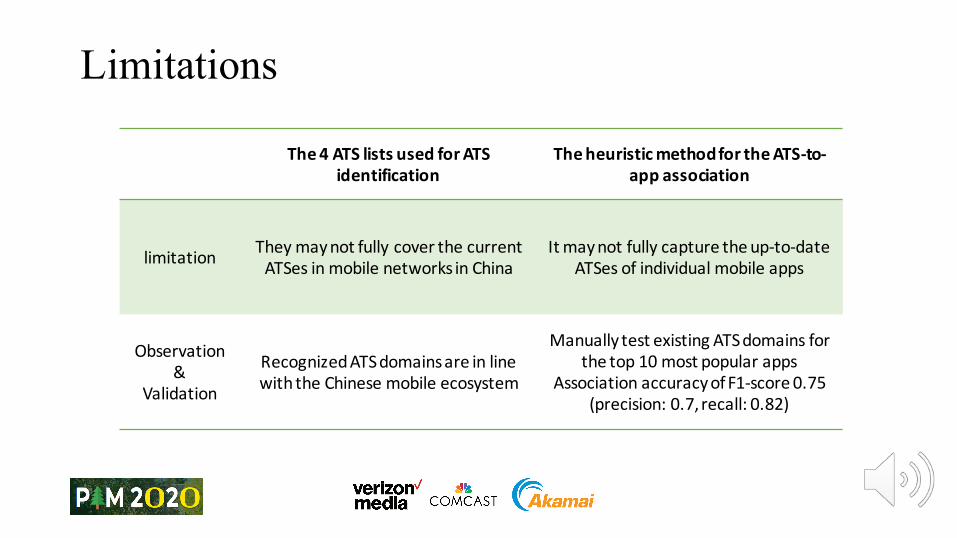
Limitations
The4ATSlistsusedforATSidentification
TheheuristicmethodfortheATS-to-appassociation
limitation TheymaynotfullycoverthecurrentATSes inmobilenetworksinChina
Itmaynotfullycapturetheup-to-dateATSes ofindividualmobileapps
Observation&
Validation
RecognizedATSdomainsareinlinewiththeChinesemobileecosystem
ManuallytestexistingATSdomainsforthetop10mostpopularapps
AssociationaccuracyofF1-score0.75(precision:0.7,recall:0.82)

Table of contents• Why study the mobile app tracking in China?• Dataset and methodology• How prevalent are ATSes? • What’s the community structure of ATSes? • How are users impacted by ATSes? • Conclusion

• Model a bipartite graph G = (U, V, E) • Based on the domains (FQDNs) accessed within an app • U: mobile apps• V: the ATS and normal visited domains
• G reveals the connections between ATS domains and mobile apps
Metrics
Normal
ATSapp
b c da e
GraphGU
V

• ATSes are widely used by mobile apps• 6 ATSes for FQDNs (4 ATSes for SLDs) per app in median
• Cross-app tracking of users• Over 30% of ATSes appear in at least 2 apps
• China’s tracking ecosystem is dominated by key domestic trackers
Presence of ATSes
pingma.qq.com,zxcv.3g.qq.com,omgmta.qq.com,sngmta.qq.com,mi.gdt.qq.com …
Thetop20ATSdomains (SLDs)measuredbythenumberofapps theyareusedby
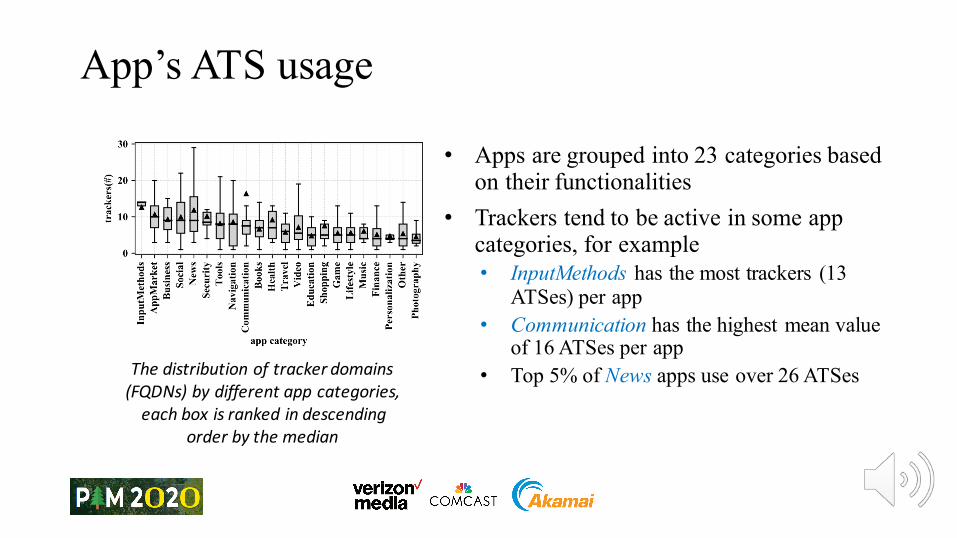
App’s ATS usage
• Apps are grouped into 23 categories based on their functionalities
• Trackers tend to be active in some app categories, for example• InputMethods has the most trackers (13
ATSes) per app• Communication has the highest mean value
of 16 ATSes per app • Top 5% of News apps use over 26 ATSesThedistributionoftrackerdomains
(FQDNs)bydifferentappcategories,eachboxisrankedindescending
orderbythemedian

Table of contents• Why study the mobile app tracking in China?• Dataset and methodology• How prevalent are ATSes? • What’s the community structure of ATSes? • How are users impacted by ATSes? • Conclusion

Metrics• Model a bipartite graph G = (U, V, E)
• Based on the domains (FQDNs) accessed within an app • U: mobile apps• V: the ATS and normal visited domains
• 1-mode ATS-projection graph G′ = (V′, E′)• Create from the largest connected component in G• V′ : the ATS domains in V• E′ : if two vertices share a common neighbor (app) in G
• G′ captures the co-location of multiple ATSes used within individual apps
normal
ATSapp
da
b c da e
e
GraphG
GraphG‘
U
V
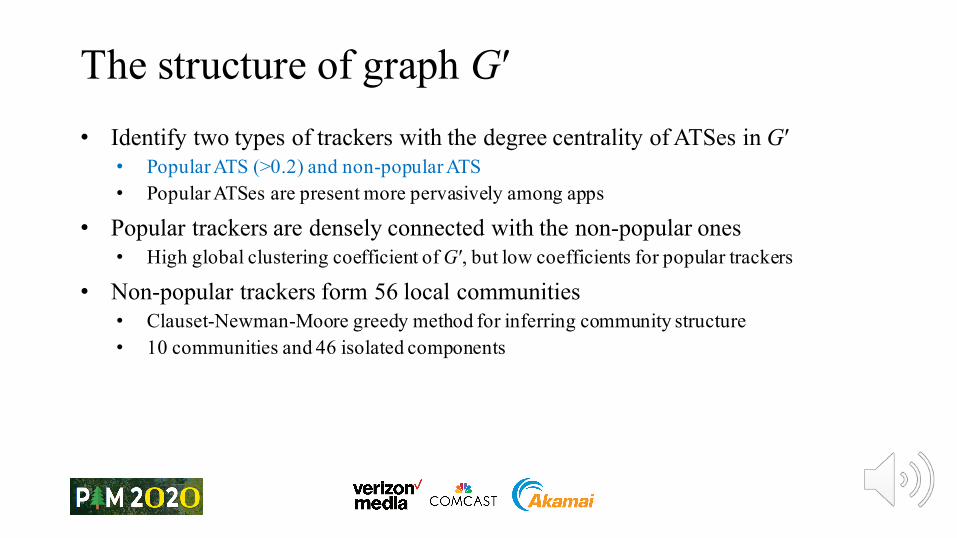
The structure of graph G′• Identify two types of trackers with the degree centrality of ATSes in G′
• Popular ATS (>0.2) and non-popular ATS• Popular ATSes are present more pervasively among apps
• Popular trackers are densely connected with the non-popular ones • High global clustering coefficient of G′, but low coefficients for popular trackers
• Non-popular trackers form 56 local communities• Clauset-Newman-Moore greedy method for inferring community structure• 10 communities and 46 isolated components

• The popular trackers tend to co-locate in the same apps with each other• qq.com (Tencent), umeng.com (Alibaba), 71.am (Baidu)
Co-location of ATSes
Theco-occurrenceprobabilitydistribution ofthetop20ATSes (SLDs),Quantified bytheJaccard Similarity
Coefficientandrankedbythepopularity

• The local community of non-popular trackers is dedicated to specific app categories• Tracker Specialization Index (TSI): |"($)∩"(')|
|"($)|,𝑈(𝑎) and 𝑈(𝑏) are sets of trackers in the
local community a and app category b
Specialization of ATSes
TSIdistributionofnon-popular trackercommunities
Non-popular ATSlocalcommunities tendtobespecializedinonlyoneortwoappcategorieswithTSI≥0.5
Weobserve thattheyprovidespecializedtrackingservicesrelevanttoparticularapps,e.g.educationapps

Table of contents• Why study the mobile app tracking in China?• Dataset and methodology• How prevalent are ATSes? • What’s the community structure of ATSes? • How are users impacted by ATSes? • Conclusion

ATS Monopolies• To test whether ATSes have a monopoly on
certain users’ data• UTP : user tracking potential
• Fraction of users that a tracker can track
• TMI: tracking monopoly index• The extent to which a tracker reaches users that
others do not have • 𝑇𝑀𝐼/ =
1|23|
∑ 1|56 |7∈23 ,
Si : the set of users that can be reached by tracker imj : the number of trackers that can reach user j
Tracker1 Tracker2
Tracker3
UTP=4/7TMI=1/4*(1/2+1+1/2+1/2)=5/8
UTP=2/7TMI=1/2*(1+1)=1
user

• High penetration of the tech giants, for example• qq.com (Tencent) holds a high UTP (over 0.8) and TMI (about 0.3) metrics• 71.am (Baidu), uc.cn (Alibaba), 360.cn (360 Security) track under 20% of users, but have
relatively high TMIs (about 0.3)
ATS Monopolies
UTPandTMIdistributionofthetop30trackerdomains (SLDs),rankedindescendingorderby
theUTPvalues

ATS traffic consumption & PII leakage• ATS v.s. app traffic volumes
• 5% of users send over 10% of app traffic to trackers • iOS users tend to send less data to trackers than
Android users
• PII leakage and regional destination• Detect the common UIDs in URLs• 10% of users send their PII to trackers• IMEI, IMSI, and MAC are equally likely to be
collected by trackers • 90% of PII tracking flows are inside mainland China
Trackingdomains (SLDs)thatcollectPII
CommonUIDshostonmobiledevices
Table of contents• Why study the mobile app tracking in China?• Dataset and methodology• How prevalent are ATSes? • What’s the community structure of ATSes? • How are users impacted by ATSes? • Conclusion

Summary of contributions• The first study on China’s mobile app tracking from a 4G cellular network
• Key finding 1: a distinctive mobile tracking market dominated by several top popular domestic trackers• Prevalent cross-tracking of users and Prominent tracking in some types of apps
• Key finding 2: a well-connected tracking community• Popular trackers regularly co-occur with non-popular ones • Non-popular trackers cluster into local communities, each community tends to track a
particular relevant type of apps
• Key finding 3: most of the PII data are confined to China • 10% of users send PII data to trackers