Exploring the characteristics of innovation alliances of
22
ISSN 2280-6180 (print) © Firenze University Press ISSN 2280-6172 (online) www.fupress.com/bae Bio-based and Applied Economics 2(1): 91-111, 2013 Exploring the characteristics of innovation alliances of Dutch Biotechnology SMEs and their policy implications PHILIPP J.P. GARBADE 1 , S.W.F. (ONNO) OMTA 2, *, FRANCES T.J.M. FORTUIN 1 1 Food Valley Organization, Postbus 294, 6700 AG Wageningen, The Netherlands 2 Wageningen University, P.O. Box 8130, 6700 EW Wageningen, The Netherlands Abstract. Policy makers are becoming increasingly aware of the fact that R&D inten- sive SMEs play a pivotal role in providing sustainable economic growth by maintain- ing a high rate of innovation. To compensate for their financial vulnerability, these SMEs increasingly conduct innovation in alliances. is paper aims to explore the impact of different alliance characteristics on the performance of Dutch biotechnology SMEs. e conceptual model was tested using a sample of 18 biotech SMEs reporting about 40 alliances. e main findings indicate that alliance performance is positively related to the level of complementarity, the cognitive distance and tacit knowledge transfer by the human resources exchanges. Policy makers are recommended to sup- port innovation alliances by providing the infrastructure in which alliances can flour- ish, e.g. through stimulating the foundation of cluster organizations that can function as innovation brokers. ese cluster organizations can provide network formation, demand articulation, internationalization and innovation process support to their member companies and can act as a go-between among alliance partners. As part of the innovation process support activities, they can organize special workshops for bio- tech SMEs on how to successfully behave in an innovation alliance. Keywords. knowledge transfer, human resources exchange, biotechnology alliances JEL Codes. O32 1. Introduction Policy makers are becoming increasingly aware of the fact that R&D intensive SMEs play a pivotal role in providing sustainable economic growth by maintaining high innova- tion rates. To compensate for their financial vulnerability, these SMEs increasingly con- duct innovation in alliances. A good understanding of the mechanisms that govern such innovation alliances is therefore a prerequisite for an effective innovation policy. is paper aims at contributing to our understanding of the dynamics of innovation alliances by exploring the impact of different alliance characteristics on the performance of Dutch biotechnology SMEs. An R&D intensive biotech SME is oſten the product of an innovative idea; an ad-hoc creation triggered by the presence of a “star scientist” (Zucker * Corresponding author: [email protected].
Transcript of Exploring the characteristics of innovation alliances of

ISSN 2280-6180 (print) © Firenze University Press ISSN 2280-6172 (online) www.fupress.com/bae
Bio-based and Applied Economics 2(1): 91-111, 2013
Exploring the characteristics of innovation alliances of Dutch Biotechnology SMEs and their policy implications
PhiliPP J.P. Garbade1, S.W.F. (OnnO) Omta2,*, FranceS t.J.m. FOrtuin1 1 Food Valley Organization, Postbus 294, 6700 AG Wageningen, The Netherlands2 Wageningen University, P.O. Box 8130, 6700 EW Wageningen, The Netherlands
Abstract. Policy makers are becoming increasingly aware of the fact that R&D inten-sive SMEs play a pivotal role in providing sustainable economic growth by maintain-ing a high rate of innovation. To compensate for their financial vulnerability, these SMEs increasingly conduct innovation in alliances. This paper aims to explore the impact of different alliance characteristics on the performance of Dutch biotechnology SMEs. The conceptual model was tested using a sample of 18 biotech SMEs reporting about 40 alliances. The main findings indicate that alliance performance is positively related to the level of complementarity, the cognitive distance and tacit knowledge transfer by the human resources exchanges. Policy makers are recommended to sup-port innovation alliances by providing the infrastructure in which alliances can flour-ish, e.g. through stimulating the foundation of cluster organizations that can function as innovation brokers. These cluster organizations can provide network formation, demand articulation, internationalization and innovation process support to their member companies and can act as a go-between among alliance partners. As part of the innovation process support activities, they can organize special workshops for bio-tech SMEs on how to successfully behave in an innovation alliance.
Keywords. knowledge transfer, human resources exchange, biotechnology alliances
JEL Codes. O32
1. Introduction
Policy makers are becoming increasingly aware of the fact that R&D intensive SMEs play a pivotal role in providing sustainable economic growth by maintaining high innova-tion rates. To compensate for their financial vulnerability, these SMEs increasingly con-duct innovation in alliances. A good understanding of the mechanisms that govern such innovation alliances is therefore a prerequisite for an effective innovation policy.
This paper aims at contributing to our understanding of the dynamics of innovation alliances by exploring the impact of different alliance characteristics on the performance of Dutch biotechnology SMEs. An R&D intensive biotech SME is often the product of an innovative idea; an ad-hoc creation triggered by the presence of a “star scientist” (Zucker
* Corresponding author: [email protected].

92 P.J.P. Garbade, S.W.F. (Onno) Omta, F.T.J.M. Fortuin
and Darby, 1997), following a high-risk strategy that involves cutting edge science (Pisano, 2006). Hall and Bagchi-Sen (2002) found in their sample of 74 biotech companies in Can-ada (95% SMEs) that 28% of the companies originated from universities and 15% were industrial spin-offs, whereas more than 50% was founded as independent ventures (Hall and Bagchi-Sen, 2002).
Small biotechnology companies are frequently facing resources constraints (Majewski, 1998). Considerable capital investments are needed to pay for specialized staff and equip-ment to develop new products and processes and to successfully introduce them to the market. This problem is even more pressing because biotechnology companies, especial-ly those related to the health sector, face long time horizons until first revenues begin to pour in, which often makes them not profitable for a long period of time (Denis, 2004). Bagchi-Sen (2002) mentions the following barriers to innovation: lack of skilled manag-ers or researchers, a lack of physical facilities for research or manufacture, as well as a lack of marketing or distribution channels. Biotechnology firms may suffer from resource con-straints, but at the same time they generally have a lower bureaucratic burden. They are usually considered to be more flexible and therefore better innovators. Unique compe-tencies, a low level of hierarchy and a high internal flexibility (Nooteboom, 1994, Pisano, 2006) make up for their lower financial power (Argyres and Liebeskind, 2002). A general overview of the advantages and disadvantages of SMEs, not limited to the biotech sector, is provided in the literature review of Ale-Ebrahim et al. (2010), while Khilij et al. (2006) conducted exploratory research specifically on the challenges of biotech SMEs.
Mangematin et al. (2003) found in their study of 60 French biotech SMEs, an aver-age growth rate of 30% in turnover and 13% in staff. Still, only a small number of biotech firms grow into reasonably large companies, especially those companies that have learned to engage in collaboration projects with a heterogeneous set of partners (Powell et al., 2005). The forming of alliances as an effective tool to overcome the problems of limited resources was also found in a study of Rothaermel and Deeds (2004) on 325 health relat-ed biotechnology companies. Strategic alliances constitute a powerful strategy for biotech firms to overcome their capital constraints (Khilji et al., 2006) and are found to accelerate innovation (Terziovski and Morgan, 2006). Alliances allow access to missing competences and material resources and thus enhance the innovative potential and firm performance (Hall and Bagchi-Sen, 2002, 2007). However, Khilji et al. (2006) indicate that not enough is known on how to successfully manage a strategic alliance. Pisano (2006) criticizes that business models, organizational strategies and approaches from other high-tech sectors have been used while not taking into account the special characteristics of the biotech sec-tor, and that organizational and institutional innovations are needed to unlock the potential of biotechnology (Pisano, 2006:202).
The high level of innovativeness of the biotech sector, combined with the high level of alliance formation makes it an ideal sector to study the critical success factors for collabo-rative ‘open’ (Chesborough, 2006) innovation. To date, a number of empirical studies have been carried out to study alliance collaboration in this sector. They focus on the company performance related to the alliance portfolio (see Baum et al., 2000; George et al., 2001), the network composition and dynamics (Gay and Dousset, 2005), or the alliance dura-tion in an uncertain environment (Pangarkar, 2003). The alliance collaboration process concerning knowledge management (i.e. Nooteboom et al., 2007, Standing et al., 2008),

93Exploring the characteristics of innovation alliances
alliance capabilities (Heimeriks and Duysters, 2007) and governance (Phene and Tallman, 2012) are also the focus of more recent studies. However, a literature review (not only on biotech alliances) done by Comi and Eppler (2009), is still highlighted a lack of research on alliance management, especially in startup biotech companies.
The objective of the present paper is to fill this gap by studying the alliance collabora-tion process to explore the attributes of both successful and less successful innovation alli-ances among biotech SMEs. This will allow the improvement of policy support focusing on alliance collaboration process. To this end, different types of alliances, that were set up to carry out joint open innovation projects (in the remainder of this paper termed ‘inno-vation alliances’), are investigated and their effect on the alliance potential, alliance execu-tion and the alliance performance is mapped.
The remainder of this paper is organized as follows: Section 2 contains the Theoretical framework. In this section the discussion of the Resource Based View (RBV) will lead to the conceptual model in which the concepts relevant for this research and their relation-ships are identified. At the beginning of Section 3, Research methodology, the operationali-zation of the constructs is presented. Section 3 also discusses the methods of data collec-tion and data analysis. Section 4, Results, starts with the baseline description of the par-ticipating companies and their alliances. Next, the results are analyzed using partial least squares, while comparing the theoretically expected results with the empirically model. In Section 5, Conclusions and Discussion, the main conclusions are drawn, and suggestions for further research are given and recommendations for practitioners and policy makers are provided.
2. Theoretical framework
In management literature it has been argued that strategic technology partnering can induce the effective use of heterogenic resources (Hagedoorn, 1993; Powell et al., 1996; Ahuja, 2000; Rowley et al. 2000; Rosenkopf & Almeida, 2003). A better under-standing of this phenomenon is achieved by application of the RBV (Barney, 1991, Alegre et al., 2011). RBV is based on two fundamental assumptions: companies in an industry do not all possess the same resources which provides resource heterogeneity, whereas the partial immobility of these resources preserves this state of disequilibrium (Barney, 1991). Following the line of thought of the RBV, an alliance is a tool to (partly) overcome the problem of the immobility of resources by creating a new entity with a unique set of resources. Nooteboom et al., (2007) claims that while the antecedents of resource heterogeneity and the consequences for the firm’s innovation performance have been studied, the direct effects on the innovation process have largely been ignored. Nooteboom et al. fills this gap by shedding light on the causal factors underlying the inter-firm learning process, especially with regard to the cognitive distance between firms. Our study aims at taking Nooteboom et al.’s important conceptual idea a step further, by looking at alliance formation and execution from a process perspective. We do this by modeling the collaborative open innovation process for which the alliance is set up: from the potential of the alliance for the participating companies via the alliance execution to the final alliance performance.

94 P.J.P. Garbade, S.W.F. (Onno) Omta, F.T.J.M. Fortuin
2.1 Conceptual Model
The model developed for the present study conceptualizes the alliance as a collabora-tive entity created by two or more companies in order to innovate. Several factors that are expected to play a role in the innovation alliance collaboration process have been identi-fied. These factors and their assumed relationships are presented in the conceptual model in Figure 1. The different constructs are discussed in more detail in the following sections.
Figure 1: Conceptual model 1 2
Level of
complementarity
Alliance
importance
Cognitive distance
Alliance
compliance
Knowledge transfer
Governance mechanisms
Alliance synergy
Exploration and Exploitation performance
Alliance potential Alliance execution Alliance performance
2.2 Alliance Potential
In the phase preceding the actual start of an alliance, potential partners have to be identified. Each potential partner has not only its own distinct set of material and imma-terial resources, but also a different expectation of what it might gain from the alliance. The decisions made in the selection process set the stage for the alliance, and determine the alliance potential. We identified the following factors as determinants for the alliance potential: Level of complementarity, Cognitive distance and Alliance importance.
2.2.1 Level of Complementarity and Cognitive Distance
Each potential partner has its own distinct set of material and immaterial resources. The decision has to be made whether to search for partners with similar or complimen-tary resources. By combining similar resources, realizing economies of scale and scope can be expected (Ansoff, 1965; Montgomery, 1985), whereas an alliance with a partner that has complementary resources synergy effects might be obtained (Harrison et al., 2001). According to RBV, alliances can be considered as tools to create new unique sets
95Exploring the characteristics of innovation alliances
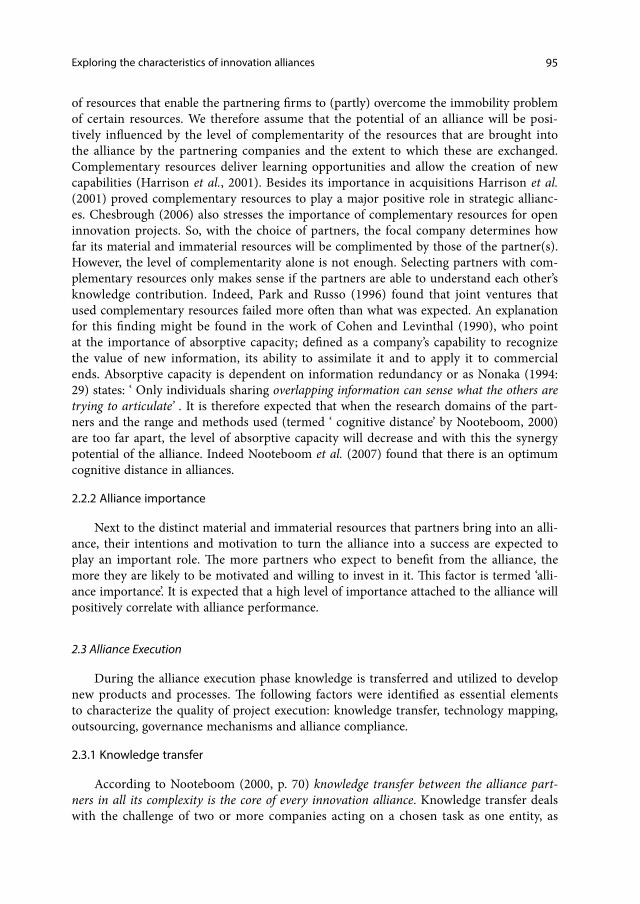
of resources that enable the partnering firms to (partly) overcome the immobility problem of certain resources. We therefore assume that the potential of an alliance will be posi-tively influenced by the level of complementarity of the resources that are brought into the alliance by the partnering companies and the extent to which these are exchanged. Complementary resources deliver learning opportunities and allow the creation of new capabilities (Harrison et al., 2001). Besides its importance in acquisitions Harrison et al. (2001) proved complementary resources to play a major positive role in strategic allianc-es. Chesbrough (2006) also stresses the importance of complementary resources for open innovation projects. So, with the choice of partners, the focal company determines how far its material and immaterial resources will be complimented by those of the partner(s). However, the level of complementarity alone is not enough. Selecting partners with com-plementary resources only makes sense if the partners are able to understand each other’s knowledge contribution. Indeed, Park and Russo (1996) found that joint ventures that used complementary resources failed more often than what was expected. An explanation for this finding might be found in the work of Cohen and Levinthal (1990), who point at the importance of absorptive capacity; defined as a company’s capability to recognize the value of new information, its ability to assimilate it and to apply it to commercial ends. Absorptive capacity is dependent on information redundancy or as Nonaka (1994: 29) states: ‘ Only individuals sharing overlapping information can sense what the others are trying to articulate’ . It is therefore expected that when the research domains of the part-ners and the range and methods used (termed ‘ cognitive distance’ by Nooteboom, 2000) are too far apart, the level of absorptive capacity will decrease and with this the synergy potential of the alliance. Indeed Nooteboom et al. (2007) found that there is an optimum cognitive distance in alliances.
2.2.2 Alliance importance
Next to the distinct material and immaterial resources that partners bring into an alli-ance, their intentions and motivation to turn the alliance into a success are expected to play an important role. The more partners who expect to benefit from the alliance, the more they are likely to be motivated and willing to invest in it. This factor is termed ‘alli-ance importance’. It is expected that a high level of importance attached to the alliance will positively correlate with alliance performance.
2.3 Alliance Execution
During the alliance execution phase knowledge is transferred and utilized to develop new products and processes. The following factors were identified as essential elements to characterize the quality of project execution: knowledge transfer, technology mapping, outsourcing, governance mechanisms and alliance compliance.
2.3.1 Knowledge transfer
According to Nooteboom (2000, p. 70) knowledge transfer between the alliance part-ners in all its complexity is the core of every innovation alliance. Knowledge transfer deals with the challenge of two or more companies acting on a chosen task as one entity, as

96 P.J.P. Garbade, S.W.F. (Onno) Omta, F.T.J.M. Fortuin
a sense making system (Weick, 1995; Choo, 1998). Nonaka (1994) identifies two forms of knowledge: explicit and tacit knowledge, and four ways in which knowledge can be transferred: from explicit to explicit, from explicit to tacit, from tacit to explicit, and from tacit to tacit. Where explicit knowledge is stored in codified form and can be transferred through documents, tacit knowledge requires human interaction to transfer i.e. through shared experience (Nonaka, 1994). Nonaka and van Krogh (2009) therefore recommend human resource exchange as an effective way to transfer knowledge because it implies a flow of information comprising of both tacit and explicit knowledge. It allows for all four forms of knowledge transfer by creating a mutual understanding including social practices and enables the transformation of resources from both alliance partners into something new. Also mutual support in terms of management, coaching and training is assumed to lead to knowledge transfer between the alliance partners.
2.3.2 Alliance compliance
Low alliance compliance is a factor that can crush the expectations resulting from the alliance potential assessment. Issues like trust and cooperation within high tech alli-ances are found to be positively related to human resource exchange practices (Collins and Smith, 2006). The level to which partners adhere to the agreements made before the actual start of the innovation alliance (termed ‘alliance compliance’) is expected to play an important role by creating the trust and spirit of cooperation necessary for the smooth execution of the collaborative open innovation project. If there is no compliance because of mistrust due to opportunism, missing coordination of company actions knowledge transfer might be lowered. In a company collaboration context this also means that the process of transforming tacit into explicit knowledge slows down or even stops.
2.3.3 Governance mechanisms
Nooteboom (2000) provides a literature review on the problems in governing knowl-edge transfer. He lists notion of “hostages”, redistribution of ownership of specific invest-ments, balance of mutual dependence, and reputation mechanisms as possible governance mechanisms to deal with these problems. In this paper, we focus on technology mapping, with mutual dependence, and outsourcing of certain innovation activities which encom-passes the (re) distribution of ownership. The notions of hostages and reputation mecha-nism were not included in the present paper, since no trustworthy quantitative data could be collected, due to socially desired answers. Here an observatory approach is suggested for further research.
2.3.4 Technology mapping
Intellectual Property (IP) is important in alliances in which the partners work closely together to reach certain innovation aims and objectives. IP management is connected to terms like, IP valuation, IP licensing, IP preparation for sale, detection of infringements, and use of IP intermediate markets (Chesbrough, 2006). To secure the ownership of IP after a completed discovery is a big issue and is becoming even more challenging in the world of open innovation, where “technologies flow across the boundary of the firm” (per-
97Exploring the characteristics of innovation alliances
haps multiple times) and where “obtaining the ability to practise a technology without incurring an infringement action by another firm is more challenging because the full history of the technology development is well known” (Chesbrough, 2006, p. 67).
Patents are often used to protect knowledge from being stolen, provide a possibility to legally own it and make it tradable. Patents also indicate the value as a network partner as shown by the research of Smith-Doerr et al. (1999) on biotechnology firms.
Patents reduce the risk of infringement but only if all of the knowledge used in the technology application is included in that patent, or possibly in several patents. So to pre-vent infringements patent mapping is unavoidable. Patent mapping checks for all of the granted claims of a patent that is owned by the company and looks also at possible claims that could arise from other patent holders (Chesbrough, 2006). This might lead to efforts to obtain possession of patents that are holding key positions in the innovation process of the company or the alliance. In order to reduce the risk of exploring without being able to exploit, one should think of starting patent mapping already early in the innovation process. This reduces the risk of being left with a discovery at the end of the innovation process that cannot be exploited. In an innovation alliance there is also the possibility that the alliance partners look at each other’s patents in order to investigate their potential. In a study about Canadian biotechnology start-ups, Baum et al. (2000) found alliances that provide access to more diverse information and capabilities per alliance … will prove most beneficial to startups. So resources exchange in the form of IP may be enhanced by let-ting the alliance partner having a closer look at the patents in store or at technologies with no patents or no patents granted yet. This is also the reason that we prefer to use the term technology mapping in this paper. We extend the meaning beyond the IP protection aspect and focus also on using it as an alliance internal communication tool, and conse-quently, also as a governance mechanism to transfer knowledge. By mapping the differ-ent technologies used in an alliance in a shared document, explicit knowledge as well as redundancies are created. This will help to understand each other’s knowledge domains (e.g. Nooteboom, 2000) and since tacit knowledge is turned into explicit knowledge, alli-ance coordination is simplified.
2.3.5 Outsourcing
Complementary resources possess the potential to enhance synergy. In cases where knowledge is easy to transfer this process is straight forward. However, in cases where the complexity of matching complementarity resources is high, this could lead to hold up (Nooteboom, 2000). The way to synergy creation might then go via direct outsourc-ing of activities to the alliance partner without much direct contact lowering coordination costs. However outsourcing also demands knowledge transfer in order to determine which activities are to be outsourced and in what way the outsourcing process will be set up.
2.4 Alliance Performance
In industry, performance can be assessed at the innovation process level (innovative performance) and at the industrial outcome level (industrial performance, Omta and de Leeuw, 1997). Since the research process takes place within an alliance we are looking at
98 P.J.P. Garbade, S.W.F. (Onno) Omta, F.T.J.M. Fortuin
the innovative performance at the alliance level. Alliance performance in our paper there-fore focuses on the output resulting from the collaboration. Next to the direct results in terms of new products and processes, this could be new contacts, a better reputation within a network, or a new line of thinking. All of these outcomes may lead to a higher potential of future alliances with current or other partners and therefore demands a dynamic model. However, for the present paper, the choice was made to look at the alliance at one point in time. Therefore the output focus lies on the synergy created and in how far the alliance resulted in new knowledge (inventions) and new products and processes (innovations).
2.4.1 Alliance synergy
Synergy describes a situation where the final outcome of a system is bigger than the sum of its parts. This can be found in an alliance in the form of new knowledge that sur-mounts the knowledge input that was brought into the alliance from both alliance sides as well as to new processes and technologies resulting from the alliance.
2.4.2 Exploration and Exploitation performance
Alliance performance covers exploitation performance and exploration performance, where exploitation is concerned with the refinement and extension of existing technolo-gies (Lavie and Rosenkopf, 2006) and exploration is rooted in the extensive search for potential new knowledge (March, 1991).
The theory leads to the following general hypothesis: Innovation alliances that show a higher level of complementarity and overcome cognitive distance with intense knowledge trans-fer lead to the creation of synergy and ultimately to a higher level of innovation performance.
3. Research methods
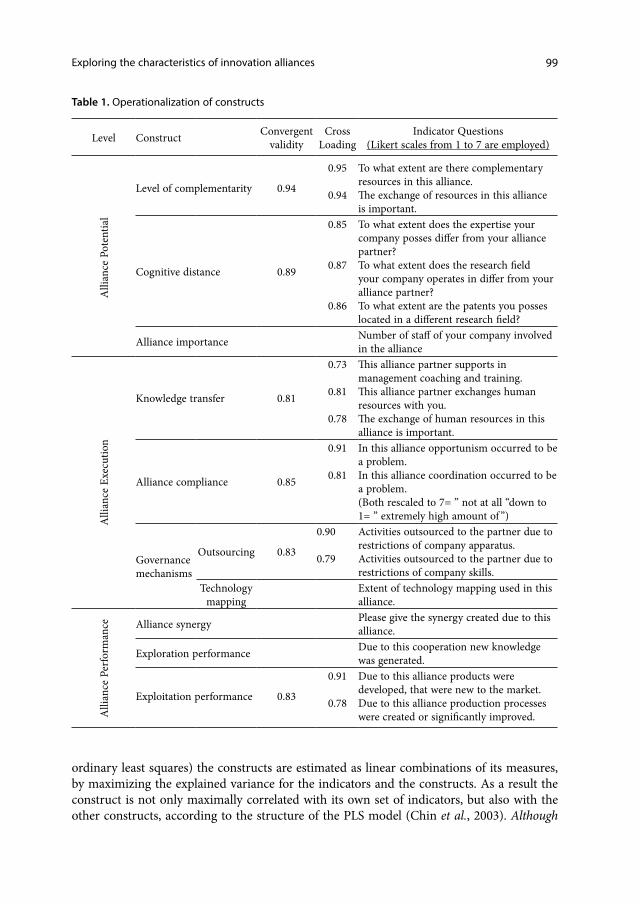
For this study a sample was composed of firms active in the Dutch biotechnology sec-tor. Eighteen SMEs participated in the study, reporting about 40 alliances. For the empiri-cal test of the model a two-step approach was chosen. Firstly the constructs used in the model were operationalized. Then the respondents were given the survey to answer the indicator questions on a Likert scale of 1 (“not at all”) to 7 (“to a very large extent”). The detailed items used to measure each construct are listed in Table 1.
Partial Least Squares (PLS) software ( Ringle et al., 2005) was used to model the alliance collaboration process and to test the main hypothesis. PLS delivers construct scores, i.e. proxies of the constructs, which are measured by one or several indicators (Henseler et al., 2009:283). PLS is a causal modeling approach, developed by Wold in 1975 and applicable in strategic management research (Hulland, 1999). PLS is similar to regression, but simultaneously models the structural path (i.e. theoretical relationship among constructs) and the measurement path (i.e. relationship between a construct and its indicators, Chin et al., 2003, p. 25).
The procedure enables the modelling of constructs and gives more accurate estimates of interaction effects between constructs, as it takes the measuring errors in the underly-ing indicators into account.
PLS shows the significant effects of the different constructs on each other, while every construct itself is reflected by its indicators (measures). With the help of PLS (a series of
99Exploring the characteristics of innovation alliances
ordinary least squares) the constructs are estimated as linear combinations of its measures, by maximizing the explained variance for the indicators and the constructs. As a result the construct is not only maximally correlated with its own set of indicators, but also with the other constructs, according to the structure of the PLS model (Chin et al., 2003). Although
Table 1. Operationalization of constructs
Level Construct Convergent validity
CrossLoading
Indicator Questions (Likert scales from 1 to 7 are employed)
Alli
ance
Pot
entia
l
Level of complementarity 0.94
0.95
0.94
To what extent are there complementary resources in this alliance.The exchange of resources in this alliance is important.
Cognitive distance 0.89
0.85
0.87
0.86
To what extent does the expertise your company posses differ from your alliance partner?To what extent does the research field your company operates in differ from your alliance partner?To what extent are the patents you posses located in a different research field?
Alliance importance Number of staff of your company involved in the alliance
Alli
ance
Exe
cutio
n
Knowledge transfer 0.81
0.73
0.81
0.78
This alliance partner supports in management coaching and training. This alliance partner exchanges human resources with you.The exchange of human resources in this alliance is important.
Alliance compliance 0.85
0.91
0.81
In this alliance opportunism occurred to be a problem.In this alliance coordination occurred to be a problem.(Both rescaled to 7= ” not at all “down to 1= ” extremely high amount of ”)
Governance mechanisms
Outsourcing 0.83
0.90
0.79
Activities outsourced to the partner due to restrictions of company apparatus.Activities outsourced to the partner due to restrictions of company skills.
Technology mapping
Extent of technology mapping used in this alliance.
Alli
ance
Per
form
ance Alliance synergy Please give the synergy created due to this
alliance.
Exploration performance Due to this cooperation new knowledge was generated.
Exploitation performance 0.83
0.91
0.78
Due to this alliance products were developed, that were new to the market.Due to this alliance production processes were created or significantly improved.
100 P.J.P. Garbade, S.W.F. (Onno) Omta, F.T.J.M. Fortuin
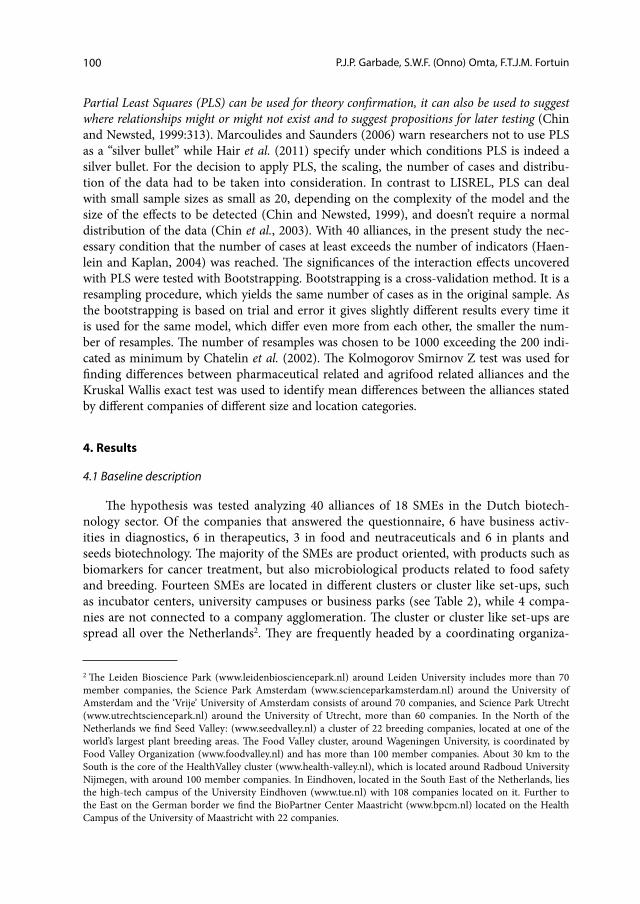
Partial Least Squares (PLS) can be used for theory confirmation, it can also be used to suggest where relationships might or might not exist and to suggest propositions for later testing (Chin and Newsted, 1999:313). Marcoulides and Saunders (2006) warn researchers not to use PLS as a “silver bullet” while Hair et al. (2011) specify under which conditions PLS is indeed a silver bullet. For the decision to apply PLS, the scaling, the number of cases and distribu-tion of the data had to be taken into consideration. In contrast to LISREL, PLS can deal with small sample sizes as small as 20, depending on the complexity of the model and the size of the effects to be detected (Chin and Newsted, 1999), and doesn’t require a normal distribution of the data (Chin et al., 2003). With 40 alliances, in the present study the nec-essary condition that the number of cases at least exceeds the number of indicators (Haen-lein and Kaplan, 2004) was reached. The significances of the interaction effects uncovered with PLS were tested with Bootstrapping. Bootstrapping is a cross-validation method. It is a resampling procedure, which yields the same number of cases as in the original sample. As the bootstrapping is based on trial and error it gives slightly different results every time it is used for the same model, which differ even more from each other, the smaller the num-ber of resamples. The number of resamples was chosen to be 1000 exceeding the 200 indi-cated as minimum by Chatelin et al. (2002). The Kolmogorov Smirnov Z test was used for finding differences between pharmaceutical related and agrifood related alliances and the Kruskal Wallis exact test was used to identify mean differences between the alliances stated by different companies of different size and location categories.
4. Results
4.1 Baseline description
The hypothesis was tested analyzing 40 alliances of 18 SMEs in the Dutch biotech-nology sector. Of the companies that answered the questionnaire, 6 have business activ-ities in diagnostics, 6 in therapeutics, 3 in food and neutraceuticals and 6 in plants and seeds biotechnology. The majority of the SMEs are product oriented, with products such as biomarkers for cancer treatment, but also microbiological products related to food safety and breeding. Fourteen SMEs are located in different clusters or cluster like set-ups, such as incubator centers, university campuses or business parks (see Table 2), while 4 compa-nies are not connected to a company agglomeration. The cluster or cluster like set-ups are spread all over the Netherlands2. They are frequently headed by a coordinating organiza-
2 The Leiden Bioscience Park (www.leidenbiosciencepark.nl) around Leiden University includes more than 70 member companies, the Science Park Amsterdam (www.scienceparkamsterdam.nl) around the University of Amsterdam and the ‘Vrije’ University of Amsterdam consists of around 70 companies, and Science Park Utrecht (www.utrechtsciencepark.nl) around the University of Utrecht, more than 60 companies. In the North of the Netherlands we find Seed Valley: (www.seedvalley.nl) a cluster of 22 breeding companies, located at one of the world’s largest plant breeding areas. The Food Valley cluster, around Wageningen University, is coordinated by Food Valley Organization (www.foodvalley.nl) and has more than 100 member companies. About 30 km to the South is the core of the HealthValley cluster (www.health-valley.nl), which is located around Radboud University Nijmegen, with around 100 member companies. In Eindhoven, located in the South East of the Netherlands, lies the high-tech campus of the University Eindhoven (www.tue.nl) with 108 companies located on it. Further to the East on the German border we find the BioPartner Center Maastricht (www.bpcm.nl) located on the Health Campus of the University of Maastricht with 22 companies.

101Exploring the characteristics of innovation alliances
tion, and financed by membership fees of the participating companies and/or public mon-ey. These coordinating organizations provide network formation, demand articulation, internationalization and innovation process support (Omta and Fortuin, 2011). They do so by organizing consortium meetings and annual conferences, providing matchmaking opportunities for member companies (network formation support), issuing (web-based) innovation alerts and providing information about marketing trends (demand articulation support), representing the member companies at international fairs and organizing busi-ness missions (internationalization support), and stimulating facility sharing and organiz-ing of special workshops to enhance innovation management (innovation process support).
The SMEs organized in science parks or university campuses indicated possessing the highest alliances performance levels. SMEs not related to bioscience parks or clusters described fewer complementary resources, fewer synergistic effects, and used outsourc-ing to a lesser extent. Furthermore, they allocated a smaller level of relative importance to resource exchange, and especially to human resources exchange. Their alliance perfor-mance levels were lower compared to the other alliances in our study, although they indi-cated they faced opportunism problems to a lesser extent.
Table 2. Demographics of SMEs (n=18) and their alliances (n=40) in the present study.
SME Alliances
Bioscience park, university campus* 7 16Clusters** 7 15Not related to bioscience parks or clusters 4 9
18 40
* Leiden Bioscience Park, Utrecht Science Park, Amsterdam Science Park, Maastricht Biopartner Center, Eindhoven TU ** Food Valley, Health Valley, Seed Valley
Eleven companies employ 2 to10 full time employees, while six companies employ 10 to 30 employees, and one company even has 113 employees. Mangematin et al. (2003) found differences in their study on 60 French biotech SMEs between the slightly smaller SMEs (around 10 employees) with small innovation projects targeting niche markets and the slightly bigger SMEs (around 30 employees), which focused on radical innovation pro-jects and grew faster than the first type (Mangematin et al., 2003). Also in our study we found a number of differences related to the size of the company. The companies with 10 to 30 employees indicated a higher number of staff involved per alliance, older alliances, used technology mapping to a lesser extent and stated—probably because of the more rad-ical nature of the technology involved—a lower alliance performance level, compared to the smaller firms and the very big firm.
The 40 alliances which are the focus of our analysis are split into 26 health-related alliances in 12 companies, and 14 agrifood related alliances between 6 companies. The most important alliance partners were knowledge institutions (in 40% of the cases), big pharmaceutical and chemical trusts (in 15%), other biotech SMEs (in 18%), and non-bio-

102 P.J.P. Garbade, S.W.F. (Onno) Omta, F.T.J.M. Fortuin
tech firms, such as manufacturers (in the 27% of the cases). The sample is dominated by research consortiums and strategic alliances but also includes two informal partnerships. As primary reasons for strating the alliance, increasing innovation and the use of com-plementary technologies was mentioned most often, followed by the increased access to funding and markets. Thirty of the 40 alliances involved 1 to 3 persons from the compa-nies that answered the questionnaire. In 8 alliances, 3 to 10 persons were involved and in two alliances the number of employees involved was not given. In 30% of the alliances more than 2 companies were involved. The ages of the alliances were equally distribut-ed from 1 to 7 years. There were some differences between the groups of health-related and agrifood-related alliances that were able to be uncovered by using the Kolmogorov-Smirnov Z test. Among the health-related alliances, more technology was licensed out to the alliance partner(s), and a smaller cognitive distance characterized these alliances. The agrifood related alliances scored higher when it came to complementary resources and also with regard to the number of new products or processes that were created and improved in the alliance.
4.2 The measurement model
Hulland (1999) suggested a general methodology for applying PLS on management issues. First, the reliability and validity of the measurement model has to be assessed before the structural model can be examined and path coefficients interpreted (Hulland 1999: 198). The measurement model consists of the constructs and the indicators connect-ed to them. Its reliability and validity is assured by verifying individual item reliability, the convergent validity of measures associated with the individual constructs, and the discri-minant validity.
To measure individual item reliability, the cross-loadings between the indicators and the constructs were checked. Every indicator should, in relation to its construct, have a cross loading higher than 0.7, and indicators to which constructs are not connected should never receive high cross-loadings than those to which they are (Hulland, 1999). The cross-loadings of the indicators generated here fulfill these requirements (Table 1).
To assess the convergent validity of the measurement model a choice can be made between Cronbach’s alpha and the Composite Reliability, as developed by Fornell and Larcker (1981). Nunnally (1978) suggests 0.7 as a benchmark and according to Hulland (1999) it can be used as a cut-off point for both measures. As Cronbach’s alpha tends to underestimate the internal consistency in PLS path models (Hensler et al., 2009), the Composite Reliability was used to measure the convergent validity of the constructs in this paper. These were all above 0.7 (Table 1).
The traditional methodological complement to convergent validity is discriminant validi-ty, which represents the extent to which measures of a construct differ from measures of other constructs in the same model (Hulland 1999:199). By making use of the variance the con-struct shares with its indicators, compared to the variance it shares with the other con-structs, the discriminant validity can be assessed by using the AVE (i.e., the average vari-ance shared between a construct and its measures). The square root of the AVE should be higher than the construct correlations. Table 3 shows that this requirement is also met.

103Exploring the characteristics of innovation alliances
Table 3. Construct Correlations
1 2 3 4 5 6 7 8 9 10 Sqrt AVE AVE
1 Alliance compliance 1 0.86 0.74
2 Alliance importance -0.20 1 1 1
3 Cognitive distance -0.03 -0.11 1 0.86 0.74
4 Exploitation performance -0.21 0 -0.11 1 0.84 0.71
5 Exploration performance -0.13 0.19 0.28 0.25 1 1 1
6 Knowledge transfer 0.15 0.37 0.26 -0.18 0.56 1 0.77 0.59
7 Level of complementarity -0.36 0.1 0.07 0.23 0.48 0.29 1 0.94 0.89
8 Outsourcing -0.13 0.22 -0.12 0.31 0.38 0.41 0.22 1 0.85 0.729 Alliance synergy -0.23 -0.14 0.06 0.48 0.56 0.02 0.68 0.34 1 1 1
10 Technology mapping -0.32 0.07 -0.53 0.51 -0.08 -0.37 0.19 0.14 0.29 1 1 1
Sqrt AVE 0.86 1 0.86 0.84 1 0.77 0.94 0.85 1 1
4.3 The structural model
To what extent the path coefficient can be trusted depends on the significance level, verified by the t-values (Huber et al., 2007) that are generated with the bootstrapping pro-cedure. For our model all path coefficients are significant at least at an α = 0.05 level. The significance of estimated coefficients in the structural model can be seen in the t-values of Table 4. The extent to which the endogenous constructs are explained by the exogenous constructs in the model can be determined on the basis of the R² values (displayed below in the text along with the equations derived from the model), wherein R² values of 0.67, 0.33, and 0.19 (with regard to PLS path models) are seen as substantial, moderate, and weak, respectively (Chin 1998). Because the model was specified based on our hypotheses before the data were collected, the sample data were used to test the hypothesis only, and not to determine the structure of the model itself. Consequently there was no need for any further model validation (Kumar 2010).
The following equations can be derived from the model:
Knowledge transfer[R²=0.29] = 0.31*Cognitive distance + 0.46*Alliance importance + e1
Alliance synergy[R²=0.50] = 0.64*Level of complementarity + 0.20* Outsourcing + e2
Technology mapping[R²=0.41] = -0.46*Cognitive distance -0.28*Alliance compliance -0.21*Knowledge transfer + e3
Alliance compliance[R²=0.13] = - 0.36*Level of complementarity + e4

104 P.J.P. Garbade, S.W.F. (Onno) Omta, F.T.J.M. Fortuin
Table 4. Significance of the estimated coefficients in the structural model
Original predicted
path coefficients
Sample Mean
(bootstrap)
Standard Deviation (STDEV)
t-values
Alliance compliance -> Knowledge transfer 0,23 0,21 0,11 2,16*Alliance compliance -> Technology mapping -0,28 -0,3 0,13 2,18*Alliance importance -> Knowledge transfer 0,46 0,45 0,15 3,14**Cognitive distance -> Knowledge transfer 0,31 0,33 0,12 2,49**Cognitive distance -> Technology mapping -0,46 -0,46 0,15 3,15**Knowledge transfer -> Exploration performance 0,54 0,55 0,1 5,43**Knowledge transfer -> Outsourcing 0,41 0,43 0,14 2,89**Knowledge transfer -> Technology mapping -0,21 -0,19 0,12 1,78*Level of complementarity -> Alliance compliance -0,36 -0,38 0,1 3,5**Level of complementarity -> Alliance synergy 0,64 0,63 0,11 5,97**Outsourcing -> Alliance synergy 0,2 0,21 0,12 1,75*Alliance synergy -> Exploitation performance 0,37 0,36 0,15 2,47**Alliance synergy -> Exploration performance 0,55 0,55 0,08 6,72**Technology mapping -> Exploitation performance 0,4 0,42 0,11 3,71**
*= significant with a likelihood of mistake of 5 percent one tailed**= significant with a likelihood of mistake of 1 percent one tailed
Figure 2. PLS model for testing hypotheses with path coefficients
1 2
Cognitive distance
Alliance potential Alliance execution
Technology mapping
Outsourcing
-0.36 0.64
0.46
0.31 -0.21 0.41
0.40
0.20
0.55
0.37
Exploration performance
Exploitation performance
Level of
complementarity
Alliance importance
Knowledge transfer Alliance synergy
-0.28
0.23
Alliance compliance
-0.46
0.54
Alliance performance

105Exploring the characteristics of innovation alliances
Outsourcing[R²=0.17] = 0.41*Knowledge transfer + e5
Exploration performance[R²=0.61] = 0.54* Knowledge transfer + 0.55*Alliance synergy + e7
Exploitation performance[R²=0.38]= 0.40*Technology mapping + 0.37*Alliance synergy + e8
The hypothesis, Innovation alliances that show a higher level of complementarity and overcome cognitive distance with intense knowledge transfer lead to the creation of syner-gy and ultimately to a higher level of innovation performance, holds true as the significant path coefficients in the Smart PLS model indicate.
The central role of Knowledge transfer predicated upon human resource exchange becomes visible through the model. The positive path coefficient from Cognitive distance leading to Knowledge transfer and from Knowledge transfer directly to Exploration perfor-mance underscores that human resource exchange is the primary way of exchanging and converting both explicit and tacit knowledge.
What is further interesting to note is the significantly negative path coefficient from the Level of complementarity to Alliance compliance, which seems counterintuitive at first glance. However, if it is assumed that the value of the complementary resources of each alliance partner is not equally spread among the alliance partners and if unexpected high returns might turn up, one of the partners might decide to harvest them alone, leading to opportunism and a lower Alliance compliance. This explanation is supported by the fact that a moderately negative correlation of -0.30* was found from synergy created in the alli-ance to no problems of opportunism in the alliance.
Other negative path coefficients are found from Alliance compliance to Technology mapping, from Cognitive distance to Technology mapping, and from Knowledge transfer to Technology mapping. This effectively translates into: in cases of low Alliance compliance, a small Cognitive distance and a low level of Knowledge transfer, a higher use of Technology mapping is also found. To explain the interdependence of these constructs, we can elabo-rate the story which begins from a higher Level of complementarity and results in a lower level of Alliance compliance. To avoid opportunistic behavior, there is a clear need to put the technological contribution from each partner on paper, using technology mapping in order to create a common shared vision of this. The same holds in case of a smaller Cog-nitive distance where it is even more likely that the partners doubt who is contributing what, and where concerns over becoming deprived of similar IP is higher than in alliances with a higher Cognitive distance, i.e., where the knowledge/IP contribution is clearer from the beginning. This conclusion was given further support by an interview with an R&D manager of a high-tech SME who indicated that technology and patent mapping was used only in interaction case of alliance partners with close cognitive distance. In cases of a low level of Knowledge transfer the higher level of Technology mapping can instead therefore be seen as a communication tool. The positive link between Knowledge transfer and Out-sourcing suggests that there is a need to transfer knowledge first in order to determine an innovation locus based on the core competencies and facilities of the companies. Howev-er, no significant positive link was found from Technology mapping to Outsourcing, which underlines the finding that the potential of Technology mapping as an alliance communi-cation tool is often not exploited to full extent. When it comes to alliance performance,
106 P.J.P. Garbade, S.W.F. (Onno) Omta, F.T.J.M. Fortuin
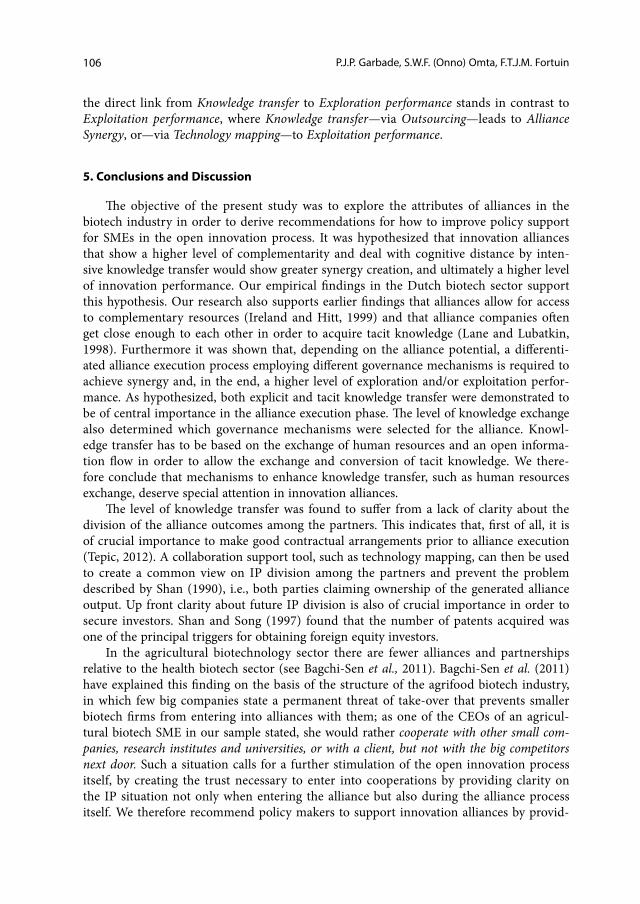
the direct link from Knowledge transfer to Exploration performance stands in contrast to Exploitation performance, where Knowledge transfer—via Outsourcing—leads to Alliance Synergy, or—via Technology mapping—to Exploitation performance.
5. Conclusions and Discussion
The objective of the present study was to explore the attributes of alliances in the biotech industry in order to derive recommendations for how to improve policy support for SMEs in the open innovation process. It was hypothesized that innovation alliances that show a higher level of complementarity and deal with cognitive distance by inten-sive knowledge transfer would show greater synergy creation, and ultimately a higher level of innovation performance. Our empirical findings in the Dutch biotech sector support this hypothesis. Our research also supports earlier findings that alliances allow for access to complementary resources (Ireland and Hitt, 1999) and that alliance companies often get close enough to each other in order to acquire tacit knowledge (Lane and Lubatkin, 1998). Furthermore it was shown that, depending on the alliance potential, a differenti-ated alliance execution process employing different governance mechanisms is required to achieve synergy and, in the end, a higher level of exploration and/or exploitation perfor-mance. As hypothesized, both explicit and tacit knowledge transfer were demonstrated to be of central importance in the alliance execution phase. The level of knowledge exchange also determined which governance mechanisms were selected for the alliance. Knowl-edge transfer has to be based on the exchange of human resources and an open informa-tion flow in order to allow the exchange and conversion of tacit knowledge. We there-fore conclude that mechanisms to enhance knowledge transfer, such as human resources exchange, deserve special attention in innovation alliances.
The level of knowledge transfer was found to suffer from a lack of clarity about the division of the alliance outcomes among the partners. This indicates that, first of all, it is of crucial importance to make good contractual arrangements prior to alliance execution (Tepic, 2012). A collaboration support tool, such as technology mapping, can then be used to create a common view on IP division among the partners and prevent the problem described by Shan (1990), i.e., both parties claiming ownership of the generated alliance output. Up front clarity about future IP division is also of crucial importance in order to secure investors. Shan and Song (1997) found that the number of patents acquired was one of the principal triggers for obtaining foreign equity investors.
In the agricultural biotechnology sector there are fewer alliances and partnerships relative to the health biotech sector (see Bagchi-Sen et al., 2011). Bagchi-Sen et al. (2011) have explained this finding on the basis of the structure of the agrifood biotech industry, in which few big companies state a permanent threat of take-over that prevents smaller biotech firms from entering into alliances with them; as one of the CEOs of an agricul-tural biotech SME in our sample stated, she would rather cooperate with other small com-panies, research institutes and universities, or with a client, but not with the big competitors next door. Such a situation calls for a further stimulation of the open innovation process itself, by creating the trust necessary to enter into cooperations by providing clarity on the IP situation not only when entering the alliance but also during the alliance process itself. We therefore recommend policy makers to support innovation alliances by provid-

107Exploring the characteristics of innovation alliances
ing an infrastructure in which alliances can flourish. One way of doing this is by stimu-lating the formation of cluster organizations that can function as innovation brokers that provide network formation-, demand articulation-, internationalization- and innovation process-support to their member companies (see also the baseline description in Omta and Fortuin, 2011); such organizations could also act as a go-between among alliance partners (Nooteboom, 1999a,b). As part of the innovation process support activities, they can organize special workshops for biotech SMEs on how to behave in an innovation alli-ance successfully. In such workshops open innovation support tools, such as contractual arrangements and technology and IP mapping can be presented. Enhanced use of these collaborative support tools may also reduce the fear among many biotech SMEs of step-ping into an alliance, because a lack of clarity regarding the future ownership of upcom-ing results often destroys the necessary compliance level needed to bring the collaboration successfully to a close.
Acknowledgments
The authors would like to thank the companies that contributed to the research. We are also grateful for the suggestions of two anonymous reviewers. Part of the study received funding from the European Union Seventh Framework Programme (FP7/2007-2013) under grant agreement n° 245301 NetGrow- “Enhancing the innovativeness of food SMEs through the management of strategic network behavior and network learning per-formance”.
References
Ahuja, G. (2000). Collaboration networks, structural holes, and innovation: a longitudinal study. Administrative Science Quarterly 45: 425-455.
Ale Ebrahim, N., Ahmed, S., and Taha, Z. (2010). SMEs; Virtual research and develop-ment (R&D) teams and new product development: A literature review. International Journal of the Physical Sciences 5: 916-930.
Alegre, J., Sengupta, K. and Lapiedra, R. (2011). Knowledge management and innovation performance in a high-tech SME industry. International Small Business Journal: Pub-lished online before print October 12 (2011).
Ansoff, H.I. (1965). Corporate strategy: An analytic approach to business policy for growth and expansion. New York: McGraw-Hill
Argyres, N.S. and Liebeskind, J.P. (2002). Governance inseparability and the evolution of the biotechnology industry. Journal of Economic Behavior and Organization 47: 197–219.
Bagchi-Sen, S., Kedron, P. and Scully, J. (2011). A study of R&D, collaboration, and loca-tion preferences of health and agricultural biotech firms. Evironment and planning. Part C, Government and policy 29: 473-486.
Barney, J.B. (1991). Firms resources and sustained competitive advantage. Journal of Man-agement 17: 99-120.
Baum, J.A.C., Calabrese, T. and Silverman, B.S. (2000). Don’t go it alone: Alliance network composition and startup’s performance in Canadian Biotechnology. Strategic Man-agement Journal 21: 267-294.

108 P.J.P. Garbade, S.W.F. (Onno) Omta, F.T.J.M. Fortuin
Chatelin, Y., Esposito Vinzi, V. and Tenenhaus, M. (2002) State–of–art on PLS path mod-eling throug the aviable software. HEC Research paper series CR 764.
Chesbrough, H.W. (2006). Open Business Models: How to thrive in the new innovation landscape. Harvard Business School Press Boston.
Chin, W.W., Marcolin, B.L. and Newsted, P.R. (2003). A Partial Least Squares Latent Vari-able Modeling Approach for Measuring Interaction Effects: Results from a Monte Carlo Simulation Study and an Electronic Mail Adoption Study. Information Systems Research 14: 189-217.
Chin, W.W. (1998). The Partial Least Squares Approach for Structural Equation Modeling. In: Marcoulides, G.A.(ed), Modern Methods for Business Research, New York: Law-rence Erlbaum Associates, 295-336.
Chin, W.W. and Newsted, P.R. (1999). Structural Equation Modeling Analysis with Small Samples Using Partial Least Squares. In: Hoyle, R.H. (ed.), Statistical Strategies for Small Sample Research, Sage Publications, Thousand Oaks, 307-341.
Cohen, W.M. and Levinthal, D.A. (1990). Absorptive capacity: a new perspective on learn-ing and innovation. Administrative Science Quarterly 35: 128-152.
Collins, C.J. and Smith, K.G. (2006). Knowledge exchange and combination: The role of human resource exchange practices in the performance of high technology firms. Academy of management journal 49(3): 544-560.
Comi, A., Eppler, M.J. (2009) Building and Managing Strategic Alliances in Technology-Driven Start-Ups: A Critical Review of Literature. IMCA working paper 1
Choo, C.W. (1998). The Knowing Organization: How Organizations Use Information to Construct Meaning, Create Knowledge, and Make Decisions. New York: Oxford University Press.
Denis, D. ( 2004). Entrepreneurial finance: an overview of the issues and evidence. Journal of Corporate Finance 10: 301-326.
Faul, F., Erdfelder, E., Lang, A.G. and Buchner, A. (2007). G*Power 3: A flexible statistical power analysis program for the social, behavioral, and biomedical sciences. Behavior Research Methods 39: 175-191.
Fornell, C. and Larcker, D. F. (1981). Evaluating Structural Equation Models With Unob-servable Variables and Measurement Error. Journal of Marketing Research 18: 39-50.
Gay, B., Dousset, B. (2005) Innovation and network structural dynamics: study of the alliance network of amajor sector of biotechnology industry.Research Policy 34(5): 1457-1475.
George, G., Zahra, S.A., Wheatly, K.K. and Khan, R. (2001). The effects of alliance portfo-lio characteristics and absorptive capacity on performance: a study of biotechnology firms. Journal of High Technology Management Research 12: 205-226.
Haenlein, M. and Kaplan, A.M. (2004). A beginner’s guide to Partial Least Squares analy-sis. Understand Statistics 3(4): 283-297.
Hagedoorn, J. (1993). Understanding the rational of strategic technology partnering: inter-organisational modes of cooperation and sectoral differences. Strategic Management Journal 14(5): 371-385.
Hair, J.F., Ringle, C.M. and Sarstedt, M. (2011). PLS-SEM. Indeed a silver bullet. Journal of Marketing Theory & Practice 19(2): 135-147.
Hall, L.A. and Bagchi-Sen, S. (2002). A study of R&D, innovation, and business perfor-mance in the Canadian biotechnology industry. Technovation 22: 231-244.
109Exploring the characteristics of innovation alliances
Hall, L. and Bagchi-Sen, S. (2007). An analysis of firm-level innovation strategies in the US biotechnology industry. Technnovation 27: 4-14
Harrison, J.S., Hitt, M.A., Hoskisson, R.E. and Ireland, R.D. (2001). Resource complemen-tarity in business combinations: Extending the logic to organisational alliances. Jour-nal of Management 27: 679-690
Heimeriks, K.H. and Duysters, G. (2007). Alliance capability as a mediator between expe-rience and alliance performance: an empirical investigation into the alliance capabil-ity development process. Journal of Management Studies 44: 25-49.
Henseler, J., Ringle, C.M. and Sinkovics, R.R. (2009). The use of partial least squares path modeling in international marketing. In: Sinkovics, R.R. and Ghauri, P.N. (eds.). Advances in International Marketing 20: 277-320.
Huber, F., Herrman, A., Meyer, F., Vogel, J. and Vollhard, K. (2007). Kausalmodellierung mit Partial Least Squares: Eine anwendungsorientierte Einfuehrung , first ed. Gabler.
Hulland, J.S. (1999). Use of Partial Least Squares (PLS) in Strategic Management Research: A Review of Four Recent Studies. Strategic Management Journal 20: 195-204.
Ireland, R.D. and Hitt, M.A. (1999). Achieving and maintaining strategic competitiveness in the 21st century: The role of strategic leadership. Academy of Management Execu-tive 13: 43-57.
Khilji, S. E., Mroczkowski, T. and Bernstein, B. (2006). From invention to innovation: toward developing an integrated innovation model for biotech firms. Journal of Product Innovation Management 23: 528-40.
Kumar, R. (2010). Research Methodology: A Step-by-Step Guide for Beginners. Third edi-tion. Sage publications.
Lavie, D. and Rosenkopf, L. (2006). Balancing Exploration and Exploitation in Alliance Formation. Academy of Management Journal 49: 797-818.
Lane, P.J. and Lubatkin, M. (1998). Relative absorptive capacity and interorganizational learning. Strategic Management Journal 19: 461-478.
Majewski, SE. (1998). Causes and consequences of strategic alliance formation: the case of biotechnology. PhD dissertation, University of California, Berkeley.
Mangematin, V., Lemariè, S., Boissin, J.-P., Catherine, D., Corolleur, F., Corolini, R. and Trommetter, M. (2003). Development of SMEs and heterogeneity of trajectories: the case of biotechnology in biotechnology firms. Research Policy 32: 737-750
March, J.G. (1991). Exploration and exploitation in organizational learning. Organization Science 2: 71-87.
Marcoulides, G.A. and Saunders, C. (2006). PLS: A silverbullet? Management Information Systems Quarterly 30(2): 3-9.
Montgomery, C. A. (1985). Product-market diversification and market power. Academy of Management Journal 28: 789-798.
Nooteboom, B. (1994). Innovation and diffusion in small firms: Theory and evidence. Small Business Economics 6: 327-347.
Nooteboom, B. (1999a). Roles of the Go-Between. In: R.Th.A.J. Leenders and S.M. Gabbay (eds.), Corporate Social Capital (Deventer: Kluwer), 341-355.
Nooteboom, B. (1999b). Innovation and Inter-Firm Linkages: New Implications for Policy. Research Policy 28: 793-805.
Nooteboom, B. (2000). Learning by Interaction: Absorptive Capacity, Cognitive Distance and Governance. Journal of Management and Governance 4: 69-92.

110 P.J.P. Garbade, S.W.F. (Onno) Omta, F.T.J.M. Fortuin
Nooteboom B., Haverbeke W.H., Duysters, G., Gilsing, V. and Oord, A. (2007). Optimal cognitive distance and absorptive capacity. Research Policy 36: 1016-1034.
Nonaka, I. (1994). A dynamic theory of organizational knowledge creation. Organization Science 5(1): 14-37.
Nonaka, I. and van Knogh, G. (2009). Tacit knowledge and knowledge conversion: Con-troversy and advancement in organizational knowledge creation theory. Organiza-tion Science 20(3): 635-652.
Nunnally, J.C. (1978). Psychometric Theory. New York: McGraw-Hill.Omta, S.W.F. and de Leeuw, A.C.J. (1997). Management control, uncertainty, and perfor-
mance in biomedical research in universities, institutes and companies. Journal of Engineering and Technology and Management 14: 223-257.
Omta, S.W.F. and Fortuin, F.T.J.M. (2011). The Effectiveness of Cluster Organization Func-tions from a Member Company Perspective: The Case of Food Valley Organization. International Food and Agribusiness Management Association Frankfurt, Germany.
Pangarkar, N. (2003) Determinants of alliance duration in uncertain environments: the case of the biotechnology sector. Long Range Planning 36: 269-284.
Park, S.H. and Russo, M.V. (1996). When competition eclipses cooperation: An event his-tory analysis of joint venture failure. Management Science 43: 875-889.
Phene, A. and Tallman, S. (2012). Complexity, context and governance in biotechnology alliances. Journal of International Business Studies 43: 61-83.
Pisano, G. ( 2006). Science Business: Promise, Reality, and the Future of Biotechnology. Harvard Business School Press, Boston.
Powell, W.W., Koput, K.W. and Smith-Doerr, L. (1996). Interorganizational collaboration and the locus of innovation: Networks of learning in biotechnology. Administrative Science Quaterly 41(1): 116-145.
Powell, W.W., White, D.R., Koput, K.W. and Owen-Smith, J. (2005). Network dynamics and field evolution: The growth of interorganizational collaboration in the life sci-ences. American Journal of Sociology 110: 1132-1205.
Ringle, C.M., Wende, S. and Will, A. (2005). SmartPLS 2.0 M3 (beta), Hamburg: http://www.smartpls.de.
Rosenkopf, L. and Almeida, P. (2003). Overcoming local search through alliances and mobility. Management Science 49: 751-766.
Rothaermel, F. T. and Deeds, D.L. (2004). Exploration and Exploitation Alliances in Bio-technology: A System of new product development. Strategic Management Journal 25: 201-221.
Rowley, T., Behrens, D. and Krackhardt, D. (2000). Redundant governance structures: an analysis of structural and relational embeddedness in the steel and semiconductor industries. Strategic Management Journal 21(3): 369-386.
Shan, W. (1990). An empirical analysis of organizational strategies by entrepreneurial high technology firms. Strategic Management Journal 11: 129-39.
Shan W. and Song J. (1997). Foreign direct investment and the sourcing of technological advantage: evidence from the biotechnology industry. Journal of International Busi-ness Studies 28(2): 267–284.
Smith-Doerr, L., J.O. Owen-Smith, K.W. Koput and Powell, W.W. (1999). Networks and Knowledge Production: Collaboration and Patenting in Biotechnology. In: Leenders,

111Exploring the characteristics of innovation alliances
R.Th.A.J. and Gabbay, S.M. (eds.), Corporate Social Capital and Liability. Dordrecht: Kluwer.
Standing, S., Standing, C. and Lin, C. (2008). A framework for managing knowledge in strategic alliances in the biotechnology sector. Systems Research and Behavioral Sci-ence 25(6): 783-796.
Tepic, M. (2012). Innovation capabilities and governance in the agri-food sector. PhD the-sis, Wageningen University.
Terziovski, M. and Morgan, J.P. (2006). Management practices and strategies to accelerate the innovation cycle in the biotechnology industry. Technovation 26: 545-552.
Weick, K.F. (1995). Sensemaking in Organizations. Thousand Oaks CA: Sage.Zucker, L.G., and Darby, M. (1996). Star scientists and institutional transformation: Pat-
terns of invention and innovation in the formation of the biotechnology industry. Proceedings of the National Academy of Sciences 93: 12709-12716.