Exploring impacts of the revised edl and associated policies

ORNL/TM-2015-213
Exploring Potential Impacts of Weatherization and Healthy Homes Interventions on Asthma-related Medicaid Claims and Costs in a Small Cohort in Washington State
Erin Rose Beth Hawkins Bruce Tonn Debbie Paton Lorena Shah
September 2015
Approved for public release; distribution is unlimited.

DOCUMENT AVAILABILITY
Reports produced after January 1, 1996, are generally available free via US Department of Energy (DOE) SciTech Connect. Website http://www.osti.gov/scitech/ Reports produced before January 1, 1996, may be purchased by members of the public from the following source: National Technical Information Service 5285 Port Royal Road Springfield, VA 22161 Telephone 703-605-6000 (1-800-553-6847) TDD 703-487-4639 Fax 703-605-6900 E-mail [email protected] Website http://www.ntis.gov/help/ordermethods.aspx Reports are available to DOE employees, DOE contractors, Energy Technology Data Exchange representatives, and International Nuclear Information System representatives from the following source: Office of Scientific and Technical Information PO Box 62 Oak Ridge, TN 37831 Telephone 865-576-8401 Fax 865-576-5728 E-mail [email protected] Website http://www.osti.gov/contact.html
This report was prepared as an account of work sponsored by an agency of the United States Government. Neither the United States Government nor any agency thereof, nor any of their employees, makes any warranty, express or implied, or assumes any legal liability or responsibility for the accuracy, completeness, or usefulness of any information, apparatus, product, or process disclosed, or represents that its use would not infringe privately owned rights. Reference herein to any specific commercial product, process, or service by trade name, trademark, manufacturer, or otherwise, does not necessarily constitute or imply its endorsement, recommendation, or favoring by the United States Government or any agency thereof. The views and opinions of authors expressed herein do not necessarily state or reflect those of the United States Government or any agency thereof.

ORNL/TM-2015-213
Environmental Sciences Division
Exploring Potential Impacts of Weatherization and Healthy Homes
Interventions on Asthma-related Medicaid Claims and Costs in a Small
Cohort in Washington State
Erin Rose, Oak Ridge National Laboratory
Beth Hawkins, Oak Ridge National Laboratory
Bruce Tonn, Oak Ridge National Laboratory
Debbie Paton, Opportunity Council, Washington
Lorena Shah, Opportunity Council, Washington
September 2015
Prepared by
OAK RIDGE NATIONAL LABORATORY
Oak Ridge, Tennessee 37831-6283
managed by
UT-BATTELLE, LLC
for the
US DEPARTMENT OF ENERGY
under contract DE-AC05-00OR22725


iii
CONTENTS
CONTENTS ................................................................................................................................................. iii
LIST OF FIGURES ...................................................................................................................................... v
LIST OF TABLES ...................................................................................................................................... vii
ACRONYMS AND ABBREVIATIONS .................................................................................................... ix
ACKNOWLEDGEMENTS ......................................................................................................................... xi
EXECUTIVE SUMMARY ....................................................................................................................... xiii
1. INTRODUCTION ................................................................................................................................ 1
2. INDOOR ENVIRONMENTAL QUALITY AND CHILDREN WITH ASTHMA ............................. 3
2.1 ASTHMA AND WEATHERIZATION ....................................................................................... 6
2.2 OVERVIEW OF ASTHMA MORBIDITY IN WASHINGTON STATE ................................. 11
3. WEATHERIZATION PLUS HEALTH ............................................................................................. 13
4. STUDY DESCRIPTION .................................................................................................................... 15
4.1 METHODOLOGY ..................................................................................................................... 15
Research Design .................................................................................................................. 16 4.1.1
Limitations .......................................................................................................................... 17 4.1.2
4.2 DATA COLLECTION ............................................................................................................... 17
Participant Inclusion and Recruitment ................................................................................ 17 4.2.1
Home Visits ........................................................................................................................ 19 4.2.2
Database Development ....................................................................................................... 20 4.2.3
HCA Medicaid Records Collection .................................................................................... 20 4.2.4
Data Transfer to ORNL analysts ......................................................................................... 21 4.2.5
Data Collection Challenges ................................................................................................. 21 4.2.6
5. DESCRIPTIVE STATISTICS FROM THE STUDY SAMPLE ........................................................ 23
5.1 CHARACTERIZATION OF STUDY PARTICIPANTS AND HOUSING UNITS ................. 23
5.2 PRESENCE OF HOME-SOURCE EVIDENCE-BASED ASTHMA TRIGGERS ................... 25
Moisture and Mold .............................................................................................................. 29 5.2.1
Chemicals and Cleaning Supplies ....................................................................................... 30 5.2.2
5.3 ALLERGY REDUCTION MEASURES .................................................................................... 31
Ventilation ........................................................................................................................... 32 5.3.1
5.4 IMPACTS OF WEATHERIZATION AND HEALTHY HOMES EDUCATION .................... 34
5.5 WEATHERIZATION AND HEALTHY HOMES MEASURES INSTALLED ....................... 36
Indoor Temperatures ........................................................................................................... 38 5.5.1
5.6 OCCUPANT HEALTH AND HEALTH CARE COVERAGE ................................................. 39
6. ANALYSIS OF MEDICAID RECORDS .......................................................................................... 45
6.1 CHARACTERIZATION OF MEDICAID STUDY DATA AND PARTICIPANTS ................ 45
6.2 IMPACT ANALYSIS ................................................................................................................. 49
7. CONCLUSION ................................................................................................................................... 55
REFERENCES ........................................................................................................................................... 57
APPENDIX A. DATA FORMS AND SURVEY INSTRUMENTS COLLECTED DURING
INTERVENTION ..................................................................................................................................... A-1
A.1 INFORMED CONSENT FORM FOR WEATHERIZATION PLUS HEALTH STUDY ............ A-1
A.2. HOUSING UNIT INFORMATION SURVEY – DF2 ................................................................. A-5
A.3. ASTHMA HOME ENVIRONMENT CHECKLIST (EPA) ....................................................... A-21
A.4. ASTHMA CONTROL TEST FOR CHILDREN AGE 4 TO 11 YEARS .................................. A-28
A.5. HEALTHY HOMES ACTION PLAN ....................................................................................... A-29
A.6. SATISFACTION SURVEY ....................................................................................................... A-30
A.7. POLLUTION SOURCE SURVEY............................................................................................. A-33

iv
APPENDIX B. SURVEY INSTRUMENTS (COLLECTED OVER COURSE OF STUDY) ................ B-3
B.1. OCCUPANT SURVEY ................................................................................................................ B-3
B.2. WALK THROUGH CHECKLIST (WEATHERIZATION PLUS HEALTH) .......................... B-22
APPENDIX C. WASHINGTON STATE INSTITUTIONAL REVIEW BOARD APPLICATION ....... C-3

v
LIST OF FIGURES
Figure Page
Figure 2.1. List of Evidence-Based Environmental Asthma Triggers .......................................................... 4
Figure 2.2. Frequency of WAP Measures Installed in Homes in PY 2008 ................................................... 7
Figure 3.1 List of Opportunity Council Asthma Trigger Reduction Measures .......................................... 13
Figure 5.1: Weatherization and Healthy Homes Measures Installed by Group: Weatherization Plus Health
and Weatherization Only ............................................................................................................................ 38
Figure 6.1. Graphic of Average Claims and Costs per Month for All Study Groups Pre- and Post-
Intervention ................................................................................................................................................. 52


vii
LIST OF TABLES
Table Page
Table 4.1. Average (Mean) Number of Months Between Program Delivery and Post-Intervention
Data Collection ........................................................................................................................ 18 Table 5.1. Age Ranges of Children with Asthma in Study Households – by Program Type ..................... 24 Table 5.2. Household Ethnicity and Race – All Groups Combined ........................................................... 24 Table 5.3. Housing Type/Characteristics – by Group ................................................................................. 25 Table 5.4. Residence Status of Household – by Group............................................................................... 25 Table 5.5. Location of Household -All Groups Combined ......................................................................... 25 Table 5.6. Home-Source Evidence-Based Asthma Triggers Pre and Post-Intervention by all Groups
, ..... 28
Table 5.7. Moisture Issues Pre and Post-Intervention by all Groups .......................................................... 30 Table 5.8. Chemicals and Cleaning Supplies Post-Intervention by all Groups .......................................... 31 Table 5.9. Number of Homes that Received Full or Simple Healthy Homes Packages, Per Program
Type ......................................................................................................................................... 31 Table 5.10. Presence of Asthma Trigger Reduction Measures Post-Intervention by all Groups ................ 32 Table 5.11. Potential Sources of Indoor Environmental Contaminants Post-Intervention by all
Groups ..................................................................................................................................... 33 Table 5.12. Presence of Functional and in Use Mechanical Ventilation Measures Post-Intervention ....... 34 Table 5.13. Natural Ventilation Post-Intervention by all Groups ............................................................... 34 Table 5.14. Comparison of Use of Chemical Cleaning Supplies Pre to Post-Intervention by All
Groups ..................................................................................................................................... 35 Table 5.15. Frequency of Changing/Cleaning Furnace Filter Post-Intervention by All Groups ................ 35 Table 5.16. Frequency of Dusting/Cleaning and Vacuuming Post-Intervention by All Groups ................ 36 Table 5.17. Weatherization Measures Installed In Moderate Climate Region for National Sample .......... 37 Table 5.18. House Air Leakage Rate Pre and Post-Intervention by Group: ............................................... 38 Weatherization Plus Health and Weatherization Only (mean CFMs) ........................................................ 38 Table 5.19. Indoor Temperatures Pre and Post-Intervention by All Groups .............................................. 39 Table 5.20. Health care Coverage Post-Intervention - All Groups ............................................................. 39 Table 5.21. Health Status (Head of Household) Post-Intervention - All Groups* ...................................... 41 Table 5.22. Health Status (Child) Post-Intervention - All Groups* ............................................................ 42 Table 5.23. Other Health Issues (Child) Post-Intervention - All Groups .................................................... 43 Table 6.1. Medicaid Data Collected by Research Group ............................................................................ 46 Table 6.2. Percent of Healthy Homes Cases That Received Either Full Or Simple Packages ................... 46 Table 6.3. Caregiver-Reported Demographics and Housing Characteristics by Study Group ................... 47 Table 6.4. ICD-9 Codes Listed As Primary Diagnosis for Line Claims ..................................................... 48 Table 6.5. Header and Line Claim Types ................................................................................................... 49 Table 6.6. Header and Line Claim Types by Research Group .................................................................... 49 Table 6.7. Super-utilizer Status by Research Group ................................................................................... 49 Table 6.8. Results from a Paired Sample T-Test Comparing Difference of Means between the
Average Number of Claims Submitted Per Month Pre- and Post-Intervention by
Research Group ....................................................................................................................... 51 Table 6.9. Results from a Paired Sample T-Test Comparing Difference of Means between Average
Costs per Claim Submitted Pre- And Post-Intervention by Research Group .......................... 51


ix
ACRONYMS AND ABBREVIATIONS
AHS American Housing Survey
ARRA American Recovery and Reinvestment Act of 2009
CA
CAA
CBA
CDC
CEA
CFM
CHW
Cost analysis
Community Action Agency
Cost-benefit analysis
U.S. Centers for Disease Control and Prevention
Cost-effectiveness analysis
Cubic feet per minute
Community Health Worker
CMCS
COI
CUA
DDT
DOE
ECM
ED
EPA
ERMI
ETS
FTE
FTP
Center for Medicaid and CHIP Services
Cost of illness
Cost-utility analysis
Dichlorodiphenyltrichloroethane
U.S. Department of Energy
Energy cost measure
Emergency department
Environmental Protection Agency
Environmental Relative Moldiness Index
Environmental tobacco smoke
Full time equivalent
File transfer protocol
GAO
GHG
HCA
HCUP
HEPA
Government Accountability Office
Greenhouse Gas
Health Care Authority
Health Care Utilization Project
High Efficiency Particulate Air
HH
HHS
HIPPA
Healthy Homes
U.S. Department of Health and Human Services
Health Insurance Portability and Accountability Act of 1996
HUD
HVAC
IEA
IEQ
IOM
IRB
MEPS
NACP
NCEH
NIEHS
NHIS
U.S. Housing and Urban Development
Heating, ventilation and air conditioning
International Energy Agency
Indoor Environmental Quality
Institute of Medicine
Institutional Review Board
Medical Expenditure Panel Survey
National Asthma Control Program
National Center for Environmental Health
National Institute of Environmental Health Sciences
National Health Interview Survey
NHLBI
NO2
NPR
NRC
OC
OMB
National Heart, Lung and Blood Institute
Nitrogen dioxide
National Public Radio
National Research Council
Opportunity Council
Office of Management and Budget
ORNL Oak Ridge National Laboratory

x
OWIP Office of Weatherization and Intergovernmental Programs
PI
PII
Principal Investigator
Personally Identifiable Information
PM
POCs
PV
PY
QALY
QoL
RCT
Particulate matter
Persistent organic compounds
Present value
Program Year
Quality adjusted life year
Quality of life
Randomized Controlled Trial
SES
SF
SFT
Socioeconomic status
Single family
Secure File Transport
SNA Social Network Analysis
SVOCs
SPSS
Semi-volatile organic compounds
Statistical Package for the Social Sciences
WAP Weatherization Assistance Program
WBH Washington Basic Health
WHO
WSIRB
Wx
World Health Organization
Washington State Institutional Review Board
Weatherization

xi
ACKNOWLEDGEMENTS
This research study was funded by the Office of Weatherization and Intergovernmental Programs (OWIP)
within the U.S. Department of Energy and by the Opportunity Council located in Bellingham,
Washington. We would like to thank many people who contributed their time to this research endeavor
including the Health Care Authority in Washington State and staff of Opportunity Council who assisted
with the delivery of services and data collection for the study; Chris Miller and John Davies. We would
also like to acknowledge all of the participating families willing to share their medical information and
other personal information for the purpose of the study.


xiii
EXECUTIVE SUMMARY
This report presents results from an analysis of the asthma-related health impacts of weatherization and
healthy homes interventions using data collected from 49 households in Northwestern Washington State
covering the period from 2006 to 2013. This study was performed as part of a broader evaluation of the
U.S. Department of Energy’s Weatherization Assistance Program (WAP) that Oak Ridge National
Laboratory (ORNL) conducted for the Department of Energy (DOE).
Healthy housing intervention programs aim to improve health outcomes for occupants through
improvements in dwelling quality. Households of low socioeconomic status (SES) are more likely to
reside in homes with structural damage, elevated levels of lead, indoor allergens, radon, environmental
contaminants, and other dwelling quality issues known to have pathogenic effects on health (Krieger et al.
2002, 2010; Matte et al. 2000). ORNL and the Opportunity Council,1 a Community Action Agency
(CAA) in Northwestern Washington State, partnered to collect and analyze caregiver-reported, field-
collected, and health care records data to discern potential asthma-related benefits of these programs in
the areas of improved dwelling quality, caregiver observed asthma morbidity, and direct health care
utilization and costs. The study enrolled Medicaid-insured Healthy Homes Only, Weatherization Plus
Health, and WAP Only participants with caregiver-reported asthma diagnoses to monetize the impacts of
program interventions on health care costs. The above-mentioned groups will be referred to as such in the
remainder of this report.
Comparing pre- and post-intervention data for the three study groups revealed that both weatherization
(e.g., air sealing, insulation, heating equipment installation and maintenance) and healthy housing
interventions (e.g., flooring replacement, ventilation, dust mite mattress and pillow covers, education)
were impactful with respect to improving dwelling quality and reducing home-source asthma triggers.
These data suggest benefits accrue through the delivery of WAP in concert with the Healthy Homes
intervention, which is expected since those programs fund the provision of different, but complimentary,
services. Observations of improved dwelling quality, health, and wellbeing (e.g., decrease in moisture and
mold issues, improved thermal comfort) were made. Caregiver-reported information revealed child health
improvement, in general, post-intervention. All households within the Healthy Homes groups and 82% of
the WAP Only group reported that children “seemed to feel better.” All households within the
Weatherization Plus Health group, 94% of the Healthy Homes Only group, and 64% of the
Weatherization Only group reported children in their care “could run and play longer” post-intervention.
These results begin to substantiate the claim that both weatherization and healthy housing interventions
improve dwelling quality with the potential for synergistic benefits of WAP plus healthy housing evident.
The data indicate that Medicaid-insured study participants residing in homes that received either
Weatherization Plus Health, Healthy Homes, or standard WAP services experienced statistically
significant decreases in health care utilization and costs post-intervention. Specifically, a statistically
significant decrease of $421 was observed in annualized asthma-related Medicaid costs for all study
groups combined. The average number of claims paid by the Washington State Medicaid program also
decreased significantly within the Weatherization Plus Health and WAP Only groups by 0.42 and 0.91
claims per month, respectively. It is possible that the Healthy Homes Only sample in this study, which
included participants with higher baseline amounts of claims and costs per month overall, would have
benefited from the additional measures provided through Weatherization Plus Health and WAP.
The public health community has given recent attention to “super-utilizers” of the U.S. health care system
to help alleviate health disparities and reduce costs that disproportionately burden households of low SES
and communities of color. The Center for Medicaid and CHIP Services (CMCS 2013) defines super-
1 http://www.oppco.org/

xiv
utilizers as “beneficiaries of complex, unaddressed health issues and a history of frequent encounters with
health care providers.” Based on the findings of this study, it is reasonable to propose that the Opportunity
Council and other healthy housing programs give high priority to families that have children with severe
asthma and to members of populations or demographics disproportionately burdened with asthma (e.g.,
American Indians in Washington State), to maximize the potential impact of these programs.
This study explored the potential for assessing programmatic impacts using data on outcome measures
contained in linkable Medicaid files and physician records. We conclude that it is possible to collect and
link these data at individual and household levels.
The data collected through this study suggest that Weatherization Plus Health, Healthy Homes, and WAP
all contribute to a reduction in asthma-related health effects, but additional research is required to better
attribute the observed reductions in Medicaid claims and costs to these programs and to generalize the
results to all program recipients. Promising savings were observed across all study groups, but sample
sizes in some instances were too small to achieve statistical significance.
Overall, the services delivered by the participating agencies in this study were associated with
significantly reduced health care costs for Medicaid-insured children with asthma residing in
Northwestern Washington State. Evaluations of asthma intervention programs are often befogged by
numerous confounding factors (e.g., demographics, geographic location, severity of illness, exposure to
environmental triggers) and the difficulty of quantifying improved health outcomes (e.g., reduced
psychosocial stress, productivity gains, educational attainment) (Corso and Fertig 2009; Smith et al.
1997). Although a large body of evidence has amassed over the past several decades suggesting causality
and associations between poor Indoor Environmental Quality (IEQ) and health, many experts in the
public health and housing domains recommend further research to study the relationships between
specific housing intervention measures, indoor exposure to contaminants, and disparities and health
outcomes for better understanding of the determinants of these exposures, as well as, impacts attributable
to WAP specifically (Breysse et al. 2004; Breysse et al. 2014; Wu and Takaro 2007). Further
investigation of the cumulative exposure to indoor contaminants, known to have pathogenic effects on
health, contributes to a better understanding of indoor environmental justice issues and improves the
efficacy of programs charged with creating parity for groups burdened by adverse health outcomes related
to poor IEQ.

1
1. INTRODUCTION
This report is part of the Recovery Act period national evaluation of the U.S. Department of Energy’s
(DOE) Weatherization Assistance Program (WAP). The evaluation is being managed by Oak Ridge
National Laboratory (ORNL) on behalf of DOE. The pages that follow present findings from one of
several components of the WAP evaluation, an exploratory analysis of the impacts of weatherization and
healthy home interventions on asthma-related health care utilization and costs. This study provided an
opportunity to assess the potential impact of WAP and additional asthma trigger reduction measures on
direct and indirect outcomes for a small cohort of children burdened with asthma in Northwestern
Washington State.
WAP was created by Congress in 1976 under Title IV of the Energy Conservation and Production Act.
The purpose and scope of the Program as currently stated in the Code of Federal Regulations (CFR) 10
CFR 440.1 is “to increase the energy efficiency of dwellings owned or occupied by low-income persons,
reduce their total residential energy expenditures, and improve their health and safety, especially low-
income persons who are particularly vulnerable such as the elderly, persons with disabilities, families
with children, high residential energy users, and households with high energy burden.” (Code of Federal
Regulations, 2011)
WAP provides grants, guidance, and other support to Grantees: weatherization programs administered by
each of the 50 states, the District of Columbia, territories and several Native American tribes. The
Grantees, in turn, oversee a network of 900+ local community action agencies, nonprofit organizations,
and local government agencies that are eligible to receive weatherization funding from DOE
(subgrantees). These subgrantees qualify income-eligible households, assess their homes’ energy
efficiency opportunities, install energy-saving measures, and inspect each home post-weatherization.
Common weatherization measures include: air sealing, wall and attic insulation, duct sealing, furnace
repair and replacement, as well as home improvements needed to ensure the health and safety of
household occupants. The work is done at no cost to the eligible participants.
The Opportunity Council, a Community Action Agency (CAA) located in Northwestern Washington
State, has operated a Weatherization Plus Health program since 2000; originally funded as a U.S.
Department of Housing and Urban Development (HUD) Healthy Homes demonstration project.2 The
Opportunity Council’s Healthy Homes program works to reduce asthma triggers inside the homes of
families with young children. The services provide a range of tailored measures from the provision of
simple products (e.g., dust mite covers for mattresses and pillows, High Efficiency Particulate Air
(HEPA) vacuum cleaners, and non-toxic cleaning kits) to interventions requiring contracted work (e.g.
replacement of carpet with laminate or hard wood flooring and/or the installation of whole house
ventilation systems.) This Opportunity Council program is delivered as either a stand-alone service,
known as the Healthy Homes program, or in concert with WAP, the Weatherization Plus Health program.
The hypothesis put forth by the research team, comprised of both Opportunity Council and ORNL staff,
posits that the Weatherization Plus Health and Healthy Homes programs impact asthma morbidity among
the population served and that these changes are observable in the health care data. Similar to other multi-
attribute asthma trigger reduction programs targeting the home environment, it was believed these
impacts could be directly observed in relatable and linkable health care records and insurance claims. This
study enrolled Medicaid-insured Healthy Homes, Weatherization Plus Health, and WAP only participants
with caregiver-reported asthma diagnosis to discern potential benefits of these programs in the areas of
improved dwelling quality, caregiver observed asthma morbidity, and direct health care utilization and
costs. Any relationships observed from these data contribute to the body of literature and research efforts
2 Retrieved from: http://portal.hud.gov/hudportal/HUD?src=/program_offices/healthy_homes/hhi/hhd

2
investigating the efficacy of home-based multi-attribute programs charged with reducing environmental
exposure to asthma triggers, thereby improving health outcomes.
Section 2.0 of this report contains a discussion of the research related to indoor environmental quality
(IEQ) and children with asthma followed by an overview of the Weatherization Plus Health and Healthy
Homes programs delivered through the Opportunity Council (Section 3.0). Section 4.0 provides the study
description complete with methodology and data collection employed to capture program impacts on
health care utilization and costs. Section 5.0 provides descriptive statistics to characterize study
participants and households, and section 6.0 discusses program impacts and other insights gleaned from
the research. Lastly, section 7.0 contains conclusions based on the data and existing body of research
relevant to the topics discussed. Appendices A and B contain pre- and post-intervention survey and data
collection instruments administered, respectively. Appendix C contains the approved version of the
study’s Washington State Institutional Review Board (WSIRB) application.

3
2. INDOOR ENVIRONMENTAL QUALITY AND CHILDREN WITH ASTHMA
Understanding the asthma-related health benefits of weatherization and healthy homes interventions is of
upmost importance as asthma continues to be one of the most common chronic pediatric diseases and the
leading cause of school absences and pediatric hospitalizations disproportionately impacting children in
poverty, children of Hispanic and African American ethnicity, communities of color, and those residing in
urban environments (Akinbami et al. 2011; Breysse et al. 2004; Breysse et al. 2014; Bryant-Stephens
2009; Castro 2003; U.S. Centers for Disease Control and Prevention (CDC) 2011; Corso and Fertig 2009;
Dixon et al. 2008; EPA 2013; Kattan et al. 1997; Kreiger et al. 2005, 2010; NIH 2011; NHIS 2011;
Rastogi et al. 2013; Sullivan et al. 2002; Wu et al. 2007). Trends in asthma over the past few decades
suggest a constant increase in asthma prevalence across demographics with additional burden on children,
and communities of color and low SES (Akinbami et al. 2011, 2012). Although asthma cannot be cured, it
can be controlled through medical treatment and by addressing other factors contributing to poor asthma
control in children (e.g., environmental factors) (Corso and Fertig 2009; McGhan et al. 2006). Because
approximately 80% of all persistent asthma cases present before age six, the indirect lifetime burden and
costs (e.g., loss of productivity, interference with childhood development) of asthma have the potential to
exceed the direct costs (e.g., health care) (Corso and Fertig 2009; Martinez 2002).
Asthma continues to be one of the most chronic and costly diseases in the U.S. with nearly 26 million
Americans suffering its effects (9.5% of all children) and an annual cost of $56 billion (EPA 2013).
Nearly two million ED visits and 500,000 hospitalizations each year provide the bulk of the direct costs
of asthma. It is one of the leading causes of school absences with more than half of children with asthma
missing school due to symptoms for a total of more than 13 million missed days a year (CDC 2013).
Households of low SES are three times more likely to reside in homes with structural damages, elevated
levels of lead, indoor allergens, radon, environmental contaminants, and other dwelling quality issues
known to have pathogenic effects on health (Evans and Kantrowitz 2002; Krieger et al. 2002; Matte et al.
2000). Families that live in these homes are at-risk for exposure to multiple environmental health and
safety hazards placing the most vulnerable occupants at significantly greater risk for illnesses and injuries.
The body of research examined in this section provides evidence that the effects of environmental health
and safety hazards in homes contribute billions of dollars (CDC 2011) annually to both the health and
economic burdens in society while placing households of low SES at a greater disadvantage. Mitigating
exposure to indoor and outdoor source contaminants and hazards through healthy housing interventions
contributes to on-going efforts to reduce chronic disease outcomes for households disproportionately
burdened by their effects (Breysse et al. 2004; Breysse et al. 2014; Crocker et al. 2011; Dixon et al. 2008;
Evans 1999; Kattan et al. 2005; Kreiger et al. 2005 & 2010; Takaro et al. 2011; Wilson et al. 2014;
Woodfine et al. 2011; Woods et al. 2012; Wu and Takaro 2007).
Social justice in the context of human health is generally equated with access to health resources and
equal opportunity to a healthy life. Determinants for domestic health disparities (health outcomes that
impact certain populations to a greater extent than others) have been identified and integrated into social
programs tasked with combatting chronic disease in the U.S. (Healthy People 2020, 2014). The research
described herein targets two of the factors identified as contributors to health disparities; social
determinants and environmental exposures to contaminants. To increase recognition and inform strategies
addressing health disparities in the U.S., assessments and identification of place-based drivers of indoor
pollutants and effective remediation measures are on-going. Environmental justice involves differential
income, racial and ethnic or other types of vulnerable population exposure to environmental health risks
(Evans and Kantrowitz 2002). Evans and Kantrowitz (2002) state that exposure to indoor environmental
risks is not randomly distributed among the general population in the U.S. and that housing quality is
inversely correlated to income. Children of low SES households and communities of color are exposed to

4
greater amounts of environmental toxins than those of moderate to high SES (Evans and Kantrowitz
2002).
There is a considerable body of evidence suggesting that exposure to these environmental risks occurs
indoors along with claims that these exposures are inextricably linked to adverse and chronic health
conditions, and an emerging body of evidence that these health risks disproportionately impact
households of low SES and racial and ethnic minorities. There is increasing concern that these
environmental injustices, occurring in the poor and more specifically in the non-white poor populations,
are widespread and severe requiring immediate public health and policy action. This home-based
environmental risk burden referred to by Evans and Kantrowitz as the “SES health gradient” involves
exposure to a collection of well-established hazardous contaminants mitigated through weatherization and
healthy housing initiatives.
Results from the American Housing Survey (AHS) conducted by the U.S. Census Bureau, indicate that
households of low SES are more likely to be exposed to substandard housing quality than the non-poor,
and that, “epidemic increases in asthma in inner-city settings may be partially attributable to elevated
ambient pollutants along with exposure to allergens in the home” (Evans and Kantrowitz 2002). This
contributes to the Institute of Medicine’s (IOM) (2000) determination that 80% of asthma is allergic
asthma and is consistent with the overwhelming evidence that chronic exposure to indoor environmental
asthma triggers (Figure 2.1), found in sub-optimal housing, contributes to asthma. Mudarri and Fisk
(2007) assert that approximately 20% of asthma cases can be attributed to mold and moisture in the home
environment. The Robert Wood Johnson Foundation posits that 40% of preventable medical costs
associated with asthma are caused by environmental triggers found inside the home.
Figure 2.1. List of Evidence-Based Environmental Asthma Triggers3
3 Retrieved from National Institute of Environmental Health Sciences (NIEHS) supported research found at:
http://www.niehs.nih.gov/health/topics/conditions/asthma/index.cfm

5
The Stanford Center on Poverty and Inequality Report (2014) revealed health disparities across poverty,
race and ethnicity. The brief stated Americans living in poverty to be five times more likely to report
being in poor or fair health than those with incomes four times the poverty threshold. The same brief
reviewed asthma rates as a health indicator for children and described the resulting racial disparity
findings for asthma as “troubling.” African Americans are twice as likely as white children to have
asthma and two to three times more likely than any other racial or ethnic group to die from asthma (CDC
2014). Results from the National Surveillance of Asthma (2001-2010) found the rate of ED visits among
African Americans with asthma to be 330% higher than Caucasians (220% higher for hospitalizations and
180% higher for death rates). Evans and Kantrowitz (2002) suggests asthma as an epidemic in inner city
urban environments can, in part, be attributable to high levels of ambient pollution and exposure to
environmental allergens in the home.
A recent study, conducted by Breysse et al. (2014) in Washington State, sought to determine impacts of
weatherization-plus-health4 interventions, in conjunction with in-home asthma education provided by
community health workers (CHWs), on asthma-related health outcomes. The Breysse et al. study
concluded that participants in the treatment group that received healthy housing interventions in addition
to CHW education, compared to those who received CHW services only, observed improvements in IEQ,
caregiver quality of life, and child asthma-related health outcomes through improved asthma control.
Although the Breysse et al. study has similarities to the ORNL/Opportunity Council study described
herein (i.e., target population, housing stock, and a tailored set of healthy housing interventions), the
Breysse et al. study’s inclusion criteria limited participation to those with severe asthma and to those with
a medical diagnosis. The ORNL/Opportunity Council study included those households eligible for
Opportunity Council healthy housing programs and households containing children with any severity of
asthma (caregiver-reported). Additionally, none of the study groups evaluated within this report involved
CHW education only, while the Breysse et al. report did not collect health insurance data as a method to
evaluate impacts on health care utilization and costs.
Several studies confirm that costs of asthma are correlated with severity (Godard et al. 2002; Serra-Batlles
et al. 1998; Smith et al. 1997). The Breysse et al. report defined severity based on asthma control levels
according to the 2007 National Heart, Lung, and Blood Institute (NHLBI). Participants in the Breysse et
al. study met criteria for either not-well-controlled or very poorly controlled asthma. The Godard et al.
(2002) study investigating the relationship between severity and costs used spirometry, and other tests
according to international standards, to assign participants to one of four asthma severity classifications:
1) intermittent; 2) mild persistent; 3) moderate persistent; and 4) severe persistent. The Godard et al. study
not only concluded that overall costs of asthma are correlated with severity, but that this correlation
persists for each of the cost categories used; direct, indirect, and quality of life (QoL).
In 2010, Mason et al. conducted a review of economic analyses of housing-related interventions aimed at
preventing asthma and other illnesses. This review described five types of economic analysis
methodologies common in public health research to valuate the costs, impacts, and effectiveness of the
interventions: 1) Cost of illness (COI); 2) Cost analysis (CA); 3) Cost-effectiveness analysis (CEA); 4)
Cost-utility analysis (CUA); and 5) Cost-benefit analysis (CBA). COI studies evaluate all direct and
indirect costs of adverse health outcomes attributed to the illness, while CA evaluations calculate all costs
of implementing the intervention(s) and may include all costs saved by the intervention (i.e., COI minus
total intervention costs). Mason et al. identify CEA as the most common evaluation method in the public
health research domain, defined as a ratio of net cost of the intervention per improvement attributed to
that intervention. CEA is typically employed to compare the relative effectiveness of one or more
interventions or to no intervention. Ultimately, CEA is used to guide decision-makers on best practice
when considering whether or not an intervention is cost-effective compared to other practice in efforts to
justify additional costs. CUA is considered a version of CEA whereas the health outcome measure
4 This was not the same Weatherization Plus Health program evaluated for this study.

6
includes a valuation of QoL; typically quality-adjusted life years (QALY). Mason et al. goes on to
describe CBA as the gold standard of economic evaluation methods, as pronounced by other researchers
in the field, because CBA compares the costs and consequences of different interventions in monetary
terms over time. Comparing disparate interventions in this way allows for consideration of both positive
and negative impacts of multiple interventions and allows for prioritization of both benefits and negative
consequences attributed to each intervention.
According to the health economics literature, it is common to use national and state-level medical
expenditure data to track the prevalence and costs of asthma. (Dombkowski et al. 2005; Kelly et al. 2000;
Landrigan et al. 2002; Mason et al. 2010; Smith et al. 1997; MEPS 2015; HCUP 2015; Weiss and
Sullivan 2001). The Piecoro et al. (2001) study limited costs to asthma-related Medicaid claims in
Kentucky (24,365 participants) with a final result estimating total state asthma-related costs to be $845
per person. The evaluation method conducted for this ORNL/Opportunity Council study employed a
similar payer perspective COI design used by Piecoro et al. (2001). Section 4.1 of this report describes the
ORNL/Opportunity Council study that used Medicaid claims collected for a small cohort of children with
asthma to compare the effectiveness of three interventions in Northwestern Washington State in reducing
Medicaid costs.
2.1 ASTHMA AND WEATHERIZATION
Weatherization measures (Figure 2.2) directly and inadvertently address multiple evidence-based indoor
environmental asthma triggers covered by public health campaigns, such as exposure to extreme
temperatures, mold, moisture, cockroaches, mice, dust and other particulate matter, and the hazards of
exposure to by-products of combustion from gas cooking stoves and portable unvented heaters. Thermal
conditions can also have significant adverse effects on health and mortality especially within the
vulnerable populations that WAP serves. The effects of heat are amplified in the elderly, pregnant
women, and infants (CDC 2005). People with cardiovascular or respiratory disease, diabetes, obesity,
chronic mental disorders, limited mobility, or other preexisting medical conditions, such as asthma, are at
greater risk from heat exposure (CDC 2005). Additional risk factors for heat-related mortality include
social isolation, low SES, limited educational attainment, poor housing, lack of access to air conditioning,
and less availability of health care services (Huang 2011). HVAC maintenance and accessories such as
HEPA filters may be included in the weatherization scope of work depending on the needs of the housing
unit as determined by an energy audit, and depending on availability of leveraged resources secured by
the weatherization provider. While primarily targeting energy efficiency, these heating equipment
measures provide tertiary health benefits by addressing air quality issues caused from combustion by-
products and dust. Finally, air sealing and insulation can potentially reduce indoor exposure to
contaminants generated from the outdoor environment, exposure to extreme hot and cold temperatures,
and pest infestations, thereby reducing exposure to evidence-based asthma triggers from mice and
cockroach generated particulates. Proper mechanical ventilation is a crosscutting aspect of both
weatherization and healthy homes programs that addresses exposure to moisture related problems (e.g.,
mold), and other IEQ issues (e.g., NO2 generated from gas cooking stoves).

7
Figure 2.2. Frequency of WAP Measures Installed in Homes in PY 2008
Epidemiologists, exposure scientists and others are currently conducting research that suggests indoor
exposure to chemicals may be a more important source of asthma triggers than the usual suite of suspects
commonly referred to as environmental asthma triggers listed in Figure 2.1 (Bornehag and Whyatt 2013).
Manufactured chemicals and heavy metals inside the home may be introduced into the home through
sources such as building materials, solvents, furniture, and plastics or they may have infiltrated from
outdoors (e.g., particulate matter from combustion, agricultural dust). Epidemiologists have concluded
that the majority of human exposure to manufactured chemicals occurs from inside the home (Little
2013).
One pathway for exposure to these chemicals and heavy metals is through dust. In addition to substantial
amounts of squamous (human skin cells), household dust may contain a wide range of contaminants
harmful to human health including, but not limited to, flame retardants, persistent organic compounds
(POCs), semi-volatile organic compounds (SVOCs) released from vinyl flooring, and other manufactured
chemicals. One such substance is a plasticizer (phthalate) found in toys and other products. Exposure to
phthalates and other endocrine disrupting chemicals is statistically correlated to respiratory diseases and
infections, and can impact reproductive health (Takaro et al. 2013). Residue from environmental tobacco
smoke (known as third-hand smoke) and even from the illegal production of methamphetamine by
previous residents are rising on the radar of those worried about the impacts of indoor pollutants on
human health over time.
Current research in the field of exposure science suggests that the more dust in the environment the
greater chance of exposure to these contaminants through inhalation, ingestion, or skin absorption. Dust
from the outdoors may infiltrate the home through open windows, leaky doorframes, and other air leaks in
the building’s infrastructure. Dust load samples collected from inside homes have contained
manufactured chemicals, such as dichlorodiphenyltrichloroethane (DDT) despite having been
discontinued for 20 years, and heavy metals such as lead (Stout et al. 2009; Weschler 2013). They also
contained various speciation of particulate matter (PM2.5 and PM10). These are known contributors and
triggers for asthma and other adverse health impacts projected to increase with climate change (Fabian et
al. 2013; NIEHS 2015; Melillo et al. 2014; National Research Council (NRC) 2010). Weatherization
directly addresses many of these IEQ issues through dust-reduction measures, such as air sealing, the
cleaning and replacement of air filters (including HEPA filters) on air supply lines, proper whole-house
and localized ventilation, dryer venting, and by implementing lead-safe weatherization practice during
0%10%20%30%40%50%60%70%80%90%
100%

8
window and door replacement. A study conducted by Sandel et al. (2010), reviewing interventions and
control of health-related chemical agents, indicated that particulate intrusion reduction from improved
ventilation is a promising intervention that needs further evaluation. This same report indicated the need
for more formative research on improved residential ventilation stating, “too little is known about how
ventilation levels affect both short- and long-term health.” Overall, studies show that inadequate
ventilation adversely affects health, but that more formal research is necessary to further our
understanding of different types of systems in relation to housing and household characteristics and IEQ.
Drafts in a home may indicate how well sealed the home is from infiltration of outdoor particulate matter.
The WAP national occupant survey (Tonn et al. 2014) reports a reduction from 29% of those reporting
their home drafty most or all of the time to 9%. Also supporting this observation are findings from
ORNL’s social network study, “Weatherization Experiences,” another component of the national WAP
evaluations (Rose et al. 2015). Members of social networks who had weatherization work completed at
the suggestion of other WAP recipients reported observations related to IEQ post-weatherization. Of
those who had weatherization work completed, 55% reported less drafts in the home and 44% of
respondents reported the home being less dusty.
Low-income weatherization can reduce poverty-related stressors faced by occupants as a result of direct
energy and non-energy related benefits. Chronic stress is an evidence-based risk factor for adverse health
implications associated with the release of stress hormones; in particular, cortisol. High doses of cortisol
released as a result of chronic stress correlates with a variety of health problems including cardiovascular
disease, obesity, anxiety disorders, and asthma (NIH 2002). Chronic stress as it relates to exposure to
psychosocial stress is recognized as a symptom of poverty.5 Conversely, of those Americans who reported
having a major stressful event in the past year (49%), 43 percent reported that experience being related to
health, and those identifying as being in poor health were twice as likely (60%) to report being under a
“great deal” of stress within the past month (NPR 2014).The same poll finds that 36% of households with
an income < $20,000 reported experiencing high stress levels within the past month. Research presented
at a recent Roundtable on the Health and Well-Being Impacts of Energy Efficiency Improvements, hosted
by the International Energy Agency (IEA), found that it only takes a few stressors in one’s life to have a
significant negative impact on mental health and that the detrimental effect of adding stressors seems to
be exponential, not linear (Liddell 2013). Liddell also states that greater residential stability reduces stress
and related adverse health outcomes. McGhan et al. (2006) found that children with poorly controlled
asthma has significantly worse scores in the areas of confidence in management their asthma, fear of
dying, and QoL related to social and sport activities, and school performance and attendance.
Physical effects of exposure to poor IEQ, such as asthma and allergies, may result in loss of productivity
at home and work either through absenteeism or presenteeism.6 Loss of productivity through absenteeism
may result in financial stress. Family dysfunction as a result of inhibited productivity in the home can also
lead to chronic stress through increased dependence on formal and informal social networks for support
and perceived lack of control and uncertainty around meeting the basic physiological needs of household
members. Family dysfunction and symptoms of parental depression and psycho-social stress can then
lead to child exposure to psycho-social stress. Family functioning and well-being promotes secure
attachment between caregivers and children, reducing both parental and child exposure to psycho-social
stress and allows children and adults to tend to educational and professional needs. Insecure or
dysfunctional attachment patterns between children and parents can result in the disruption of child
developmental milestones, low self-confidence, -esteem, and -worth and may interfere with a child’s
ability to develop schemas around healthy attachments to others including other adults, peers and future
5 Psychosocial stress is experienced when individuals face complex and stressful living conditions. 6 "Presenteeism occurs when an employee goes to work despite a medical illness that will prevent him or her from fully
functioning at work,” http://www.ncbi.nlm.nih.gov/pmc/articles/PMC2947637/

9
offspring (Wong et al. 2002; Jacobsen and Hofmann 1997). Children with observed insecure or
dysfunctional attachment and those developmentally immature are at greater risk for poor school
performance and unruly, delinquent and sexually risky behaviors; having impacts at both household and
societal levels (Levi and Orlans 2000; Coleman 2003). A recent study conducted through the MacArthur
Foundation’s How Housing Matters Research Initiative found that poor housing quality contributes to
emotional and behavioral problems in children and that “much of this association operates through
parental stress and parenting behaviors” (Coley et al. 2013). By improving the quality of the dwelling,
weatherization has the potential to reduce parental stress, thereby improving availability and attachment
between the caregiver(s) and the children in the home that then affords those children the opportunity to
better address developmental milestone achievement and improved behavior and performance.
Ameliorating the physiological and psychological symptoms of poverty through work like weatherization
is an under-realized benefit.
Simulated models of the effects of building interventions and IEQ (measuring pollutant concentrations
indoors) on pediatric asthma outcomes in low-income multifamily buildings suggest that weatherization
measures targeting the sealing of the building envelope led to an increase in pollutant concentration of
NO2 and PM2.5. That increase predicted 20% more serious asthma events, but that bundling weatherization
with repairing kitchen exhaust fans mitigated this adverse impact (Fabian et al. 2013). This study looked
at the intersection of weatherization, IEQ and health with particular attention to pediatric asthma. Fabian
et al. go on to state, “Without evidence of changes in health care use, it is difficult to develop public
health or policy actions.”
Numerous papers discuss the effectiveness of multi-component interventions on the severity and
incidence of asthma episodes by addressing multiple triggers in the home environment (Breysse et al.
2014; Crocker et al. 2011; Dixon et al. 2009; Godard et al. 2002; Kelly et al. 2000; Krieger et al. 2010;
Sullivan et al. 2002). In addition to averted medical costs associated with hospitalization and ED visits
due to asthma, there is evidence to suggest that weatherization acts, in part, as a home-based multi-trigger
or multi-attribute asthma reduction program providing additional benefits beyond urgent care (Crocker et
al. 2011; Godard et al. 2002; Sullivan et al. 2002). These benefits are observed through other direct
medical costs (e.g., reduced prescribed medicines, office and clinic visits, and hospital outpatient) and
indirect costs (e.g., reduced housekeeping loss, loss of work and school productivity, and restricted
activity) (Dombkowski et al. 2005; Smith et al. 1997; Norton 2015). Wang et al. (2005) estimated the
total economic impact of asthma in school-aged children for 1996 to be $1993.6 million or $791 per child
with asthma.
A recent evaluation of the health and household benefits of weatherization begins to attribute the benefits
of asthma trigger reductions inside the home to WAP through self-reported changes in morbidity and use
of urgent care facilities from pre- to post-intervention (Tonn et al. 2014). The data mentioned in the
ORNL non-energy benefits report suggest that weatherization is associated with fewer ED visits due to
asthma. The analysis used health care cost data from the National Medical Expenditure Panel Survey
(MEPS) and through the National Healthcare Utilization Project (HCUP) to monetize cost savings from
reduced ED visits (by 11.5%) and hospitalization (by 3.1%) post-weatherization at both societal and
household levels. To monetize potential reductions in averted medical costs and indirect costs beyond
urgent care treatment attributable to WAP, a methodology was developed by the ORNL team to
determine the percentage of respondents identified as “high-cost” asthma patients pre-weatherization, but
then identified as “low-cost” asthma patients post-weatherization. High-cost asthma patients account for
two-thirds of the ED visits and hospitalizations due to asthma in the U.S. (Smith et al. 1997). Those who
reported having asthma symptoms within the last three months were counted as high-cost asthma patients
and those who reported last having asthma symptoms greater than three months were identified as low-
cost asthma patients. The Smith et al. study findings were then used to calculate the direct and indirect
cost savings associated for each of the two groups. Using these data, the total health benefits associated

10
with asthma, attributable to WAP per home in 2008, was $202 and the present value (PV) per home was
calculated to be $2,009 (Tonn et al. 2014).7
A comprehensive review of past research has provided evidence that indoor air pollutants are a frequent
cause of illness and that residential energy efficiency measures and green interventions have improved
indoor air quality and occupant health. However, other studies have recognized that a “too tight” building
envelope could exacerbate indoor air pollution if appropriate precautions and measures are not considered
(Fisk 2000). Research has also been conducted that focused specifically on asthma morbidity reductions
and other non-energy benefits, such as productivity gains, due to weatherization. Two U.S. studies on
new, green construction have demonstrated significant respiratory health improvements (Heyman et al.
2005; Takaro et al. 2011). A 2005 World Health Organization (WHO) report concluded there are direct
linkages relating energy efficiency of housing and health with sufficient evidence for estimating the
burden of disease. Programs retrofitting affordable housing with green and healthy interventions directly
reduce health problems associated with poor quality housing by limiting exposure to allergens,
neurotoxins, and other dangers (Breysse et al. 2004; Sandel et al 1998).
One study recently attempted to determine key predicting factors for high health care utilization or super-
utilizers8 among Hispanic and African American children (Rastogi 2013).
The study revealed that
caregiver knowledge alone of asthma pathophysiology, control, and treatment does not adequately
prevent high health care utilization. Participants in the study reported feelings of stress and helplessness,
an inability to implement the actions learned, and on-going use of the ED. Although the authors of the
study reported that high health care utilizers had fewer ED visits post-targeted educational interventions,
many of the asthma trigger reduction measures remained beyond the capabilities of the household to
complete on their own without additional services or support.
Targeted public health education is delivered alongside the healthy homes and weatherization measures
provided through the Opportunity Council. Opportunity Council is in a unique position as both a CAA
and WAP subgrantee with the ability to implement asthma-reduction measures to mitigate observed and
known asthma triggers in concert with weatherization at no cost to the occupant. This is important as
asthma is a health disparity impacting households of low SES at a greater rate than those in higher income
brackets. The impetus for the research study described in this report was to determine if the bundling of
services provided through the Opportunity Council positively impacts the health and well-being of the
recipients of these targeted programs, thereby reducing the utilization and cost of health care. More
specifically, this research initiative sought to demonstrate any changes in the number of asthma-related
Medicaid claims and costs post-intervention for three study groups that offer unique sets of housing-
related services.
Targeting the “high-cost” health care users or super-utilizers of the health care system could maximize the
benefits of the Weatherization Plus Health model, as observed in the Sullivan et al. (2002) study. An
information bulletin published by the CMCS (2013) reported that 5% of Medicaid beneficiaries account
for 54% of total annual health care expenditures; approximately 60% of those beneficiaries that were
among the most expensive 10% in one year remained the most expensive for two subsequent years
(Coughlin and Long 2010). Another economic analysis of asthma observed that 20% of individual cases
in the National Medical Expenditure Survey accounted for 80% of all asthma-related costs (Malone et al.
2000). Studies investigating this topic have revealed that socioeconomic distress, chronic illness, high use
7 Results from this analysis show that the present value (PV) per household of all health-related benefits of the ~ 80,000 single
family and mobile homes served by WAP in PY 2008 is estimated to be approximately $14,148. 8 The Center for Medicaid and CHIP Services (CMCS) defines super-utilizers as those “beneficiaries of complex, unaddressed
health issues and a history of frequent encounters with health care providers.”

11
of other health care resources, substance abuse, and mental illness are associative factors for ED visits and
other health care utilization (Sun et al. 2003).
2.2 OVERVIEW OF ASTHMA MORBIDITY IN WASHINGTON STATE
The CDC publishes statistics related to asthma morbidity and mortality by nation, by state, and by
population. The report completed by the National Center for Environmental Health (NCEH), and
published by the CDC’s National Asthma Control Program (NACP),9 reports the following statistics for
2007:
Child10
asthma prevalence in Washington State was 6.9% compared to the U.S. rate of 9.0%.
Asthma prevalence for children in Washington State aged 12-17 was 9.9% (10.5 for U.S.). U.S.
rate for children aged 5-11 is 11.0%.
Boys (at 8.7%) had higher asthma prevalence than girls (at 5.1%).
For American Indians and Alaska Natives in Washington State, asthma rates are much higher
than the state average11
No statistics were available in this publication on race or ethnicity except for the white population with an
asthma prevalence of 5.6%. Also not reported at the state level are mortality rates for children. However,
the overall, age-adjusted mortality rate for Washington State in 2007 was 10.2 per million compared to
the U.S. rate of 11.0 persons per million.
The following vital statistics were reported from the National Health Interview Survey (NHIS) conducted
in 2012 (Bloom et al. 2012). These most recently available national statistics are presented here to aid in
the discussion on asthma as a health disparity in the U.S.:
Children in poor families were more likely to have ever been diagnosed with asthma (19%) or to
still have asthma (13%) than children in families that were not poor (12% and 8%).
Children in fair or poor health (40%) were three and one-half times as likely to have ever been
diagnosed with asthma and almost five times as likely to still have asthma (37%) as children in
excellent or very good health (12% and 8%).
The highest U.S. rate for one race is that for black or African American with rates of 16.0%.
Although the state level asthma rate for Washington is lower than the U.S. rates, this health condition
continues to impact households of lower SES, and within communities of color despite geographic
location.
9 Retrieved from: http://www.cdc.gov/asthma/stateprofiles/asthma_in_wa.pdf 10 Includes persons in WA aged 0-17. 11 CDC. Retrieved from; http://www.cdc.gov/nceh/tracking/success/washington.htm#helping


13
3. WEATHERIZATION PLUS HEALTH
The Opportunity Council is a CAA serving Whatcom, Island and San Juan Counties in Washington State.
The Weatherization Plus Health program was started in the early 1990s after Opportunity Council
representatives, at a meeting with Native American tribal leaders, observed that the elders of the tribe
were using inhalers while leading discussions of the asthma rates prevalent in their tribes. Many homes
had electric baseboard heat and wood stoves. Mold was often observed around the colder perimeter of the
homes. In 2002, the Indoor Air Coalition of Whatcom County decided that the Opportunity Council
should add IEQ to its portfolio since the program was already in WAP income-eligible homes completing
audits and addressing ventilation. The Opportunity Council received a HUD Healthy Homes grant to
work with a consultant in developing the Weatherization plus Health protocol. Currently, a private
foundation finances the Weatherization Plus Health program for homes that have one or more child with
asthma under the age of six. DOE has adopted the program name “Weatherization Plus Health” with
permission of the Opportunity Council.
The Opportunity Council’s Healthy Homes program encompasses services that range from in-home
education and asthma interventions to full Weatherization Plus Health services. In addition to a
comprehensive education component, interventions and tools include HEPA filter vacuum cleaners,
mattress and pillow encasings, green cleaning kits, and hard-surface flooring (carpet removal). The
Healthy Homes measures (Figure 3.1) are all measures observed in the invoices collected for this study.
Households might receive a simple package of measures (e.g., HEPA vacuum, cleaning kit, dust mite
covers) or a full package of measures requiring contracted work (e.g., carpet replacement with hard-
surface flooring, mechanical ventilation). Weatherization services and further IEQ assessments are
incorporated into projects depending on household need, eligibility, and program funding.
Healthy Homes Program
Targeted asthma education
Advanced ventilation
Laminate and hardwood flooring (carpet removal)
Rodent and pest exclusion
HEPA12
floor vacuum
Dust mite mattress, box spring, and pillow covers
Entry mat
Cleaning kit
Humidistat
Dehumidifier
Chimney cleaning Figure 3.1 List of Opportunity Council Asthma Trigger Reduction Measures
12 High-efficiency particulate arrestance (HEPA) is a type of air filter “capable of capturing particles of 0.3 microns with 99.7%
efficiency” as defined by the U.S. Environmental Protection Agency (EPA). The EPA defines a HEPA vacuum as a vacuum that
has a HEPA filter as the last filtration stage and is designed so that all the air drawn into the machine is expelled through the filter
with none of the air leaking out. Retrieved from; http://www.nilfiskcfm.com/vacuum-applications/EPALeadRRP-hepa-
vacuum.aspx

14
The Weatherization Plus Health concept is integrated into each of the Opportunity Council programs and
is considered by the each of the program coordinators when assessing family needs. The energy advocate
conducting the initial assessment of the home is often the one who identifies the home as a potential
Healthy Homes or Weatherization Plus Health project. Homes can be slated to receive a Healthy Homes
only package for a myriad of reasons (e.g., deferral of weatherization due to outstanding housing-related
issues). Both energy advocates and WAP auditors are trained to identify asthma triggers, such as the
presence of rodents, insects and dust.
The Community Services department, which delivers the Energy Assistance program (a primary source
for both weatherization and Healthy Homes referrals), schedules the weatherization pre-assessment and
then the weatherization itself. While most opportunities to make homes healthier are identified through
the Energy Assistance pre-assessments, the Opportunity Council also receives direct referrals for Healthy
Homes projects through its Head Start and early-learning programs.
In addition to DOE’s interest in weaving Healthy Homes protocols in with energy efficiency, the
Opportunity Council has worked with the state of California and EPA in designing their program and in
continuing to connect the Healthy Homes, IEQ, and energy retrofit programs. Although the original HUD
grant targeted homeowners and child-care providers, renters are now eligible for Weatherization Plus
Health. The Opportunity Council continues to consider what other populations should be targeted for
Healthy Homes assessment and action, as well as, where agency partnerships might improve efficiency
and prove effective.

15
4. STUDY DESCRIPTION
WAP serves households of low socioeconomic status to achieve energy efficiency through home energy
retrofit and energy consumption education. The mission of WAP also involves addressing health and
safety concerns as they relate to home energy. To be eligible for the Program, households must have an
income of 200% of the federal poverty level or less. It was the assumption that many of the households
served by WAP also receive Medicaid or another form of health care assistance. Medicaid records were
requested for Opportunity Council household members with asthma and collected from the Washington
State Health Care Authority (HCA) to measure potential changes in costs related to asthma morbidity.
This transfer of data involved; (1) approval from the Washington State Institutional Review Board
(WSIRB); (2) the Opportunity Council requesting and receiving authorizations for the disclosure of
Medicaid records from both treatment and comparisons groups; (3) submitting the authorization forms to
the HCA through a secure file transfer protocol (FTP); and (4) receiving asthma specific Medicaid
records back from the HCA using the same secure FTP. The Opportunity Council partnered with ORNL
on this task and with entering the data into a database for future analysis by ORNL. The dataset was de-
identified of personally identifiable information (PII) prior to ORNL reviewing the data to reduce the risk
of breach of confidentiality. Study identifiers were given to participating households and to individuals
for the linking of all data collected. The minimum data elements were requested from HCA capturing all
asthma-related claims, including the type of claim and costs. The research plan was to identify
relationships between the programs delivered to households with children with asthma and any changes in
direct medical expenditures related to asthma as evidenced through the disclosure of records.
4.1 METHODOLOGY
A quasi-experimental design for this retrospective evaluation was adopted to compare results between
two programs operated under the Opportunity Council services umbrella: Healthy Homes and
Weatherization Plus Health. The impacts of these two programs were to be compared not only to each
other, but to standard WAP services delivered through other CAAs in WA State as a means to discern
potential impact of these programs on children with asthma within the WAP eligible population. The COI
under study was limited to asthma-related costs of Medicaid recipients in Washington State and therefore
applied a payer perspective, similar to the Piecoro et al. (2001) study described in section 2 (Corso and
Fertig 2009). Utilization of Medicaid data as primary data reduces bias inherent in self-reported
information, while corroborating the narrative provided by both survey research and anecdotal evidence.
The study aimed to answer the following research questions: (1) Does the Opportunity Council's
Weatherization Plus Health program result in decreased direct medical expenditures related to asthma
treatment? (2) Do the direct medical expenditures also correlate with self-reported and caregiver reported
improvement in health related asthma symptoms and episodes? (3) Does the level of impact on direct
medical expenditures correlate with specific weatherization or asthma reduction measures provided
through Weatherization Plus Health? (4) Are relationships observed between the Weatherization Plus
Health program, asthma morbidity and health care, and school on-site care and attendance? (5) If
relationships are observed, what are the cost savings related to the decrease in direct medical
expenditures, increased school attendance, performance, and on-site care, and caregiver productivity? (6)
What do the relevant physicians attribute change in asthma status and episodes to? and (7) Are there any
adults with asthma in the household that self-report a change in their own asthma conditions as a benefit
for treating the home for the children?

16
Research Design 4.1.1
This study implemented a quasi-experimental approach for evaluating the impacts of three different
program types on asthma morbidity in a sample of Medicaid-insured persons. This involved collecting
data for a control group (i.e., WAP Only) and comparing the results to those observed for the treatment
groups (i.e., Weatherization Plus Health and Healthy Homes Only). The primary reasons for using quasi-
experimental design was due to the retrospective nature of the study and because the Opportunity Council
did not randomly assign households to different programs at the time of intervention. It is understood that
a randomized control trial (RCT) design offers benefits as an experimental approach. However, there are
compelling reasons, explained in this subsection, why a quasi-experimental design was chosen instead.
According to a recent Government Accountability Office (GAO) report, “program evaluation literature
generally agrees that well-conducted randomized experiments are best suited for assessing effectiveness
when multiple causal influences create uncertainty about what caused results.”13
The GAO report goes on
to note, however, that randomized experiments “are often difficult, and sometimes impossible, to carry
out,” and that “requiring evidence from randomized studies as sole proof of effectiveness will likely
exclude many potentially effective and worthwhile practices.” When randomized studies are impractical
or impossible to carry out, quasi-experimental comparison group studies satisfactorily provide “rigorous
alternatives to randomized experiments.” For legal and practical considerations, we believed that a
classical (RCT) approach could not be implemented to evaluate WAP during the ARRA period.
Additionally, WAP is administered by States (i.e., grantees) through subgrantees that must prioritize
WAP applicants in order to select them. The primary barrier to randomization in a WAP evaluation is in
fact legislative priority constraints on how the subgrantees should prioritize WAP applicants. From the
U.S. Department of Energy, Weatherization Assistance Program for Low-Income Persons, Title 10, Part
440 (Direct Final Rule, Federal Register, June 22, 2006) 14
:
Section 440.16 Minimum program requirements…(b) Priority is given to identifying and providing
weatherization assistance to:
(1) Elderly persons;
(2) Persons with disabilities;
(3) Families with children;
(4) High residential energy users; and
(5) Households with a high energy burden.
Thus, Title 10, Part 440 essentially prohibits the purely random assignment of WAP applicants to control
groups, meaning that the RCT approach is not possible.
In conjunction with Title 10, Part 440, there is also a practical and perceived moral obligation among
subgrantees to provide services to all applicants—and particularly to high-priority applicants—as fairly
and expediently as the Program will allow. This institutional resistance to random assignment to and the
consequential delay of service to control groups would have to be overcome before an RCT could be
correctly implemented.
At the time of the study design, it was believed that WAP alone would have minimal impact, if any, on
asthma morbidity because it did not purposefully target home-based environmental triggers associated
with asthma and also because there is an on-going debate within the home performance industry on
13“Program Evaluation: A Variety of Rigorous Methods Can Help Identify Effective Interventions,” GAO-10-30, November
2009. 14 See http://www.waptac.org/sp.asp?id=1812#minimum.

17
whether WAP contributes to worsened IEQ after air-sealing a home. However, results from an occupant
survey delivered to a random selection of WAP recipients provided statistically significant results
indicating improved outcomes related to asthma morbidity and reduced use of urgent health care facilities
(Tonn et al. 2014). Based on these results, it became evident that analysts involved with this study would
need to consider the results from the Opportunity Council sample in comparison to the WAP group, but
that the WAP Only group could no longer be used as a true comparison group with no anticipated change.
Limitations 4.1.2
This retrospective evaluation of the impacts of asthma reduction measures on environmental triggers in
the home utilized a quasi-experimental design, which has less internal validity than a randomized control
trial. Additionally, this study did not include a comparison group composed of individuals who had
received no intervention at all. Further research with either an experimental design or a quasi-
experimental design with a larger sample and a non-treated comparison group could allow causal
statements to be made. Considering the aforementioned limitations, we aimed to determine through this
study: (1) whether or not linkable data can be extracted from institutions housing sensitive health
information in order to make the necessary observations to state causal relationships; (2) if any
statistically significant relationships exist within the data collected; and (3) whether or not the observed
results lead us to believe that further exploration is worth the level of effort required for a true experiment
or big data project.
4.2 DATA COLLECTION
Approval from WSIRB15
was required prior to the collection of HCA Medicaid records. IRB approval is
required for such research endeavors involving human subjects. The “Weatherization Plus Health Study”
application was submitted for expedited review and was initially submitted on November 1, 2012. After
two rounds of revisions made by the study team, WSIRB approval was achieved on July 2, 2013.16
It
should be noted that as a condition of approval, HCA staff first determined that the study was of mutual
benefit to their program. This determination was made by HCA in October 2012.
The Opportunity Council was responsible for the collection and management of the data. One full time
equivalent (FTE) evaluation coordinator, working closely with the Department Director and Manager,
was hired for a term of sixteen months. The evaluation coordinator was responsible for scheduling and
conducting home visits in treatment and comparison samples, responsible for most post-visit data
collection, data entry and file management. As a requirement of IRB approval and a general best practice,
all researchers were required to provide proof of receiving training in protecting human research
participants and Health Insurance Portability and Accountability Act of 1996 (HIPPA)17
compliance.
Participant Inclusion and Recruitment 4.2.1
Inclusion Criteria
Study inclusion criteria were carefully considered by the research team to ensure that the final samples
would be representative of the population the Weatherization Plus Health initiative sought to target for
improved health outcomes. The following set of criteria was used for inclusion:
• Homes must have received: 1) Weatherization Plus Health services OR 2) Healthy Homes
interventions through the Opportunity Council OR 3) WAP Only (1 year prior to study) through
participating WAP agencies;
15 https://www.dshs.wa.gov/sesa/research-and-data-analysis/human-research-review-section 16 See the complete WSIRB application in Appendix C. 17 The HIPAA Privacy Rule provides federal protections for individually identifiable health information held by entities and
covers patients’ rights with respect to the disclosure of that information. http://www.hhs.gov/ocr/privacy/hipaa/understanding/

18
• The same child(ren) for whom services were employed, continued to reside within the home for
the duration of the pre-intervention (1 year) and post-intervention time periods;
• The family continued to reside in the same house where the intervention occurred; and
• The legal parent/guardian(s) agreed to participate in the study.
Treatment sample
During the WSIRB approval process, the ORNL and Opportunity Council team engaged in the study’s
participant identification and recruitment phase. Using search filters in the Weatherization and
Conservation Education databases, a list of 125 potential homes was produced. Recipients of the
Opportunity Council programs were excluded if they no longer resided in the home where services had
been delivered. From this sample, 34 households were scheduled for visits and included in the study.
Individual case files were further mined to determine the type of Healthy Homes packages that
households had received: the full package (e.g., carpet removal) or a simple package delivered through a
one-time visit to the home where products were distributed to households at that time (e.g., HEPA
vacuum).
Comparison sample
The study worked with three comparison WAP agencies in the region – Snohomish County; Housing
Authority of Skagit County; and Community Action Council of Lewis, Mason, and Thurston Counties -
to collectively provide the comparison sample (i.e., WAP Only group). In Snohomish County, eligible
program year files were sorted through by hand to determine that the household had an occupant with
asthma and a child between 0-10 at the time of weatherization. From a sample of nearly 60 homes, 8 were
included in the study.18
Outreach efforts were made to WAP agencies in surrounding service territories to
improve the sample size. Skagit County was able to screen their database for the requisites but was only
able to provide 15 potential households, of which two were included. The Lewis, Mason and Thurston
weatherization department was not able to screen their database and provided the Opportunity Council
with a sample of over 150 households, only five of which participated in the study. The total number of
comparison households was 15; 21 children in total). The average number of months for which data were
collected post-intervention ranged from 24-28 (Table 4.1).
Table 4.1. Average (Mean) Number of Months Between Program Delivery and Post-Intervention Data
Collection
# of months (mean) Range (in months)
Wx + Health 26 3-47
Wx Only 28 6-52
HH Only 24 6-44
Prior to calling homes to schedule potential study participants, each household received an introduction
letter explaining the study and informing the residents that they would be receiving a phone call to
schedule the visit. The letters also asked residents to contact the Opportunity Council if they were
interested in participating. One week later, potential participants were called to schedule their in-home
visit. The initial round of calls served mostly to screen the sample for eligibility, wrong or disconnected
numbers, and people who had moved since receiving Healthy Homes or WAP services. Once a household
was contacted and eligibility was confirmed, an overview of the visit was discussed, including informing
the participants of the potential benefits and consequences of participating in the study.19
The introduction
18 Reasons for only 8 of the 60 potential homes included in the study: (1) staff was unable to determine if the person with asthma
in the home was a child between 0-10 years old until making further contact; (2) family may have moved from the home; (3)
family not interested or unable to participate. 19 See Informed Consent in Appendix A.

19
letter and the informed consent drafts were reviewed for readability at or below the 8th grade reading
level20
using the Flesch-Kinkaid test; a Microsoft Word document function.
The following survey and data collection instruments were used by the study team at the time of the
intervention (Appendix A):
Weatherization audit, scope of work, and work completed (DF2)
Asthma Home Environment Checklist, Action Plan, and work completed
Asthma Control Test (symptoms) pre- and post-intervention
Satisfaction survey
The following survey and data collection instruments were administered by the study team over the
course of the study (Appendix B):
Occupant Survey post-intervention (study instrument)21
Home walk-through post-intervention (study instrument)
Medicaid records pre- and post-intervention
Physician records pre- and post-intervention
Home Visits 4.2.2
Opportunity Council staff pre-tested the on-site home visit in two homes in August of 2012. The visits
averaged 1.5 hours each. Both the walk-though observation and survey instruments were tested with no
concerns voiced or observed. However, it became apparent that caregivers desired the opportunity to
confer with their partners prior to signing the HCA authorization forms releasing Medicaid data for the
study. It was agreed that the importance of authorization should be effectively communicated during the
recruitment phase and as part of the initial informed consent. This allow timed for discussion and
agreement between caregivers prior to the home visit in efforts to avoid a second visit to the home.
The home visits were conducted between May 2013 and January 2014. They took approximately one hour
to complete and families received a $200 incentive check for participating. Home visits involved a
detailed informed consent component, data collection (i.e., occupant survey and walk through data form),
and signatures on HCA authorization and release of information forms. Certified medical translators
accompanied visits for households where English was a second language, and all forms were translated
into the primary first language.
The home visit procedures and data collection were based on previous weatherization studies for the
ARRA-era WAP evaluations. After completing the informed consent procedures and answering any
initial questions, a home walkthrough and checklist was completed to verify the condition of the home
and take note of any issues that may affect IEQ. The researcher then worked with the participant to
complete forms including an asthma control test with any asthmatic children and releases of information
for physician and Medicaid records. Next an occupant survey was administered covering heating and
ventilation, home conditions, health care and coverage, health and well-being, IEQ issues, and
employment and demographic characteristics. Once these forms were completed and verified the home
visit was concluded.
20 8th grade reading level and below is the WSIRB required standard for documents provided to human subjects. 21 The post-intervention occupant survey was paid for and administered by the Opportunity Council

20
Database Development 4.2.3
A custom Microsoft Access database was built by the ORNL WAP evaluation subcontractor, APPRISE,
to house data collected in the program files and data collected during the study. The database comprised
of modules that corresponded with each survey instrument, data collection form, and records fields
requested through HCA. Modularization allowed for modules to be updated and debugged as needed by
APPRISE, allowing work to still be entered even as modules were being updated. A final de-identified
data file was uploaded to ORNL using ORNL’s Secure File Transport (SFT). An identified back up
database copy was retained and consulted as needed to resolve data issues.
HCA Medicaid Records Collection 4.2.4
A “minimum necessary” data request was submitted to HCA for a data share agreement to be established
with a data transfer protocol and system identified (FTP secure site). The HCA data set included the
following items for each of the authorization forms submitted. Upon authorization, HCA released the
requested information to the Opportunity Council and ORNL analysts listed on the WSIRB application:
Program type; As HCA manages records for both Medicaid and state program recipients, the
program type for each claim was requested.
Claim type; ALL professional, outpatient, home health, pharmacy and inpatient claims related to
asthma in their final state were requested.
Diagnosis codes; All 6 asthma ICD-9 codes starting with 493 were pulled at both the header and
line levels for all paid and final encounter claims.22
Primary diagnosis; All claims were the 493 ICD-9 code appears as either the primary or after the
primary diagnosis (diagnosis 2, 3, 4, etc.).
Paid amount; 493 ICD-9 codes were pulled for all paid and final encounter claims and included
all paid amounts for that line claim.
Billing provider information; HCA provided both the billing provider ID, name, and billing
provider for all claims.
Servicing provider identification; HCA provided both the servicing provider and name of the
service provider for all claims.
Procedure codes; HCA provided procedure codes and names for all services provided and the
quantity of each.
Revenue codes; The revenue code and name in cases where services are bundled for billing were
provided.
Recipient Aid Category (RAC); RACs were pulled to inform the study which recipient category
the client belongs to.
Pharmacy claims; HCA provided the National Drug Code (NDC), the drug generic name, the unit
of measure, and the paid amount for that claim.
HCA Medicaid requests were handled by the department manager. HCA authorization forms were
gathered releasing information to both Opportunity Council and ORNL (2 releases). Scans of the releases
for each family were uploaded along with a request spreadsheet to a dedicated HCA contact through the
secure FTP operated by HCA. HCA staff compiled the Medicaid records into a single spreadsheet within
3-5 days and delivered it using the FTP. The department manager compiled all returned records
spreadsheets into one master spreadsheet organized by building ID # using a, b, c… to identify
22 International Classification of Diseases, Ninth Revision (ICD-9) codes were used for the HCA request for records. All header
or line claims with any ICD-9 asthma codes (codes starting with 493) listed as either primary or secondary diagnisos were
requested.

21
individuals with asthma within the home. The spreadsheet was de-identified and sent to ORNL using
secure FTP operated by ORNL.
Data Transfer to ORNL analysts 4.2.5
Opportunity Council staff sent the de-identified database with linkable study identifiers at the household
and individual levels through ORNL’s File Upload System. This system uses secure FTP and is operated
through ORNL’s Information Technology Services department. Opportunity Council staff uploaded the
complete database and other records using this ORNL file upload system. Other security measures were
established to protect the confidential information collected through this study.23
Data Collection Challenges 4.2.6
One primary challenge the research study faced was the timeline of the WSIRB approval. The research
work scope was finalized, but the researchers were unable to request Medicaid records without IRB
approval. The decision was made to move forward with the first round of visits that consisted of all parts
of the visit except gathering the HCA Medicaid releases. Families received $100 for this visit with the
agreement to issue the remaining $100 after Medicaid releases were collected following IRB approval.
Most homes required a second visit to complete the forms, and some households stopped participating in
the evaluation before a second visit could be completed to gain the Medicaid releases.
A second challenge faced was the size of the treatment and comparison samples. In the treatment sample,
while the program served over 125 families, the final sample included only 34 households with 52
individual cases. This was due to families moving, out of date contact information, or lack of interest in
participating. There were similar issues in the comparison sample.
Working with three different WAP agencies, each with their own databases and standards for information
collection, made screening participants challenging. While the control agencies submitted encouraging
sample sizes, the final comparison sample was small. We learned that there is inconsistency in how
asthma prevalence is recorded in WAP files. Washington State, as the WAP grantee, does not have a
requirement for this information to be recorded and some agencies do not capture it at all. Phone
screening was completed prior to scheduling to insure eligibility. Some comparison group families also
had legitimacy concerns about the study. Though letters of introduction were mailed, including a cover
letter from each comparison group agency, most potential participants were not aware of the Opportunity
Council. This, combined with the difficulty of explaining the broad overview of the study, caused some to
be hesitant to schedule the home visit and participate.
Accessing physician records posed an additional challenge to measuring program impacts on health. It
took many months working with the primary care provider networks in the area to receive the first batch
of records, despite authorization from participating households releasing this information.
The final challenge faced was attempting to request school records. The sample had very few children in
elementary school during the study time frame. A decision was made by the study team not to continue
pursuit of school records, as there would be little comparative data to look at from year to year. This
component of the study would have required working with at least 6 school districts in the treatment
group counties and many more in the comparison group counties. It was decided that due to the low
number that were enrolled in school during the study time period, school records would not be sought.
23 ORNL’s Electronic Data Security Plan was approved by WSIRB.


23
5. DESCRIPTIVE STATISTICS FROM THE STUDY SAMPLE
Results from the AHS conducted by the U.S. Census Bureau indicate that households of low SES are
three times more likely to be exposed to substandard housing quality than the non-poor (Evans and
Kantrowitz 2002). Findings from questions posed to WAP recipients as part of the national evaluation
about the physical condition of their homes pre- and post-weatherization revealed that the physical
condition improved post-weatherization. The largest reported change was related to homes being less
drafty post-weatherization. This was not an unexpected result considering over 90% of WAP homes in
PY 2010 received some sort of air sealing measure during the weatherization process. The results also
suggest that insulation, air sealing and other measures have the potential to protect homes from dust, and
mice and cockroach infestation and their generated particulates, which are all known evidence-based
asthma triggers. Occupant-reported observations of moisture issues and mold inside homes reduced from
28% pre-weatherization to less than 20% post-weatherization (Tonn et al. 2015). Comparable findings
suggesting reductions in moisture issues were also observed within groups participating in this study.
The following six subsections capture descriptive statistics extracted from a combination of pre- and post-
intervention survey instruments (discussed in more detail in Section 5.2) administered to occupants of the
three groups that participated in this special study and are grouped into these categories:
Characterization of Study Participants and Housing Units
Presence of Home-Source Evidence-Based Asthma Triggers
Allergy Reduction Measures
Impacts of Weatherization and Healthy Homes Education
Weatherization and Healthy Homes Measures Installed
Occupant Health and Health Care Coverage
5.1 CHARACTERIZATION OF STUDY PARTICIPANTS AND HOUSING UNITS
This section of the report presents statistics characterizing participants of this study and the homes in
which they reside. The average (mean) number of occupants living within the study households (n= 49)
was 4.6 people with 1.4 of those being children. The majority (48%) of children with asthma participating
in the study was between the ages of 5-10 and 31% were between the ages of 0 to 5 years (See Table 5.1)
with the mean age at 7.6 years (ranging from 2 to 17 years of age). Comparing age groups between
program types revealed that the Healthy Homes Only group consisted of more than double the children
between the ages of 5-10 than the other two groups. It was expected that the Opportunity Council study
samples that focused on children with asthma would contain a higher percentage of younger children
compared to the WAP groups that included adults of elderly or with disability status as high priority.
Many of the households (46%) self-identified as Non-Hispanic White; 15% identified as Hispanic White,
21% as Hispanic “Other” and 8% as Non-Hispanic “Other.” Very few households identified as Black,
American Indian, Alaska Native, or Asian (Table 5.2).

24
Table 5.1. Age Ranges of Children with Asthma in Study Households – by Program Type
Age range Program Type
Wx + Health Wx Only HH Only All Groups
Combined
0-5 Count 9 5 8 22
% within Age range 42.9% 23.8% 27.6% 31.0%
5-10 Count 8 7 19 34
% within Age range 38.1% 33.3% 65.5% 47.9%
10-15 Count 4 6 1 11
% within Age range 19.0% 28.6% 3.4% 15.5%
15-20 Count 0 3 1 4
% within Age range 0.0% 14.3% 3.4% 5.6%
Total Count 21 21 29 71
% within Age range 100.0% 100.0% 100.0% 100.0%
Table 5.2. Household Ethnicity and Race – All Groups Combined
Ethnicity
Race
White
Black or
African-
American
American
Indian or
Alaska
Native Asian Other Total
Hispanic Count 7 0 0 0 10 17
% within Ethnicity 41.2% 0.0% 0.0% 0.0% 58.8% 100.0%
% within Race 24.1% 0.0% 0.0% 0.0% 71.4% 35.4%
% of Total 14.6% 0.0% 0.0% 0.0% 20.8% 35.4%
Non-Hispanic Count 22 2 1 2 4 31
% within Ethnicity 71.0% 6.5% 3.2% 6.5% 12.9% 100.0%
% within Race 75.9% 100.0% 100.0% 100.0% 28.6% 64.6%
% of Total 45.8% 4.2% 2.1% 4.2% 8.3% 64.6%
Total Count 29 2 1 2 14 48
% within Ethnicity 60.4% 4.2% 2.1% 4.2% 29.2% 100.0%
% within Race 100.0% 100.0% 100.0% 100.0% 100.0% 100.0%
% of Total 60.4% 4.2% 2.1% 4.2% 29.2% 100.0%
The majority of homes receiving weatherization, either alone or in combination with a healthy homes
intervention were single family (SF) detached buildings with a crawlspace (Table 5.3). The
Weatherization Plus Health group consisted of 64% SF homes and 36% mobile homes, with the
Weatherization Only group having a higher ratio of SF to mobile homes at 87% and 13% respectively. Of
those within the Weatherization plus Health group, 86% lived in a home with a crawlspace and 23% had a

25
basement; with the Weatherization Only group at 73% and 20%, respectively.24
These housing
characteristics were then used to identify any statistically significant relationships between asthma
morbidity and health care utilization.
Table 5.3. Housing Type/Characteristics – by Group
Housing Type Wx + Health Wx Only
Single-family 64% 87%
w/ crawlspace 86% 73%
w/ basement 23% 20%
Mobile Home 36% 13%
Residential status for the entire group was fairly evenly split as 49% of households reported renting their
homes and 50% owning their home. However, upon characterizing each study group, more of the Healthy
Homes Only group households reported being renters, and more of the Weatherization Only group
households were homeowners (Table 5.4). It appears that the study homes, collectively, were somewhat
evenly represented with regard to location (i.e., rural, city, suburb, town) with the most reported (37%)
being in a rural location (Table 5.5).
Table 5.4. Residence Status of Household – by Group
Residence Status
Program Type All Groups
Combined Wx + Health Wx Only HH Only
Rent 52% 30% 57% 47%
Own 48% 61% 43% 50%
Neither 0 9% 0 3%
Table 5.5. Location of Household -All Groups Combined
Location Frequency Percent
Rural 18 36.7
City 14 28.6
Suburb 10 20.4
Town 7 14.3
5.2 PRESENCE OF HOME-SOURCE EVIDENCE-BASED ASTHMA TRIGGERS
Avoiding allergens alongside other environmental control efforts have been shown to be effective at
reducing asthma attacks and clinical improvement can be observed through elimination of just one
environmental allergen (Kelly 2014). Weatherization addresses multiple evidence-based indoor
environmental triggers (e.g., mold, cockroaches, mice, dust, and by-products of combustion from gas
cooking stoves and portable unvented heaters). Weatherization helps minimize many of these IEQ issues
through dust and moisture-reduction measures such as air sealing, the cleaning and replacement of air
filters (including High Efficiency Particulate Air (HEPA) filters) on air supply lines, proper whole-house
and localized ventilation, and clothes dryer venting. The provision of accessories, such as HEPA
vacuums, allergy pillow and mattress covers, and non-toxic cleaners may be included in the scope of
24 These answers are not mutually exclusive; some SF homes can have both a basement and a crawlspace, or neither.

26
work if combined with Healthy Homes services (i.e., Weatherization Plus Health) depending on the needs
of the occupants. As discussed in Section 3, these services are typically determined through an energy
audit and an asthma checklist for eligible households and may be dependent on availability of leveraged
resources secured by the weatherization or Healthy Homes provider and the condition of the home.
Table 5.6 presents frequencies of evidence-based asthma triggers found within study homes pre- and post-
intervention. All pre-intervention findings presented in this section (and throughout Section 5) were
extracted from the following survey instruments25
(See Appendix A and B): 1) U. S. Environmental
Protection Agency’s Asthma Checklist and 2) Opportunity Council’s Pollution Source Survey; therefore,
the pre-intervention results are provided for the Weatherization Plus Health and the Healthy Homes Only
groups. The pre-intervention survey findings were based on observations of weatherization staff. All post-
intervention findings presented in this section (and throughout Section 5) were extracted from the
following survey instruments: 1) Opportunity Council’s Walk-through Checklist - findings based on
observations of weatherization staff as well and 2) a modified version of ORNL’s Occupant Survey
designed for the national evaluation of WAP. It should be noted that the findings from the Occupant
Survey are self-reported by the occupant rather than based on observations of weatherization staff.
The occupant survey was administered post-intervention ranging from 3 months to 4.3 years with the
average (mean) at 26 months. Reporting both sets of post-intervention data provides the opportunity to
consider differing perspectives while reducing bias inherent in self-reported data collection due to
potential inconsistencies resulting from misinterpretation of questions and response bias. Furthermore, the
occupant is more familiar with their home, while an auditor may be equipped with building science
expertise, but can only observe what is happening during their time at the residence. Therefore, both sets
of post-intervention data are provided for all groups.
When occupants were asked if it seemed their child’s asthma was worse around pets, more than half
(65%) of the Weatherization Plus Health group replied in the affirmative, while only 15% of the Healthy
Homes Only group responded the same (Table 5.6). However, it was observed that 43% of the
Weatherization Plus Health group had indoor pets pre-intervention, but close to half reported post-
intervention, that they either no longer had pets or the pets were no longer allowed indoors. There was
negligible change post-intervention for the Healthy Homes Only group. Within the Weatherization Only
homes, 60% were observed to have indoor pets post-intervention. It remains unknown as to what
percentage of children in the sample had allergies to pet dander.
A low percent of respondents reported smoking cigarettes inside the home at any time within all study
groups. Although, for the Healthy Homes Only group, post-intervention there was an observed increase
(by 15%) in the presence of smoking (e.g., ashtrays, cigarette butts). Unexpectedly, because of the
measures installed, there was an increase in evidence of pests inside the home post-intervention for all
groups.
The presence of carpets in the living room decreased slightly (by 5%) post-intervention for the Healthy
Homes Only group. The Healthy Homes measures package does not always include the replacement of
carpet26
; in addition, it may have been determined that it would be more beneficial for the carpet to be
removed in the child’s bedroom rather than the living room. In contrast, observed close to 30% of the
25 See Methodology (Section 4.1) for a detailed description of which data (both pre- and post-intervention) were collected by
participating agencies as part of its typical program delivery and which data were collected specifically for the purposes of this
study. 26 The Healthy Homes package does not always include carpet replacement; there are two Healthy Homes packages, a “simple”
and a “full”. The full Healthy Homes package can include carpet removal. 35% of the Healthy Homes Only group and 100% of
the Weatherization Plus Health group received the full package. For those in the Weatherization Plus Health group that were
observed to have carpet in their home (either living room or bedrooms) pre-intervention (n=11), 36% no longer had carpet in
their living room post-intervention and 64% no longer had carpet in their child’s bedroom. As for the Healthy Homes Only group
(n=6): 17% no longer had carpet in living room post-intervention and 67% no longer had carpet in bedroom post-intervention.

27
Weatherization Plus Health group had their carpets removed in the living room. There was an increase
(7%) in the presence of throw rugs in the living room post-intervention indicating that throw rugs might
have been traded out for full carpet in some instances.
It should be noted that the frequencies (#) provided in this table represent the number of households, not
individual cases. Furthermore, unless noted, household sample sizes (n) for each group are as follows:
Weatherization Plus Health (n=14) WAP Only (n= 15)
27 Healthy Homes Only (n= 20) Opportunity Council (OC) groups (n= 34)
28
27 Weatherization Only groups were provided services by the three comparison WAP agencies in the region – Snohomish
County, Housing Authority of Skagit County, and Community Action Council of Lewis, Mason, and Thurston Counties to
collectively provide the comparison sample 28 OC groups include the recipients of the OC programs (i.e. those that received Healthy Homes interventions; Weatherization
Plus Health and Healthy Homes Only) and constitute the treatment sample.

28
Table 5.6. Home-Source Evidence-Based Asthma Triggers Pre and Post-Intervention by all Groups29,30
Pre
Post
(staff observed)
Post (self-
reported)
# % # % %
EVIDENCE-BASED ASTHMA TRIGGERS
Asthma Worse Around Pets (Yes)31
Wx + Health 9 65% - - -
Wx Only - - - - -
HH Only 3 15% - - -
OC groups 13 38% - - -
Have Indoor Pets (Yes)
Wx + Health 6 43% 4 29% 21%
Wx Only - - 9 60% 73%
HH Only 6 30% 7 35% 35%
OC groups 12 35% 11 32% 29%
Cigarette Smoking Inside Home (anywhere, at any
time)32
(Yes)
Wx + Health 1 7% 1 7% 0%
Wx Only - - 1 7% 7%
HH Only 0 0% 3 15% 5%
OC groups 1 3% 4 12% 3%
Evidence of Pest Infestation (cockroaches, rodents,
and/or other insects) (Yes)
Wx + Health 2 14% 3 21% 29%
Wx Only - - 2 13% 27%
HH Only 0 0% 2 10% 35%
OC groups 2 6% 5 15% 33%
Carpet in Living Room (Yes)
Wx + Health 11 79% 7 50% -
Wx Only - - 7 47% -
HH Only 17 85% 16 80% -
OC groups 28 82% 23 68% -
Throw Rugs in Living Room (Yes) -
Wx + Health 5 36% 6 43% -
Wx Only - - 7 47% -
HH Only 3 15% 4 20% -
OC groups 8 24% 10 29% -
Carpet in Child’s Bedroom (Yes)
Wx + Health - - 9 43% -
Wx Only - - 20 87% -
HH Only - - 24 80% -
OC groups - - 33 65% -
29 The frequencies (#) provided in this section represent the number of households, not individual cases, which responded yes. 30 Unless noted, household sample sizes for each group are as follows: Weatherization Plus Health (n=14); Weatherization Only
(n= 15); Healthy Homes Only (n= 20); All Opportunity Council (OC) homes (n= 34). 31 For this question, pre-data was not observed, weatherization staff asked occupant the question. 32 For this question, pre-data was not observed, weatherization staff asked occupant the question.

29
Moisture and Mold 5.2.1
Mold allergies, associated with asthma and other respiratory symptoms, are 30-50% more prevalent in
damp houses, especially in those with damp basements (Rutgers 2011). Research also indicates that early
exposure (in infancy) to high mold counts, as measured by the Environmental Relative Moldiness Index
(ERMI) test, increases the risk for developing asthma by 50% in late childhood (Reponen 2011). Findings
presented in Table 5.7 suggest that for all three groups participating in this study, observations of
moisture and mold issues substantially decreased post-intervention. A 20% decrease in observed moisture
damage to walls and ceilings, and a 60% decrease in observed standing water in the Healthy Homes Only
group, was reported. For the Weatherization Plus Health group, a 28% decrease in moisture damage was
observed and a 7% decrease in observed standing water was reported. The Weatherization Only group
had post-intervention findings comparable to the other two groups in these two categories. It is interesting
to note the difference between the observed and the self-reported findings for presence of standing water.
The decrease of close to 60% in reported excessive humidity levels for both Opportunity Council groups
is most likely connected to the substantial decrease of observable mold or mildew; 65% in the
Weatherization Plus Health group and 35% in the Healthy Homes Only group. Again, it should be noted
that the self-reported findings were higher than what was observed by the staff. However, variation in
question format exists between data collection instruments. The question in the occupant survey reads:
“Have you seen mold in your home in the past 12 months?” Depending on how much time had passed
since the intervention this data could be seen as more of a pre-intervention result, and in fact are quite
similar to the observed pre-intervention findings. With that said, if these percentages are considered to be
a proxy for a pre-intervention finding for the Weatherization Only group, in comparison to the other
groups, these homes, at baseline, had better dwelling quality with respect to mold and mildew issues.
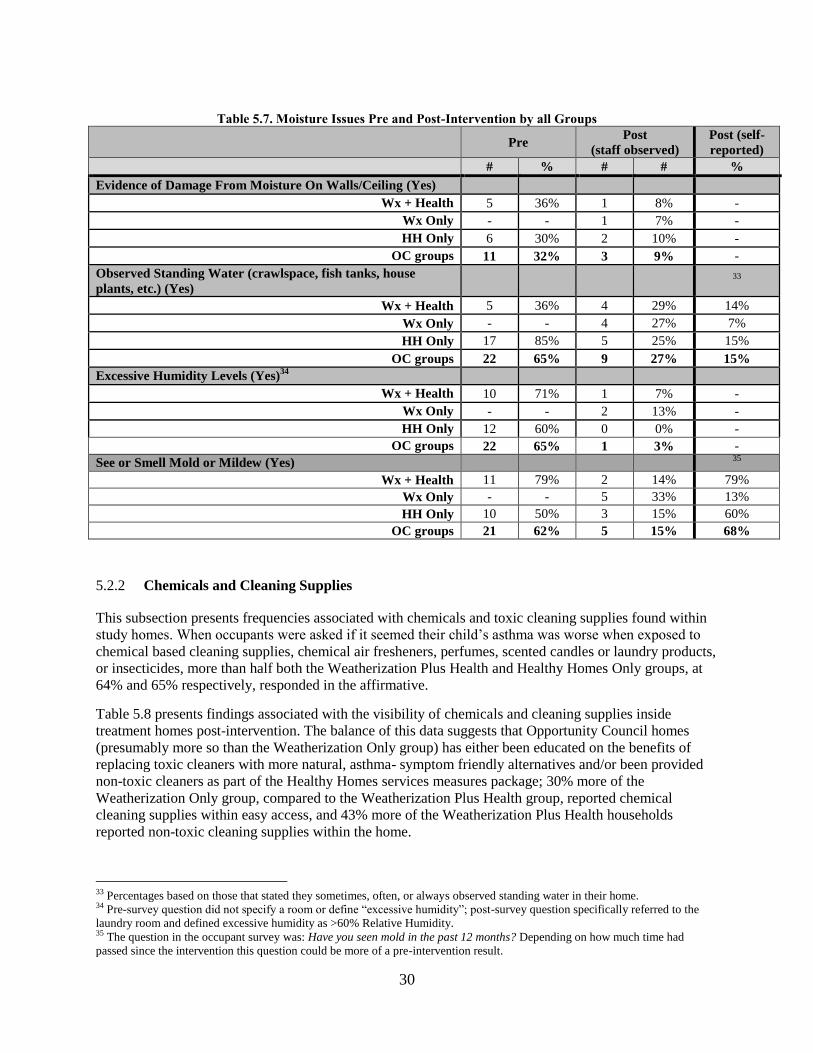
30
Table 5.7. Moisture Issues Pre and Post-Intervention by all Groups
Pre
Post
(staff observed)
Post (self-
reported)
# % # # %
Evidence of Damage From Moisture On Walls/Ceiling (Yes)
Wx + Health 5 36% 1 8% -
Wx Only - - 1 7% -
HH Only 6 30% 2 10% -
OC groups 11 32% 3 9% -
Observed Standing Water (crawlspace, fish tanks, house
plants, etc.) (Yes)
33
Wx + Health 5 36% 4 29% 14%
Wx Only - - 4 27% 7%
HH Only 17 85% 5 25% 15%
OC groups 22 65% 9 27% 15%
Excessive Humidity Levels (Yes)34
Wx + Health 10 71% 1 7% -
Wx Only - - 2 13% -
HH Only 12 60% 0 0% -
OC groups 22 65% 1 3% -
See or Smell Mold or Mildew (Yes) 35
Wx + Health 11 79% 2 14% 79%
Wx Only - - 5 33% 13%
HH Only 10 50% 3 15% 60%
OC groups 21 62% 5 15% 68%
Chemicals and Cleaning Supplies 5.2.2
This subsection presents frequencies associated with chemicals and toxic cleaning supplies found within
study homes. When occupants were asked if it seemed their child’s asthma was worse when exposed to
chemical based cleaning supplies, chemical air fresheners, perfumes, scented candles or laundry products,
or insecticides, more than half both the Weatherization Plus Health and Healthy Homes Only groups, at
64% and 65% respectively, responded in the affirmative.
Table 5.8 presents findings associated with the visibility of chemicals and cleaning supplies inside
treatment homes post-intervention. The balance of this data suggests that Opportunity Council homes
(presumably more so than the Weatherization Only group) has either been educated on the benefits of
replacing toxic cleaners with more natural, asthma- symptom friendly alternatives and/or been provided
non-toxic cleaners as part of the Healthy Homes services measures package; 30% more of the
Weatherization Only group, compared to the Weatherization Plus Health group, reported chemical
cleaning supplies within easy access, and 43% more of the Weatherization Plus Health households
reported non-toxic cleaning supplies within the home.
33 Percentages based on those that stated they sometimes, often, or always observed standing water in their home. 34 Pre-survey question did not specify a room or define “excessive humidity”; post-survey question specifically referred to the
laundry room and defined excessive humidity as >60% Relative Humidity. 35 The question in the occupant survey was: Have you seen mold in the past 12 months? Depending on how much time had
passed since the intervention this question could be more of a pre-intervention result.

31
Table 5.8. Chemicals and Cleaning Supplies Post-Intervention by all Groups
Post
(staff observed)
Post (self-
reported)
# % %
Toxic Chemicals (Paints/Solvents) Within Easy Access
(Visible)
Wx + Health 0 0% 7%
Wx Only 2 13% 0%
HH Only 3 15% 5%
Chemical Cleaning Supplies Are Within Easy Access
(Visible)
Wx + Health 4 29% 36%
Wx Only 9 60% 53%
HH Only 9 45% 45%
Non-toxic Cleaning Supplies Are in the Home
Wx + Health 10 71% 71%
Wx Only 4 27% 73%
HH Only 11 55% 70%
5.3 ALLERGY REDUCTION MEASURES
As mentioned in Section 3, upon delivery of Healthy Homes services, either in concert with
weatherization or on its own, a home could have received either a simple or full package of services. Both
were tailored to the needs of the household and the occupant: the simple package was typically delivered
through a one-time visit to the home and included a comprehensive education component and provision
of a selection of allergy reduction accessories; the full package included interventions requiring
contracted work (e.g., replacement of carpet with laminate or hard wood flooring and/or installation of
whole house ventilation systems). Table 5.9 presents the number of homes that received which type of
package per program type. All Weatherization Plus Health households in the sample received the full
package of services as did 35% of the Healthy Homes Only group.
Table 5.9. Number of Homes that Received Full or Simple Healthy Homes Packages, Per Program Type
Program Type
Type of HH package
Total No HH Simple Full
Wx + Health 0 0 14 (100%) 14
Wx Only 15 (100%) 0 0 15
HH Only 0 13 (65%) 7 (35%) 20
Total 15 13 21 49
Table 5.10 presents the percentages of asthma trigger reduction accessories observed in use or present
within the home: 90% of the Healthy Homes group was observed to have a HEPA vacuum, allergy
mattress covers, and allergy pillow covers in their home post-intervention; 71% of the Weatherization
Plus Health homes were using allergy pillow covers and 43% were using allergy mattress covers post-
intervention. only 64% owned a HEPA vacuum. One might have expected that the Weatherization Plus
Health group and Healthy Homes Only group to have had comparable frequencies for these findings.
However, the necessity of these services is determined through the EPA Asthma Checklist and may also
be dependent on availability of leveraged resources; therefore, not all homes received the complete list of

32
services within its provided package. In addition, this data was based on observations of field staff;
occupants may not have been utilizing the accessories at the time of the visit or have them in sight. It
should also be considered that this program serves a population that might not be able to afford to
continue with best practice.
Since these accessories are not considered a DOE allowable expense through traditional WAP it was
hypothesized that their presence post-intervention would be at a much lower percentage for the homes in
the Weatherization Only group, which is confirmed in the table below.
Table 5.10. Presence of Asthma Trigger Reduction Measures Post-Intervention by all Groups
Post
(staff observed)
# %
Own a HEPA Vacuum36
Wx + Health (n=14) 9 64%
Wx Only (n=15) 3 20% 37
HH Only (n=20) 18 90%
OC groups (n=34) 27 79%
Allergy Covers on Mattress38
Wx + Health (n= 21) 9 43%
Wx Only (n= 23) 5 22%
HH Only (n= 30) 27 90%
OC groups (n=51) 36 71%
Allergy Covers on Pillows
Wx + Health (n= 21) 15 71%
Wx Only (n= 23) 3 13%
HH Only (n= 30) 27 90%
OC groups (n=51) 42 82%
Ventilation 5.3.1
There is growing concern within the public health and building science communities regarding emissions
from unvented gas cooking stoves or the use of unvented combustion space heaters. As stated in Section
2, simulated models of the effects of building interventions and IEQ on pediatric asthma outcomes in low-
income households suggest that weatherization39
targeting the sealing of the building envelope led to an
increase in pollutant concentration of NO2 and PM2.5, and 20% more serious asthma events, but that
bundling weatherization with repairing kitchen exhaust fans mitigated this adverse impact (Fabian et al.
2013). Range hoods can be installed and vented outdoors to provide localized ventilation in homes where
this is logistically feasible. Results from the national occupant survey showed that post-weatherization,
the number of program respondents that reported using a cook stove exhaust fan regularly increased by
8% (Tonn et al. 2014).
36 Results for owning a HEPA vacuum are per household, as indicated by the n. 37 The self-reported percentage was quite a bit higher here, at 53%. This could be due to a lack of understanding in how the
agency defines a “HEPA” vacuum. 38 Results for allergy covers on mattress and on pillows are on a “per case” (individual) basis rather than by household, as
indicated by the n.. 39 The Fabian et al. (2013) study was not focusing on weatherization as delivered through WAP. Weatherization in this context is
referring to energy-efficiency retrofits and building interventions in general.

33
Within this study, electric cooking stoves were more commonly observed to be in use both pre- and post-
intervention; only 15% of the Weatherization Plus Health households, 20% of the Weatherization Only,
and 25% of the Healthy Homes Only groups used gas cooking stoves (Table 5.11).40
None of the study
groups were found to be using any unvented gas appliances in the home, both pre and post-intervention.
All groups that had heating units fueled by gas were properly vented to the outside.
Table 5.11. Potential Sources of Indoor Environmental Contaminants Post-Intervention by all Groups
Post
(staff observed)
# %
Use Gas For Cooking Fuel
Wx + Health 2 15%
Wx Only 3 20%
HH Only 5 25%
Heating Unit Vents Outside (for households heated with gas)
Wx + Health 13 100%
Wx Only 12 100%
HH Only 7 100%
For this study, data was not collected at household level for the usage of kitchen or bathroom fans pre-
intervention; therefore, we are unable to establish any increase in mechanical ventilation usage post-
intervention. Specific data on kitchen and bathroom fan installation was not collected either. However,
the two participating agencies reported the installation of “whole-house ventilation.” Whole house
ventilation, as described by the Opportunity Council, refers to “the whole home receiving fresh outside
air.” This can be achieved by installing fans (more often a centralized bath fan) and running them
continuously or intermittently (on a timer, not easily turned off by the occupant) throughout the day. This
type of ventilation exhausts indoor contaminants and humidity but also pulls outside air into the home (if
the building envelope is not too tight). Supplying this outside air also has a drying effect; the often
cool/moist outside air enters the home is warmed up and dehumidified (K. White, personal
communication, April 2015).
The majority of homes within the Weatherization Plus Health and Weatherization Only groups received
whole-house installation at 93% and 87%, respectively (Section 5.5 presents data on other weatherization
and healthy homes measures installed for these homes). Findings reveal that 93% of both groups were
observed to have a functional bathroom fan post-intervention; however only 64% of the Weatherization
Plus Health and 53% of the Weatherization Only groups were observed to have a functional kitchen fan
(Table 5.12). The Healthy Homes Only group in general was observed to have a lower percentage of
functional mechanical ventilation measures post-intervention, at 80% (bathroom fans) and 50% (kitchen
fans). Respondents report using their bathroom fans much more than their kitchen fans (for those that
have them); with 100% of the Weatherization Plus Health and 100% of the Weatherization Only, and
75% of the Healthy Homes Only groups using their bathroom fan at least rarely if not every time. As low
as 47% of the Weatherization Only group reports using their kitchen fan at least rarely whereas the
Weatherization Plus Health households use their kitchen fan at least rarely 64% of the time.
40 None of the study homes received a new stove as part of their intervention.

34
Table 5.12. Presence of Functional and in Use Mechanical Ventilation Measures Post-Intervention
Group Functional Kitchen
Fan (Post)
Use kitchen fan
(self-reported)41
Functional Bathroom
Fan (Post)
Use bathroom fan
(self-reported)42
Wx + Health 64% 64% 93% 100%
Wx Only 47% 73% 93% 100%
HH Only 50% 60% 80% 75%
Natural ventilation can minimize energy use during the warmer months and can either aid in exhausting
contaminated and/or humid indoor air to the outside, or supply contaminated and/or humid outdoor air to
the indoor environment, depending on climate and several other contributing factors. Findings revealed
that most, if not all, of the study households opened their windows in the summer at least rarely to all the
time; 93% of the Weatherization Plus Health group and 100% of the Weatherization Only and Healthy
Homes Only groups replied in the affirmative (Table 5.13). As for during the winter, close to 80% of the
Weatherization Plus Health group reported opening windows, followed by the Healthy Homes Only
group (70%), and slightly more than half of the Weatherization Only group.
Table 5.13. Natural Ventilation Post-Intervention by all Groups
Post (self-reported)
Open Windows At All in The Summer (Rarely, Sometimes, Frequently, All the
time)
Wx + Health 93%
Wx Only 100%
HH Only 100%
Open Windows At All in The Winter (Rarely, Sometimes, Frequently, All the
time)
Wx + Health 79%
Wx Only 53%
HH Only 70%
5.4 IMPACTS OF WEATHERIZATION AND HEALTHY HOMES EDUCATION
As part of Weatherization Plus Health and Healthy Homes Only program delivery, comprehensive
education on asthma trigger reduction measures is provided. Decreasing the use of toxic chemicals and
cleaners within the home and increasing dust reduction behaviors are topics typically discussed. As
presented in Table 5.14 there was a substantial decrease pre- to post-intervention in the use of chemical-
based cleaning supplies (compared to more asthma-friendly, non-toxic alternatives) “all or most of the
time.” However, it appears that the Weatherization Plus Health group experienced more of a change as
their use of chemicals “all or most of the time” dropped 72%; 20% for the Weatherization Only and 60%
for the Healthy Homes Only group. It should be noted that these topics are not typically covered during
traditional WAP delivery (Weatherization Only).
41 Rarely, Sometimes, Often, or Every time 42 Rarely, Sometimes, Often, or Every time

35
Table 5.14. Comparison of Use of Chemical Cleaning Supplies Pre to Post-Intervention by All Groups
Pre Post
Use More Chemical Based Cleaning
Supplies (compared to more asthma-
friendly, non-toxic alternatives)
All or
most of
the time
Some or a
little of the
time
Never All or
most of
the time
Some or a
little of the
time
Never
Wx + Health 79% 14% 7% 7% 86% 7%
Wx Only 40% 53% 7% 20% 67% 13%
HH Only 75% 25% 0% 15% 75% 10%
Results from the national WAP evaluation occupant survey revealed that treatment homes reported
changing their air filters more often post-weatherization (Tonn et al. 2015). The benefits of changing the
air filter on the furnace are two-fold; it can both reduce energy use and improve IEQ. Table 5.15 presents
that 50% of Weatherization Plus Health, 47% of Weatherization Only, and 25% of Healthy Homes Only
households were observed to have changed their furnace filter in the last six months. However, the
frequency of this action was challenging to quantify simply from observing the “cleanliness” of the filter
from one house to the next. The self-reported frequencies provide an alternative perspective; 54% of the
Weatherization Plus Health, 33% of Weatherization Only, and 52% of Healthy Homes Only households
reported changing their furnace filter at least every 6 months. However, 10% more of the Weatherization
Only group (compared to the Healthy Homes Only group) and 16% more of the Weatherization Only
group (compared to the Weatherization Plus Health) group reported using a service company that changes
the air filter.
Table 5.15. Frequency of Changing/Cleaning Furnace Filter Post-Intervention by All Groups
Post
Post (self-
reported)
Frequency % %
Change/Clean Air Filter on Furnace (within last six months)43
Wx + Health 7 50% 54%
Wx Only 7 47% 33%
HH Only 5 25% 52%
It appears that the Opportunity Council homes, collectively, displayed evidence of being “dusted” on a
weekly basis (50%); slightly more than the Weatherization Only homes (40%) (Table 5.16). Additionally,
the Opportunity Council homes, again collectively, reported cleaning and vacuuming more often since
receiving intervention substantially more than the Weatherization Only group at 91% and 13%,
respectively. These findings support the argument that comprehensive education provided through
Healthy Homes programs empowers households with knowledge of methods to minimize home-source
evidence-based asthma triggers.
43 Based on observed evidence of changing/cleaning air filter on heating system within the last 6 months.

36
Table 5.16. Frequency of Dusting/Cleaning and Vacuuming Post-Intervention by All Groups
Evidence of Weekly Dusting Post (observed)
Frequency %
Wx + Health 7 50%
Wx Only 6 40%
HH Only 10 50%
OC groups 17 50%
Clean and vacuum more often since receiving intervention (all of
the time, most of the time, some of the time, a little of the time). Yes (self-reported)
Wx + Health 93%
Wx Only 13%
HH Only 90%
OC groups 91%
5.5 WEATHERIZATION AND HEALTHY HOMES MEASURES INSTALLED
Air sealing and insulation measures are commonly installed weatherization measures that not only save
energy but reduce exposure to extreme hot and cold temperatures and reduce infiltration of pests, dust and
outdoor contaminants, thereby reducing exposure to evidence-based asthma triggers. Mechanical
ventilation measures address moisture related problems in the home and may exhaust contaminants
generated from the indoor environment or those that have infiltrated the home from the outdoor
environment.
Table 5.17 presents results from the national WAP evaluation with respect to measures installed in homes
(all building types) weatherized in PY 2010 for a subset of homes located within the climate region
applicable to Northwestern Washington referred to as the ‘moderate’ climate region.44
Installation rates
were as follows: 100% received some type of insulation (i.e. attic, floor or wall); 90% air sealing; 41%
duct-sealing; 65% a new heating system (as an energy cost measure (ECM)); 28% a new heating system
(not for energy conservation purposes); 19% received any window measure; 11% a new air conditioner
(AC); and 17% received ventilation measures (i.e. whole-house, kitchen or bathroom fan). Based on
blower door tests conducted both pre- and post-weatherization, the mean air leakage reduction was 970
cubic feet per minute (CFMs).
44 As part of the national evaluation five climate regions were defined, which were based in large part on the climate zones
recognized by DOE’s Building America program except that states are uniquely assigned to a single zone. Each state was
assigned to a climate region based on estimates of the heating and cooling degree days for the major population centers (Bensch
et al. 2014). All homes for this special study were located in Northwestern Washington State; the moderate climate zone.

37
Table 5.17. Weatherization Measures Installed In Moderate Climate Region for National Sample
Weatherization Measure Moderate Climate Region
Any Insulation 100%
Air Sealing 90%
Duct Sealing 41%
Heating Equipment
New Heating System 28%
New Heating System (ECM) 65%
Any Window Measure 19%
Ventilation (Whole House, Kitchen, Bath Fan) 17%
Air Conditioning 11%
Air Leakage
Pre 3360 CFM
Post 2390 CFM
Comparing the rates presented in Table 5.17 with Figure 5.1, measure installations rates between the
national moderate climate region sample and the Weatherization Only group are similar for insulation
installation, air and duct sealing, and heating system replacement (non-ECM only); but not for ventilation
measures, heating system replacement (ECM), and AC replacement. The ventilation (whole-house)
installation rate for this group is 70% higher than the national sample and 45% lower for ECM heating
system replacements. None received AC replacements.
As for the Weatherization Plus Health homes, insulation and air sealing was installed 100% of the time,
and ventilation measure installation was 23% higher even than the Weatherization Only study homes.
None of those homes received a new AC either. In comparison to the national sample, duct sealing (71%)
and window (storm) installation (36%) were more frequent for the Weatherization Plus Health group.
None of the Weatherization Plus Health homes received a non-ECM furnace replacement.

38
Figure 5.1: Weatherization and Healthy Homes Measures Installed by Group: Weatherization Plus Health
and Weatherization Only
As mentioned above, the level of draftiness can indicate how well sealed a home is; the lower the air
leakage rate (CFMs), the tighter the building envelope is and the less likely pests and outdoor
contaminants can enter the home. Table 5.18 presents the pre and post-intervention CFMs for both the
Weatherization Plus Health and Weatherization Only homes. Pre-intervention, both groups’ homes were
already tighter than the national sample, providing explanation for the mean reduction being less (~150-
300 CFMs). For the study groups in the sample, pre-intervention, the Weatherization Only homes were
more leaky in comparison to the Weatherization Plus Health homes, but the Weatherization Plus Health
homes post-intervention were more tightly sealed (1407 CFMs) than the Weatherization Only homes
(1,588 CFMs). A balanced approach is required to mitigate the infiltration rate of outdoor generated air
contaminants while not sealing in the indoor sourced contaminants. This is where whole-house
mechanical ventilation becomes a critical component for addressing IEQ in concert with weatherization.
Table 5.18. House Air Leakage Rate Pre and Post-Intervention by Group:
Weatherization Plus Health and Weatherization Only (mean CFMs)
Group Pre-Intervention Post-Intervention Reduction
(mean CFMs)
Wx + Health 2067 1407 660
Wx Only 2409 1588 821
Indoor Temperatures 5.5.1
Existing research studies show that exposure to extreme temperatures can exacerbate asthma symptoms in
turn increasing ED admissions for childhood asthma (Xu et al. 2013 and Guo et al. 2012). Xu (2013)
states “children aged 0-4 years were more vulnerable to heat effects while children ages 10-14 years were
more vulnerable to cold effects.” Findings from this study suggest that post-intervention indoor
temperatures were dramatically more comfortable for the occupants. Table 5.19 presents that 97% of the
Weatherization Plus Health households reported pre-intervention that their home was either “cold” or
“very cold”; post-intervention 100% reported their home was “comfortable.” The increase in comfortable
0%
20%
40%
60%
80%
100%
Wx + Health
Wx Only
*A/C installation is 0% for both groups

39
temperatures for Weatherization Only and Healthy Homes Only45
group households were also observed,
but it appears that there might be potential for synergistic benefits of WAP plus healthy housing evident
based on these results.
Table 5.19. Indoor Temperatures Pre and Post-Intervention by All Groups
Indoor Temperatures Pre
Very Cold Cold Comfortable Hot Very Hot
Wx + Health 77% 23% - - -
Wx Only 60% 40% - - -
HH Only 40% 40% 20% - -
OC groups 61% 30% 9% - -
Post
Very Cold Cold Comfortable Hot Very Hot
Wx + Health - - 100% - -
Wx Only 13% - 87% - -
HH Only - 10% 80% 10% -
OC groups - 4% 91% 4% -
5.6 OCCUPANT HEALTH AND HEALTH CARE COVERAGE
As stated previously, social justice in the context of human health is generally equated with access to
health resources and equal opportunity to a healthy life. Fortunately, the majority of children that
participated in this study were reported by the head of household to have had health care coverage (at
least over the 12 months prior to the post-intervention occupant survey), with more of the Opportunity
Council groups (91% collectively) than the Weatherization Only group (64%) holding Medicaid as their
primary insurance (See Table 5.20).
Table 5.20. Health care Coverage Post-Intervention - All Groups
HEALTH CARE COVERAGE Wx +
HH
Wx
Only
HH
Only
OC
Groups
In the past 12 months has your child(ren) with asthma had any
kind of health care coverage?
Yes 100% 87% 95% 97%
If yes, which type?
Medicaid 93% 64% 95% 91%
Basic Health46
- 21% - -
Private individual or group insurance 7% 7% 5% 6%
The next set of tables present data reported by the head of the household for all study groups related to
health status post-intervention (i.e., frequency of asthma symptoms, ED and hospital visits, and days of
45 The increased rate of reported comfort for the Healthy Homes Only group is debatable as they did not receive any
weatherization measures. One explanation for the reported increase in comfort could be due to response bias. 46 Washington Basic Health (WBH) is a system created and administered by the state of Washington to enable low income
individuals, and families to purchase basic health care services through participating managed health care plans. WBH is
administered by the Health Care Authority, available to Washington residents who meet income guidelines and are not eligible
for Medicare. Premiums are based on age and income. Washington Basic Health Plus (WBHP) is a Medicaid Program
administered by the Department of Social and Health Services and the Health Care Authority for children from low-income
families. There are no premiums or copayments. It should be noted that these surveys were administered before the Affordable
Care Act and these programs may currently differ from the description above.

40
school missed.) Table 5.21 focuses on head of household health status post-intervention and Table 5.22
focuses on child health status post-intervention.
All children participating in this study were reported by the head of the household to have asthma;47
although not all had received a medical diagnosis. Within the sample, 93% of the Weatherization Plus
Health group, 80% of the Weatherization Only group, and 95% of the Healthy Homes Only group
contained at least one child with an asthma diagnosis from a medical provider. Interestingly, 8% of the
Weatherization Plus Health group, 11% of the Healthy Homes Only group, and 18% of the
Weatherization Only group reported that post-intervention at least one child in the home no longer had
asthma.
A comparison between groups showed that individuals within the Weatherization Only group (for both
head of household and child) experienced asthma symptoms much more recently (“within the last six
days”) than the Opportunity Council groups, collectively, and in particular the Weatherization Plus Health
group. The Weatherization Only and Healthy Homes Only group included individuals that reported they
sought out urgent health care over the last 12 months due to asthma symptoms where individuals from the
Weatherization Plus Health group reported they did not. One adult and one child in the Healthy Homes
Only group and one child in the Weatherization only group reported to have stayed overnight in a
hospital. One child within the Weatherization only group and four children within the Healthy Homes
only group were reported to have gone to the ED (not counting hospitalizations) for their asthma
symptoms.
47 It is important to note that even though all children participating in this study were reported to have asthma by the head of the
household that the findings in this table specifically were from the occupant survey which was administered at the household
level. Questions pertaining to symptoms, diagnoses, medical care, days of school missed can only be related to one child in the
home, regardless of the number of children living in the home. Therefore the sample sizes are not the total number of children
included in each group. Medical data on a case by case basis will be explored in Section 6 through the analysis of Medicaid and
Physician records.

41
Table 5.21. Health Status (Head of Household) Post-Intervention - All Groups*
HEAD OF HOUSEHOLD HEALTH STATUS POST-
INTERVENTION
Wx +
HH
Wx
Only
HH
Only
OC
Groups
Have you ever been told by a doctor or other health professional
that YOU (head of household) have asthma?
n=14 n=15 n=20 n=34
Yes 36% 27% 35% 35%
Do you STILL have asthma? n=5 n=4 n=9 n=14
No 20% 25% 56% 57%
How long has it been since YOU last had any symptoms of
asthma?48
n=5 n=349
n=550
n=10
Less than one day ago - 33% 20% 10%
1-6 days ago 20% 33% 20% 20%
1 week to less than 3 months ago 40% - - 20%
3 months to less than 1 year ago 20% - 40% 30%
1 year to less than 3 years ago - - -
3 years to 5 years ago - 33% -
More than 5 years ago 20% - - 10%
During the past 12 months did YOU have to stay overnight in the
hospital because of asthma?
Yes 0% 0% 20% 10%
Not counting hospitalizations, during the past 12 months, did
YOU go to an emergency room because of asthma?
Yes 0% 0% 0% 0%
*Sample sizes are as follows (unless noted): Wx + Health = 5; Wx Only = 4; HH Only = 5; All OC Groups = 10
Table 5.22 also presents the number of days of school (including pre-school or daycare) that the head of
household reported their children having to miss due to asthma symptoms. A substantial number of
children, in all study groups, missed several days of school over the last 12 months due to asthma; 38% of
the children within the Weatherization Plus Health group, and 58% of the Healthy Homes Only group
missed 6+ days and 25% of the Weatherization Only group missed 11+ days of school.
Overall, a substantial number of caregivers reported that their child’s health had improved, in general,
post-intervention. All of both the Opportunity Council groups and 82% of the Weatherization Only group
reported their children “seemed to feel better”; and 100% of the Weatherization Plus Health group, 94%
of the Healthy Homes Only group and 64% of the Weatherization Only group reported their children
“could run and play longer” post-intervention.
48 Missing answers include “Don’t know/not sure”. 49 Sample size differed due to some respondents leaving question blank. 50 Sample size differed due to some respondents leaving question blank.

42
Table 5.22. Health Status (Child) Post-Intervention - All Groups*
CHILD HEALTH STATUS POST-INTERVENTION Wx +
HH
Wx
Only
HH
Only
OC
Groups
Have you ever been told by a doctor or other health professional
that at least one child in the home has asthma?
n=14 n=15 n=20 n=34
Yes 93% 80% 95% 94%
Does this child STILL have asthma?
No
How long has it been since your child(ren) last had any symptoms
of asthma? (at least one child in the home)
Less than one day ago - 20% 20% 12%
1-6 days ago - 7% 20% 12%
1 week to less than 3 months ago 21% 13% 20% 21%
3 months to less than 1 year ago 50% 27% 15% 29%
1 year to less than 3 years ago 14% 7% 10% 12%
During the past 12 months did your child(ren) have to stay
overnight in the hospital because of asthma?
Yes 0% 9% (1) 6% (1) 3%
Not counting hospitalizations, during the past 12 months, did your
child(ren) go to an emergency room because of asthma?
Yes 0% 9% (1) 24%
(4)
14%
In the past 12 months, about how many days of school (including
pre-school or daycare) has your child(ren) missed because of
asthma-related symptoms?
n=14 n=15 n=20 n=34
0 0% 0% 5% 5%
1-5 63% 75% 33% 45%
6-10 25% 0% 50% 40%
11+ 13% 25% 8% 10%
Does your child seem to feel better more of the time since your
homes received weatherization and/or healthy homes services?
Yes 100% 82% 100% 100%
Since receiving weatherization and/or healthy homes services is
your child able to run and play longer without resting?
Yes 100% 64% 94% 97%
*Sample sizes are as follows (unless noted): Wx + Health = 12; Wx Only = 11; HH Only = 17; All OC Groups = 29
In addition to suffering with asthma, for children living within the Opportunity Council homes,
collectively, 44-62% had been diagnosed by a medical professional (sometime over the last 12 months)
with respiratory allergies, the flu, persistent cold symptoms, and/or a sinus infection (Table 5.23). These
rates are substantially lower among the children living within the Weatherization Only homes.

43
Table 5.23. Other Health Issues (Child) Post-Intervention - All Groups
CHILD HEALTH STATUS POST-INTERVENTION Wx +
HH
Wx
Only
HH
Only
OC
Groups
In the past 3 months, has your child(ren) had . . .
Shortness of breath when lying down,
waking up, or with light work or light exercise?
n=14 n=15 n=20 n=34
Yes 43% 13% 35% 38%
In the past 12 months has your child(ren) had or been told by a
doctor or health professional that they have…(% of yes answers
are reported only)
n=14 n=15 n=20 n=34
3 or more ear infections per year 7% 7% 20% 15%
Any kind of respiratory allergy 50% 33% 65% 59%
Flu 57% 20% 55% 56%
Persistent cold symptoms lasting more than 14 days 57% 13% 65% 62%
Sinus infection 57% 13% 35% 44%
Bronchitis 21% 20% 25% 24%


45
6. ANALYSIS OF MEDICAID RECORDS
Medicaid records collected from the Washington State HCA51
were sent to the Opportunity Council study
staff to be de-identified prior to being sent to ORNL analysts. Case identifiers were used to link the
records to demographics, housing characteristics, program type, and measures installed in the home
collected through other study instruments. Analysis was completed on individual cases, instead of
focusing on the household level, to better capture potential change in health status evidenced by changes
in health care use and costs. Statistical analyses were performed using both Microsoft Excel and
Statistical Package for the Social Sciences (SPSS) calculation functions.
6.1 CHARACTERIZATION OF MEDICAID STUDY DATA AND PARTICIPANTS
The HCA Medicaid file for this study contained 46 individual cases; 62.2% of the total study sample
(Table 6.1). The file contained both header and line (i.e., “paid”) claims. Header claims contained a
subset of line claims submitted for that date. For this study, line claims were used for calculating the total
Medicaid claims and costs for pharmacy and professional claims under each header claim. Paid amounts
for inpatient claims were pulled from the header claims as the costs for this type of claim were not found
in the line claim field. The file received from HCA did not capture the costs for outpatient claims.52
Claims were then sorted by program type; Weatherization Plus Health (Wx+H), WAP (Wx Only), and
Healthy Homes only (HH Only). Intervention dates were inserted according to program service delivery
dates provided by the participating agencies to eventually determine impacts on health status from
changes in the home environment. The intervention date ranged between March 2006 and June 2013.
Cases were included in the Medicaid analysis if adequate time for accrual of pre-intervention claims was
observed (i.e., >3 months). Table 26 contains additional descriptive statistics on the HCA data set
received, as well as for the 31.3% of the study’s cases deemed usable for this analysis (n=23). The
Weatherization Plus Health group provided 43.5% of the usable Medicaid data with Weatherization Only
and Healthy Homes Only groups contributing 26.1% and 30.4% respectively. On average (i.e., arithmetic
mean), cases included in the Medicaid analysis contained a total of 25.1 line claims, and an average of
11.2 claims pre-intervention, 12.6 claims post-intervention, 12.3 months pre-intervention, and 28.3
months post-intervention. Study analysts used this data to calculate the difference in mean number of
claims and costs per month pre and post-intervention between study groups (Section 6.2).
51 http://www.hca.wa.gov/Pages/about.aspx 52 All outpatients claims received were $0 claims at both the header and line levels. It is not well understood who paid for those
outpatient claims.

46
Table 6.1. Medicaid Data Collected by Research Group
Medicaid data collected by Research Group
(Individual Case Level)
Wx + HH Wx Only HH Only ALL
Whole sample n=21 n=23 n=30 n=74
Medicaid data collected (cases) n=14 n=11 n=21 n=46
% of program sample 66.6% 47.8% 70% 62.2%
Total number of line claims 507 206 213 926
Cases with usable Medicaid n=10 n=6 n=7 n=23
% of Study sample 47.6% 26.1% 23.3% 31.1%
% of Medicaid sample 43.5% 26.1% 30.4% 100%
Total line claims per usable case (mean) 25.1 31.3 46.6 33.3
Line claims per case pre-intervention (mean) 11.2 13.3 17.9 13.8
Line claims per case post-interventions (mean 12.6 16.2 26.4 17.5
Months per case pre-intervention (mean) 12.3 9.5 11.3 11.3
Months per case post-interventions (mean) 28.3 25.2 18.7 24.6
Claims within the 30 day post-window (mean) 1.9 1.7 1.8 2.3
Within the Medicaid sample were two groups that received some extent of Healthy Homes measures;
73.9% of the total Medicaid sample. Those households that received either full or simple measure
packages may have also received weatherization (i.e., Weatherization Plus Health). All Weatherization
Plus Health recipients received the full extent of the Healthy Homes package in concert with their
comprehensive weatherization package. Within the Medicaid Healthy Homes Only sample, 4 of the 7
cases received a one-time visit at the home and a simple measures package (e.g., public health education,
HEPA vacuum, dust mite covers) with 3 having received a full package of Healthy Homes measures (e.g.,
carpet replacement with vinyl flooring) (Table 6.2). This distinction becomes relevant when considering
impacts on Medicaid claims and costs and after identifying super-utilizers of the health care system
within the Healthy Homes Only sample that might have benefitted from a more extensive home retrofit
provided through Weatherization Plus Health.
Table 6.2. Percent of Healthy Homes Cases That Received Either Full Or Simple Packages
Healthy Homes package type Full Simple ALL HH Cases
Medicaid study participants n=13 n=4 n=17
% of Medicaid sample 76.5% 23.5% 100.0%
Table 6.3 contains caregiver-reported demographics and housing characteristics for the participants in the
sample for each study group. Overall, 56.5% of the sample was male, 30.4% was white/non-Hispanic,
21.7% identified as white/Hispanic, and 26.1% identified as Hispanic. Black, non-Hispanic, Asian and
those reported as “Other” were underrepresented at 4.3%, 8.7% and 8.7% respectively. Unfortunately, no
individuals in the sample identified as American Indian. According to Washington State level statistics,
this population is disproportionality burdened with widespread asthma prevalence (CDC 2015).
Over half of the study sample contained children aged 5-10 years of age. This was expected as the
programs operated through the Opportunity Council target families with young children with asthma.
The majority of households in the sample rented their home, with the exception of those in the
Weatherization Only group who reported being homeowners (66.7%). Differences between groups were
observed when housing type was assessed. The vast majority of households in the Weatherization Plus
Health group resided in manufactured housing while over half of the households in the Healthy Homes
group and 100% of households in the Weatherization Only group resided in SF site built housing.

47
Table 6.3. Caregiver-Reported Demographics and Housing Characteristics by Study Group
Survey Questions from Occupant Survey (Self-
Reported Post-Intervention as part of the study)
Wx + HH Wx Only HH Only ALL
DEMOGRAPHICS n=10 n=6 n=7 n=23
Gender
Male 60% 50% 57.4% 56.5%
Female 40% 50% 42.9% 43.5%
Race
White, Non-Hispanic 10% 66.7% 28.6% 30.4%
White, Hispanic 40% 16.7% - 21.7%
Hispanic 40% - 28.6% 26.1%
Black, Non-Hispanic - - 14.3% 4.3%
Asian 10% - 14.3% 8.7%
Other - 16.7% 14.3% 8.7%
Age range (years)
0-5 40% 33.3% 14.3% 30.4%
5-10 50% 16.7% 85.7% 52.2%
10-15 10% 16.7% - 8.7%
15-20 - 33.3% - 8.7%
HOUSING
Home occupancy type
Rent 80% 16.7% 71.4% 60.9%
Own 20% 66.7% 28.6% 34.8%
Neither - 16.7% - 4.3%
Housing Type
Apartment - - 14.3%
Manufactured 60% - 14.3%
Single family 40% 100% 57.1%
Other - - 14.3%
International Classification of Diseases, Ninth Revision (ICD-9) codes were used for the HCA request for
records. All header or line claims with any ICD-9 asthma codes (codes starting with 493) listed as either
primary or secondary diagnisos were requested. Table 6.4 contains the ICD-9 codes listed as the primary
diagnosis for each line claim in the HCA Medicaid data set received.53
53 Additional diagnosis codes were observed but were not included in this list if deemed non-relatable to the study.

48
Table 6.4. ICD-9 Codes Listed As Primary Diagnosis for Line Claims
ICD-954
Diagnosis codes for all line claims (n=926)
Primary Diagnosis is Asthma – ICD-9 code starting with 493.
493.00 Extrinsic asthma, unspecified
493.01 Extrinsic asthma with status asthmaticus
493.02 Extrinsic asthma with (acute) exacerbation
493.10 Intrinsic asthma, unspecified
493.12 Intrinsic asthma with (acute) exacerbation
493.81 Exercise induced bronchospasm
493.82 Cough variant asthma
493.90 Asthma, unspecified type
493.91 Asthma, unspecified type with status asthmaticus
493.92 Asthma, unspecified type with (acute) exacerbation
Other Primary Diagnosis with a 493 asthma diagnosis code as secondary diagnosis
786.2 Cough
472.0 Chronic rhinitis
474.10 Hypertrophy of tonsil with adenoids
465.9 Acute upper respiratory infections of unspecified site
462 Acute pharyngitis
786.07 Wheezing
461.0 Acute maxillary sinusitis
799.9 Other unknown and unspecified cause of morbidity and mortality
382.9 Unspecified otitis media
486 Pneumonia, organism unspecified
381.10 Chronic serous otitis media, simple or unspecified
530.81 Esophageal reflux
461.9 Acute sinusitis, unspecified
381.00 Acute nonsuppurative otitis media, unspecified
786.50 Unspecified chest pain
477.8 Allergic rhinitis due to other allergen
995.20 Unspecified adverse effect of unspecified drug, medicinal and biological substance
477.0 Allergic rhinitis due to pollen
466.0 Acute bronchitis
477.9 Allergic rhinitis, cause unspecified
784.0 Headache
Both header and line claims were categorized by claim type for further characterization and analysis of
costs (Table 6.5). The total amount of claims received from HCA was approximately $70.5K. Inpatient
costs account for 19.7% of the total amount paid by Medicaid for all claims received from HCA. The
Medicaid paid amount without inpatient claims totaled $56,655. The average cost per claim without
54 ICD-9 code listings were retrieved from; http://www.cms.gov/medicare-coverage-database/staticpages/icd-9-code-
lookup.aspx?KeyWord=784&bc=AAAAAAAAAAAEAA%3d%3d&

49
inpatient costs was approximately $61 per claim.55
Table 6.6 contains types of Medicaid claims for each
of the study groups. The Weatherization plus Health group comprised the least amount of claim totals at
approximately $17K.
Table 6.5. Header and Line Claim Types
Type and cost of Asthma-related
Medicaid Line Claims for all
Cases (n=46)
Inpatient Outpatient Pharmacy Professional ALL
Count n=3 n=11 n=387 n=525 n=926
Cost $13,877 NA $32,410 $24,266 $70,552
% of total costs 19.7% NA 45.9% 34.4% 100%
Table 6.6. Header and Line Claim Types by Research Group
Cost of Asthma-related
Medicaid Line Claims for all
Cases (n=46) by program type
Wx + Health Wx Only HH Only Total Costs
Inpatient claims - $10,564 $3,313 $13,877
Pharmacy claims $6,266 $10,318 $15,826 $32,410
Professional claims $10,707 $5,098 $8460 $24,266
All claims $16,973 $25,980 $27,599 $70,552
Similar to how the CMCS categorized recipients of Medicaid as super-utilizers of the health care system,
the Medicaid cases and claims submitted by the HCA were combed for indicators that might contribute to
this discussion. Of the 926 claims collected, 6 individual cases contributed to 40% of all claims received
(n=401). Included in the data set were three claims for inpatient hospital care for three separate cases
totaling $13,877; approximately 20% of the total cost for all claims. The inpatient claim submitted by
one individual in the HH group was prior to the intervention. The two claims submitted by the
Weatherization Only group were submitted post intervention. In this sample, individual cases were
categorized as super-utilizers of the Medicaid system if they were included in the pre/post costs
comparisons and if they had received inpatient hospital care with a primary asthma-related diagnosis, or
their annualized costs for asthma were greater than the pre-intervention mean ($1,129) for that sample.
The eight (17.4% of the sample) cases that qualified for this group accounted for 54% of the total claims
and 45.7% of the total costs of all claims. Interestingly, none of the super-utilizers belonged to the
Weatherization Plus Health group (Table 6.7).
Table 6.7. Super-utilizer Status by Research Group
Cross tabulation of Super-utilizer by Research
Group (Individual Case Level; n=22)
Wx + H Wx Only HH Only ALL
Super-utilizer n=0
-
n=4
66.7%
n=4
66.7%
n=8
36.4%
6.2 IMPACT ANALYSIS
Impact analysis was conducted to derive comparisons between the sample groups. The following
indicators were employed: (1) the average number of claims per month; (2) the average costs of claims
per month; and (3) annualized costs. These high level indices were then used as variables in a paired
55 Medical inflation was not calculated due to the range of dates within the sample and the uncertainty of calculating specific
medical inflation from year to year.

50
samples t-test to best determine statistical difference in means between groups; Weatherization Plus
Health, Healthy Homes Only and WAP Only.
The average number of claims paid by Medicaid per month was calculated for each individual case prior
to the intervention and then for each month post intervention. The collective arithmetic mean for each
group was then calculated for the pre- and post-intervention periods separately. A 30-day post
intervention window was inserted as health care appointments may have been scheduled prior to the
intervention or as retrofits completed within the home may have temporarily increased exposure to
environmental triggers. The results of a paired sample t-test suggest that a statistically significant
difference of means exists between the average number of claims submitted per month pre- and post-
intervention within the Weatherization Plus Health and WAP Only groups (Table 6.8). There was a
difference in means of -.42 and -.90 claims per month, respectively, in these groups. Although results
indicate that the Healthy Homes group experienced an increase in the average number of claims per
month, decreases in costs were observed in all three groups (Table 6.9). It should again be noted that the
Healthy Homes group received the “simple” package of asthma reduction measures as opposed to the
major measures offered through the Weatherization Plus Health program (e.g., flooring replacement,
mechanical ventilation). The Healthy Homes group included participants with higher amounts of claims
and costs per month overall and thus may have benefited from the additional measures provided through
Weatherization Plus Health and WAP. Comparisons between study groups were calculated using analysis
of variance (two-way ANOVA). These tests revealed no statically significant differences between any of
the groups related to changes in the average number of claims paid per month post-intervention.
Calculations to determine intervention impacts were performed to determine costs per month and
annualized costs for each study group (Table 6.9). The data suggest an increase (by $5) in average costs
per month within the Weatherization Plus Health group, but when annualized, suggest a decrease of $85
per year. The greatest impact was observed within the Healthy Homes Only group with a mean decrease
of $1204 per year, when including inpatient costs, and a decrease of $363 when not. Conversely, the
WAP Only group experienced a mean decrease of $785 when including inpatient costs and a decrease of
$1,026 when not. Baseline asthma-related costs for the Weatherization Plus Health group pre-intervention
were considerably lower than the other two study groups, especially with the absence of any super-
utilizers of the system. Additionally, this group had the longest range of months of claims collected both
pre- and post-intervention. One could speculate that persistence of asthma-trigger reduction measures
could have played a role, or that this group provides a better glimpse into the true impact over time for a
program inclusive of all eligible children with asthma without considering severity. Finally, observations
were made within the data set that the same type of claim from the same provider increased after a certain
calendar year. However, the provider was not contacted to determine if the cost increase was due to
medical inflation or to additional services required by study participants. Figure 6.1 captures the change
in average number of claims and costs per month submitted to Medicaid for all study participants over
time.
Comparisons between groups were calculated to determine statistical significance in the difference in
costs paid per month post-intervention. These tests were performed using analysis of variance (two-way
ANOVA) and revealed a statically significant difference between the Weatherization Plus Health and
Healthy Homes groups in the mean of the average costs of claims per month post-intervention when
including the costs for inpatient care (p < .05). These tests also revealed statistically significant
differences between the Weatherization Plus Health and WAP Only groups in the mean of the average
costs of claims paid each month (p < .05) and in annualized costs (p < .05) post-intervention, but only
when excluding inpatient costs.

51
Table 6.8. Results from a Paired Sample T-Test Comparing Difference of Means between the Average
Number of Claims Submitted Per Month Pre- and Post-Intervention by Research Group
Paired sample t-test results for means comparison pre/post
intervention using claims data by program type for
individual cases (n=23)
Wx +
Health
(n=10)
Wx Only
(n=6)
HH Only
(n=7)
ALL
(n=23)
Mean of the average number of claims paid per month
pre-intervention .88 1.45 1.49 1.21
Mean of the average number of claims paid per month
post-intervention .46 .55 1.59 .83
Paired differences -.42* -.90* +.10 -.38
*** p<.001; ** p <.01; * p<.05 Table 6.9. Results from a Paired Sample T-Test Comparing Difference of Means between Average Costs per
Claim Submitted Pre- And Post-Intervention by Research Group
Paired sample t-test results for means comparison pre/post
intervention using claims cost data by program type for
individual cases (n=2256
)
Wx +
Health
(n=10)
Wx Only
(n=6)
HH Only
(n=6)
ALL
(n=22)
Mean of the average costs of claims paid per month
pre-intervention $52 $108 $104 $81
Mean of the average costs of claims paid per month
post-intervention $57 $68 $36 $55
Paired differences +$5 -$40 -$68 -$26
Mean of the average costs of claims paid per month
pre-intervention (no inpatient) $52 $108 $61 $70
Mean of the average costs of claims paid per month
post-intervention (no inpatient) $57 $45 $36 $48
Paired differences +$5 -$63 -$25 -$22
Mean of the annualized costs of claims paid per month
pre-intervention $427 $1423 $2003 $1129
Mean of the annualized costs of claims paid per month
post-intervention $342 $638 $799 $548
Paired differences -$85 -$785 -$1204 -$581
Mean of the annualized costs of claims paid per month
pre-intervention (no inpatient) $427 $1423 $1175 $903
Mean of the annualized costs of claims paid per month
post-intervention (no inpatient) $342 $397 $799 $482
Paired differences -$85 -$1026 -$376 -$421*
*** p<.001; ** p <.01; * p<.05
56 One case in the HH Only group did not have enough claims data with costs included to be included in this analysis.

52
Figure 6.1. Graphic of Average Claims and Costs per Month for All Study Groups Pre- and Post-Intervention
Basic descriptive frequencies were calculated to capture the percentage of study participants in each
group that had an observed decrease in each category (Table 6.10). Overall, the majority of cases in each
study group and the super-utilizer group showed a decrease in the average number of claims submitted to
Medicaid per month, a decrease in the average costs of those claims per month, and a decrease in
annualized costs after the intervention. Overall, nearly 83% of all cases observed some decrease in the
number of Medicaid claims per month post intervention, and nearly 64% of all cases observed some
decrease in the cost of those claims per month post intervention. This impact increased to nearly 82%
when inpatient claims were excluded.
Table 6.10. % of Cases with a Decrease in Claims and Costs by Research Group
% of cases with a decrease in claims and costs
by program type
Wx + HH Wx Only HH Only Super-
utilizer
ALL
CLAIMS n=10 n=6 n=7 n=8 n=23
Any decrease in average number of claims per
month post intervention (YES) 90.0% 83.3% 71.4% 75% 82.6%
COSTS n=10 n=6 n=6 n=8 n=22
Any decrease in average cost of claims per month
post intervention (YES) 50.0% 66.7% 83.3% 62.5% 63.6%
Any decrease in average cost of claims per month
post intervention (no inpatient) (YES) 50.0% 83.3% 66.7% 62.5% 63.6%
Any decrease in annualized cost
post intervention (YES) 80.0% 83.3% 83.3% 75% 81.8%
Any decrease in annualized cost
post intervention (no inpatient) (YES) 80.0% 83.3% 83.3% 75% 81.8%
Final statistical analysis was performed to identify correlations between group type, participant
characteristics and conditions existing in the pre and post-intervention environments (Table 6.11). As
expected, super-utilizers of the health care system were positively correlated with annualized costs both
Intervention Intervention

53
pre- and post-intervention. The Weatherization Plus Health group was positively correlated with
annualized costs in the pre-intervention period but no statistically significant relationship was found in the
post-intervention environment. The Weatherization Plus Health group also contained children with better
controlled asthma as indicated by a negative correlation value with participants scoring poorly on the
ACT. Poor ACT scores were also negatively correlated if the study participant was male.57
A positive
relationship between the Healthy Homes Only group and annualized costs was observed in the pre-
intervention environment and, after excluding costs for inpatient care, in the post-intervention
environment. However, a statistically significant relationship was observed between that group and
individuals with super-utilizer status. Interestingly, a negative correlation was observed between the
Weatherization Only group and household reported observations of mold or mildew post-intervention, but
a positive correlation was observed between the Weatherization Plus Health group and observations of
mildew in the home post-intervention.
Table 6.11. Statistically Significant Correlating Factors with Each Research and Super-Utilizer Group
Statistically significant correlating factors for Medicaid
Sample (n=23)
Wx +
Health
Wx Only HH Only Super-
utilizer
Annualized cost pre-
intervention
Nature of relationship - + +
Coefficient of Determination (R2) .511* .427* .670**
Annualized cost pre-
intervention (no inpatient)
Nature of relationship - +
Coefficient of Determination (R2) .543** .678**
Annualized cost post-
intervention
Nature of relationship +
Coefficient of Determination (R2) .604**
Annualized cost post-
intervention (no inpatient)
Nature of relationship + +
Coefficient of Determination (R2) .454* .568**
ACT poor control score Nature of relationship -
Coefficient of Determination (R2) .550*
Observation mold post-
intervention
Nature of relationship -
Coefficient of Determination (R2) .422*
Observation mildew post-
intervention
Nature of relationship + -
Coefficient of Determination (R2) .649*** .434*
Clean more post-
intervention
Nature of relationship -
Coefficient of Determination (R2) .775***
Child has respiratory
allergy
Nature of relationship +
Coefficient of Determination (R2) .533*
Child has sinus infections Nature of relationship +
Coefficient of Determination (R2) .618
Hispanic Nature of relationship +
Coefficient of Determination (R2) .565**
Pets allowed on furniture
post intervention
Nature of relationship +
Coefficient of Determination (R2) .439*
Pets allowed in common
areas post intervention
Nature of relationship +
Coefficient of Determination (R2) .452*
Own Home Nature of relationship + +
Coefficient of Determination (R2) .582** .477*
Housing Type;
Manufactured
Nature of relationship + -
Coefficient of Determination (R2) .429*
Super-utilizer Nature of relationship - - +
Coefficient of Determination (R2) .703*** .438*
Correlation is significant at the following levels (2-tailed):.*** p<.001; ** p <.01; * p<.05
57 Correlation is significant at the 0.05 level (2-tailed).


55
7. CONCLUSION
Effective multi-attribute asthma reduction programs provide a public health resource mitigating a suite of
evidence-based environmental triggers inside the home. Analysis of the occupant-reported and field-
collected data from the three study groups revealed that both weatherization and healthy homes
interventions improved dwelling quality and reduced home-source evidence-based asthma triggers with
the potential for synergistic benefits of WAP plus healthy housing evident. In general, caregivers reported
that their child’s health had improved post-intervention and they “could run and play longer.”
The data used to measure asthma morbidity for Medicaid-insured study participants residing in homes
that received either Weatherization Plus Health, Healthy Homes, or standard WAP services suggest that
statistically significant decreases occur in health care utilization and costs post intervention, and a
statistically significant decrease was observed in annualized asthma-related Medicaid costs for all study
groups collectively. The average number of claims paid by the Washington State Medicaid program per
month also decreased significantly within the Weatherization Plus Health and WAP only groups. Because
the Healthy Homes sample in this study included participants with higher baseline amounts of claims and
costs per month overall, this group could possibly have benefited from the additional measures provided
through Weatherization Plus Health and WAP. Based on these data it is reasonable to propose that the
Opportunity Council give high priority to families caring for children with severe asthma considered to be
super-utilizers of the health care system and to members of populations or demographics
disproportionately burdened with asthma (e.g., American Indians in Washington State) to maximize the
potential impact of these programs.
Overall, the services delivered by the participating agencies in this study significantly reduced health care
costs for Medicaid-insured asthmatic children residing in Northwestern Washington State. However, it is
important to consider additional actions caretakers take upon recognizing poor health status of children
with asthma in their homes not controlled for during this study. Mitigating home-related environmental
asthma triggers is but one action associated with improved asthma control and outcomes. Accessing
services known to improve the dwelling quality by mitigating environmental triggers might be done in
concert with other evidence-based actions. Utilization of health care services, accessing school health
professionals, reducing exposure to seasonal triggers, modifying exercise, and changes in medications and
dosage are but a few actions that caregivers might undertake to improve asthma-related health outcomes
for their children. As part of the study, physician records were collected and combed for additional insight
into these factors. This set of 10 case studies containing complete sets of survey, physician, housing
intervention, and Medicaid data will be related in a separate subsequent analysis.
Research studies have sought to isolate and measure the effectiveness of home interventions targeting
reductions in asthma symptoms, episodes, and costs. The current body of literature suggests that
mitigating indoor environmental asthma triggers improves health outcomes for children. This study
sought to explore the potential for assessing programmatic impacts through outcome measures contained
in linkable Medicaid records-only and physician records research. Through this study we can conclude
that it is possible to collect and link these data at individual and household levels. The research collected
through this study suggests that Weatherization Plus Health, Healthy Homes, and WAP all contribute to
addressing the problem of asthma as a health disparity, but additional research is required to better
attribute the reductions in Medicaid claims and costs to these programs, and to generalize the results to all
program recipients. For future studies, larger sample sizes will help detect differences between groups and
will provide statistical power for more defensible results. Finally, persistence over time for any reduced
costs and claims achieved at a programmatic level requires further investigation.


57
REFERENCES
Akinbami, L.J., Moorman, J.E., Bailey, C., Zahran, H.S., King, M., Johnson, C.A. and L., Xiang. Asthma
prevalence, health care use, and mortality in the United States, 2001-2010. National Center for Health
Statistics Data Brief; no 94. Hyattsville, MD: National Center for Health Statistics. 2012.
Akinbami, L.J., Moorman, J.E. and Liu, Xiang. Asthma prevalence, health care use, and mortality: United
States, 2005-2009. National Health Statistics Reports; no 94. Hyattsville, MD: National Center for Health
Statistics. 2011.
Bensch, I., Keene, A., Cowan, C., and Koski, K. 2014. National Weatherization Assistance Program
Characterization: Describing the Pre-ARRA Program. ORNL/TM-2013/188, Oak Ridge National
Laboratory, Oak Ridge, Tennessee, April.
Bloom B, Jones LI, Freeman G. Summary health statistics for U.S. children: National Health Interview
Survey, 2012. National Center for Health Statistics. Vital Health Stat 10(258). 2013
Bornehag C.G. (2013). Environmental health risks should be studied with an interdisciplinary approach
Environment and Health – Bridging South, North, East and West; http://www.ehbasel13.org/
Bryesse, J., Dixon, S., Gregory, J., Philby, M., Jacobs, D.E. and Krieger, J. (2014). Effect of
weatherization combined with community health worker in-home education on asthma control. American
Journal of Public Health, 104(1), e57-e64.
Breysse, P., Farr, N., Galke, W., Lanphear, B., Morley, R. and Bergofsky, L. (2004). The relationship
between housing and health: Children at risk. Environmental Health Perspectives, 112(15), 1583-1588.
Bryant-Stephens, T., Kurian, C., Guo, R. and Zhao, H. (2009). Impact of household environmental
intervention delivered by lay workers on asthma symptom control in urban, disadvantaged children with
asthma. American Journal of Public Health, 99(S3), S657-S665.
Centers for Disease Control and Prevention. Environmental Public Health Tracking Network. Asthma
Prevalence among Children. Accessed From: www.cdc.gov/ephtracking. Accessed on: June 16, 2015
CDC. (2014). National Center for Environmental Health. Asthma’s Impact on the Nation: Data from the
CDC National Asthma Control Program. Retrieved from:
http://www.cdc.gov/asthma/impacts_nation/AsthmaFactSheet.pdf
Corso, P. and Fertig, A. (2009). The long-term economic costs of asthma. Partnership for America’s
Economic Success. Issue Paper no 13.
Coughlin T. and Long S. Health Care Spending and Service Use among High‐Cost Medicaid
Beneficiaries, 2002‐2004, Inquiry. 2009/2010:46(4);405‐17.
Crocker, D.D., Kinyota, S., Dimutru, G.G., Ligon, C.B., Herman, E.J., Ferdinands, J.M., Hopkins, D.P.,
Lawrence, B.M., Sipe, T.A.; Taskforce on Community Preventive Services. (2011). Effectiveness of
home-based, multi-trigger, multicomponent interventions with an environmental focus on reducing
asthma morbidity: A community guide systemic review. American Journal of Preventive Medicine,
41(2S1), S5-S32.

58
Dixon, S.L., Fowler, C., Harris, J., Moffat, S., Martinez, Y., Walton, H., Ruiz, B. and Jacobs, D.E.
(2008). An examination of interventions to reduce respiratory health and injury hazards in homes of low-
income families. Environmental Research, 109(2009), 123-130.
Dombkowski, K.J., Wasilevich, E.A. and Lyon-Callo, S.K. (2005). Pediatric asthma surveillance using
Medicaid claims. Public Health Reports, 120; 515-524.
Environmental Protection Agency. (2013). Asthma Facts. Indoor Environmental Division Office of Air
and Radiation, EPA-402-F-04-019.
Evans, G. and Kantrowitz, E. (2002). Socioeconomic Status and Health: The Potential Role of
Environmental Risk Exposure, Annual Review of Public Health, 23: 303-31.
Fabian, M. P., Adamkiewicz, G., Stout, N. K., Sandel, M., and Levy, J. I. (2013). A simulation model of
building intervention impacts on indoor environmental quality, pediatric asthma, and costs. J Allergy Clin
Immunol, 133(1), 77-84.
Godard, P., Chanez, P., Siraudin, L, Nicoloyannis, N. and Duru, G. (2002). Costs of asthma are correlated
with severity: a 1-yr prospective study. Eur Respir J, 19; 61-67.
Guo, Y., Jiang, F., Peng, L., Zhang, J., Geng, F., Xu, J., Zhen, C., Shen, X., and Tong, S. (2012) “The
Association between Cold Spells and Pediatric Outpatient Visits for Asthma in Shanghai, China.” (July
25). PLoS ONE 7(7): e42232. doi: 10.1371/journal.pone.0042232
Healthy People 2020 Accessed July 22, 2014;
http://www.healthypeople.gov/2020/about/disparitiesAbout.aspx
Kattan, M., Stearns, S.C., Crain, E.F., Stout, J.W., Gergen, P.J., Evans III, R., Visness, C.M., Gruchalla,
R.S., Morgan, W.J., O’Connor, G.T., Mastin, J.P. and Mitchell, H.E. (2002). Cost-effectiveness of a
home-based environmental intervention for inner-city children with asthma. J Allergy Clin Immun,
116(5), 1058-1063.
Kelly III, William F. (2014). Allergic and Environmental Asthma: Overview of Asthma. Retrieved from
Medscape website http://emedicine.medscape.com/article/137501-overview
Kelly, C.S., Morrow, A.L., Shults, J., Nakas, N., Strope, G.L. and Adelman, R.D. (2000). Outcomes
evaluation of a comprehensive intervention program for asthmatic children enrolled in Medicaid.
Pediatrics, 105;1029-1035. DOI:10.1542/peds.105.5.1029
Krieger, J. (2010). Home is where the triggers are. Pediatric Allergy, Immunology, and Pulmonology,
23(2), 139-145.
Krieger, J., Takaro, T., Song, L. and Weaver, M. (2005). The Seattle-King County healthy homes project:
A randomized, controlled trial of a community health worker intervention to decrease exposure to indoor
environmental asthma triggers. American Journal of Public Health, 95(4), 652-659.
Landrigan, P.J., Schechter, C.B., Lipton, J.M., Fahs, M.C. and Schwartz, J. (2002). Environmental
pollutants and disease in American children: Estimates of morbidity, mortality, and costs for lead
poisoning, asthma, cancer, and developmental disabilities. Environmental Health Perspectives, 110 (7),
721-728.

59
Little, J.C. (2013). Ashes to ashes, dust to dust– how airborne particles affect the fate of SVOCs in the
indoor environment. Environment and Health – Bridging South, North, East and West;
http://www.ehbasel13.org/
Mason, J. and Brown, M.J. (2010). Estimates of costs for housing-related interventions to prevent specific
illness and deaths. J Public Health Management Practice, 16(5) E-Supp, S79-S89.
McGhan, S.L., MacDonald, C., James, D.E., Naidu, P., Wong, E., Sharpe, H., Hessel, P.A. and Befus,
A.D. (2006). Factors associated with poor control in children aged five to 13 years. Can Respir J, 13(1),
23-29.
Medical Expenditure Panel Survey; Agency for Healthcare Research and Quality. U.S. Department of
Health and Human Services. Retrieved from: http://meps.ahrq.gov/mepsweb/
Melillo, J.M., Richmond, T.C., and Yohe, G.W., Eds. (2014). Highlights of Climate Change Impacts in
the United States: The Third National Climate Assessment. U.S. Global Change Research Program, 148
pp.
Mudarri, D. and Fisk, W.J. (2007). Public health and economic impact of dampness and mold. Indoor Air,
17(3).
NRC (2010). Adapting to the Impacts of Climate Change. National Research Council. The National
Academies Press, Washington, DC, USA.
NIEHS. Asthma, Respiratory Allergies and Airway Diseases, and Climate Change. Retrieved July 2015
from: http://www.niehs.nih.gov/research/programs/geh/climatechange/health_impacts/asthma/index.cfm
Norton, R.A. (2015). Green and Healthy Homes Initiative. National Environmental Justice Conference
and Training Program, Washington D.C.
Piecoro, L.T., Potoski, M., Talbert, J.C. and Doherty, D.E. (2001). Asthma prevalence, cost, and
adherence with expert guidelines on the utilization of health care services and costs in a state Medicaid
population. Health Serv Res, 36(2); 357-371.
Reponen, T., Vesper, S., Levin, L., Johansson, E., Ryan, P., Burkle, J., Grinshpun, S., Zheng, S.,
Bernstein, D., Lockey, J., Villareal, M., Khurana-Hershey, G., and LeMasters, G. (2011). High
environmental relative moldiness index during infancy as a predictor of asthma at 7 years of age. Annals
of Allergy, Asthma & Immunology. Volume 107, Issue 2, August, pp.120–126. Retrieved from
http://www.sciencedirect.com/science/article/pii/S1081120611003139
Robert Wood Johnson Foundation Commission to Build a Healthier America. “Beyond Health Care: New
Directions To A Healthier America Report” April 2009.
Rose, E., Hawkins, B., Tonn, B., Conlon, B. and Treitler, I. (2015). Assessing the potential of social
networks as a means for information diffusion– The weatherization experiences (WE) project.
ORNL/TM- 2014/405, Oak Ridge National Laboratory, Oak Ridge, Tennessee.
Rutgers Today (2011). “Can menacing molds affect your allergies and asthma?” (September 8). Accessed
March 2015. http://news.rutgers.edu/news-releases/2011/09/mold-counts-explode-
20110908#.VTqaCyGjO-1

60
Sandel, M., Baeder, A., Bradman, A., Hughes, J., Mitchell, C., Shaughnessy, R., Takaro, T. and Jacobs,
D.E. (2010). Housing interventions and control of health-related chemical agents: A review of the
evidence. Journal of Public Health Management and Practice, 16(5) E-Supp, S24-S33.
Sandel, M. and Wright, R.J. (2006). When home is where the stress is: expanding the dimensions of
housing that influence asthma morbidity. Arch Dis Child, 91:942-948.
Smith, D.H., Malone, D.C., Lawson, K.A., Okamoto, L.J., Battista, C. and Saunders, W. (1997). A
national estimate of the economic costs of asthma. Am J Respir Crit Care Med, 156, 787-793.
Sullivan, S.D., Weiss, K.B., Lynn, H., Mitchell, H., Kattan, M., Gergen, P.J. and Evans, R. (2002). The
cost-effectiveness of an inner-city asthma intervention for children. J Allergy Clin Immunol, 110(4), 576-
581.
Stout, D.M. II, K.D. Bradham, P.P. Egeghy, P.A. Jones, C.W. Croghan, P.A. Ashley, E.
Pinzer, W. Friedman, M.C. Brinkman, M.G. Nishioka, D.C. Cox. 2009. American healthy
homes survey: a national study of residential pesticides measured from floor wipes.
Environmental Science and Technology. 43:4924-4300.
Takaro, T.K., Shu, H., Allen, R.W., Brook, J., McLean, K., Scott, J., Brauer, M., Wheeler, A., Lefebvre,
D., Sathyanarayana, S. and Sears, M.R. (2013). Pregnancy cohort studies: Linking early life exposure to
endocrine disrupting chemicals to children’s health and development. Environment and Health – Bridging
South, North, East and West; http://www.ehbasel13.org/
Takaro, T., Krieger, J.W. and Song, L. (2004). Effect of environmental interventions to reduce exposure
to asthma triggers in homes of low-income children in Seattle. Journal of Exposure Analysis and
Environmental Epidemiology, 14, S133-S143.
Tonn, B., Rose, E., Hawkins, B., and Conlon, B. (2014). Health and Household-Related Benefits
Attributable to the Weatherization Assistance Program. ORNL/TM-2014/345, Oak Ridge National
Laboratory, Oak Ridge, Tennessee.
Tonn, B., Rose, E., and Hawkins, B. (2015). Survey of Recipients of Weatherization Assistance Program
Services: Assessment of Household Budget and Energy Behavior Pre- to Post-Weatherization.
ORNL/TM-2015/64, Oak Ridge National Laboratory, Oak Ridge, TN, March.
Wang, L.Y., Zhong, Y., Wheeler, L. (2005). Direct and indirect costs of asthma in school-age children.
Preventing Chronic Disease. Available from: http://www.cdc.gov/pcd/issues/2005/jan/04_0053.htm.
Weiss, K.B. and Sullivan, S.D. (2001). The health economics of asthma and rhinitis. I. Assessing the
economic impact. J Allergy Clin Immunol, 107(1), 3-8.
Weschler, C. (2013). Indoor environments: Shaped by interplay of human bodies with chemicals of
outdoor and indoor origin. Environment and Health – Bridging South, North, East and West;
http://www.ehbasel13.org/
Wilson, J., Dixon, S.L., Jacobs, D.E., Breysse, J., Akoto, J., Tohn, E., Isaacson, M., Evens, A. and
Hernandez, Y. (2014). Watts-to-wellbeing: does residential energy conservation improve health? Energy
Efficiency, 7:151-160.

61
Woodfine, L., Neal, R.D., Bruce, N., Edwards, R.T., Linck, P., Mullock, L., Nelhans, N., Pasterfield, D.,
Russel, D. and Russell, I., on behalf of the CHARISMA study group. (2011). Enhancing ventilation in
homes of children with asthma: pragmatic randomised controlled trial. British Journal of General
Practice; DOI: 10.3399/bjgp11X606636. e724-e732.
Woods, E.R., Bhaumik, U., Sommer, S.J., Ziniel, S.I., Kessler, A.J., Chan, E., Wilkinson, R.B., Sesma,
M.N., Burack, A.B., Klements, E.M., Queenin, Dickerson, D.U. and Nethersole, S. (2012). Community
asthma initiative: Evaluation of a quality improvement program for comprehensive asthma care.
Pediatrics, 129(3), 465-472.
Wu, F., Jacobs, D., Mitchell, C., Miller, D. and Karol, M.H. (2007). Improving indoor environmental
quality for public health: Impediments and policy recommendations. Environmental Health Perspectives,
115(6), 953-964.
Wu, F. and Takaro, T. (2007). Childhood asthma and environmental interventions. Environmental Health
Perspectives, 115(6), 971-975.
Xu, Z., Huang, C., Hu, W., Turner, L., Su, H., Tong, S. (2013). Extreme temperatures and emergency
department admissions for childhood asthma in Brisbane, Australia. Occupational and Environmental
Medicine, Vol. 70:730-735. doi:10.1136/oemed-2013-10.

APPENDIX A. DATA FORMS SURVEY INSTRUMENTS
COLLECTED DURING INTERVENTION

A-1
APPENDIX A. DATA FORMS AND SURVEY INSTRUMENTS COLLECTED DURING
INTERVENTION
A.1 INFORMED CONSENT FORM FOR WEATHERIZATION PLUS HEALTH STUDY
Researchers:
Chris Miller, Evaluation Project Coordinator, Opportunity Council, 1111 Cornwall Ave.,
Bellingham, WA 98225; (800) 649-5121
Lorena Shaw, Program Manager, Opportunity Council, 1111 Cornwall Ave., Bellingham,
WA 98225; (800) 649-5121
Debbie Paton, Program Director, Opportunity Council, 1111 Cornwall Ave., Bellingham,
WA 98225; (800) 649-5121
Erin Rose, Co-Principal Investigator, Oak Ridge National Laboratory, One Bethel Valley
Rd, PO Box 2008, MS-6038, Oak Ridge, TN 37831; (865) 574-8292
Bruce Tonn, Co-Principal Investigator, Oak Ridge National Laboratory, One Bethel
Valley Rd, PO Box 2008, MS-6038, Oak Ridge, TN 37831; (865) 574-4041
Researcher’s Statement
Why is the research taking place?
The purpose of this research is to study possible changes in asthma after work was done in the
home to reduce asthma triggers. If changes did occur we want to see if there is also a change in
medical costs for treating the asthma.
You can be included in the study because you received services through the Opportunity
Council’s Weatherization Plus Health program and because you still to live in the same home
where the work was completed.
Between 60 and 80 households will participate in the study.
This research is funded through the Department of Energy. It is managed by Oak Ridge
National Laboratory.
What would I be asked to do?
You are being asked to allow the Opportunity Council to return to your home. The staff person
who will visit you will walk through the home to look at the work that had been done. They
will note new changes that might have been made. The staff will ask questions. They will
complete a survey with you while in the home. This visit will take between one and two hours.
Example of survey questions:
Have you ever been told by a doctor or other health professional that you have asthma?

A-2
(1) Yes
(2) No
(3) Don’t Know/Not Sure
(4) Refused
Do you still have asthma?
(1) Yes
(2) No
(3) Don’t Know/Not Sure
(4) Refused
You are being asked to release medical information such as Medicaid for you and children in
your care living in the home if they have asthma. Records will be collected from the Health
Care Authority in your state. This will allow us to look at costs for asthma treatment before
and after the work was done in your home. Records will also be collected from physicians who
treat asthma. We will only be collecting and looking at asthma related health information. If
we do receive medical information along with the asthma information, it will be destroyed if it
is not directly related to asthma.
You are being asked to sign a release of school records for children in the home with asthma.
This will allow us to look at changes in school attendance, grades and use of medical services
during the school day. You may be called after we receive the records if we have questions.
The study will end September 30, 2012.
What are the possible risks and harms if I take part?
As part of the study we will be collecting personal health information. If there is a breach of
confidentiality, the information could be released.
To address the risk for a breach of confidentiality we have a plan to protect the data. Records
will be stored securely. We will also only be collecting asthma health information. No
persons or organizations outside the Opportunity Council will have access to your
information.
If you believe an invasion of privacy or breach of confidentiality has occurred, please contact
the Opportunity Council at 1.800.649.5121.
What are the possible benefits?
This research will help us better understand whether or not reducing asthma triggers in
houses results in medical cost savings. It will also help us better understand whether or not
there is improvement in school attendance or performance. The results could lead to more
funding with more families being served.
What are my choices if I don’t take part?
Study participation is voluntary. You may refuse to participate and can withdraw from the
study at any time. You will not lose any services or benefits you normally receive from the
Opportunity Council.

A-3
Who would see study information about me?
All household members have a right to privacy. Your agreement for us to collect records is
voluntary.
All names, medical and personal information will be protected and kept secure at the
Opportunity Council. Researchers outside of the Opportunity Council will not have access to
personal identifiable information.
Family members will not be identified when the results of the study are published.
School and/or daycare records on nurse visits, medication given during the school day and
absences due to illness will be collected. No information on any person in the study will be
given to the school.
Follow up calls to the physician who treats the asthma may occur if the records collected are
not clear. No personal information collected from other sources will be shared with anyone
outside of the study.
The results from the study will be shared with the client at the end of the study.
Data containing personal information will be destroyed by 9/30/14.
Would I be paid for my time? Will the study cost me anything?
You will receive $200 payment for your participation at the time of the home visit.
This study will not cost you anything.
What else do I need to know?
You are not required to answer all questions or complete all study procedures.
All suspected abuse or neglect of children will be reported to Child Protective Services.
All suspected abuse of dependent adults will be reported to Adult Protective Services.
You may call the investigators toll-free or collect if he/she has any questions about the
research. You can call at 1.800.649.5121.
Investigator Signature
Date
If you agree to participate:
The study described above has been explained to me. By signing below, I voluntarily
consent to participate in this research. I have been told that I can refuse to answer any
question or leave the study at any time, without penalty. I have had a chance to ask
questions. I have been told that I may call the researchers if I have any questions about the
research.

A-4
Subject Signature
Date
Parent/Guardian Signature (if applicable)
Date
Witness/Advocate Signature (if applicable)
Date

A-5
A.2. HOUSING UNIT INFORMATION SURVEY – DF2
OMB Control Number: 1910-5168
Expiration Date: 6/30/2015
Thank you for your prompt response to this data request which is part of the ARRA-
period evaluation of the Weatherization Assistance Program. Evaluation results will
provide essential feedback to the weatherization community and inform policymakers
about the program's effects on clients' energy consumption, cost savings, and non-energy
benefits.
This data form collects detailed information about homes weatherized by your agency in
Program Year 2010. The information you supply will be used with billing history data to better
understand energy savings attributable to the Weatherization Assistance Program under ARRA.
Please use this form (DF2) to provide information about any single family detached and attached
houses, mobile homes, or individual units within multi-family buildings. The Building
Information Survey (DF3) should be used to document information on small or large
multifamily buildings in which the whole building and all units in the building were weatherized
or are waitlisted. Refer to the definitions of each building type provided at the end of the survey
because these definitions are slightly different than those commonly used within the
Weatherization Assistance Program.
All of the information obtained from this survey will be protected and will remain confidential.
The data will be analyzed in such a way that the information provided cannot be associated back
to your state, your agencies, or the housing units and clients that your state served.
Thank you in advance for completing this survey.
Public reporting burden for this collection of information is estimated to average twenty hours
per weatherization agency, including the time for reviewing instructions, searching existing data
sources, gathering and maintaining the data needed, and completing and reviewing the collection
of information. Send comments regarding this burden estimate or any other aspect of this
collection of information, including suggestions for reducing this burden, to Office of the Chief
Information Officer, Records Management Division, IM-11, Paperwork Reduction Project (44
USC 3501-3520), U.S. Department of Energy, 1000 Independence Ave SW, Washington, DC,
20585-1290; and to the Office of Management and Budget (OMB), OIRA, Paperwork Reduction
Project (44 USC 3501-3520), Washington, DC 20503.

A-6
Form completed by: ______________________________ Date: _______________
IDENTIFICATION
[Q1-5 will be pre-completed by the evaluation team]
1. Agency name: ________________________________________
2. State: _______________
3. Agency job number: ____________________
4. Occupant name: ______________________________
5a. Site address: ______________________________ 5b. City: _________________________
WEATHERIZATION INFORMATION Weatherization dates (not audit or inspection dates):
6a. Started: __________ __________ __________
6b. Completed:__________ __________ __________
(month) (day) (year)
7. Was this a “reweatherized” unit? (check only one)
Check “yes” if the home was weatherized prior to PY 2010.
HOUSING UNIT
9. Building type: (check only one)
-family detached house
-family attached house (e.g., side-by-side duplex, townhouse, row house)
-family – unknown whether attached or detached
-4 units per building and not a SF attached house)
10. Number of stories above grade: (check only one)

A-7
Please list the number of stories above ground-level. If there are half-stories, round up to the
nearest whole number. For example, please check “2” for a 1.5-story split-level house.
13. If small or large multifamily building, number of units in the building: (check only one)
-9
-19
-29
-49
-99
14. Year house/building originally built: (check only one)
1960 to 1969
Conditioned floor area at the time of weatherization:
15a. Heated floor area: _________ ft²
Include the basement only if it is intentionally conditioned (heated and/or cooled). If you only
know the total square footage of the home, please select “don’t know” rather than listing the
total square footage.
15c. Does this home have a basement?
s
A basement is a space under the living space of the home that is at least 5 feet tall. It is either
partially or completely under the ground.

A-8
15d. Does this home have a crawl space under any part of the living space of the home?
Yes
A crawl space is a space under the living space of the home that is less than 5 feet tall. It can
be all above ground, partially below ground, or completely below ground.
Exclude a crawl space under a porch, unless the porch is enclosed and used for living space.
15e. Does this home have a concrete slab under any part of the living space of the
home?
Exclude a concrete slab under the garage.
15f. Does this home have any other type of foundation under any part of the living space
of the home?
16. Primary fuel used to heat the unit during the winter before weatherization: (check only one)
____________________)
17. Primary fuel used for water heating before weatherization: (check only one)
18. Type of primary space-heating system before weatherization: (check only one)
-air furnace (forced-air or gravity, any fuel including
electricity)
-in electric units (e.g., electric baseboards, ceiling heat)
floor or baseboard radiators, convectors)

A-9
Select “steam or hot water system” for homes heated with boilers.
19. If small or large multifamily building, was the primary space-heating system shared with
other housing units? (check only one)
20. Supplemental fuel(s) used to heat the unit during the winter before weatherization: (check all
that apply)
21. Type of operable air conditioning system present before weatherization: (check all that
apply)
AUDIT
23. Primary method used to select weatherization measures for this house (excluding health,
safety, and repair measures and general heat waste measures): (check only one)
*FOR THE NEXT TWO SECTIONS, PLEASE “INSTALLED” FIRST, FOLLOWED BY
“INSTALLED BY”
Diagnostic measurement Pre-
weatherization
Post
weatherization
House air leakage (blower door measurement):
32a. Air leakage rate cfm cfm

A-10
32b. House WRT outside pressure difference58
Pa Pa
MEASURES INSTALLED
If you know whether in-house crew or a contractor installed a given measure, please check the
appropriate box in the first two response columns. If a measure was installed but you do not
know whether it was installed by in-house crew or a contractor, please check the box in the
“Installed?” column.
Measure Installed by
In-house
crew
Contractor Installed?
Air sealing work:
36a. General house caulking and
weatherstripping (e.g., doors, windows)
36b. Air sealing emphasizing bypasses (leaks
identified by auditor and/or crew without using a
blower door)
36c. Air sealing emphasizing bypasses (leaks
identified by auditor and/or crew with aid of a blower
door)
36d. Air distribution system (duct) sealing or
repair59
36e. Repairs to broken windows, doors, or other
major holes in the building shell
36f. Other non-window air sealing work
(specify: ______________ )
36g. Other non-window air sealing work
(specify: ______________ )
Measure Installed by
In-house
crew
Contractor Installed?
37a. Attic or ceiling insulation60
If attic insulation was installed, please provide quantity:
37b.____________square feet
or
37c.____________pounds
37d. What was the R value of attic insulation prior to weatherization?
_____ (Leave blank if unknown. Enter 0 if there was no existing insulation.)
37e. Wall insulation
58 Report the pressure differential at which the blower door test was performed. A typical value is 50 Pascals. Do not
report baseline pressure (typically less than 5 Pascals).
. 60 Exclude kneewall insulation, which should be listed under 37o, “other insulation.”

A-11
Measure Installed by
In-house
crew
Contractor Installed?
If wall insulation was installed, please provide quantity:
37f.____________square feet
or
37g. ____________pounds
37h. Floor insulation61
37i. Rim or band joist insulation (sill box)
37j. Foundation wall insulation
37k. Duct insulation
37l. White roof coat applied to mobile home
37m. Mobile home skirting
37n. Mobile home belly insulation
37o. Other insulation (specify:
_____________________________)
37p. Other insulation (specify:
_____________________________)
Windows:
38a. New window (justified because cost
effective)
38b. New window (justified for reason other than
cost effectiveness)
38c. If new windows were installed, please provide quantity: _________
38d. Window glass repair or replacement not
included under air sealing major holes in building shell
(36e)
38e. Repair of window sashes or frames
38f. Window screen repair/replacement
38g. Window lock replacement
38h. Storm window installed
38i. Window shading (e.g., awning, film, sun
screen)
38j. Other window treatments (specify:
______________________ )
38k. Other window treatments (specify:
______________________)
61 Exclude mobile home belly insulation, which should be listed under 37n.

A-12
Measure Installed by
In-house
crew
Contractor Installed?
Doors:
39a. New door (justified because cost effective)
39b. New door (justified for reason other than
cost effectiveness)
39c. Door lock (new or replacement)
39d. Door or door framing repair not included
under air sealing major holes in building shell (36e)
39e. Storm door installed
39f. Other door treatments (specify:
________________________ )
39g. Other door treatments (specify:
________________________ )
Central space heating systems (e.g., furnaces, boilers):62
40a. New heating system (justified because cost
effective)
40b. New heating system (justified for reason
other than cost effectiveness)
40c. Space-heating system repair (e.g., controls,
safety items, flues)
40d. Space-heating system tune-up
40e. New ductwork installed
40f. Vent damper installed
40g. Intermittent ignition device installed
40h. Other heating system modification (specify:
_________ )63
40i. Other heating system modification (specify:
__________ )
Measure Installed by
In-house
crew
Contractor Installed?
Air-conditioning systems:
62 Include central heating systems installed through programs other than WAP, such as emergency heating system
replacements funded by LIHEAP. 63 Check 36d if duct sealing or duct repair was performed. Check 40d if new ductwork was installed. Check 43c if
new vents, grills or registers were installed.

A-13
Measure Installed by
In-house
crew
Contractor Installed?
41a. New air conditioner (justified because cost
effective)
41b. New air conditioner (justified for reason
other than cost effectiveness)
41c. Air conditioner repair
41d. Air conditioner recharge/tune-up
41e. Ceiling or whole-house fans
41f. Other air-conditioning system modification
(specify: ________ )
41g. Other air-conditioning system modification
(specify: ________ )
Ventilation:
42a. New bathroom exhaust fan installed
42b. New kitchen exhaust fan installed
42c. Repair to kitchen or bathroom exhaust fan
(including ductwork)
42d. Whole-house ventilation system
42e. Other ventilation system improvements
(specify: __________)
42f. Other ventilation system improvements
(specify: __________)
HVAC accessories:
43a. New programmable (setback) thermostat
43b. New standard thermostat
43c. New duct vents, grills, or registers
installed64
43d. Standard air filter installed
43e. High efficiency particulate arresting
(HEPA) air filter installed
43f. Other HVAC accessories (specify:
______________________ )
43g. Other HVAC accessories (specify:
______________________ )
64 Check 36d if duct sealing OR duct repair was performed. Check 40d if new ductwork was installed.

A-14
Measure Installed by
In-house
crew
Contractor Installed?
Water-heating system:
44a. New water heater (justified because cost
effective)
44b. New water heater (justified for reason other
than cost effectiveness)
44c. Water-heating system repair
44d. Water-heater tank insulation wrap
44e. Pipe insulation
44f. Installed low-flow showerhead
44g. Installed low-flow device on faucet
(aerator)
44h. Water heater temperature reduction
44i. Other water heating system measure
(specify: ______________ )
44j. Other water heating system measure
(specify: ______________ )
Other baseloads:
45a. Indoor lighting (energy efficient bulb or
fixture)
45b. Outdoor lighting (energy efficient bulb or
fixture)
45c. Lighting (indoor/outdoor location not
recorded)
45d. Refrigerator (justified because cost
effective)
45e. Refrigerator (justified for reason other than
cost effectiveness)
45f. Other baseload measure (specify:
_______________________ )
45g. Other baseload measure (specify:
_______________________ )
Health and safety and repair:
46a. Smoke alarm
46b. CO monitor
46c. Attic ventilation
46d. Clothes dryer vent repair or replacement

A-15
Measure Installed by
In-house
crew
Contractor Installed?
46e. Roof repair
46f. Ceiling repair
46g. Wall repair
46h. Floor repair
46i. Foundation repair
46j. Ground vapor barrier
46k. Gutter or downspout (installed or repaired)
46l. Plumbing repair
46m. Sewer repair
46n. Electrical repair
46o. Stair repair
46p. Install/repair non-skid material on stairs
46q. Install/repair safety gate at stairs
46r. Install/repair grab bar in bathroom
46s. Install/repair non-skid material in bathtub
46t. Install/repair metal chimney liner
46u. Lead abatement
46v. Asbestos abatement
46w. Removal or safe storage of household
poisons
46x. Other health and safety/repair items
(specify: _________ )
46y. Other health and safety/repair items
(specify: ___________ )
Client education:
47a. Did the occupants receive an in-home visit
in which energy education was provided?
47b. Did the occupants participate in a classroom
training in which energy education was provided?

A-16
SERC AND WIPP MEASURES INSTALLED
Please skip Questions 48 through 58 if no SERC or WIPP funds were spent on this home.
48. Please indicate whether any additional measures were installed in this unit that were funded
by the Sustainable Energy Resources for Consumers (SERC) Program and/or Weatherization
Innovation Pilot Program (WIPP).
o SERC-funded measures were installed
o WIPP-funded measures were installed
o Both SERC- and WIPP-funded measures were installed
o The unit was not part of a SERC or WIPP grant (go to Question 61)
Measure Installed by
In-
house
crew
Contract
or
Installe
d?
RENEWABLE ENERGY
49a. S1.1 Solar photovoltaic (PV)
49b. S1.2 PV shingles
49c. S1.3 Wind: small-scale residential
49d. S1.4 Passive solar panel
HOT WATER SYSTEMS
50a. S2.1 Solar hot water
50b. S2.2 Tankless/on-demand hot water
50c. S2.3 Condensing hot water
50d. S2.4 Heat pump/hybrid hot water
50e. S2.5 Combination hot water and boiler
50f. S2.6 Other hot water
(specify)_______________________
HVAC SYSTEMS
51a. S3.1 Heat pumps: geothermal/ground-source
51b. S3.2 Heat pumps: air
51c. S3.3 Heat pumps: mini split system ductless
51d. S3.4 Replacement of improperly sized HVAC
equipment
51e. S3.5 Solar thermal (space heating)
51f. S3.6 Wood pellet stoves
51g. S3.7 Ultra cooling systems
51h. S3.8 Central AC units
Measure Installed by

A-17
In-
house
crew
Contract
or
Installe
d?
51i. S3.11 High-efficiency furnaces
51j. S3.16 Solar powered attic ventilation
51k. S3.17 Energy recovery ventilator (ERV)
ROOFING: COOL ROOF
52a. S4.1 Roofing: Cool roof technology installed
APPLIANCES
53a. S5.1 ENERGY STAR clothes washer
53b. S5.2 Energy-efficient clothes dryer
53c. S5.3 Energy-efficient refrigerator
53d. S5.4 Appliance energy meters
INSULATION
54a. S6.1 Insulation: Aerogel/super
54b. S6.2 Insulation: Foam injection technology
54c. S6.3 Insulation: Masonry foam
54d. S6.4 Insulation: Radiant barrier attic
54e. S6.5 Insulate: Spray foam
54f. S6.6 Insulation: Reflective attic insulation
WHOLE-HOUSE RETROFIT
55a. S7.1 Centralized building controls
55b. S7.2 Deep energy retrofits
55c. S7.3 High-performance space conditioning
retrofits
55d. S7.4 High-performance building envelope
retrofits
55e. S7.5 Cold energy retrofits
55f. S7.6 Warm energy retrofits
55g. S7.7 Foundation improvements
OUTREACH
56a. S8.1 Home Energy Saver workshops
56b. S8.2 Household touched by behavioral change
message
EQUIPMENT
57a. S9.1 Monitoring: In-home energy monitors

A-18
61. If a new space-heating system was installed, indicate the primary fuel used to heat the unit
during the winter after weatherization: (check only one)
62. If a new space-heating system was installed, indicate the type of primary space-heating
system after weatherization: (check only one)
-air furnace (forced-air or gravity, any fuel including
electricity)
-in electric units (e.g., electric baseboards, ceiling heat)
ductless) furnace (e.g., floor or wall furnace)
Select “steam or hot water system” for homes heated with boilers.
COSTS
68. Provide the total cost of weatherizing this housing unit. Include ALL sources of funding. Do
NOT include program management costs (e.g., intake, audits, final inspections or program
administration) or installation-related overhead costs (e.g., vehicles, equipment and training).
Measure Installed by
In-house
crew
Contractor Installed?
OTHER
58a. S10.1 Window upgrades
58b. S10.2 Outdoor solar security lighting
58c. S10.3 Ceiling fans
58d. S10.4 LED lights
58e. S10.5 ENERGY STAR doors

A-19
69. Divide the total costs spent on this housing unit (from Question 68) into the categories
below.
69a. Material costs
69b. Labor costs
69c. Enter total job cost if above categories are not known
69d. Total (should match Q68 total)
70. Divide the labor costs (from Question 69b) into the categories below. If labor costs for in-
house crew are not tracked at the job level please leave 70a blank.
70a. In house crew labor1
70b. Contractor labor
70c. Profit/overhead2
70d. Enter total labor costs if above categories are not
known
70e. Total (should match Q68b total)
1Crew-based labor costs should be based on the crew’s fully loaded hourly rate (rather than the
crew’s take-home pay rate) which may include costs associated with medical and other
insurance, workers compensation, vacations, and other benefits. These labor costs should
include the crew’s time for traveling to and from the job site.
2If contractor profit and overhead are included in the contractor’s material and labor costs, then
leave 70c blank.
71. Provide estimates of non-monetary contributions to this weatherization job.
71a. Volunteer Hours1
71b. Apprentice Hours2
71c. Estimated Value of Material In-Kind Contributions
71d. Estimated Value of Other In-Kind Contributions
1An example of a volunteer is an unpaid person working on weatherizing a Habitat for Humanity Home. 2An example of an apprentice would be a student whose program of education requires hands-on, real-life work on
weatherization jobs.
72. Divide the total costs spent on this housing unit (from Question 68) into the categories
below.
72a. Cost effective energy-related measures (SIR > 1.0)

A-20
72b. Health and safety and other non-cost effective
measures
72c. Incidental repairs
72d. Enter total job cost if above categories are not
known
72e. Total (should match Q68 total)
73. Divide the total costs spent on this housing unit (from Question 68) into these funding source
categories below.
73a. DOE funds (ARRA and formula WAP funds)
73b. DOE SERC Funds
73c. DOE WIPP Funds
73d. Non-DOE (leveraged) funds
73e. Total (should match Q68 total)
Energy Assistance Program (LI-HEAP) funding should be considered Non-DOE funds if it is
tracked separately.
74. Provide the amounts spent on the major measure categories below.
74a. HVAC measures
74b. Water heating measures
74c. Replacement windows and doors
74d. All other building shell measures (insulation, air
sealing, etc.)

A-21
A.3. ASTHMA HOME ENVIRONMENT CHECKLIST (EPA)

A-22

A-23

A-24

A-25

A-26

A-27

A-28
A.4. ASTHMA CONTROL TEST FOR CHILDREN AGE 4 TO 11 YEARS

A-29
A.5. HEALTHY HOMES ACTION PLAN
Name: Date:
My Indoor Air Quality & Energy Conservation Action Plan
Three Steps to Improve your Indoor Air Quality
1.
2.
3.
Three Steps to Improve your Energy Bills
1.
2.
3.
The Opportunity Council Representative has explained what we need to do to make this action
plan work for us. We can call the representative at the Opportunity council if we have any
questions.
Signature: Date:
Educator: Phone:

A-30
A.6. SATISFACTION SURVEY
Strongly Disagree = 1
Disagree = 2
Neither Agree nor Disagree = 3
Agree = 4
Strongly Agree = 5
1. Before participating in the Opportunity Council’s Healthy Homes program I already knew
many ways to reduce asthma triggers in my home.
2. The information provided in the Healthy Homes program increased my desire to reduce
asthma triggers in my home.
3. The information and educational material provided was clear and concise.
4. The information and educational material provided was useful for reducing asthma triggers in
my home.
5. I will be able to easily use many of the methods the Opportunity Council staff provided for
reducing asthma triggers in my home.
6. I do not worry as much or as often about my child’s asthma acting up.
7. My child’s asthma interferes less with my job or work around the house.
8. My child is able to sleep through the night more regularly.
9. I get a full night’s sleep more often.
10. I feel confident my child can take part in normal children’s activities.
11. I understand more ways to reduce asthma triggers in my home.
12. I/We are working on quitting smoking.
13. I make a point of always smoking outside the house or car to reduce my child’s exposure to
2nd hand smoke.
14. I ventilate more often by opening windows and running exhaust fans, etc. to reduce asthma
triggers in my home.
15. I better understand how to prevent and control mold in my home.
16. I can identify the specific things that set off my child’s asthma.
17. I feel like I have better control over my child’s asthma.
What steps were you already taking to reduce asthma triggers in your home before receiving
Healthy Homes services from Opportunity Council? (Check all that apply)

A-31
Yes = -1
No = Missing
18a. Shoes-OFF policy
18b. Ventilate more often
18c. Reduce chemical irritants
18d. Quit smoking
18e. Use dust mite covers
18f. Wash bedding in hot water
18g. Smoke outside only
18h. Improve general cleaning
18i. Fix water leaks
18j. Damp-cloth dusting
18k. Use walk-off mats
18l. Vacuum carpet/furniture regularly
18m. Replace furnace filter
18n. Vacuum out heating vents
18o. Clean mold (using non-toxic cleaner)
18p. Reduce pet triggers
18q. Reduce stuffed animals
18r. Safely store chemicals out of reach
18s. Other____________(string)
18t. Other____________(string)
What changes have you made to further reduce asthma triggers in your home after receiving
Healthy Homes services from Opportunity Council? (Check all that apply)
Yes = -1
No = Missing
19a. Shoes-OFF policy

A-32
19b. Ventilate more often
19c. Reduce chemical irritants
19d. Quit smoking
19e. Use dust mite covers
19f. Wash bedding in hot water
19g. Smoke outside only
19h. Improve general cleaning
19i. Fix water leaks
19j. Damp-cloth dusting
19k. Use walk-off mats
19l. Vacuum carpet/furniture regularly
19m. Replace furnace filter
19n. Vacuum out heating vents
19o. Clean mold (using non-toxic cleaner)
19p. Reduce pet triggers
19q. Reduce stuffed animals
19r. Safely store chemicals out of reach
19s. Other____________(string)
19t. Other____________(string)
20. What did you like most about the Healthy Homes Program?
____________(string)
21. Do you have any suggestions for improving our Healthy Homes program?
____________(string)

A-33
A.7. POLLUTION SOURCE SURVEY
Date:
Assessor:
1) Family members less than 4 or more than 60 yrs
old Yes No
2) Any household members with asthma, respiratory
problems or flu like symptoms? Yes No
3) Is anyone living in the house pregnant? Yes No
How old is the house?
4) Paint peeling or flaking on floors, walls,
ceilings? Yes No
5) Has carpet ever been water soaked? Yes No
6) Is carpet covering a concrete floor? Yes No
7) Any unvented combustion appliances in the
home? Yes No
8) Do household members smoke inside the home? Yes No
9) Do cars park in attached garage? Yes No
10) Seasonal water pooling in crawl space? Yes No
11) Plumbing leaks in crawlspace? Yes No
12) Noticeable leaks or water staining on ceilings or
walls? Yes No
13) Indoor pets?
Yes No
14) Paints, solvents, thinners, pesticides stored in
home? Yes No
15) House keeping problems? Clutter / Unsanitary Yes No
16) Has this house been tested for Radon? Yes No
17) Are Insecticides or rodenticides used in home or
ductwork? Yes No
18) Other
19) Unusual odors in the house? Yes No
20) Is moisture noticeable on windows? Yes No
21) Visible mold anywhere in house? Yes No
22) House temp. unusually warm or cold Yes No
23) Humidity levels unusually high? Yes No

APPENDIX B. SURVEY INSTRUMENTS COLLECTED OVER COURSE
OF STUDY


B-3
APPENDIX B. SURVEY INSTRUMENTS (COLLECTED OVER COURSE OF STUDY)
B.1. OCCUPANT SURVEY
Table of Contents
A. INTRO
B. HEATING & VENTILATION & HOME APPLIANCES
C. HOME CONDITIONS
D. HEALTH CARE & COVERAGE
E. HEALTH & WELL BEING
F. CHEMICAL IRRITANTS, CLEANING AND PETS IN THE HOME
G. EMPLOYMENT / SCHOOL
H. DEMOGRAPHICS
Instructions for interviewer and respondent
Interviewer:
Read each question in its entirety and read all possible answers to respondent before asking for
a response
Respondent
The interviewer may repeat all or part of any question and/or possible answers
You may ask to have any question and/or answered clarified
You may refuse any question
A. INTRO
PLEASE RECORD RESPONDENT’S NAME, GENDER and AGE
Name Gender Age
Main Respondent: __________________________________ _________ ___________
A1. How long have you lived in your current home?
{If less than one year} Enter: _________ months
Enter: _________ years
A2. Including yourself, how many people normally live in this household? Do not include anyone who is
just visiting, those away in the military, or children who are away at college.
Enter Number _______________
A3. Can you please tell me their first names, gender and age, and your relationship to the people in your
household?

B-4
First Name Gender Age Relationship In school (Y/N)
Person 1.
Person 2.
Person 3.
Person 4.
Person 5.
Person 6.
Person 7.
Person 8.
Person 9.
Person 10.
B. HEATING & VENTILATION & HOME APPLIANCES
HEATING
B1. Let’s start with the main source of heating in your home. Please tell me which type of heating
equipment provides most of the heat for your home. Remember to include portable heaters,
fireplaces, heating stoves and cooking stoves.
(1) Central furnace with ducts to individual rooms
(2) Heating stove burning wood, coal, or coke
(3) Fireplace
(4) Built-in electric units in each room installed in walls, ceilings, baseboards, or floors
(5) Heat pump
(6) Portable heaters
(7) Steam/Hot water system with radiators or pipes in each room
(8) Built-in floor/wall pipeless furnace
(9) Built-in room heater burning gas, oil, or kerosene
(10) Cooking stove used to heat your home as well as to cook
(11) Some other equipment (Specify __________________)
(12) Don’t Know/Not Sure
(13) Refused
B2. What is the main fuel used for heating your home? That is, which fuel is the one that provides the
most heat for your home? (1) Electricity
(2) Natural gas from underground pipes
(3) Propane (bottled gas)
(4) Wood
(5) Fuel oil
(6) Kerosene

B-5
(7) Biomass
(8) Solar or Wind
(9) Geothermal
(10) District steam
(11) Some other fuel (Specify __________)
(12) Don’t Know/Not Sure
(13) Refused
B3. You told me that [B2] is the main source of heat in your home. In the past 12 months, did you use
any other types of heating equipment? Remember to include portable heaters, fireplaces, heating stoves and cooking stoves. CHECK ALL THAT APPLY
(1) No other equipment
(2) Central furnace with ducts to individual rooms
(3) Heating stove burning wood, coal, coke, or biomass (such as pellets or corn)
(4) Fireplace
(5) Built-in electric units in each room installed in walls, ceilings, baseboards, or floors
(6) Heat pump
(7) Portable heaters
(8) Steam/Hot water system with radiators or pipes in each room
(9) Built-in floor/wall pipeless furnace
(10) Built-in room heater burning gas, oil, or kerosene
(11) Cooking stove used to heat your home as well as to cook
(12) Some other equipment (Specify __________________)
(13) Don’t Know/Not Sure
(14) Refused
B4. What fuel does the [B3] use? CHECK ALL THAT APPLY
(1) Electricity
(2) Natural gas from underground pipes
(3) Propane (bottled gas)
(4) Fuel oil
(5) Kerosene
(6) Wood
(7) Biomass (wood pellets or corn)
(8) Solar or Wind
(9) Geothermal
(10) District steam
(11) Some other fuel (Specify __________)
(12) Don’t Know/Not Sure
(13) Refused
B5. {IF YES HEATING STOVE OR FIREPLACE}In the past 12 months how often did you have to burn
garbage, cardboard, plastics, foam, colored ink, magazines, boxes, or wrappers to keep warm?
(1) Never
(2) Once
(3) Sometimes
(4) Often
(5) Most of the winter
(6) Don’t Know/Not Sure
(7) Refused
(8) NA

B-6
B6. {IF YES HEATING STOVE OR FIREPLACE}In the past 12 months how often did you have to burn
coated, painted, or pressure-treated wood, driftwood, plywood, particle board, or any wood with glue
in it to keep warm?
(1) Never
(2) Once
(3) Sometimes
(4) Often
(5) Most of the winter
(6) Don’t Know/Not Sure
(7) Refused
(8) NA
B7. {IF YES HEATING STOVE OR FIREPLACE}In the past 12 months how often did you have to burn
wet, rotted, diseased, or moldy wood to keep warm?
(1) Never
(2) Once
(3) Sometimes
(4) Often
(5) Most of the winter
(6) Don’t Know/Not Sure
(7) Refused
(8) NA
B8. Approximately, how often does someone in your household change (or clean) the air filter in your
heating system?
(1) Monthly
(2) Every three months
(3) Every six months
(4) Once a year
(5) Once every two years
(6) Don’t change (or clean) it
(7) Air filter is changed by service company
(8) Don’t Know/Not Sure
(9) Refused
B9. During the winter, what is the temperature set at when someone is inside your home
during the day? [IF NO ANSWER, PROBE 1: THEN AT WHAT TEMPERATURE IS THE
THERMOSTAT SET? PROBE 2: CAN I JUST HAVE YOUR BEST ESTIMATE?]
Enter degrees Fahrenheit________
B10. During the winter, what is the temperature set at when no one is inside your home
during the day? [IF NO ANSWER, PROBE 1: THEN AT WHAT TEMPERATURE IS THE
THERMOSTAT SET? PROBE 2: CAN I JUST HAVE YOUR BEST ESTIMATE?]
Enter degrees Fahrenheit________
B11. During the winter, what is the temperature set at inside your home at night? [IF NO
ANSWER, PROBE 1: THEN AT WHAT TEMPERATURE IS THE THERMOSTAT SET?
PROBE 2: CAN I JUST HAVE YOUR BEST ESTIMATE?]

B-7
Enter degrees Fahrenheit________
B12. Which of the following statements best describes the indoor temperature of your
home during the winter before your home was weatherized?
(1) Very cold
(2) Cold
(3) Comfortable
(4) Hot
(5) Very hot
(6) Other ________________
(7) Refused
B13. Which of the following statements best describes the indoor temperature of your
home during the winter after your home was weatherized?
(1) Very cold
(2) Cold
(3) Comfortable
(4) Hot
(5) Very hot
(6) Other ________________
(7) Refused
KITCHEN
B14. What fuel does the cooking stove and/or oven use? CHECK ALL THAT APPLY
(1) Electricity
(2) Natural gas from underground pipes
(3) Propane (bottled gas)
(4) Fuel oil
(5) Kerosene
(6) Wood
(7) Some other fuel (Specify __________)
(8) No working stove or oven in the home
(9) Don’t Know/Not Sure
(10) Refused

B-8
B15. How often is an exhaust fan that vents to the outside used when cooking in your
kitchen?
(1) Never
(2) Rarely
(3) Sometimes
(4) Often
(5) Every time
(6) Don’t Know/Not Sure
(7) Refused
VENTILATION
B16. How often are your windows open in the summer?
(1) Never
(2) Rarely
(3) Sometimes
(4) Frequently
(5) All the time
(6) Don’t Know/Not Sure
(7) Refused
B17. How often are your windows open in the winter?
(1) Never
(2) Rarely
(3) Sometimes
(4) Frequently
(5) All the time
(6) Don’t Know/Not Sure
(7) Refused
B18. Does your clothes dryer vent directly to the outdoors?
(1) Yes
(2) No
(3) Dryer is ventless
(4) Don’t Know/Not Sure
(5) Refused
B19. Does your main bathroom have a ventilation fan in it that works?
(1) Yes
(2) No (SKIP to B22)
(3) Don’t know/Not Sure (SKIP to B22)
(4) Refused

B-9
B20. How often do you or members of your household operate the fan while showering?
(1) Never
(2) Rarely
(3) Sometimes
(4) Frequently
(5) All the time
(6) Don’t Know/Not Sure
(7) Refused
B21. How long after showering do you or members of your household operate the fan?
(1) Don’t turn the fan on for showers
(2) The fan is turned off when leaving the shower area
(3) 1-5 minutes
(4) 6-15 minutes
(5) 16-30 minutes
(6) 30-60 minutes
(7) More than 1 hour
(8) Don’t know/Not Sure
(9) Refused
B22. In the past 12 months, how many months was a dehumidifier used? (1) None / don’t have dehumidifier (2) 1 to 3 months, (3) 4 to 6 months, (4) 7 to 9 months, (5) 10 to 11 months, but not all year, (6) All year long (7) Don’t Know/Not Sure (8) Refused
C. HOME CONDITIONS
C1. Does your home have a garage that is attached to or part of your home?
(1) Yes
(2) No
(3) Don’t Know/Not Sure
(4) Refused
C2. Do you warm up your vehicle in your garage?
(1) Yes
(2) No
(3) Don’t Know/Not Sure
(4) Refused
C3. Do you see evidence of an infestation of cockroaches or other insects?
(1) Yes
(2) No
(3) Don’t Know/Not Sure
(4) Refused

B-10
C4. If so, how infested is your home with cockroaches or other insects?
(1) Extremely infested
(2) Very infested
(3) Somewhat infested
(4) Hardly infested
(5) Not infested at all
(6) Don’t Know/Not Sure
(7) Refused
C5. What have you done about the cockroaches or other insects?
(1) Nothing
(2) Used insecticides, bug sprays, or poison
(3) Hired an exterminator or other professional
(4) Other, please specify _________
(5) Don’t Know/Not Sure
(6) Refused
C6. Do you see evidence of rats, mice, or other rodents entering any part of your home
(living space, crawl space, attic)?
(1) Yes
(2) No
(3) Don’t Know/Not Sure
(4) Refused
C7. If so, how infested is your home with rats or mice?
(1) Extremely infested
(2) Very infested
(3) Somewhat infested
(4) Hardly infested
(5) Not infested at all
(6) Don’t Know/Not Sure
(7) Refused
C8. What have you done about the rodents?
(1) Nothing
(2) Used bait or poison
(3) Hired an exterminator or other professional
(4) Other, please specify _________
(5) Don’t Know/Not Sure
(6) Refused
C9. Does your home frequently have a mildew odor or musty smell?
(1) Yes
(2) No
(3) Don’t Know/Not Sure
(4) Refused
C10. How often do you observe standing water anywhere in your home?
(1) Never
(2) Rarely

B-11
(3) Sometimes
(4) Often
(5) Always
(6) Don’t Know/Not Sure
(7) Refused
C11. Have you seen mold in your home in the past 12 months?
(1) Yes
(2) No {SKIP to D1}
(3) Don’t Know/Not Sure
(4) Refused
C12. {If YES MOLD}What have you done about the mold?
(1) Nothing
(2) Cleaned with bleach
(3) Cleaned with other chemical mold remover
(4) Cleaned with natural mold remover (vinegar or natural product)
(5) Air Conditioned
(6) Ventilation (fans)
(7) Used a dehumidifier
(8) Contacted a Professional
(9) Other, please specify _________
(10) Don’t Know/Not Sure
(11) Refused
D. HEALTH CARE & COVERAGE
D1. In the past 12 months has your child(ren) with asthma had any kind of health care
coverage, including health insurance, prepaid plans such as HMOs, or government plans
such as Medicaid?
(2) Yes
(3) No
(4) Refused
D2. {IF YES} What type of health insurance does your child(ren) have?
(1) Medicaid (Molina, Healthy Options, CHIP)
(2) S-CHIP
(3) Basic Health
(4) Private individual or group insurance
(5) Don’t Know/Not Sure
(6) Refused
D3. {IF YES COVERAGE}During the past 12 months was there any time that your child(ren)
did not have any health insurance coverage?
(2) Yes
(3) No
(4) Don’t Know/Not Sure
(5) Refused

B-12
D4. What are the name(s) and contact info of your child(ren)’s current health care providers?
1) General Practitioner
Name: __________________________
Address: __________________________
__________________________
Phone: __________________________
2) Asthma/Allergy Specialist
Name: __________________________
Address: __________________________
__________________________
Phone: __________________________
3) Other
Name: __________________________
Address: __________________________
__________________________
Phone: __________________________
4) Other
Name: __________________________
Address: __________________________
__________________________
Phone: __________________________
E. HEALTH & WELL BEING
YOUR HEALTH
READ: Next, I am going to ask you questions about your health.
E1. Have you ever been told by a doctor or other health professional that you have asthma?
(1) Yes
(2) No {SKIP to E7}
(3) Don’t Know/Not Sure
(4) Refused
E2. Do you still have asthma?
(1) Yes
(2) No {SKIP to E7}
(3) Don’t Know/Not Sure
(4) Refused
E3. {IF YES} During the past 12 months, how many times did you see a doctor or health
professional for a routine checkup for your asthma? ______________
READ: Symptoms of asthma include coughing, wheezing, shortness of breath, chest tightness or phlegm
production when you have a cold or respiratory infection.
E4. How long has it been since you last had any symptoms of asthma?

B-13
(1) Never
(2) Less than one day ago
(3) 1-6 Days ago
(4) 1 week to less than 3 months ago
(5) 3 months to less than 1 year ago
(6) 1 year to less than 3 years ago
(7) 3 years to 5 years ago
(8) More than 5 years ago
(9) Don’t Know/Not Sure
(10) Refused
E5. During the past 12 months did you have to stay overnight in the hospital because of
asthma?
(1) Yes
(2) No
(3) Don’t Know/Not Sure
(4) Refused
E6. Not counting hospitalizations, during the past 12 months, did you go to an emergency
room because of asthma?
(1) Yes
(2) No
(3) Don’t Know/Not Sure
(4) Refused
YOUR CHILD(REN)’S HEALTH
READ: Next, I am going to ask you whether your child(ren) have had particular health problems in the
last 3 months. In the past 3 months, has your child(ren) had . . .
E7. Shortness of breath when lying down, waking up, or with light work or light exercise?
(1) Yes
(2) No
(3) Don’t Know/Not Sure
(4) Refused
E8. Headaches that are either new or more frequent or severe than before?
(1) Yes
(2) No
(3) Don’t know
(4) Refused
In the past 12 months has your child(ren) had or been told by a doctor or health professional that they
have…
E9. Lead poisoning
(1) Yes
(2) No
(3) Don’t Know/Not Sure
(4) Refuse
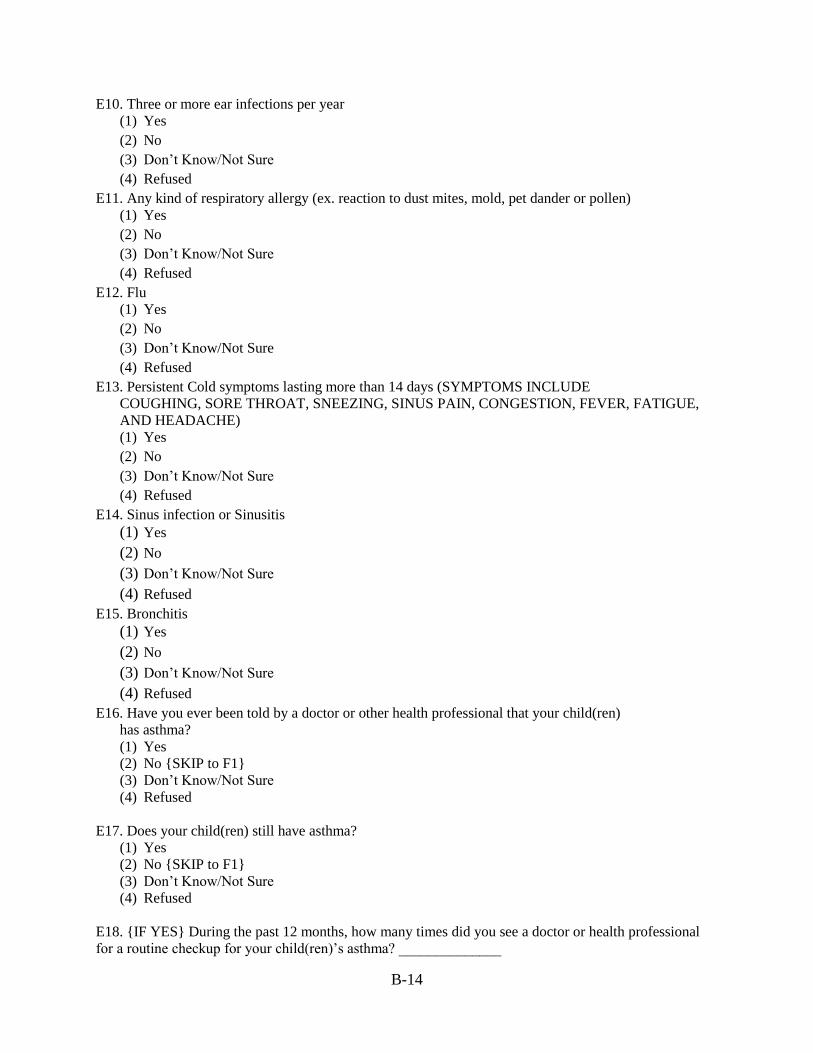
B-14
E10. Three or more ear infections per year
(1) Yes
(2) No
(3) Don’t Know/Not Sure
(4) Refused
E11. Any kind of respiratory allergy (ex. reaction to dust mites, mold, pet dander or pollen)
(1) Yes
(2) No
(3) Don’t Know/Not Sure
(4) Refused
E12. Flu
(1) Yes
(2) No
(3) Don’t Know/Not Sure
(4) Refused
E13. Persistent Cold symptoms lasting more than 14 days (SYMPTOMS INCLUDE
COUGHING, SORE THROAT, SNEEZING, SINUS PAIN, CONGESTION, FEVER, FATIGUE,
AND HEADACHE)
(1) Yes
(2) No
(3) Don’t Know/Not Sure
(4) Refused
E14. Sinus infection or Sinusitis
(1) Yes
(2) No
(3) Don’t Know/Not Sure
(4) Refused
E15. Bronchitis
(1) Yes
(2) No
(3) Don’t Know/Not Sure
(4) Refused
E16. Have you ever been told by a doctor or other health professional that your child(ren)
has asthma?
(1) Yes
(2) No {SKIP to F1}
(3) Don’t Know/Not Sure
(4) Refused
E17. Does your child(ren) still have asthma?
(1) Yes
(2) No {SKIP to F1}
(3) Don’t Know/Not Sure
(4) Refused
E18. {IF YES} During the past 12 months, how many times did you see a doctor or health professional
for a routine checkup for your child(ren)’s asthma? ______________

B-15
READ: Symptoms of asthma include coughing, wheezing, shortness of breath, chest tightness or phlegm
production when you have a cold or respiratory infection.
E19. How long has it been since your child(ren) last had any symptoms of asthma?
(1) Never
(2) Less than one day ago
(3) 1-6 Days ago
(4) 1 week to less than 3 months ago
(5) 3 months to less than 1 year ago
(6) 1 year to less than 3 years ago
(7) 3 years to 5 years ago
(8) More than 5 years ago
(9) Don’t Know/Not Sure
(10) Refused
E20. During the past 12 months did your child(ren) stay overnight in the hospital because
of asthma?
(1) Yes
(2) No
(3) Don’t Know/Not Sure
(4) Refused
E21. Not counting hospitalizations, during the past 12 months, did your child(ren) go to an
emergency room because of asthma?
(1) Yes
(2) No
(3) Don’t Know/Not Sure
(4) Refused
READ: In this section I will be asking about care systems you currently use for your asthmatic child.
E22. Do you have an existing strategy or plan for if your child’s asthma acts up and you’re
not available?
(1) Yes
(2) No
(3) Refused
(4) Don’t Know/Not Sure
E23. Who do you ask for help from if you’re not available when your child’s asthma acts
up? {List as relationship to client}.
1 ______________________________________
2 ______________________________________
3 ______________________________________
4 ______________________________________

B-16
E24. Have you instructed friends, neighbors, and/or family members about what to do if
your child’s asthma acts up?
(1) Yes
(2) No
(3) Refused
(4) Don’t Know/Not Sure
E25. Have you instructed friends, neighbors, and/or family members about what triggers
your child’s asthma so that your child is not exposed to triggers as often?
(1) Yes
(2) No
(3) Refused
(4) Don’t Know/Not Sure
E26. Does your child seem to feel better more of the time since receiving Weatherization
and Healthy Homes services?
(1) Yes
(2) No
(3) Don’t Know/Not Sure
(4) Refused
E27. Since receiving Weatherization and Healthy Homes services is your child able to run
and play longer without resting?
(1) Yes
(2) No
(3) Refused
(4) Don’t Know/Not Sure
E28. In the past 12 months, has anyone in the household been poisoned by breathing in
carbon monoxide, and therefore went to see a medical professional?
(1) Yes
(2) No
(3) Refused
(4) Don’t Know/Not Sure
F. CHEMICAL IRRITANTS, CLEANING IN THE HOME AND PETS
READ: In this section I will be asking questions about chemical irritants in the home, cleaning, and pets
F1. Which one of the following statements best describes the rules about smoking in your
home?
(1) No one is allowed to smoke anywhere inside your home
(2) Smoking is allowed at some places or at sometimes
(3) Smoking is permitted anywhere
(4) Don’t Know/Not Sure
(5) Refused
F2. Are there paints, solvents, thinners or pesticides stored inside the home?
(1) Yes
(2) No
(3) Don’t Know/Not Sure

B-17
(4) Refused
F3. Are there paints, solvents, thinners or pesticides stored under the sink or in a place where children
have easy access?
(1) Yes
(2) No
(3) Don’t Know/Not Sure
(4) Refused
F4. Are there chemical based cleaning supplies stored inside the home?
(1) Yes
(2) No
(3) Don’t Know/Not Sure
(4) Refused
F5. Are there chemical based cleaning supplies stored under the sink or in a place where children have
easy access?
(1) Yes
(2) No
(3) Don’t Know/Not Sure
(4) Refused
F6. Are there natural, non-toxic cleaners present in the home?
(1) Yes
(2) No
(3) Don’t Know/Not Sure
(4) Refused
F7. Before receiving Weatherization and Healthy Homes services, how much of the time did you use
chemical based cleaning supplies, chemical air fresheners, perfumes, scented candles or insecticide in
your home compared to a safer, more asthma-friendly alternative?
{PROBE: scented laundry products, chemical air fresheners, chemical-based cleaners, perfumes, scented
candles, insecticides, etc.}
(1) All of the time
(2) Most of the time
(3) Some of the time
(4) A little of the time
(5) Never
(6) Don’t Know/Not Sure
(7) Refused
F8. After receiving Weatherization and Healthy Homes services, how much of the time did you use
chemical based cleaning supplies, chemical air fresheners, perfumes, scented candles or insecticide in
your home compared to a safer, more asthma-friendly alternative?
{PROBE: scented laundry products, chemical air fresheners, chemical-based cleaners, perfumes, scented
candles, insecticides, etc.}
(1) All of the time
(2) Most of the time
(3) Some of the time
(4) A little of the time
(5) Never

B-18
(6) Don’t Know/Not Sure
(7) Refused
F9. Do you own a HEPA vacuum?
(1) Yes
(2) No
(3) Don’t Know/Not Sure
(4) Refused
F10. Do you clean and vacuum more often since receiving Weatherization and Healthy
Homes services?
(1) Yes
(2) No
(3) Don’t Know/Not Sure
(4) Refused
PETS
F11. Do you have pets?
(1) Yes
(2) No
(3) Don’t Know/Not Sure
(4) Refused
F12. Are pets allowed in the home?
(1) Yes
(2) No
(3) Don’t Know/Not Sure
(4) Refused
F13. Are pets permitted on furniture?
(1) Yes
(2) No
(3) Don’t Know/Not Sure
(4) Refused
F14. Are pets restricted to common areas?
(1) Yes
(2) No
(3) Don’t Know/Not Sure
(4) Refused

B-19
G. EMPLOYMENT/SCHOOL
G1. Are you or other adults in the household currently…?
(1) Employed outside the home
(2) Self-employed outside the home
(3) Out of work for more than 1 year (SKIP to G4)
(4) Out of work for less than 1 year
(5) A Homemaker (SKIP to G4)
(6) A Student
(7) Retired (SKIP to G4)
(8) Unable to work (SKIP to G4)
(9) Refused
G2. {IF ASWERED (1) or (2) or (4) or (6) TO G1}In the past 12 months, about how many
days of work or school did you or another adult in the home miss because of asthma
related symptoms of your child?
(1) Enter Number________days
(2)None
(3) Don’t Know/Not Sure
(4) Refused
G3. Does your child(ren) attend school (including pre-school or daycare)?
(1) Yes
(2) No
(3) Refused
1) School Information
Name of School: __________________________
Grade: __________________________
Primary contact for asthma related issues: __________________________
Phone: __________________________
2) School Information
Name of School: __________________________
Grade: __________________________
Primary contact for asthma related issues: __________________________
Phone: __________________________

B-20
G4. In the past 12 months, about how many days of school (including pre-school or
daycare) has your child(ren) missed because of asthma-related symptoms?
(1) Enter Number:_________ days
(2) Not in School
(3) Don’t Know/Not Sure
(4) Refused
H. DEMOGRAPHICS
READ: In this section I will be asking demographics questions.
H1. Are you currently…?
(1) Married
(2) Divorced
(3) Widowed
(4) Separated
(5) Never married
(6) A member of an unmarried couple
(7) Refused
H2. Which best describes your ethnicity?
(1) Hispanic
(2) Non-Hispanic
(3) Refused
H3. Which best describes your race?
(1) White
(2) Black or African-American
(3) American Indian or Alaska Native
(4) Asian
(5) Native Hawaiian or Other Pacific Islander
(6) Other (if volunteered)
(7) Refused
H4. Do you rent or own your current residence?
(1) Rent
(2) Own
(3) Neither (Please describe the housing agreement)
(4) Refused
H5. Which of the following best describes the location of your home? Do you live in a city, a
town, the suburbs, or in a rural area?
(1) City
(2) Town
(3) Suburbs
(4) Rural
(5) Don’t Know/Not Sure
(6) Refused

B-21
H6. What is the age of your home? (approximation is acceptable if exact age unknown).
Enter age:
H7. What kind of home do you live in?
(1) Apartment
(2) Mobile / manufactured home
(3) Duplex
(4) Triplex
(5) Single family home
(6) Other
(7) Refused
Notes: ________________________________________________________________________________________________________________________________________________________________________________________________________________________________________________________________________________________________________________________________________________________________________________________________________________________________________________________________________________________________________________________________________________________________________________________________________________________________________________________________________________________________________________________________________________________________________________________________________________________________________________________________________________________________________________________________________________________________________________________________________________________________________________________________________________________________________________________________________________________________________________________________________________________________________________________________________________________________________________________________________________________________________________________________________________________________________________________________________________________________________________________________________________________________________________________________________________________________________________________________________________________________________________________________________________________________________________________________________________________________________________________________________________________________________________________________________________________________________________________________________________________________________________________________________________________________________________________________________________________________________________________________________________________________________________________________________________________________________________________________________________________________________________________________________________________________________________________________________________________________________________________________________________________________________________________________________________________________________________________________________________________________________________________________________________________________________________________________________________________________________________________________________________________________________________________________________________________________________________________________

B-22
B.2. WALK THROUGH CHECKLIST (WEATHERIZATION PLUS HEALTH)
General Exterior
1. Is there water pooled in the crawl space?
a. Yes
b. No
c. Crawl space not present
d. N/A, Unknown
2. Is there a vapor barrier present?
a. Yes
b. No
c. N/A, Unknown
3. Are there plumbing leaks in the crawl space?
a. Yes
b. No
c. N/A, Unknown
General Interior
4. What type of flooring does the living room have?
a. Hard Surface with 0-2 area rugs
b. Hard Surface with 3+ area rugs
c. Carpet
d. N/A, Unknown
5. Is there noticeable evidence of water damage, moisture or leaks on walls or ceiling?
a. Yes
b. No
c. N/A, Unknown
6. Is moisture noticeable on the windows?
a. Yes
b. No
c. N/A, Unknown
7. What is the relative humidity level in the main living area?
a. 30%-50%
b. 50%-60%
c. 60%-80%
d. 80%+
e. N/A, Unknown
8. Is there evidence of extra sources of moisture in the home? (fish tank(s), dripping
faucets, excessive # of houseplants, use of humidifiers, etc.)
a. Yes
b. No
c. N/A, Unknown
9. Is mold visible anywhere in the home?
a. Yes
b. No
c. N/A, Unknown
10. Is there evidence of paint peeling or flaking on floors, walls, or ceilings?
a. Yes
b. No
c. N/A, Unknown

B-23
Heating Systems
11. Does the heating and cooling system use filters?
a. Yes
b. No
c. N/A, Unknown
12. Does the filter exhibit evidence of having been cleaned or replaced in the last six
months?
a. Yes
b. No
c. N/A, Unknown
13. Does the heating source use a combustion fuel?
a. Yes
b. No
c. N/A, Unknown
14. Is the heating unit properly vented to the outside?
a. Yes
b. No
c. N/A, Unknown
Child’s Bedroom #1 (or main room child sleeps in)
15. What type of flooring does the child’s bedroom have?
a. Hard Surface with 0-2 area rugs
b. Hard Surface with 3+ area rugs
c. Carpet
d. N/A, Unknown
16. Is there an allergy mattress cover in use?
a. Yes
b. No
c. N/A, Unknown
17. Are there allergy pillow covers in use?
a. Yes
b. No
c. N/A, Unknown
18. Are there stuffed animals on the bed?
a. Yes
b. No
c. N/A, Unknown
19. If yes, how many?
a. 1-3
b. 3-5
c. 5 or more
d. N/A, Unknown
Child’s Bedroom #2 (or main room child sleeps in)
20. What type of flooring does the child’s bedroom have?
a. Hard Surface with 0-2 area rugs
b. Hard Surface with 3+ area rugs
c. Carpet
d. N/A, Unknown
21. Is there an allergy mattress cover in use?

B-24
a. Yes
b. No
c. N/A, Unknown
22. Are there allergy pillow covers in use?
a. Yes
b. No
c. N/A, Unknown
23. Are there stuffed animals on the bed?
a. Yes
b. No
c. N/A, Unknown
24. If yes, how many?
a. 1-3
b. 3-5
c. 5 or more
d. N/A, Unknown
Kitchen
25. Are gas cooking appliances used?
a. Yes
b. No
c. N/A, Unknown
26. Is there an exhaust fan on the range that vents to the outside?
a. Yes
b. No
c. N/A, Unknown
27. If yes, does it appear to work (pull minimum of ~25 cfm)?
a. Yes
b. No
c. N/A, Unknown
Bathroom
28. Is there an exhaust fan in main bathroom?
a. Yes
b. No
c. N/A, Unknown
29. What is the approximate CFM of the fan?
a. 0-25 cfm
b. 25-50 cfm
c. 50+ cfm
d. N/A, Unknown
Laundry Area
30. Is laundry area excessively humid (60%+ RH)?
a. Yes
b. No
c. N/A, Unknown
31. Is dryer properly vented to outside?
a. Yes
b. No
c. N/A, Unknown

B-25
32. Is dryer vent kinked/smashed/excessively twisted/damaged?
a. Yes
b. No
c. N/A, Unknown
Pets
33. Is there evidence of pets present in the home?
a. Yes
b. No
c. N/A, Unknown
34. Is there pet fur or dander visible on the furniture?
a. Yes
b. No
c. N/A, Unknown
35. Is there evidence of pet hair or dander in child(ren)’s room?
a. Yes
b. No
c. N/A, Unknown
Chemical Storage & Cleaning Supplies
36. Are there unusual smells in the home?
a. Yes
b. No
c. N/A, Unknown
37. Are there paints, solvents, thinners or pesticides stored in visible locations?
a. Yes
b. No
c. N/A, Unknown
38. Are there chemical based cleaning supplies stored visible locations?
a. Yes
b. No
c. N/A, Unknown
39. Are there natural, non-toxic cleaners present in the home?
a. Yes
b. No
c. N/A, Unknown
Rodents and Insects
40. Is there evidence of rodents in the home, attic, or crawlspace?
a. Yes
b. No
c. N/A, Unknown
41. Are rodentcides in use in the home or ductwork?
a. Yes
b. No
c. N/A, Unknown
42. Is there evidence of insect infestation in the home?
a. Yes
b. No
c. N/A, Unknown

B-26
43. Are insecticides in use in the home or ductwork?
a. Yes
b. No
c. N/A, Unknown
Housekeeping
44. Is there a HEPA vacuum present?
a. Yes
b. No
c. N/A, Unknown
45. On a scale of 1-5, how cluttered is the home?
1 = All Surfaces Clear
2 = Most Surfaces Clear
3 = Some Surfaces Clear
4 = Most Surfaces Cluttered
5 = All Surfaces Cluttered
46. Are there open food items and/or crumbs visible in the kitchen or living areas?
a. Yes
b. No
c. N/A, Unknown
47. Is there evidence of doorway walk-off mats used?
a. Yes
b. No
c. N/A, Unknown
48. Is there evidence that household members adhere to a “shoes-off” policy?
a. Yes
b. No
c. N/A, Unknown
49. Is there evidence of weekly dusting in the home?
a. Yes
b. No
c. N/A, Unknown
Smoking
50. Do any household members smoke?
a. Yes
b. No
c. N/A, Unknown
51. Is there evidence of smoking inside the home?
a. Yes
b. No
c. N/A, Unknown


APPENDIX C. WASHINGTON STATE INSTITUTIONAL REVIEW
BOARD APPLICATION


C-3
APPENDIX C. WASHINGTON STATE INSTITUTIONAL REVIEW BOARD
APPLICATION
Washington State Institutional Review Board (WSIRB)
Application Instructions
Please call and discuss your study plans prior to completing this application in order to
prevent avoidable delays or misunderstandings in the review of your application. You
may contact us at 360.902.8075 or at [email protected].
Prior to submitting this application, investigators who are requesting identifiable
records from DSHS, DOH, L&I, and/or HCA should contact the Washington State
agency data manager(s) to: 1) ascertain the feasibility of obtaining the desired
dataset(s); and 2) to secure the Washington State agency data manager willingness to
support the request (note that this approval does not authorize disclosure of the
records). Applications that qualify for expedited review do not require signatures for initial
review; however, investigators must still contact the Washington State agency data manager
as instructed above.
Complete all applicable sections. All information requested in the application must be
included in the application submitted for review. Do not respond to sections in the
application by referring to other documents attached to the application.
Investigators and all research staff who will have contact with human subjects and/or access
to identifiable personal records must complete appropriate training in the protection of
human subjects. Public Health Service-funded (NIH, CDC, SAMSA, AHRQ, IHS, HRSA)
investigators and research staff must also complete financial conflicts of interest training.
Study approval will not be extended until documentation of all required training has been
provided. Visit our website for information on this training requirement.
Consult the Washington State Agency Policy on Protection of Human Research Subjects for
guidance on whether your proposal requires full Institutional Review Board (IRB) review or
may qualify for expedited review. Additional information about procedures is found in the
Washington State Institutional Review Board Procedures Manual. If you have questions,
contact the Human Research Review Section.
Expedited Review: Applications that qualify for expedited review may be submitted at any
time and generally will be reviewed within two weeks of receipt. Submit an electronic copy of
the proposal to [email protected]. Signatures are not needed for the initial review.
Full IRB Review: Applications that require full Board review are pre-reviewed before they are
placed on a meeting agenda. Submit an electronic copy of the proposal to [email protected]

C-4
no later than the application deadline on the Calendar of Review Board Meetings. A Summary
of Pre-Review Issues will generally be sent to investigators about a week after the application
deadline. Investigators will have one week to make revisions in response to pre-review
comments and then submit a revised electronic application and sufficient copies for full
committee review. Signatures are not needed for pre-review.
Signed original and copies: All initial reviews are conducted with an electronic application.
After the initial review, investigators will be instructed to submit a signed original and the
number of copies required for the final review.
Send paper copies of application to:
(Please submit loose double-sided
sheets, collated, with rubber bands)
Department of Social and Health Services
Human Research Review Section
1115 Washington Street SE
PO Box 45205
Olympia WA 98504-5205
360.902.8075

C-5
Definitions
The following definitions apply to terms used in this application:
"Child" means a person who has not attained the legal age for consent to treatments or
procedures involved in the research, under the applicable law of the jurisdiction in which the
research will be conducted.
"De-identified records" mean that all direct and indirect identifiers have been removed from
individual-level records. De-identified records are not considered PHI or identifiable personal
information. Public use datasets are comprised of de-identified records.
"Direct identifiers" in data or records include names; postal address information; telephone
numbers; fax numbers; electronic mail addresses; social security numbers; medical record
numbers; health plan beneficiary numbers; account numbers; certificate/license numbers; vehicle
identifiers and serial numbers, including license plate numbers; device identifiers and serial
numbers; web universal resource locators (URLs); internet protocol (IP) address numbers;
biometric identifiers, including finger and voice prints; full face photographic images and any
comparable images; and any other unique identifying number, characteristic, or code.
"Human subject" means a living individual about whom an investigator (whether professional
or student) conducting research obtains (1) Data through intervention or interaction with the
individual, or (2) Identifiable private information.
"Identifiable" data or records contain information that reveals or can likely be associated with
the identity of the person or persons to whom the data or records pertain. Data or records with
direct identifiers removed, but which retain indirect identifiers, are considered identifiable.
"Indirect identifiers" in data or records include geographic identifiers smaller than a State
(city, county, and zip code, and their equivalent geocodes, except for the initial three digits of a
zip code); all elements of dates (except year) for dates directly related to an individual, including
birth date, admission date, discharge date, date of death; and all ages over 89 and all elements of
dates (including year) indicative of such age, except that such age and elements may be
aggregated into a single category of age 90 or older.
"Minimal Risk" means that the probability and magnitude of harm or discomfort anticipated in
the research are not greater in and of themselves than those ordinarily encountered in daily life
or during the performance of routine physical or psychological examinations or tests.
"Minimum Necessary" means that the agency disclosing the protected health information or
identifiable personal records must make reasonable efforts to limit the disclosure to the
minimum necessary to accomplish the intended purpose of the use, disclosure, or request.
"Non-identified records" means that all direct identifiers have been removed from individual-
level records, but the records may include dates related to an individual and geographic
identifiers smaller than a State. Non-identified health records are considered protected health
information and are identifiable. Limited datasets are comprised of non-identified records.
"Protected Health Information (PHI)" means individually identifiable health information
created or received by a health care provider, health plan, or health care clearinghouse that is

C-6
transmitted or maintained in any form or medium.
Abbreviations
DSHS Washington State Department of Social and Health Services
DOH Washington State Department of Health
L&I Washington State Department of Labor and Industries
HCA Washington State Health Care Authority

C-7
Washington State Institutional Review Board (WSIRB)
Application for WSIRB Review
1. Project Identification WSIRB USE ONLY
1.1 Project Title Weatherization Plus Health Study
1.2 Principal Investigator
NAME
Bruce Tonn
HIGHEST DEGREE(S) EARNED
Doctorate
AGENCY OR ORGANIZATION NAME (AGENCY, UNIVERSITY, PROFESSIONAL
ORGANIZATION, COMMERCIAL RESEARCH FIRM, ETC.)
Oak Ridge National Laboratory
COMPLETE MAILING ADDRESS
One Bethel Valley Rd, PO Box 2008, MS-6038
CITY STATE
ZIP CODE
Oak Ridge TN
37831
OFFICE PHONE
NUMBER
(865) 574-4041
ALTERNATE
PHONE NUMBER
(865) 574-8292
EMAIL ADDRESS

C-8
1.3 Research Abstract. Provide a brief summary of the research purpose and methods.
Please limit to this page.
This project will estimate potential Medicaid cost savings benefits of the Opportunity
Council’s (Bellingham, WA) Weatherization Plus Health Program. This Program serves
low-income households that report having minor children with asthma. The Program
installs a comprehensive range of energy efficiency measures (funded by the U.S.
Department of Energy) and measures designed to reduce asthma triggers (funded by a
private donor).The literature indicates that the interventions adopted by the Program
should result in reductions in asthma symptoms and episodes. The goal of this study is to
determine if there are Medicaid cost savings attributable to the Program and if these
savings are synergistic (i.e., that the savings attributable to the Program are more than
savings that would have occurred from the installation of energy efficiency measures and
asthma reduction measures separately). The project will contact households enrolled in the
Program (approximately 35) and a similar number of control group homes located in a
nearby community that only received energy efficiency measures. The project will be
clearly explained to each household head. Each adult member of the household will be
asked to sign an authorization for the disclosure of Medicaid records for themselves if they
are an adult with asthma or as the legal guardian for a minor(s) in the home with asthma.
Medicaid records related to asthma treatment will be collected going back one year before
any energy efficiency and asthma trigger reduction measures were installed in the home to
the present time. These records will indicate changes in the consumption of direct medical
expenditures related to asthma including hospitalizations, emergency care, physicians’
visits, prescription medications and equipment costs. Statistical methods will be applied to
estimate the impacts of the Program on changes in asthma-related medical costs.
1.4 Anticipated Start Date: 11/01/2012 Anticipated End Date: 12/30/2013
1.5 Training
Principal investigators, co-investigators, and all research staff who will have contact with human
subjects and/or access to identifiable personal records must complete training in human subject
protections every three years. A certificate of completion should be attached to each CV.
HIPAA, Good Clinical Practice, or Responsible Conduct of Research training is not accepted in
lieu of human subject protections training.
Name of most recent human subjects protection training: Date
completed: 10/30/2012
Protecting Human Research Training; NIH Office of Extramural Research
Principal investigators who are not employees of DSHS, DOH, L&I, or HCA must complete and
sign Appendix E: Unaffiliated Investigator Agreement, and submit it with the signed original
application.
As Principal Investigator, I acknowledge that I am responsible for the submission of this
application. I have fully reviewed the application forms and instructions and believe this

C-9
application is complete and accurate. I affirm that, if approved, this research will be conducted
in compliance with WSIRB-approved procedures and requirements.
SIGNATURE DATE
1.6 Supervisor of Principal Investigator
NAME
Joel Eisenberg
TITLE
Research and Development Program
Manager, Energy and Transportation
Science Division
AGENCY OR ORGANIZATION NAME (AGENCY, UNIVERSITY, PROFESSIONAL
ORGANIZATION, COMMERCIAL RESEARCH FIRM, ETC.)
Oak Ridge National Laboratory
SIGNATURE
DAT
E
EMAIL ADDRESS
1.7 Co-Investigator (if any)
NAME
Erin Rose
HIGHEST DEGREE(S)
EARNED
MSSW
AGENCY OR ORGANIZATION NAME (AGENCY, UNIVERSITY, PROFESSIONAL
ORGANIZATION, COMMERCIAL RESEARCH FIRM, ETC.)
Oak Ridge National Laboratory
COMPLETE MAILING ADDRESS
One Bethel Valley Rd, PO Box 2008, MS-6038
CITY STATE
ZIP CODE
Oak Ridge TN
37831
OFFICE PHONE ALTERNATE EMAIL ADDRESS

C-10
NUMBER
(865) 574-8292
PHONE NUMBER
(865) 567-3822
Name of most recent human subjects protection training: Date
completed: 8/23/12
Protecting Human Research Training; NIH Office of Extramural Research
1.8 Other Research Staff: List all other research staff who will have contact with human
subjects or access to identifiable personal records in Appendix A. Attach CVs or resumes for all
research staff, including the PI and Co-PI, along with a certificate of completion of human
subjects training and financial conflicts of interest training, as applicable, to Appendix A. CVs
or resumes should not exceed five (5) pages per person.
1.9 Student Research. Applications submitted by students must also be approved by their
academic advisor or chair of their committee.
NAME OF CHAIR OR ACADEMIC ADVISOR
HIGHEST DEGREE(S)
EARNED
COLLEGE OR UNIVERSITY
COMPLETE MAILING ADDRESS
CITY STATE
ZIP CODE
OFFICE PHONE
NUMBER
ALTERNATE PHONE
NUMBER
EMAIL ADDRESS
As Academic Advisor/Committee Chair to the Student Investigator, I will provide
oversight for this research. I have read and approved the research design and methods.
SIGNATURE OF ADVISOR/COMMITTEE CHAIR DATE

C-11
1.10 Person preparing this document (if other than PI)
NAME
Erin Rose
HIGHEST
DEGREE(S)
EARNED
MSSW
EMAIL ADDRESS
ROLE IN PROJECT
Co-PI
PHONE NUMBER
(865) 574-8292
2. Funding
2.1 Is this research funded by a grant, contract, cooperative agreement, or other award?
No. Explain how costs of the proposed research will be supported:
Yes. Identify the agency or organization that received the award:
Oak Ridge National Laboratory has a contract with the US Department of Energy to
conduct a comprehensive national evaluation of the Weatherization Assistance Program.
This national evaluation is comprised of a multitude of studies and tasks attempting to
achieve both energy and non-energy impacts. This study is supported through this
contract. It is not a grant and there are no comments from the funding source.
TYPE OF FUNDING SOURCE(S)
Federal – HHS Federal – other State, local government Private
foundation
Other (describe):
FUNDING AGENCY(S) NAME
US Department of Energy
CONTACT NAME
Jennifer Somers
COMPLETE MAILING ADDRESS
Office of Weatherization and Intergovernmental Program
U.S. Department of Energy
Energy Efficiency and Renewable Energy
1000 Independence Ave, SW, Mail Stop EE-2K

C-12
CITY STATE ZIP
CODE
Washington, DC DC
20585
PHONE NUMBER
(202) 287-1740
EMAIL ADDRESS
If this project is funded by an external agency and DSHS, DOH, L&I, or HCA is the grantee,
attach a copy (double-sided) of the grant narrative to Appendix M.
2.2 Research budget total: $200,000 Start Date 3/8/12 End Date 12/30/2013
2.3 List the major budget categories and dollar totals for each category. If this is a multi-
site study, include only the amount of the budget allocated to the study site described in this
application.
Study Design and Development of Instruments; $35,000
Data Collection; $45,000
Participant Incentive; $14,000
Data Analysis and Report Writing; $92,000
Indirect; $14,000
3. Conflict of Interest
Conflicts of interest can include financial and non-financial interests. All individuals involved
in the research that have responsibilities in the design, conduct, or reporting of the
research (including consultants and student research staff) must complete and submit a
copy of Appendix N: Conflict of Interest Reporting.
4. Requests for State Agency Records Information and/or Staff Resources
If the research requires record information or resource contributions from DSHS, DOH, L&I, or
HCA, you must discuss your plans with the data manager or administrator responsible for
the records or resources requested before preparing this application. Complete and submit
Appendix G and/or Appendix H to each data manager or administrator and obtain his/her
signature(s) on the form to document their support for the research request. If identifiable DSHS
and/or DOH records will be used or disclosed in electronic form, complete and submit
Appendix J with your application.

C-13
4.1 Does the research require use and/or disclosure of identifiable records or Protected
Health Information (PHI) from DSHS, DOH, L&I, or HCA?
No; if no, skip to item 4.3.
Yes; complete Appendix G: Requests for Use or Disclosure of Records. However,
if the research is funded or conducted by the agency from which records are requested,
Appendix G is not necessary.
4.2 Will the identifiable records from DSHS, DOH and/or HCA be accessed or disclosed
in electronic form?
No
Yes; complete Appendix J: Electronic Data Security Plan only if any of the
research will be conducted outside of the State agency secure network.
4.3 Does the research require other resources from DSHS, DOH, L&I, or HCA (e.g.,
professional consultation, clerical services, facilities/equipment, and assistance in identifying
/contacting subjects)?
No
Yes; complete Appendix H: Resource Requests. However, if the research is funded
or conducted by the agency from which records are requested, Appendix H is not necessary.
5. Study Description
Use lay language that can be understood by a person who is not familiar with your area of
expertise. Do not refer to, or copy and paste from, a grant application or from the Research
Abstract in Section 1.3 of this application.
5.1 Purpose and Conceptual Rationale
Describe the background and significance of this research. The Department of Energy's
Weatherization Assistance Program (WAP) serves households of low socioeconomic status
in attempts to achieve energy efficiency through home energy retrofit and energy
consumption education. The mission of WAP also involves addressing health and safety
concerns as they relate to home energy. Households must be income eligible for the
Program at 200% federal poverty level. It is the assumption that many of the households
served by the Program also receive Medicaid or health care assistance. Currently, very few
WAP agencies go beyond the required standard health and safety measures per DOE's
WAP regulations notice. The Opportunity Council is a leader in the field of
Weatherization Plus Health targeting asthma reduction measures in households with
caregivers who have self-reported that children with asthma reside in the home. Medicaid
records will be collected from the Washington State Health Care Authority to measure
potential changes in costs related to asthma symptoms and episodes. This transfer of data
involves the Opporunity Council requesting and receiving auhorizations for the disclosure

C-14
of Medicaid records from both treatment and comparisons groups, submitting the
authorization forms to the Health Care Authority through a secure file transfer protocol
and receiving asthma specific Medicaid records back from the Health Care Authority
using the same secure file transfer protocol. The Opportunity Council has been tasked with
this data collection effort and then with entering the data into a database for future
analysis by Oak Ridge National Laboratory. The dataset will be de-identified of PII prior
to ORNL reviewing the data. This is to reduce the risk of breach of confidentiality by
limiting the number of times the PII is transferred and by the number of persons with
access to the data. Records will be requested that have asthma related Medicaid cost codes
from the time of the request back to January 2008. The miniumum data elements will be
requested. If the research suggests a relationship between weatherization plus health
measures and a decrease in direct medical expenditures related to asthma as evidenced
through the disclosure of records, the argument for funding these Programs can continue
to be made and the pool of stakeholders can expand offering this vulnerable population of
low-socioeconomic status opportunities to more effectively manage asthma by reducing
environmental exposure to triggers.
Specify the questions this research will attempt to address. The research will seek to answer
the following questions: 1. Does the Opportunity Council's Weatherization Plus Health
program result in decreased direct medical expenditures related to asthma treatment? 2.
Do the direct medical expenditures also correlate with self-reported and caregiver reported
improvement in health related asthma symptoms and episodes? 3. Does the level of impact
on direct medical expenditures correlate with specific weatherization or asthma reduction
measures provided through Weatherization Plus Health? 4. By linking the Medicaid or
health care assistance records and school attendance, academic and nursing care records is
a relationship observed between the Weatherization Plus Health program, asthma episodes
and treatment needs, and school attendance and on-site care? 5. If a relationship is
observed, what are the cost savings related to the decrease in direct medical expenditures,
increased school attendance, performance, and on-site care, and caregiver productivity?
How do the physicians attribute change in asthma status and episodes per phsycian
records and report? Are there any adults in the household that self-report a change in
asthma conditions as a benefit for treating the home for the children?
Include a brief summary of the pertinent literature with full citations, if applicable.
Significant literature exists on the costs to families with asthma and the benefits of
household improvements on asthma symptoms and frequency of episodes (Breysse, et al.
2002; Wu & Takaro 2007; Jacobs, et al. 2007). Asthma is the most chronic pediatric
disease in the US affecting 9.5 percent of children while disproportionately affecting
minority and low-income children (Brim, et al, 2008; CDC 2012). Annual mean health care
expenditures for children with asthma is 2.8 times higher than children without asthma,
$1129 vs. $468 (Lozano et al., 1999). Annual costs associated with asthma and respiratory
illness and benefits from relieving symptoms in the US range between $2 billion and $19.7
billion (Corso & Fertig, 2008; Landigran et al. 2002).
There is significant evidence of a causal relationship between indoor air contaminants

C-15
and poor health (Crain, et al., 2002; NCHH & ERT Associates, 2006; NIEHS, 2011; The
Opportunity Council, et al., 2004; Wu & Takaro, 2007). In several analyses of impacts of
multi-attribute interventions including housing interventions targeting reductions of
asthma triggers such as installation of ventilation systems, measures to reduce mold, and
integrated pest management, a positive correlation was found between such measures and
reduced medical costs (Kattan, et al., 2005; Krieger, et al., 2005; Ngugen, et al., 2010;
Nurmagambetov, et al., 2011). In these studies, the range of direct medical costs averted
for children with asthma per year was $124 -$555; along with a corresponding increase in
symptom-free days per year between 20.8-37.8 days. However, there are no known
research studies specifically analyzing the impact of combining weatherization measures
and asthma reduction measures on Medicaid costs associated with the treatment of
asthma.
Citations:
Breysse, P., Farr, N., Galke, W., Lanphear, B., Morley, R., et al.(2004). The Relationship
between Housing and Health: Children at Risk. Environmental Health Perspectives,
112(15).
Brim, S. N., Rudd, R. A., Funk, R. H. & Callahan, D. B. (2008). Asthma prevalence among
US children in underrepresented minority populations: American Indian/Alaska Native,
Chinese, Filipino, and Asian. Pediatrics, 122, 217-222.
Centers for Disease Control and Prevention’s National Asthma Control Program.
(2012).Asthma in Washington. Washington, DC.
Corso, P. & Fertig, A. (2008). The long-term economic costs of asthma. Partnership for
America's Economic Success, 13: 1-12
Crain, E.F. et al. (2002). Home and allergic characteristics of children with asthma in seven
U.S. urban communities and design of an environmental intervention: The inner-city
asthma study. Environmental Health Perspectives, 110(9), 939.
Jacobs, D.E., Kelly, T. & Sobolewski, J. (2007). Linking public health, housing, and indoor
environmental policy: Successes and challenges at local and federal agencies in the United
States. Environmental Health Perspectives, 115(6), 976.
Kattan M., Stearns S., Crain E., Stout J., Gergen P. & Evans R. (2005). Cost-effectiveness
of a home-based environmental intervention for inner-city children with asthma. Journal
of Allergy Clinical Immunology, 116(5):1058–1063.
Krieger J.W., Takaro T.K., Song L. & Weaver M. (2005). The Seattle-King County
Healthy Homes Project: a randomized, controlled trial of a community health worker
intervention todecrease exposure to indoor asthma triggers. American Journal of Public
Health, 95:652–659.
Landrigan P.J., Schecter C.B., Lipton J.M., Fahs M.C. & Schwartz J. (2002).
Environmental pollutants and disease in American children: estimates of morbidity,
mortality, and costs for lead poisoning, asthma, cancer and developmental disabilities.
Environmental Health Perspectives 110:721–728.

C-16
Lozano P., Sullivan S.D., Smith D.H. & Weiss K.B. (1999). The economic burden of asthma
in US children: estimates from the National Medical Expenditure Survey. Journal of
Allergy and Clinical Immunology. Nov;104(5):957-63.
National Center for Healthy Housing & ERT Associates. (2006). Asthma and
weatherization in Maine.
National Institute of Environmental Health Services. (2011). Asthma and its
Environmental Triggers. Washington, DC.
National Renewable Energy Laboratory. (2011). Healthy Housing Opportunities During
Weatherization Work.
Ngugen, K. H., Boulay, E. & Peng, J. (2010). Quality-of-life and cost-benefit analysis of a
home environment assessment program in connecticut. Journal of Asthma, 1-9.
Nurmagambetov, T. A. et al. (2011). Economic value of home-based, multi-trigger,
multicomponent intervention with an environmental focus on reducing asthma
morbidity; A community guide to systematic review. American Journal of Preventative
Medicine, 41(251), 533-547.
The Opportunity Council & Erin Hamernyik, Ellen Tohn, ERT Associates & Eric Oetjen,
ICF Consulting. (2004). Weatherization plus health; Program materials and protocols to
integrate health concerns in to wx projects.
Walter, M. J. et al. (2008). Predicting worsening asthma control following the common
cold. European Respiratory Journal, 32(6), 1548-1554.
Wu, F. & Takaro, T.K. (2007). Childhood asthma and environmental interventions.
Environmental Health Perspectives, 115(6), 971.
Yawn, B.P. (2008). Factors accounting for asthma variability: achieving optimal symptom
control for individual patients. Primary Care Respiratory Journal, 17(3), 138-147.
If this is evaluation research, briefly describe the program or intervention being evaluated. The
Opportunity Council's Weatherization Plus Health program provides free education, tools
and home improvements to help reduce asthma triggers for children in addition to
weatherization measures completed in these income-eligible households in Whatcom, San
Juan and Island counties. Weatherization is the process of making a home more energy
efficient through targeted measures based on a home energy assessment. Outside of this
specific study, ORNL has been tasked with determining health impacts from
weatherization work completed in the home. In addition to the potential energy and non-
energy impacts a household might observe from weatherization only, this study will
measure the impact of the individualized package of asthma reduction measures study
participants receive through the Opportunity Council's Plus Health add on to the
program. These targeted asthma reductions include: improved mechanical ventilation for
moisture and mold control, dust mite covers for mattresses and pillows, hard-surfaced
flooring to replace carpeting in bedrooms and main living areas, integrated pest
management, walk off mats for entrances to the home, the supply of natural cleaning

C-17
products, and education on the effects of exposure to environmental tobacco smoke.
5.2 Study Design
State the primary hypotheses or objectives of this research. The hypothesis is that
Weatherization Plus Health leads to a decrease in asthma symptoms and episodes in
children of program eligible households, which therefore leads to a reduction in treatment
needs while in the home, during the school day and from medical professionals. The
objective is to explore a range of impacts of the Program through the collection of asthma
related direct medical expenditures records, physicians records, school records and self
reports of household members to share with potential stakeholders of the Program.
Indicate whether the design will involve randomization, and/or whether comparison or control
groups will be used. As this is a retrospective exploratory study researching the impact the
program has had on a purposively selected cohort of study participants, it does not involve
randomized controlled experimental design. Households who qualified and received
asthma reduction measures in addition to weatherization through WAP will be the
treatment group and households with the same eligibility criteria who would have qualified
for the program if the program existed in their community will serve as the comparison
group.
Describe the sampling plan, the size of the sample or study group(s), and the power of the
planned statistical tests, if applicable. There will be approximately 70 households involved in
the study. This project will collect data for all homes (approximately 35) that received both
weatherization measures and asthma reduction measures from the Opportunity Council. A
comparison group of 35 homes will be randomly selected from a list of weatherized homes
provided by a nearby local agency that provides low-income weatherization services. Each
comparison group household will have at least one child who has asthma. None of the
comparison group homes will have received asthma reduction measures.
Specify the major independent, dependent, and extraneous variables, and discuss possible threats
to internal and/or external validity. The major independent variables are: weatherization
measures installed in the home, asthma reduction measures installed in the home, and
standard demographic descriptors for household members (age, gender). The major
dependent variables are: annual asthma-related direct medical expenditures per person
and household; self-reported frequency of asthma-related symptoms and episodes per
person; missed days or hours at school for each school-aged child in the study; academic
performance for each school-aged child in the study; and self-reported loss of adult
productivity related to work both inside and outside of the home. Possible threats to
internal validity include: differences in standard weatherization measures installed by the
Opportunity Council and the local agency that weatherized the comparison homes; and
changes in the effectiveness in asthma treatments over time. Choosing a nearby local
agency from the same region and climate zone as the Opportunity Council addresses the
first issue. Having a comparison group addresses the second. With respect to external
validity, this project is considered to be exploratory research. There is no intention for the

C-18
results of this research to be generalized beyond the study population.
Describe the statistical tests, if any, that will be used and explain how the expected results will
address the hypotheses or research objectives. An analysis of variance (ANOVA) will be used
to test whether there are statistical differences between the treatment and comparison
group populations over the major dependent variables. Multiple regression analysis will be
used to test the significance of the major independent variables upon the major dependent
variables, while controlling for the major demographic variables.
5.3 Data Collection Procedures
a. Does the research involve contact with human subjects?
No Go to item 5.3b.
Yes Explain all of the following:
what subjects will be asked to do:
who will perform the data collection procedures:
where data collection procedures will be performed:
when or how often data collection procedures will be conducted:
b. Does the research involve use of identifiable records?
No Go to item 5.3c.
Yes Explain all of the following:
the agency holding each source of identifiable records or PHI: The Health Care
Authority
how each source of records will be obtained: Records from HCA will be
requested in electronic format through a secure FTP site. Complete
authorizations forms signed by consenting subjects will be sent through the
secure FTP site to the HCA. The Provider One IDs obtained by the subject
and entered into the authorization forms will be used to identify the subject
in the HCA database. The Provider One ID on the Medicaid records will be
used to identify the subject upon HCA transfer of data to the Opportunity
Council through the same secure FTP site. HCA will not remove identifiers
prior to the disclosure of records back to the researchers at the
Opportunity Council. Records will not be sent to researchers to Oak Ridge
National Laboratory by HCA or by the Opportunity Council. The
Opportunity Council will enter the data into a database. Data will be de-
identified of PII and replaced with study codes. All explicit identifiers
(subject name, parent or guardian name(s), address, telephone number(s),
date of birth, social security number, HCA Provider One ID, Opportunity
Council client identification number, school name, physician name and
address, school name, address and grade level) will be removed. All
additional data values will be generalized- range of dates will be used in

C-19
place of exact Opportunity Council Weatherization Plus Health visits,
medical treatment dates, and attendance dates. Oak Ridge National
Laboratory will conduct analysis through the de-identified database. Oak
Ridge National Laboratory does not have access to identifiable primary
research data for the Weatherization Plus Health study data to be linked to.
Identified PHI and PII will not be shared on any subject outside of the
project team.
plans to link records from multiple sources and the sequence of linkage, if
applicable: The HCA records will be linked to the home asthma reduction
interventions completed by the Opportunity Council who keeps this data
in-house; weatherization measures completed by the Opportunity Council
and the Snohomish County Community Action Partnership, both of which
keep this data in-house; physician records will be requested from the
physican office to review physican treatment notes and recommendations;
school records (as applicable) to be obtained through the individual school
or the central office serving that school to explore changes in attendance
and use of on-site medical personnel for asthma related incidences; survey
and questionnaire responses collected by the Opporunity Council to
determine present day asthma and health status, and in home observations
conpleted by the Opportunity Council to examine current status of
observable asthma triggers in the home. These data will be entered into a
database managed by the Opportunity Council. Upon the database being
de-identifed of PII and protected health information, and replaced with
study codes, the database will be shared with Oak Ridge National
Laboratory for analysis.
the identifiers to be used to link multiple records sources, if applicable: The
direct identifiers used to link the multiple records will be the subject and
parent or guardian of subject's name, date of birth, address, phone
number, social security number, and Provider One ID for HCA.
c. Does the research involve multiple data collection periods?
No Go to item 5.3d.
Yes Explain the following:
the number of data collection intervals:
the time period between data collection intervals:
the data collection methods to be used at each interval:
d. Will the study take place in clinics, hospitals, welfare offices, jails, or other
facilities?
No Go to item 5.4.
Yes Attach a copy of letters of cooperation from each facility to Appendix L.

C-20
5.4 Data Collection Instruments
List all data collection instruments, including questionnaires, interview guides, assessments or
tests, focus group guides, record review forms, etc. Attach copies of all data collection
instruments to Appendix K. If none, skip to Section 6.
There are no data collection instruments used as part of the records only research
component of this study. All data collection instruments used to complete tasks associated
with other components of this study not reviewed by WSIRB will not reference WSIRB.
However, the data collection instruments have been included in Appendix K to provide
documentation of the primary research data collected to be combined with the records
only research data for analytic purposes.
6. Study Subjects
6.1 Expected number of subjects over the course of the research: A total of 70
households will be included in the study. The number of record requests from HCA is
difficult to determine as we will need to identify household members with asthma at the
time of recruitment. We anticipate collecting records for approximately 70 individual cases
for the treatment group (with an observed average of 2 children with asthma per
household) and will attempt to enroll 35 individual cases for the comparison group. We
therefore expect approximately 105 individual subjects to be enrolled in the study over the
course of the research.
6.2 Specify inclusion criteria for subjects.
To be included in the treatment group, subjects must have participated in the
Weatherization Plus Health program between calendar years 2009 and 2012, must have a
diagnosis of asthma by a medical professional, must be residing in the same residence
where the asthma reduction measures and interventions were conducted, and must have
lived in the residence for one year prior to the Weatherization Plus Health interventions.
Each adult with asthma living in the household must be willing to provide consent for the
authorization of the disclosure of Medicaid records related to asthma treatment for
themselves or as guardians for minors with asthma living in the home.
To be included in the comparison group, subjects must have received services through the
Weatherization Assistance Program (WAP) in Snohomish County between calendar years
2009 and 2012, and must have a child residing in the home diagnosed with asthma by a
medical professional, that was living in the home one year prior to the WAP intervention.
Each adult with asthma living in the household must be willing to provide consent for the
authorization of the disclosure of Medicaid records related to asthma treatment for
themselves or as guardians for minors with asthma living in the home.
6.3 Specify exclusion criteria for subjects.
Subjects in the treatment group will be excluded if they are no longer residing in the

C-21
residence where the Weatherization Plus Health interventions occurred. Subjects will be
excluded if they have not been diagosed with asthma by a medical professional. Children in
the home with asthma will be excluded if they were not born one year prior to the
Weatherization Plus Health intervention. Adults in the home with asthma will be excluded
if they were not residing in the home one year pre-intervention. Subjects will be excluded
from the study if they are unwilling or incapable of consenting to the authorization of the
disclosure of Medicaid records related to their asthma, or if their legal guardians are
unwilling or incapable of consenting to the authorization of the disclosure of Medicaid
records related to their asthma.
Subjects in the comparison group will be excluded if they are no longer residing in the
residence where the Weatherization Assistance Program interventions occurred. Subjects
will be excluded if they have not been diagnosed with asthma by a medical professional.
Children in the home with asthma will be excluded if they were not born one year prior to
the WAP intervention. Adults in the home with asthma will be excluded if they were not
residing in the home one year pre-intervention. Subjects will be excluded from the study if
they are unwilling or incapable of consenting to the authorization of the disclosure of
Medicaid records related to their asthma, or if their legal guardians are unwilling or
incapable of consenting to the authorization of the disclosure of Medicaid records related
to their asthma.
6.4 Will individuals of either gender be excluded?
No
Yes Explain why the research focuses on one gender:
6.5 Is the research limited to specific age group(s)?
No
Yes Specify the age group(s) and explain why the research focuses on them:
6.6 Will individuals be eligible for the research if they are not proficient in English?
Not applicable -- records-only research.
Yes. Describe plans for translating or interpreting recruitment materials, scripts, consent
forms, and data collection instruments. Identify who will translate study documents and indicate
if all translators are certified. (Translations of Board-approved materials must be submitted
after study approval.)

C-22
No. Provide a methodological or scientific rationale for exclusion:
6.7 Vulnerable subject groups
Vulnerable subjects may be the focus of the research or may be recruited incidentally. For
example, if women of reproductive age would be eligible for the research, Appendix B should be
completed.
Check all that apply:
Pregnant women/human fetuses/neonates (complete Appendix B)
Prisoners (complete Appendix C)
Children (complete Appendix D)
Developmentally disabled
Dementia/cognitively impaired
Mentally/behaviorally/emotionally impaired
Socially/economically disadvantaged
Low literacy/educationally disadvantaged
Seniors, over 65
Seriously/chronically ill
Substance users/abusers
Undocumented immigrants
Other (describe):
7. Risks and Benefits
This Section must be completed for all research.
The federal definition of "minimal risk" states that the probability and magnitude of harm or
discomfort anticipated in the research are not greater in and of themselves than those ordinarily
encountered in daily life or during the performance of routine physical or psychological
examinations or tests.

C-23
7.1 This research is (check one box):
Minimal risk
More than minimal risk
Explain why this research is minimal risk or more than minimal risk in relation to the above
definition of minimal risk. Provide examples of how research procedures are consistent with
the level of risk checked above.
Subjects in both treatment and comparison groups are asked to authorize the release of
Medicaid records related to their asthma or a minor's asthma. Adequate protections will
be implemented so that risks related to invasion of privacy and breach of confidentiality
will be no greater than minimal. Asthma as a medical condition is generally not considered
to be of a sensitive nature placing subjects at risk of criminal, or civil liability or
considered to be damaging to the subject if there was a breach of confidentiality. To reduce
risk of breach of confidentiality, the transfer of PHI will ocurr between the source of the
data, being the Health Care Authority, and the Opportunity Council through a secure file
transfer protocol; Only the minimum data elements necessary will be requested from the
HCA; Subjects' PHI will be entered into a database and will then be de-identified of PII,
and replaced with study codes. Identified PHI and PII will not be shared on any subject
outside of the project team and will be destroyed by 9/30/14 with a permanent deletion of
data from the file server.
7.2 Does the research involve any of these possible harms and/or discomforts to
subjects? Check all that apply.
Invasion of privacy or breach of confidentiality
Psychological/emotional discomfort or distress
Social stigmatization
Legal repercussions
Economic (e.g., employment, insurability)
Physical harm or discomfort
Withholding standard care or procedures
Significant time or inconvenience
Other (describe):
7.3 Describe each possible harm and/or discomfort checked above, the probability of the
harm occurring and the magnitude of the harm if it does occur.
If there is a breach of confidentiality then PII and PHI could be released. However, the

C-24
safeguards are in place through a data security plan, and training has been conducted for
all staff who will have contact with the subjects. The PHI collected is related to direct
Medicaid medical expenditures for asthma related costs only, which is typically not a
condition placing an individual at risk for civil or criminal liability or damaging socially.
The social stigmatization could be if the subjects are identified (outside of the research
team) as a recipient of the Medicaid program.
7.4 Describe what steps will be taken to minimize each of the possible harms and/or
discomforts to subjects.
To address the potential for invasion of privacy or breach of confidentiality and the
potential for social stigmatization a data security plan is in place. A one time transfer of
Protected Health Information (PHI) will occur beween the data source (HCA) and the
Opportunity Council. Medicaid records will be stored in a secure database per the data
security plan. PHI will not be transferred outside of the Opportunity Council. Records will
be de-identified of PII and replaced with study codes for each subject in a manner that
upon all direct and indirect identifiers being removed, re-identification of those subjects
will be highly improbable. In addition to removing explicit identifiers such as names and
Provider One ID, additional data values will be suppressed, or generalized, or perturbed to
further reduce the risk for indirect identification.
7.5 If this research involves interactions or interventions with human subjects, describe
what steps will be taken if subjects experience serious distress, discomfort, or
decompensation during study participation. Indicate whether a resource list or referrals will
be available to give to subjects routinely or as needed, and attach the list to Appendix L. (If this
is records research only, indicate “NA.”)
NA
7.6 Describe any anticipated benefits for individual subjects who are participating or
whose records are being used in this research. If none, indicate “None.”
None
7.7 Describe how this research will benefit this class of subjects or how it will contribute
to general knowledge.
This research seeks to identify relationships between the weatherization and asthma
reduction measures provided to households of low socioeconomic status who may not have
been able to afford the provided measures on their own and their impact on subject health.
If a relationship is established between the measures and direct medical expenditures then
programs offering this suite of services are better positioned for seeking and securing
leveraged resources to fund their services and will be able to reach more households in
need.
7.8 Explain how the anticipated benefits of this research outweigh the harms and/or

C-25
discomforts.
The literature suggests that asthma can be controlled both through medical treatment, and
education, as well as through interventions addressing environmental triggers. This
research seeks to examine changes in direct medical expenditures related to asthma
treatment pre and post in-home intervention. If a relationship is established, the research
could provide further understanding of environmental asthma triggers, and could provide
evidence to encourage stakeholders and private donors to contribute additional funding for
these in-home interventions with the goal of reducing asthma symptoms and episodes. Due
to the systems in place to protect subjects' privacy and to reduce breach of confidentiality,
the benefits of this research to both individual subjects within the sample and the class of
subjects outside the sample outweigh the potential of breach of confidentiality.
8. Use and/or Disclosure of Identifiable Records or PHI
8.1 Does this research involve use or disclosure of identifiable records or PHI?
No Go to Section 9.
Yes If identifiable records are requested from DSHS, DOH, L&I, and/or HCA,
complete Appendix G.
8.2 Will signed authorization be obtained from study subjects and/or their
parents/guardians for the use or disclosure of their identifiable records or PHI?
No
Yes Explain how, when, and where signed authorization will be obtained and complete
Appendix F.
Subjects will be requested to sign the authorization during an on-site visit to the subject's
home with trained Opportunity Council staff.
8.3 Are you requesting a waiver of authorization for use or disclosure of existing
identifiable records or PHI?
No
Yes Complete Appendix I, Section 4 (all items).
9. Confidentiality
Direct identifiers include name, address, phone, email address, Social Security Number, client
identifier, medical record numbers, account numbers, PICCODE, license numbers, etc.
9.1 Will names and other direct identifiers of study subjects be accessed or obtained for

C-26
any purpose (e.g., screening, recruitment, analyses)?
No Go to item 9.5.
Yes List the direct identifiers to be collected and explain why they are needed for the
research.
Names, date of births, addresses, phone numbers, social security numbers and HCA
Provider One IDs will be collected in order to ensure we are requesting and linking
accurate information to the subject and have all necessary information for completion of
authorization forms.
9.2 Will names and all direct identifiers be removed or segregated from research records
and replaced with study codes as early in the process as possible?
NA All records are non-identified.
Yes
No Explain your answer.
9.3 Will a link between direct identifiers and study code numbers be retained until the
research is completed?
NA All records are non-identified.
No Specify when the link between identifiers and code numbers will permanently
destroyed.
Yes Explain why it is necessary to retain the link between study codes and direct
identifiers.
As researchers working with a vulnerable population, it is our responsibility to disseminate
our findings to the population being studied. The direct identifiers will also allow us to
follow up with households on questions the data might generate.
9.4 Specify when all direct identifiers will be permanently separated from study records
and destroyed. (See Definitions on pg. 2 of the application.) If all records are non-identified,
indicate “NA.”
9/30/14
9.5 Will identifiable research records be disclosed to anyone who is not involved with
this research?
No

C-27
Yes Describe the data to be disclosed, to whom, and the purpose of each disclosure.
9.6 Will identifiable research records be used for a future study?
No
Yes Explain your answer.
9.7 Will a public-use/de-identified dataset be made available at the completion of the
research? (See Application Definitions.)
No
Yes Note: a file layout of all data elements must be submitted for WSIRB review
prior to release. Explain how a public use dataset will be created.
9.8 Will any identifiable research data or the study consent form be placed in a
subject’s medical record or case file?
No
Yes Explain your answer.
9.9 Will a federal Certificate of Confidentiality be requested?
No
Yes, from (agency/name).
For records-only research, skip Sections 10 and 11.
Go to item 12.1 and complete all relevant Appendices.
10. Mandatory Reporting
Washington State Agency Policy requires reporting of all suspected abuse/neglect of children
and vulnerable adults, and reporting of threats of harm to self (suicidal ideation) or others. Some
research involves diagnostic testing or clinical care, such that reporting of health conditions is

C-28
required. Mandatory reporting requirements must be described in study consent/assent
forms as exceptions to confidentiality.
10.1 Could interventions or interactions with subjects produce information that may
lead to suspicion of abuse/neglect of a child? (RCW 26.44)
No
Yes Describe plans for reporting such incidents to Child Protective Services.
10.2 Could interventions or interactions with subjects produce information that may
lead to suspicion of abuse/neglect of a vulnerable adult? (RCW 70.124, RCW 74.34)
No
Yes Describe plans for reporting such incidents to Adult Protective Services or, in the
case of state hospital patients, to hospital staff.
10.3 Could interventions or interactions with subjects produce information that may
lead to concern about threats of suicide or harm to other persons?
No
Yes Describe plans for reporting such incidents and plans to be implemented in the
event of imminent threat of harm.
10.4 Will study procedures involve testing or diagnosis of any disease or condition that
is reportable under WAC 246-101? (Such as notifiable diseases, blood lead levels, etc.)
No
Yes Include a statement in the study consent form that the subject’s condition will be
reported to the state or local health department, as applicable.
11. Subject Recruitment
11.1 Explain how potential subjects will be identified. Explain each method to be used to
identify them (e.g., agency records, databases, referrals, advertisements, etc.).

C-29
11.2 Does this research involve recruiting subjects who are minors or dependent adults?
No
Yes Explain how, when, and where a parent or legal guardian will be contacted and
asked for permission to recruit the minor or dependent adult. (If a waiver of parental/guardian
permission will be requested, complete Appendix I, Section 3.)
11.3 Explain how subjects will be recruited.
11.4 Explain when recruitment will occur.
11.5 Explain where potential subjects will be recruited.
11.6 Explain who will make initial research contact with potential subjects. (If confidential
state agency records will be used to identify potential subjects, the state agency must make
initial contact.)
11.7 Explain how privacy will be respected during the recruitment process.
11.8 Explain what steps will be taken to minimize undue influence to participate.
11.9 Will potential subjects be offered gifts, payments, services without charge, or other
incentives to participate?
No
Yes Specify the type of incentive, the monetary value, and when incentive(s) will be
given.

C-30
12. Informed Consent/Assent Process Unless specific requirements are met and the
WSIRB approves a waiver, signed consent/assent and signed parent/guardian permission for the
participation of a child are required for studies that involve interventions or interactions with
human subjects.
12.1 Are you requesting a waiver of:
Documentation of consent/assent for study participation?
No Yes (Complete Section 1.1 or Section 1.2 of Appendix I).
Some or all required elements of consent/assent?
No Yes (Complete Section 2 of Appendix I).
Parent/guardian permission for study participation of a child?
No Yes (Complete Section 3 of Appendix I).
Waiver of authorization for use/disclosure of identifiable records or PHI?
No Yes (Complete all items in Section 4 of Appendix I).
If you are not contacting subjects, skip the remainder of Section 12.
12.2 Identify who will obtain consent, assent, or parent/guardian permission. Provide job
titles/credentials, and a description of consent training for all individuals responsible for
obtaining consent:
12.3 Describe how, when, and where consent, assent, and/or parent/guardian permission
will be obtained.
12.4 Explain how subjects’ understanding of the research procedures and the risks and
benefits of study participation will be assessed.
12.5 Will an impartial witness be present during the consent/assent session?
No
Yes Identify the individual who will serve as a witness and describe his/her
qualifications.

C-31
12.6 Complete Appendix F: Recruitment, Consent/Assent, and Authorization Documents.
Put the document title in a footer on each document. List all documents and readability scores in
Appendix F and attach them to the Appendix. Names of electronic documents should match the
document titles listed in this Appendix.
Application Checklist
The following documents must be submitted with the application, when applicable.
Appendix A: Additional Research Staff - attach CVs/resumes (limit to five pages each)
Appendix B: Research Involving Pregnant Women, Human Fetuses, and Neonates as
Subjects
Appendix C: Research Involving Prisoners as Subjects
Appendix D: Research Involving Children as Subjects
Appendix E: Unaffiliated Investigator Agreement (Send with signed original only.)
Appendix F: Recruitment, Consent/Assent, and Authorization Documents
Appendix G: Requests for Use or Disclosure of Records
Appendix H: Resource Requests
Appendix I: Consent/Authorization Waivers
Appendix J: Electronic Data Security Plan
Appendix K: Data Collection Instruments
Appendix L: Miscellaneous Study Documents
Appendix M: Application for Funds Awarded to DSHS, DOH, L&I, and/or HCA (one
copy double-sided)
Appendix N: Conflict of Interest Reporting – Required for all applications.
Submission of an incomplete application is a common cause for delay in the review of
proposals.