The journey beyond the trip: Exploring the 5 stages of travel

This article was downloaded by: [Bibliotheek TU Delft], [Maarten Kroesen]On: 07 June 2012, At: 01:01Publisher: RoutledgeInforma Ltd Registered in England and Wales Registered Number: 1072954 Registeredoffice: Mortimer House, 37-41 Mortimer Street, London W1T 3JH, UK
Journal of Sustainable TourismPublication details, including instructions for authors andsubscription information:http://www.tandfonline.com/loi/rsus20
Exploring people's viewpoints onair travel and climate change:understanding inconsistenciesMaarten Kroesen aa Department of Policy and Management, Faculty of Technology,Delft University of Technology, Delft, Netherlands
Available online: 07 Jun 2012
To cite this article: Maarten Kroesen (2012): Exploring people's viewpoints on air traveland climate change: understanding inconsistencies, Journal of Sustainable Tourism,DOI:10.1080/09669582.2012.692686
To link to this article: http://dx.doi.org/10.1080/09669582.2012.692686
PLEASE SCROLL DOWN FOR ARTICLE
Full terms and conditions of use: http://www.tandfonline.com/page/terms-and-conditions
This article may be used for research, teaching, and private study purposes. Anysubstantial or systematic reproduction, redistribution, reselling, loan, sub-licensing,systematic supply, or distribution in any form to anyone is expressly forbidden.
The publisher does not give any warranty express or implied or make any representationthat the contents will be complete or accurate or up to date. The accuracy of anyinstructions, formulae, and drug doses should be independently verified with primarysources. The publisher shall not be liable for any loss, actions, claims, proceedings,demand, or costs or damages whatsoever or howsoever caused arising directly orindirectly in connection with or arising out of the use of this material.
Journal of Sustainable TourismiFirst 2012, 1–20
Exploring people’s viewpoints on air travel and climate change:understanding inconsistencies
Maarten Kroesen∗
Department of Policy and Management, Faculty of Technology, Delft University of Technology,Delft, Netherlands
(Received 29 August 2011; final version received 3 May 2012)
This study aims to objectify people’s subjective viewpoints toward air travel and climatechange. Using an online questionnaire, a series of statements about aviation and theenvironment were scored by 491 subjects in the Netherlands. Through factorization ofthe response patterns six distinct viewpoints on aviation and climate change are revealedand identified as integration, ignorance, denial, necessity, guilt and indulgence/fatalism.Each viewpoint is shown to be associated with fitting levels of air travel behavior andgeneral environmental awareness. As in previous research, it is shown that air travelbehavior does not significantly correlate with general environmental awareness. No-table differences were found, however, between those subjects under 30 years old andthose over 30 years old: the older group were much more likely to claim both necessityand indulgence/fatalism as a reason for flying. The results add to our understandingof attitude-behavior inconsistency by revealing how people from their own standpointsreconcile and/or prevent possible inconsistencies between certain air travel behaviorsand pro-environmental attitudes. Practically, the viewpoints offer more effective sus-tainability discourses, and point to several new policy measures to remove the “sting”from the denial position by enhancing the credibility of the “rationalization of lifestyle”discourse.
Keywords: air travel; climate change; environmental attitudes; Q-factor analysis; quan-titative research; behavioural studies
Introduction
Air travel has grown at an average annual growth rate of 6% by volume over the last50 years, with an overall increase of nearly tenfold in the same period, from approximately500 billion revenue passenger kilometres in 1960 to 4900 billion in 2010. Assuming afuture growth rate of approximately 5% annually, the major aircraft manufacturers expectthat the market will again more than double in size by 2030 (Airbus, 2010; Boeing, 2010).
Presently, aviation accounts for a relatively small percentage of the total worldwideanthropogenic greenhouse gas emissions. Gossling & Peeters (2007) have estimated avi-ation’s contribution in 2005 in the order of 3.4%–6.8% (the range being a result of theconsideration of radiative forcing). However, given the projected growth, which outpacesannual fuel efficiency improvements (Lee et al., 2009), its share can be expected to increasesubstantially in coming decades (Dubois & Ceron, 2006).
∗Email: [email protected]
ISSN 0966-9582 print / ISSN 1747-7646 onlineC© 2012 Taylor & Francishttp://dx.doi.org/10.1080/09669582.2012.692686http://www.tandfonline.com
Dow
nloa
ded
by [
Bib
lioth
eek
TU
Del
ft],
[M
aart
en K
roes
en]
at 0
1:01
07
June
201
2
2 M. Kroesen
Following the IPCC’s recommendations to reduce global emissions by 50%–85% by2050 (using 2000 as baseline year) in order to prevent “dangerous anthropogenic interfer-ence with the climate system”, the International Air Transport Association (IATA) aims toreduce aviation emissions by 50% compared to 2005 levels. However, many commentatorsquestion whether this net reduction is achievable (Bows & Anderson, 2007; Scott, Peeters,& Gossling, 2010). Several major airlines actually foresee a doubling of emissions by 2050(AGD Group, 2009 cited in Scott et al., 2010).
Given the expected growth of aviation and the likely marginal effects of new aircrafttechnology, tourist researchers generally emphasize the need for behavioral change, e.g. lessair travel, longer stays, reducing the distances traveled and shifts toward more sustainabletravel modes. From this behavioral focus arises a need to understand air travelers’ attitudestoward aviation and climate change. Such knowledge can provide the basis for the designof more effective sustainability discourses (Hobson, 2002).
Recognizing the limited applicability of general theories seeking to explain pro-environmental behavior (see Stern, 2000) previous research in this area has largely beenqualitative in nature using focus groups or in-depth face-to-face interviews (Barr, Shaw,Coles, & Prillwitz, 2010; Becken, 2004, 2007; Cohen & Higham, 2011; Cohen, Higham,& Cavaliere, 2011; Dickinson et al., 2010; Hares, Dickinson, & Wilkes, 2009; Higham &Cohen, 2011; Lassen, 2010; McKercher, Prideaux, Cheung, & Law, 2010; Miller, Rathouse,Scarles, Holmes, & Tribe, 2010; Randles & Mander, 2009). This body of research providesa rich overview of people’s attitudes toward climate change, their views on the environ-mental impacts of their flying behavior and the various arguments they use to qualify andrationalize their behavior. The present research continues this research by examining theways in which the beliefs, emotions and arguments as observed in people’s communicationsare integrated in coherent viewpoints on aviation and climate change.1 Specifically, a Q-factor analysis is used to identify common patterns in people’s attitudes. This quantitativetechnique has proven useful in revealing subjects’ perspectives on a range of different topics(see Brown, 1980).2
Revealing people’s holistic viewpoints on aviation and climate change has practical andscientific merits. Practically, the viewpoints provide clues about how different clusters oftravelers should be approached, which policies they would support and how they may be“educated” into more sustainable lifestyles. Theoretically, the viewpoints can reveal the(socially) viable strategies which people employ to reconcile the often observed contradic-tion between pro-environmental beliefs and actual behavior, commonly referred to as thevalue-action gap (Blake, 1999) or attitude-behavior inconsistency (Gross & Niman, 1975)in academic literature. Generally, researchers invoke other concepts to explain the observeddiscrepancy, yet few studies have sought explanations in subjects’ own constructions of re-ality. Investigating subjects’ own lines of reasoning can, therefore, contribute to the furtherdevelopment of theory on air travel behavior.
Background and research focus
Although belief in climate change has dropped recently, polls still show that the majorityof people believe that climate change is happening (78% in a recent survey of UK citizens[Cardiff University, 2010]). This belief, however, does not readily translate into people’s airtravel behavior. A straightforward explanation is that travelers are generally unaware of theimpacts of their air travel behavior on the climate, an observation made by several initialstudies assessing people’s attitudes on this topic (Becken, 2004, 2007; Gossling, Bredberg,Randow, Sandstrom, & Svensson, 2006). Yet, more recent studies suggest that people arebecoming more aware of the environmental impacts of their flying behavior (Gossling,
Dow
nloa
ded
by [
Bib
lioth
eek
TU
Del
ft],
[M
aart
en K
roes
en]
at 0
1:01
07
June
201
2
Journal of Sustainable Tourism 3
Haglund, Kallgren, Revahl, & Hultman, 2009; Higham & Cohen, 2011). Nevertheless,even with high levels of awareness, it is generally found that these beliefs do not enter intothe decision to fly.
A stream of research has uncovered the arguments which people use to relieve them-selves of any dissonance between their air travel behavior and pro-environmental attitudes,like externalizing responsibility, scientific skepticism, belief in a technological fix, distrustin authorities, or claiming to have a sustainable lifestyle in other areas of life (Barr et al.,2010; Becken, 2004, 2007; Cohen & Higham, 2011; Cohen et al., 2011; Dickinson et al.,2010; Hares et al., 2009; Higham & Cohen, 2011; Lassen, 2010; Miller et al., 2010; Randles& Mander, 2009). These arguments are also reflected in general barriers which people per-ceive to engage with climate change and climate change mitigation strategies (Lorenzoni,Nicholson-Cole, & Whitmarsh, 2007; Semenza et al., 2008; Stoll-Kleemann, O’Riordan,& Jaeger, 2001).
While this body of qualitative research has stayed close to subjects’ understandings ofthe issue, the unstructured nature of the resulting discourse prevents a systemic analysis ofpeople’s viewpoints. For example, previous research has stressed that a strategy of denialmay underlie people’s responses to various arguments (Becken, 2007; Stoll-Kleemannet al., 2001). It remains unknown, however, how this strategy actually manifests itselfand/or whether multiple strategies of denial may exist, each with a distinctive emphasis ondifferent arguments. Or, whether in fact strategies exist which are entirely different from adenial strategy, but which are nonetheless effective in reconciling any cognitive gap betweenpeople’s air travel behavior and their attitudes toward climate change. Finally, a systemicanalysis also provides the opportunity to study the relationship between the various existingviewpoints and people’s actual air travel behavior, which would indicate the limits of eachviewpoint in supporting and/or legitimizing certain behavior.
Method
Q-technique and sample
Different quantitative techniques exist to cluster people into homogenous groups withsimilar scoring patterns in relation to a set of statements. These include cluster analysis,latent profile/class analysis and Q-factor analysis. The present study employs a Q-factoranalysis to classify respondents.3
The main goal of a Q-analysis is to identify shared perspectives on a topic of interest.Therefore, in contrast to standard factor analysis, a Q-factor analysis involves the factor-ization of the transposed data matrix, where cases represent the various items/statementsand variables represent respondents. Hence, it involves the correlation and factorization of(within-person) response patterns instead of (between-person) items. Thus, if two respon-dents respond in a similar way to a set of statements, their response patterns will correlate(indicating that they share a similar perspective) and they will end up in the same factor. Bymerging the various response patterns (respondents) who load on the same factor (weightedby their respective factor loading), a factor array emerges that reflects the response patternof a hypothetical person loading perfectly on that factor. These ideal response patterns thenreflect the frames of mind on the topic at hand (Brown, 1980).
Q-factor analysis was originally introduced by Stephenson in a letter to Nature in 1935(Stephenson, 1935). In 1953, Stephenson (1953, p. 1) put forward “Q-methodology” as a“set of statistical, philosophy-of-science and psychological principles”. The present studyfollows these principles, but deviates in one important respect. Whereas Q-methodologicalprocedures prescribe the use of a forced-distribution, subjects in this study were allowed to
Dow
nloa
ded
by [
Bib
lioth
eek
TU
Del
ft],
[M
aart
en K
roes
en]
at 0
1:01
07
June
201
2
4 M. Kroesen
freely score the various statements. The discussion section will include a reflection on theimplications of this choice on the study’s results.
A Q-study starts with the identification of what has been termed a “concourse”, referringto the population of subjective statements communicated about a given topic (Stephenson,1978). While, in theory, the variation contained in statements of opinion is infinite (inprinciple, one can say anything about a topic), in practice, what is actually communicatedabout a given topic is limited. Therefore, a sample can be drawn from the concourse thatadequately captures the variation it contains.
To identify the concourse, statements were selected from previous qualitative studies(Barr et al., 2010; Becken, 2004, 2007; Cohen & Higham, 2011; Cohen et al., 2011;Dickinson et al., 2010; Hares et al., 2009; Higham & Cohen, 2011; Lassen, 2010; Milleret al., 2010; Randles & Mander, 2009) and from an online discussion forum.4 The rangeof settings in which the statements were expressed (focus groups, face-to-face interviewsand an online discussion forum) provided confidence that the resulting concourse wouldaccurately reflect people’s everyday communications about aviation and the environment.In total, 168 statements were sampled from the sources mentioned above.
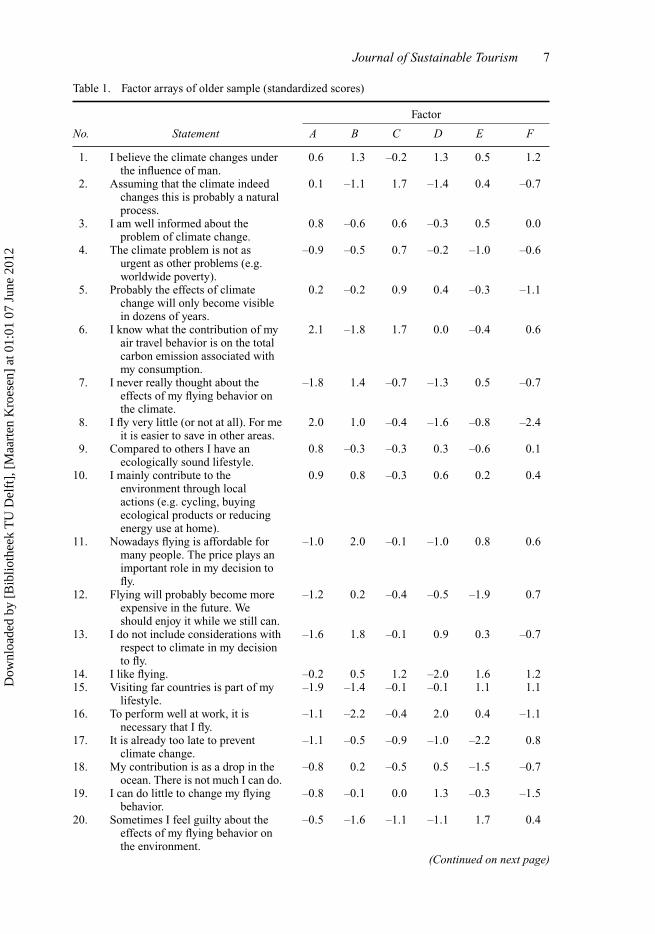
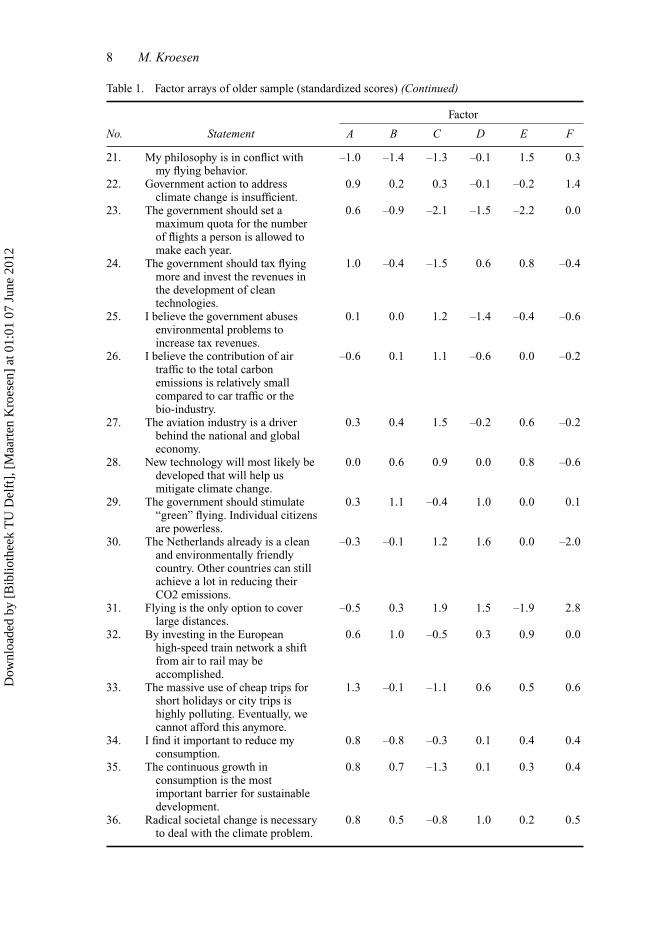
To arrive at a manageable and representative set of statements (the so-called Q-sample),the statements were inductively grouped into 11 themes: climate change, personal impacts,environmental behavior, motivations for flying, fatalism, feelings of guilt, governmentintervention, industry discourses, externalizing responsibility, alternatives and future con-sumption. Next, statements within each theme were selected until the variation containedwithin each particular theme was adequately covered. This led to the selection of 36 state-ments, presented in Table 1. The items were randomized in the questionnaire and measuredon 7-point scales from strongly disagree (1) to strongly agree (7).
Although the definition of themes and the assignment of statements to the themes maybe somewhat arbitrary, these procedures are merely to ensure that the heterogeneity of thesample of statements it maximized (Brown, 1980). It is assumed that should a differentconceptual structure be imposed a similar comprehensive sample would result. The finalcriterion is that all subjects (holding different viewpoints) have those statements at theirdisposal through which they can effectively communicate their viewpoint.
Travel and offset behavior, travel purpose and environmental attitude
To measure air travel behavior subjects were asked to indicate the number of return flightsthey had made in the past 12 months. To arrive at a more precise measure of respondents’air travel behavior the question was split into five distance categories: within Europe,just outside Europe (e.g. Canary Islands, North Africa, Turkey), medium distance (e.g.US, Kenya or India), long distance (e.g. Thailand, the Caribbean, South-Africa) and verylong distance (e.g. Indonesia, Australia, Chile). Based on crude assumptions of the averagedistance traveled within each category (2.000, 5.000, 14.000, 20.000 and 32.000 kilometers,respectively), a single measure of the total distance traveled by plane (in the last year) wasderived.
Next, those respondents who had indicated to have flown in the past year were asked toindicate the number of flights that had a business purpose as well as the number of flightswhere they had chosen to offset the related carbon emissions.
A final set of questions measured subjects’ environmental attitude with the New Eco-logical Paradigm scale using 5-point scales (Dunlap, 2008; Dunlap, Van Liere, Mertig,& Jones, 2000). This scale was also applied by Mair (2011) to assess its associationwith carbon offset behavior. Its 15 items were combined into a single measure of general
Dow
nloa
ded
by [
Bib
lioth
eek
TU
Del
ft],
[M
aart
en K
roes
en]
at 0
1:01
07
June
201
2
Journal of Sustainable Tourism 5
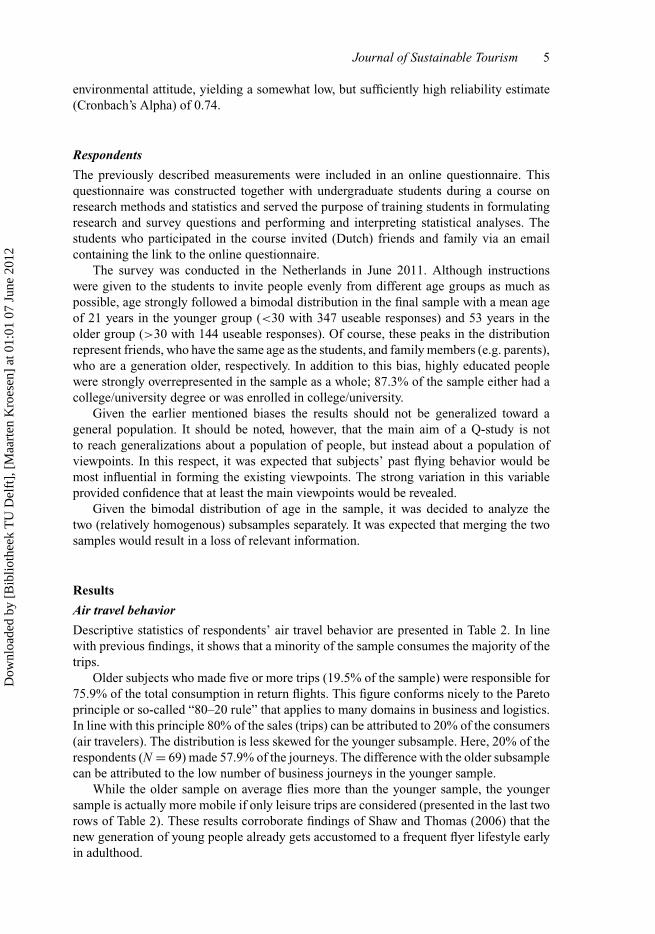
environmental attitude, yielding a somewhat low, but sufficiently high reliability estimate(Cronbach’s Alpha) of 0.74.
Respondents
The previously described measurements were included in an online questionnaire. Thisquestionnaire was constructed together with undergraduate students during a course onresearch methods and statistics and served the purpose of training students in formulatingresearch and survey questions and performing and interpreting statistical analyses. Thestudents who participated in the course invited (Dutch) friends and family via an emailcontaining the link to the online questionnaire.
The survey was conducted in the Netherlands in June 2011. Although instructionswere given to the students to invite people evenly from different age groups as much aspossible, age strongly followed a bimodal distribution in the final sample with a mean ageof 21 years in the younger group (<30 with 347 useable responses) and 53 years in theolder group (>30 with 144 useable responses). Of course, these peaks in the distributionrepresent friends, who have the same age as the students, and family members (e.g. parents),who are a generation older, respectively. In addition to this bias, highly educated peoplewere strongly overrepresented in the sample as a whole; 87.3% of the sample either had acollege/university degree or was enrolled in college/university.
Given the earlier mentioned biases the results should not be generalized toward ageneral population. It should be noted, however, that the main aim of a Q-study is notto reach generalizations about a population of people, but instead about a population ofviewpoints. In this respect, it was expected that subjects’ past flying behavior would bemost influential in forming the existing viewpoints. The strong variation in this variableprovided confidence that at least the main viewpoints would be revealed.
Given the bimodal distribution of age in the sample, it was decided to analyze thetwo (relatively homogenous) subsamples separately. It was expected that merging the twosamples would result in a loss of relevant information.
Results
Air travel behavior
Descriptive statistics of respondents’ air travel behavior are presented in Table 2. In linewith previous findings, it shows that a minority of the sample consumes the majority of thetrips.
Older subjects who made five or more trips (19.5% of the sample) were responsible for75.9% of the total consumption in return flights. This figure conforms nicely to the Paretoprinciple or so-called “80–20 rule” that applies to many domains in business and logistics.In line with this principle 80% of the sales (trips) can be attributed to 20% of the consumers(air travelers). The distribution is less skewed for the younger subsample. Here, 20% of therespondents (N = 69) made 57.9% of the journeys. The difference with the older subsamplecan be attributed to the low number of business journeys in the younger sample.
While the older sample on average flies more than the younger sample, the youngersample is actually more mobile if only leisure trips are considered (presented in the last tworows of Table 2). These results corroborate findings of Shaw and Thomas (2006) that thenew generation of young people already gets accustomed to a frequent flyer lifestyle earlyin adulthood.
Dow
nloa
ded
by [
Bib
lioth
eek
TU
Del
ft],
[M
aart
en K
roes
en]
at 0
1:01
07
June
201
2
6 M. Kroesen
Q-factor analyses
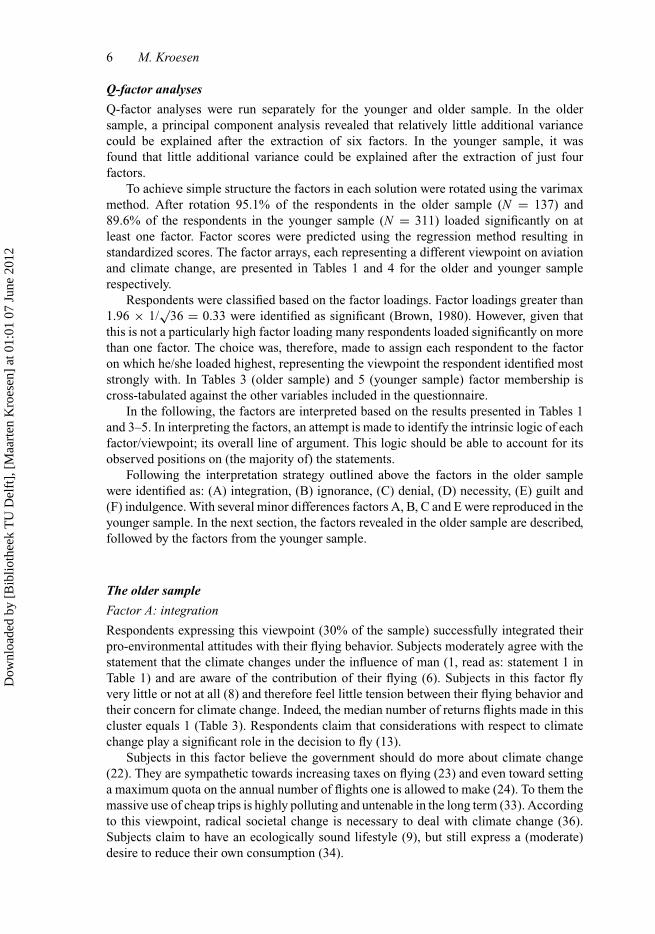
Q-factor analyses were run separately for the younger and older sample. In the oldersample, a principal component analysis revealed that relatively little additional variancecould be explained after the extraction of six factors. In the younger sample, it wasfound that little additional variance could be explained after the extraction of just fourfactors.
To achieve simple structure the factors in each solution were rotated using the varimaxmethod. After rotation 95.1% of the respondents in the older sample (N = 137) and89.6% of the respondents in the younger sample (N = 311) loaded significantly on atleast one factor. Factor scores were predicted using the regression method resulting instandardized scores. The factor arrays, each representing a different viewpoint on aviationand climate change, are presented in Tables 1 and 4 for the older and younger samplerespectively.
Respondents were classified based on the factor loadings. Factor loadings greater than1.96 × 1/
√36 = 0.33 were identified as significant (Brown, 1980). However, given that
this is not a particularly high factor loading many respondents loaded significantly on morethan one factor. The choice was, therefore, made to assign each respondent to the factoron which he/she loaded highest, representing the viewpoint the respondent identified moststrongly with. In Tables 3 (older sample) and 5 (younger sample) factor membership iscross-tabulated against the other variables included in the questionnaire.
In the following, the factors are interpreted based on the results presented in Tables 1and 3–5. In interpreting the factors, an attempt is made to identify the intrinsic logic of eachfactor/viewpoint; its overall line of argument. This logic should be able to account for itsobserved positions on (the majority of) the statements.
Following the interpretation strategy outlined above the factors in the older samplewere identified as: (A) integration, (B) ignorance, (C) denial, (D) necessity, (E) guilt and(F) indulgence. With several minor differences factors A, B, C and E were reproduced in theyounger sample. In the next section, the factors revealed in the older sample are described,followed by the factors from the younger sample.
The older sample
Factor A: integration
Respondents expressing this viewpoint (30% of the sample) successfully integrated theirpro-environmental attitudes with their flying behavior. Subjects moderately agree with thestatement that the climate changes under the influence of man (1, read as: statement 1 inTable 1) and are aware of the contribution of their flying (6). Subjects in this factor flyvery little or not at all (8) and therefore feel little tension between their flying behavior andtheir concern for climate change. Indeed, the median number of returns flights made in thiscluster equals 1 (Table 3). Respondents claim that considerations with respect to climatechange play a significant role in the decision to fly (13).
Subjects in this factor believe the government should do more about climate change(22). They are sympathetic towards increasing taxes on flying (23) and even toward settinga maximum quota on the annual number of flights one is allowed to make (24). To them themassive use of cheap trips is highly polluting and untenable in the long term (33). Accordingto this viewpoint, radical societal change is necessary to deal with climate change (36).Subjects claim to have an ecologically sound lifestyle (9), but still express a (moderate)desire to reduce their own consumption (34).
Dow
nloa
ded
by [
Bib
lioth
eek
TU
Del
ft],
[M
aart
en K
roes
en]
at 0
1:01
07
June
201
2
Journal of Sustainable Tourism 7
Table 1. Factor arrays of older sample (standardized scores)
Factor
No. Statement A B C D E F
1. I believe the climate changes underthe influence of man.
0.6 1.3 –0.2 1.3 0.5 1.2
2. Assuming that the climate indeedchanges this is probably a naturalprocess.
0.1 –1.1 1.7 –1.4 0.4 –0.7
3. I am well informed about theproblem of climate change.
0.8 –0.6 0.6 –0.3 0.5 0.0
4. The climate problem is not asurgent as other problems (e.g.worldwide poverty).
–0.9 –0.5 0.7 –0.2 –1.0 –0.6
5. Probably the effects of climatechange will only become visiblein dozens of years.
0.2 –0.2 0.9 0.4 –0.3 –1.1
6. I know what the contribution of myair travel behavior is on the totalcarbon emission associated withmy consumption.
2.1 –1.8 1.7 0.0 –0.4 0.6
7. I never really thought about theeffects of my flying behavior onthe climate.
–1.8 1.4 –0.7 –1.3 0.5 –0.7
8. I fly very little (or not at all). For meit is easier to save in other areas.
2.0 1.0 –0.4 –1.6 –0.8 –2.4
9. Compared to others I have anecologically sound lifestyle.
0.8 –0.3 –0.3 0.3 –0.6 0.1
10. I mainly contribute to theenvironment through localactions (e.g. cycling, buyingecological products or reducingenergy use at home).
0.9 0.8 –0.3 0.6 0.2 0.4
11. Nowadays flying is affordable formany people. The price plays animportant role in my decision tofly.
–1.0 2.0 –0.1 –1.0 0.8 0.6
12. Flying will probably become moreexpensive in the future. Weshould enjoy it while we still can.
–1.2 0.2 –0.4 –0.5 –1.9 0.7
13. I do not include considerations withrespect to climate in my decisionto fly.
–1.6 1.8 –0.1 0.9 0.3 –0.7
14. I like flying. –0.2 0.5 1.2 –2.0 1.6 1.215. Visiting far countries is part of my
lifestyle.–1.9 –1.4 –0.1 –0.1 1.1 1.1
16. To perform well at work, it isnecessary that I fly.
–1.1 –2.2 –0.4 2.0 0.4 –1.1
17. It is already too late to preventclimate change.
–1.1 –0.5 –0.9 –1.0 –2.2 0.8
18. My contribution is as a drop in theocean. There is not much I can do.
–0.8 0.2 –0.5 0.5 –1.5 –0.7
19. I can do little to change my flyingbehavior.
–0.8 –0.1 0.0 1.3 –0.3 –1.5
20. Sometimes I feel guilty about theeffects of my flying behavior onthe environment.
–0.5 –1.6 –1.1 –1.1 1.7 0.4
(Continued on next page)
Dow
nloa
ded
by [
Bib
lioth
eek
TU
Del
ft],
[M
aart
en K
roes
en]
at 0
1:01
07
June
201
2
8 M. Kroesen
Table 1. Factor arrays of older sample (standardized scores) (Continued)
Factor
No. Statement A B C D E F
21. My philosophy is in conflict withmy flying behavior.
–1.0 –1.4 –1.3 –0.1 1.5 0.3
22. Government action to addressclimate change is insufficient.
0.9 0.2 0.3 –0.1 –0.2 1.4
23. The government should set amaximum quota for the numberof flights a person is allowed tomake each year.
0.6 –0.9 –2.1 –1.5 –2.2 0.0
24. The government should tax flyingmore and invest the revenues inthe development of cleantechnologies.
1.0 –0.4 –1.5 0.6 0.8 –0.4
25. I believe the government abusesenvironmental problems toincrease tax revenues.
0.1 0.0 1.2 –1.4 –0.4 –0.6
26. I believe the contribution of airtraffic to the total carbonemissions is relatively smallcompared to car traffic or thebio-industry.
–0.6 0.1 1.1 –0.6 0.0 –0.2
27. The aviation industry is a driverbehind the national and globaleconomy.
0.3 0.4 1.5 –0.2 0.6 –0.2
28. New technology will most likely bedeveloped that will help usmitigate climate change.
0.0 0.6 0.9 0.0 0.8 –0.6
29. The government should stimulate“green” flying. Individual citizensare powerless.
0.3 1.1 –0.4 1.0 0.0 0.1
30. The Netherlands already is a cleanand environmentally friendlycountry. Other countries can stillachieve a lot in reducing theirCO2 emissions.
–0.3 –0.1 1.2 1.6 0.0 –2.0
31. Flying is the only option to coverlarge distances.
–0.5 0.3 1.9 1.5 –1.9 2.8
32. By investing in the Europeanhigh-speed train network a shiftfrom air to rail may beaccomplished.
0.6 1.0 –0.5 0.3 0.9 0.0
33. The massive use of cheap trips forshort holidays or city trips ishighly polluting. Eventually, wecannot afford this anymore.
1.3 –0.1 –1.1 0.6 0.5 0.6
34. I find it important to reduce myconsumption.
0.8 –0.8 –0.3 0.1 0.4 0.4
35. The continuous growth inconsumption is the mostimportant barrier for sustainabledevelopment.
0.8 0.7 –1.3 0.1 0.3 0.4
36. Radical societal change is necessaryto deal with the climate problem.
0.8 0.5 –0.8 1.0 0.2 0.5
Dow
nloa
ded
by [
Bib
lioth
eek
TU
Del
ft],
[M
aart
en K
roes
en]
at 0
1:01
07
June
201
2

Journal of Sustainable Tourism 9
Table 2. Number of trips (return flights) in past 12 months
Older sample (N = 144)Number of return flights 0 1 2–4 5–9 10–49 >50 Total% of respondents 27.1 25.7 27.8 10.4 5.6 3.5 100.0% of total trips (N = 649) – 5.7 18.3 14.3 18.0 43.6 100.0% with a business purpose – 5.4 25.2 64.5 74.4 95.0 69.0
Younger sample (N = 347)Number of return flights 0 1 2–4 5–9 10–49 >50 Total% of respondents 24.8 27.1 38.6 6.6 2.9 0 100.0% of total trips (N = 753) – 12.4 47.8 18.2 21.5 0 100.0% with a business purpose – 5.3 6.9 12.4 1.9 – 6.6
Leisure tripsNumber of return flights 0 1 2–4 5–9 10–49 >50 Total% of old sample (N = 144) 32.7 36.1 25.0 4.2 2.1 0 100.0% of young sample (N = 347) 27.1 27.4 36.6 6.1 2.9 0 100.0
All in all, subjects in factor A are concerned about the environment that is also reflectedin their above-average score on the NEP-scale (52.5). In this factor, people’s attitudes andtravel behaviors are well-integrated.
Factor B: ignorance
Subjects in this factor (comprising 22% of the sample) strongly believe that humans areresponsible for climate change (1 and 2), but at the same time, claim to be poorly informedabout the problem of climate change (3). Also, they claim not to be aware of the contribution
Table 3. Cross-tabulation of factor membership and variables of interest (older sample)
Factor
Variablea A B C D E F Sample Sign.b
N 43 32 23 15 12 12 144 –% female 49 50 22 33 67 58 44 0.11Age (mean) 56.0 49.3 50.0 53.3 48.5 51.6 52.5 0.00% income above 3500 euro 24 24 63 47 25 36 33 0.03Number of return flights in past
12 months (median)1 1 4 4 4 3 1.0 0.00
Distance (kilometer) traveled byplane in past 12 months(median)
1000 4500 16,000 39,500 21,000 20,000 7000 0.00
% who choose to offset carbonemissions for at least 1 flight inpast 12 months
14 0 13 0 8 33 10 0.04
Number of return flights in past12 months with businesspurpose (median)
0 0 1 3 0 1 0.0 0.00
New Ecological Paradigm(theoretic range: 15–75)(mean)
52.5 49.8 44.8 51.7 52.6 53.3 50.5 0.00
aMeans are reported in the case of normally/symmetrically distributed variables and medians in the case ofskewed/non-normally distributed variables.bParametric tests (ANOVA) were performed for testing differences in means in the case of normally/symmetricallydistributed variables, non-parametric tests were performed for nominal variables (chi-square test) and for testingdifferences in medians in the case of skewed/non-normally distributed variables (Kruskal–Wallis test).
Dow
nloa
ded
by [
Bib
lioth
eek
TU
Del
ft],
[M
aart
en K
roes
en]
at 0
1:01
07
June
201
2
10 M. Kroesen
of their flying behavior on the total carbon emissions related to their consumption (6), norhave they really considered the effects of their flying behavior on the climate (7). Likesubjects in factor A, subjects in this factors claim to fly little (8), which is again supportedby their actual flying behavior (Table 3). Overall, it seems that whatever dissonance existsbetween their flying behavior and their concern for the climate, it is resolved through astrategy of ignorance. While acknowledging the effects of human activity on the climate,subjects in this factor reduce the dissonance by claiming to be ignorant of the effects oftheir own behavior.
Consistent with this strategy of ignorance subjects do not feel guilty with respect totheir flying behavior (20 and 21), nor do they feel the need to reduce their consumption(34). Insofar as there is any need to reduce consumption, subject delegate the responsibilityto the government (29).
With a median figure of 4,500 kilometers flown in the past 12 months subjects in thisfactor fly slightly more than those in factor A (Table 3). While, compared to subjects in factorA, subjects in factor B have less doubt that human-induced climate change is happening (1and 2), the average general environmental concern as indicated by the NEP-scale is lowerthan in factor A.
Overall, subjects in factor B are less environmentally conscious and adopt a strategy ofignorance with respect to the effects of their flying behavior.
Factor C: denial
In contrast to subjects in the previous two factors, subjects in factor C (16% of the sample)do not claim to fly little or not at all (8). Again, this is consistent with subjects’ actualbehavior which shows that the median number of flights of subjects assigned to this factorequals 4 (Table 3).
Subjects in factor C acknowledge the impacts of their behavior (6 and 7), but resolveany tension by denying climate change (1). If the climate does indeed change, they believeit to be a natural process (2). According to this viewpoint, climate change is not as urgentas other problems (4). All in all, subjects are very skeptical about climate change.
In line with the strategy of denial subjects strongly oppose government regulation in theform of taxes (24) or a quota on flights (23). Subjects are quite critical of the governmentand believe it actually abuses environmental problems to increase tax revenues (25).
The aviation industry’s lines of argument as identified by Gossling and Peeters (2007)most strongly resonate in this factor. Subjects believe air transports’ contribution in termsof carbon emissions to be relatively small compared to other industries (26), they view theindustry as a driver behind national and global economic development (27) and believe thatnew technology will probably be developed to mitigate climate change (28).
The cross-tabulation of the factors with the other variables of interest (Table 3) showsthat subjects in factor C are mostly men (78%) with high incomes (63% earns more than3500 euro per month). Compared to the other factors, subjects in this factor are leastconcerned about the environment.
Summarizing, subjects’ lack of concern for the environment in this factor is consistentwith their air travel behavior. A strategy of denial is used to prevent any inconsistencybetween attitude and behavior.
Factor D: necessity
Subjects in factor D (10% of the sample) belief the climate changes under the influence ofman (1) and acknowledge the impacts of their flying behavior (7). Like factor C, subjects do
Dow
nloa
ded
by [
Bib
lioth
eek
TU
Del
ft],
[M
aart
en K
roes
en]
at 0
1:01
07
June
201
2
Journal of Sustainable Tourism 11
not claim to fly little or not at all (8), which is consistent with their actual behavior (again themedian number of return flights equals 4). Subjects in factor D resolve the inconsistentlybetween their flying behavior and their concern for the climate by emphasizing that flyingis necessary to perform well at work (16). In line with this claim, the median number offlights with a business purpose equals 3 (Table 3).
This viewpoint externalizes responsibility by emphasizing that the government shouldstimulate green flying (29), that other countries (besides the Netherlands) can still achievemuch in reducing their emissions (30) and that there are no alternatives to flying (31).
Although subjects feel little need to reduce their own consumption (34), they moderatelyagree with the statement that the massive use of cheap trips is highly polluting (33) andthat radical societal change is necessary to deal with climate change (36).
Similar to factor C, subjects in factor D are mostly men (67%) with high incomes(47% earn more than 3500 euro per month) (Table 3). With a median of 39,500 kilometerssubjects in this factor flew the most in the past 12 months. While subjects have a relativelyhigh score on the NEP-scale (51.7), this attitude is not reflected in their flying behavior.
To conclude, subjects in this factor posit flying as a work-related necessity and thereforesee no possibility to align their flying behavior with their concern for the climate.
Factor E: guilt
Subjects assigned to this factor (8%) like to fly (14). In fact, they stress that visiting faraway countries is part of their lifestyle (15). Subjects in this factor do not claim to fly little(8), which, again, is consistent with their actual flying behavior (the median number of tripsmade in this factor equals 4).
Subjects slightly agree with the statement that the climate changes under the influenceof man (1), but do not rule out the possibility that it is actually a natural process (2).However, the feelings of guilt in this factor (20 and 21) show that subjects perceive a stronginconsistency between their flying behavior and their pro-environmental attitudes. In fact,these feelings of guilt can be regarded as subjects’ means to resolve the inconsistencybetween their behavior and their pro-environmental attitude.
Subjects in this factor are moderately in favor of increasing taxes on flying (24), butstrongly oppose setting a quota on the number of annual flights (23). They also expressfaith in technology to mitigate climate change (28 and 32).
Surprisingly, although subjects in this factor accept personal responsibility, they are notstrongly motivated to reduce their consumption in the future (34).
The majority of the subjects in factor E are women (67%) (Table 3). Subjects in thisfactor have a relatively high average score on the NEP-scale (52.6), which is not reflectedin their air travel behavior.
All in all, subjects in this factor acknowledge that their flying behavior is inconsistentwith their pro-environmental attitudes, but have no effective strategy to reconcile thisinconsistency other than feeling guilty about their behavior.
Factor F: indulgence/fatalism
Similar to subjects in factor E, subjects assigned to factor F (8% of the sample) like tofly (14) and stress that visiting far away countries is part of their lifestyle (15), which alsocorresponds with their flying behavior (the median number of trips made in this factorequals 3, Table 3).
Subjects believe that humans are responsible for climate change (1 and 2), but reactfatalistically by claiming that it is already too late to prevent climate change (17). This
Dow
nloa
ded
by [
Bib
lioth
eek
TU
Del
ft],
[M
aart
en K
roes
en]
at 0
1:01
07
June
201
2

12 M. Kroesen
orientation goes together with a strategy of indulgence; “we should enjoy flying while westill can” (12).
While subjects in this factor feel slightly guilty about their flying behavior (24 and 25),they also externalize responsibility by stressing that government action to address climatechange is insufficient (22). Again, subjects feel little need to reduce their consumption (34).
Compared to the other factors, subjects in this factor express the highest concern forthe environment as indicated by an average NEP-score of 53.3 (Table 3). Yet, this attitudeis not reflected in their air travel behavior.
To conclude, subjects in this factor are environmentally conscious, but at the same timereact fatalistically. This attitude reliefs them of having to change their behavior to align itwith their concern for the environment and actually supports a strategy of indulgence.
The younger sample
Tables 4 and 5 present the factor arrays of the younger sample and the cross-tabulation offactor membership with the other variables of interest, respectively. Given that the factorsin the younger sample reproduce (to a large extent) the factors found in the older sample,the discussion of the results will mainly focus on the differences. To highlight these, thosefactor scores for which the absolute difference between the factors equals or is greater thanone standard deviation are presented in bold (see Table 4). In addition, statistics that differsignificantly between two respective factors are also marked (Table 5).
With a correlation coefficient of 0.80, the first factor in the younger sample correlatesstrongly with factor C (denial) in the older sample. The percentage assigned to this factorin the younger sample (31%) is almost twice as high as the percentage assigned to it in theolder sample (16%). Based on the differences in the factor scores, it can be observed thatprice plays a more important role for younger subjects (11). This can be explained by thefact that the average income in the younger sample is much lower than in the older one.Another notable difference is that for young subjects in the denial factor visiting far awaycountries is a (self-proclaimed) part of their lifestyle, whereas this was not the case for theolder sample (15). Subjects in the younger sample fly less than their older counterpartsin factor C, but the differences in medians are not significant. Their mean score on theNEP-scale (44.9) is also not significantly different from older subjects (44.8). Overall, thefindings support the notion that a substantial portion of young adults is already accustomedto a frequent flying lifestyle (Shaw & Thomas, 2006) and that they use a strategy of denialto prevent inconsistencies between their air travel behavior and any environmental beliefs.
The second factor in the younger sample reproduces factor A (integration) in the oldersample; the correlation coefficient between the factor scores equals 0.81. In the youngsample, 29% of the respondents are assigned to factor A, corresponding well with thepercentage assigned to it in the older sample (30%). Observing the differences in factorscores, price, again, plays a more important role for younger subjects (11). In addition,whereas older subjects support a maximum quota on flights, younger subjects resist suchmeasures (23). Again, younger and older subjects do not significantly differ in their airtravel behavior. Younger subjects in factor A have a relatively high score on the NEP-scale(49.2) compared to the young sample as a whole, but significantly lower than their oldercounterparts in factor A (52.5). To conclude, with several differences in factor scores aconsistent portion of the population across the two generations can be assigned to factor A.
The third factor in the younger sample correlates strongly (0.77) with factor B in theolder sample, which was labeled as “ignorance”. 16% of the young subjects are assignedto this factor, somewhat less than the percentage assigned to it in the older sample (22%).
Dow
nloa
ded
by [
Bib
lioth
eek
TU
Del
ft],
[M
aart
en K
roes
en]
at 0
1:01
07
June
201
2

Journal of Sustainable Tourism 13
Table 4. Factor arrays of younger sample (standardized scores)
Factor
No. Statement C A B E
1. I believe the climate changes under theinfluence of man.
–0.2 0.9 1.3 1.7
2. Assuming that the climate indeed changesthis is probably a natural process.
1.1 –0.1 –1.2 –1.0
3. I am well informed about the problem ofclimate change.
0.8 0.8 –1.6 0.8
4. The climate problem is not as urgent as otherproblems (e.g. worldwide poverty).
0.7 –0.3 –1.0 –1.4
5. Probably the effects of climate change willonly become visible in dozens of years.
0.1 –0.2 1.0 –0.9
6. I know what the contribution of my air travelbehavior is on the total carbon emissionassociated with my consumption.
0.7 1.2 –2.5 0.1
7. I never really thought about the effects of myflying behavior on the climate.
–0.1 –1.3 2.5 –1.0
8. I fly very little (or not at all). For me it iseasier to save in other areas.
–0.4 2.4 –0.2 –2.4
9. Compared to others I have an ecologicallysound lifestyle.
–0.4 1.2 –0.6 –0.5
10. I mainly contribute to the environmentthrough local actions (e.g. cycling, buyingecological products or reducing energy useat home).
–0.4 0.9 –0.5 1.0
11. Nowadays flying is affordable for manypeople. The price plays an important role inmy decision to fly.
1.0 0.7 0.8 0.7
12. Flying will probably become more expensivein the future. We should enjoy it while westill can.
0.3 –1.6 0.7 –0.5
13. I do not include considerations with respectto climate in my decision to fly.
1.2 –0.2 1.8 –0.2
14. I like flying. 1.3 0.3 0.2 1.015. Visiting far countries is part of my lifestyle. 0.9 –2.1 –0.9 2.616. To perform well at work, it is necessary that I
fly.–0.3 –2.1 –1.6 0.5
17. It is already too late to prevent climatechange.
–0.4 –1.3 –0.7 –1.3
18. My contribution is as a drop in the ocean.There is not much I can do.
0.7 –0.4 0.5 –1.1
19. I can do little to change my flying behavior. 0.6 –0.3 –0.4 –0.920. Sometimes I feel guilty about the effects of
my flying behavior on the environment.–1.8 –1.0 –0.9 0.4
21. My philosophy is in conflict with my flyingbehavior.
–1.9 –1.1 –0.4 0.6
22. Government action to address climate changeis insufficient.
–0.8 0.6 0.4 0.9
23. The government should set a maximum quotafor the number of flights a person isallowed to make each year.
–2.3 –1.0 0.2 –1.3
24. The government should tax flying more andinvest the revenues in the development ofclean technologies.
–1.9 0.7 0.5 –0.1
(Continued on next page)
Dow
nloa
ded
by [
Bib
lioth
eek
TU
Del
ft],
[M
aart
en K
roes
en]
at 0
1:01
07
June
201
2
14 M. Kroesen
Table 4. Factor arrays of younger sample (standardized scores) (Continued)
Factor
No. Statement C A B E
25. I believe the government abusesenvironmental problems to increase taxrevenues.
0.5 –0.5 –0.6 –1.2
26. I believe the contribution of air traffic to thetotal carbon emissions is relatively smallcompared to car traffic or the bio-industry.
0.9 –0.5 –0.4 –0.3
27. The aviation industry is a driver behind thenational and global economy.
1.4 0.3 0.2 0.4
28. New technology will most likely be developedthat will help us mitigate climate change.
1.0 0.3 0.5 –0.1
29. The government should stimulate “green”flying. Individual citizens are powerless.
–0.5 0.7 1.0 1.0
30. The Netherlands already is a clean andenvironmentally friendly country. Othercountries can still achieve a lot in reducingtheir CO2 emissions.
1.0 0.1 –0.1 –0.3
31. Flying is the only option to cover largedistances.
0.8 –0.8 1.3 0.4
32. By investing in the European high-speed trainnetwork a shift from air to rail may beaccomplished.
–0.1 0.9 0.4 0.3
33. The massive use of cheap trips for shortholidays or city trips is highly polluting.Eventually, we cannot afford this anymore.
–1.1 0.7 0.2 0.2
34. I find it important to reduce my consumption. –1.2 0.4 –0.7 0.635. The continuous growth in consumption is the
most important barrier for sustainabledevelopment.
–0.5 1.0 0.0 0.3
36. Radical societal change is necessary to dealwith the climate problem.
–0.6 0.6 0.7 0.9
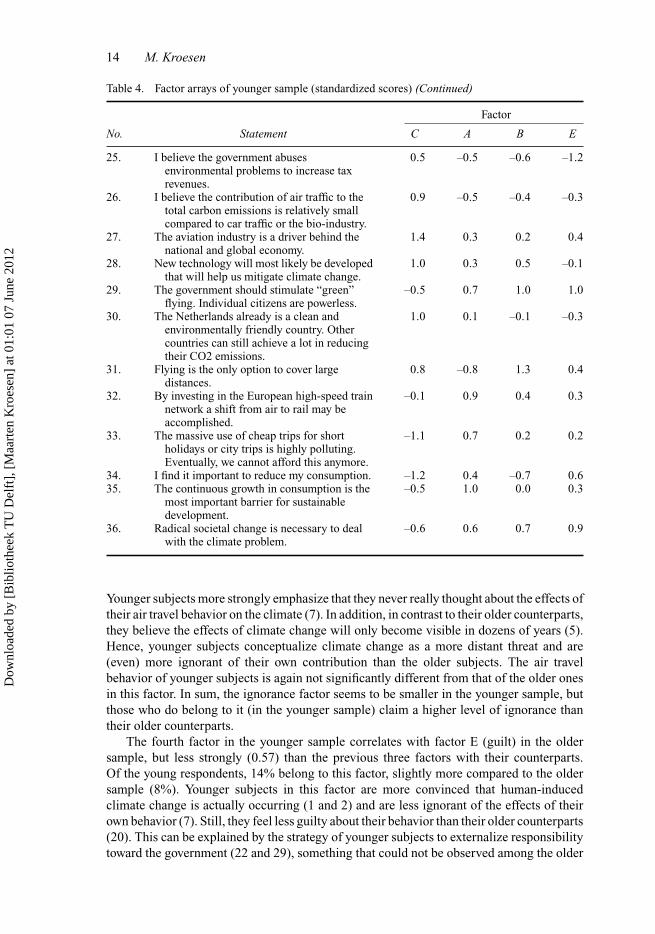
Younger subjects more strongly emphasize that they never really thought about the effects oftheir air travel behavior on the climate (7). In addition, in contrast to their older counterparts,they believe the effects of climate change will only become visible in dozens of years (5).Hence, younger subjects conceptualize climate change as a more distant threat and are(even) more ignorant of their own contribution than the older subjects. The air travelbehavior of younger subjects is again not significantly different from that of the older onesin this factor. In sum, the ignorance factor seems to be smaller in the younger sample, butthose who do belong to it (in the younger sample) claim a higher level of ignorance thantheir older counterparts.
The fourth factor in the younger sample correlates with factor E (guilt) in the oldersample, but less strongly (0.57) than the previous three factors with their counterparts.Of the young respondents, 14% belong to this factor, slightly more compared to the oldersample (8%). Younger subjects in this factor are more convinced that human-inducedclimate change is actually occurring (1 and 2) and are less ignorant of the effects of theirown behavior (7). Still, they feel less guilty about their behavior than their older counterparts(20). This can be explained by the strategy of younger subjects to externalize responsibilitytoward the government (22 and 29), something that could not be observed among the older
Dow
nloa
ded
by [
Bib
lioth
eek
TU
Del
ft],
[M
aart
en K
roes
en]
at 0
1:01
07
June
201
2

Journal of Sustainable Tourism 15
Table 5. Cross-tabulation of factor membership and variables of interest (younger sample)
Factor
Variablea C A B E Sample Signb
N 106 101 57 47 347 –% female 25 37 54 51 38 0.00Age (mean) 21.3c 20.9c 20.5c 22.3c 21.2c 0.01% income above 1000 euro 19c 8c 11c 26c 16c 0.02Number of return flights in past 12
months (median)2 1 2 3 1 0.00
Distance (kilometer) traveled byplane in past 12 months (median)
8000 2000 5000 17,000 5000 0.00
% who choose to offset carbonemissions for at least 1 flight inpast 12 months
3c 4c 4 17 5c 0.00
Number of return flights in past 12months with business purpose(median)
0c 0c 0 0 0c 0.26
New Ecological Paradigm (theoreticrange: 15–75) (mean)
44.9 49.2c 48.6 53.8 48.2c 0.00
aMeans are reported in the case of normally/symmetrically distributed variables and medians in the case ofskewed/non-normally distributed variables.bParametric tests (ANOVA) were performed for testing differences in means in the case of normally/symmetricallydistributed variables, non-parametric tests were performed for nominal variables (chi-square test) and for testingdifferences in medians in the case of skewed/non-normally distributed variables (Kruskal–Wallis test).cPercentage, mean or median is significantly different ( p < 0.05) from respective statistic in older sample(Table 3).
subjects in this factor. Respondents’ air travel behavior is again similar to that of their oldercounterparts. To conclude, younger subjects in the guilt factor are more convinced abouthuman-induced climate change, but accept less personal responsibility than older subjects:they externalize part of the responsibility toward the government.
It can be concluded that the structure of subjectivity with regard to aviation and climatechange is more complex among older subjects than among younger ones. Two older samplespecific factors were revealed: necessity and indulgence. The lack of the necessity factorin the younger sample is obvious: younger subjects simply do not have to travel by airfor work-related purposes. The reason for the absence of the indulgence factor is lessstraightforward. One plausible explanation, however, is that the fatalistic/cynical positionin this factor (i.e. “it is already too late to deal with climate change”) is one which needstime to develop. Empirical evidence in favor of this explanation has been reported by Agger,Goldstein, and Pearl (1961), who found that political cynicism increases with age. It seemsplausible that a similar relationship holds for environmental cynicism.
Discussion
This section relates the findings to previous research on attitude-behavior inconsistency,and discusses the limitations of the current study.
The analysis shows that there is no association between general environmental awarenessand air travel behavior. The Spearman’s rank order correlation between the distance traveledby air and the NEP-scale in the sample as a whole equals 0.057 (n.s.), a result consistentwith Holden and Linnerud (2011) who also found no significant relationship between thetwo variables.
Dow
nloa
ded
by [
Bib
lioth
eek
TU
Del
ft],
[M
aart
en K
roes
en]
at 0
1:01
07
June
201
2

16 M. Kroesen
In the 1970s, much research focused on explaining inconsistencies between people’sattitudes and their behaviors (Gross & Niman, 1975; Schuman & Johnson, 1976; Wicker,1971). A range of factors have been identified which either attenuate the attitude-behaviorrelationship or, in addition to attitudes, influence behavior. The present study adds tothis research by revealing how subjects from their own standpoint resolve inconsistencybetween, in this case, their air travel behavior and their concern for the climate change. Guiltand indulgence, for example, effectively reconcile the two. Due to these “counterintuitive”factors (i.e. high environmental awareness and high consumption of air trips) there is norelation between environmental attitude and air travel behavior in the sample as a whole.
This result can be placed in the context of Billig’s (1987) rhetorical approach to socialpsychology, which posits that attitudes are not merely reflections of a person’s inner psyche,but represent positions taken in public debate. The social viability of these positions dependon their degree of consistency (an inconsistent viewpoint is easily attacked by others), butis not a necessary condition for its “survival”. The guilt factor illustrates this. Within thisfactor subjects actually acknowledge their inconsistency (statement 21: “My philosophyis in conflict with my flying behavior”). This acknowledgement does not lead, as manycognitive consistency theories (implicitly) assume, to an insurmountable psychologicaltension, but actually forms a powerful argument in relation to the other viewpoints, e.g. tothose who ignore or deny the discrepancy. It is as if to say “I am inconsistent, but you areeven more inconsistent given that you do not even acknowledge your inconsistency”. Insum, there is plenty of scope for people, as argumentative beings, to resolve inconsistencybetween attitude and behavior to the point that a defensible viewpoint can be formed andcommunicated. Within this process acknowledging inconsistency can even be a successfulstrategy in developing a defensible viewpoint.
Several limitations and related directions for future research can be identified. Thefirst relates to the sample of the study, which poorly reflects the general population ofDutch citizens. Due to the large variation in air travel behavior in the sample (a variablewhich strongly correlates with the varying viewpoints) there is confidence that at least themain viewpoints are revealed. Nevertheless, given the bias in education level, it might bethat some viewpoints among people with a low education level have been missed. It isalso reasonable to expect that the proportions assigned to each factor are different in thegeneral population. The proportion assigned to the necessity factor (those who fly often forwork-related purposes) is likely to be smaller in the general population. To address thesequestions, the present study should be repeated using a probability sample.
The second limitation and research direction relates to the use of separate (Likert) scalesto let respondents score the varying statements. As mentioned previously, the conventionalprocedure in Q is to use a forced distribution in which subjects have to rank-order thevarying statements on a single scale (Stephenson, 1936). This procedure assumes thatmeasurement and the ascription of meaning (by respondents) are processes that cannotbe separated; meaning arises when all statements are measured in interaction. It can becounter-argued, however, that the statements of the concourse are already in interaction(inline with Billig’s rhetorical approach). The empirical analyses also show that coherentand clearly interpretable factors can be extracted on the basis of freely scored statements.Nevertheless, an interesting research direction would be to use a forced distribution andexamine whether other or more distinct factors would emerge.
Conclusions and implications for practice
Six viewpoints toward aviation and climate change were revealed via Q-factor analysis:(A) integration, (B) ignorance, (C) denial, (D) necessity, (E) guilt and (F) indulgence.
Dow
nloa
ded
by [
Bib
lioth
eek
TU
Del
ft],
[M
aart
en K
roes
en]
at 0
1:01
07
June
201
2

Journal of Sustainable Tourism 17
These results add to our understanding of attitude-behavior inconsistency by revealing howsubjects from their own standpoint reconcile or prevent inconsistencies and can be used inpractice to design more effective sustainability discourses.
If the more mobile segments are compared (C, D E and F), the denial factor, whichdenies personal responsibility, is the most popular viewpoint to rationalize high consump-tion behavior. In both samples, it is more than twice as large as the guilt factor, whichdoes accept personal responsibility. Its popularity may be explained by speculating thatdenying responsibility is, in a psychological sense, less taxing than accepting it. However,its argumentative strength vis-a-vis the other factors may form an additional/alternativeexplanation. This will be clarified below.
The position taken by national governments of high-income countries with regard tothe environmental effects of aviation reflects the more general sustainability discourse theyhave adopted, qualified by Hobson (2002) as the “rationalisation of lifestyles” discourse.According to this, individuals should be able meet their own consumption needs while alsotaking into account the environmental impacts of their actions. Thus, this discourse doesnot question consumption as such (and actually reinforces it), but only requires that con-sumption is made “rational” by making people aware of the environmental consequences oftheir consumption and/or internalizing environmental externalities into the prices of goodsthrough taxes (the European Trading Scheme can, therefore, be seen as an institionalizationof this discourse).
According to Hobson (2002) the “rationalization of lifestyles” discourse puts undueweight on the individual, thereby deflecting attention from companies that largely determinethe environmental performance of production chains. More generally, it can be argued thatby legitimizing consumption on the one hand (consumption is good) and delegitimizing it onthe other (consumption leads to environmental destruction) the “rationalization of lifestyles”discourse is self-contradictory. It may be speculated that the denial factor draws its strengthsfrom these limitations. In the end, given the self-contradictory nature of the government’sdiscourse (i.e. the exemption of businesses and the double stance toward consumption),there is just cause to distrust the government and their environmental policies.
Should this line of reasoning prove correct (which requires additional empirical re-search to assess), an effective solution in getting the “sting” out of the denial position liesin developing more internally consistent sustainability discourses. According to Hobson(2002), a discourse revolving around social justice may be more in line with lay people’sperceptions. A transformation to such a discourse would be difficult, however, as it directlyundermines the foundations of our (capitalist) society. As an alternative to a total discursiveshift, strategies and policies may be pursued which would enhance the credibility of the“rationalization of lifestyle” discourse. For example, instead of (or in addition to) taxingair travel, governments could become much more active in directly affecting the chain ofproduction by providing incentives to develop more sustainable aircraft technologies. Inaddition, the double stance toward consumption could be countered by developing codesof “appropriate” flying behavior for civil servants. By showing leadership on this issuethe currently ambiguous line between “good” and “bad” (too much) consumption wouldbecome clear. The codes may be (voluntarily) adopted by businesses and eventually seepthrough to people’s private lives.
Notes1. A viewpoint is defined as an interrelated set of attitudes (arguments and feelings).2. The study of attitudinal patterns (instead of single attitudes) has also been suggested by Dickinson
and Dickinson (2006) who advocate a social representations approach to the study of (pro-environmental) behavior.
Dow
nloa
ded
by [
Bib
lioth
eek
TU
Del
ft],
[M
aart
en K
roes
en]
at 0
1:01
07
June
201
2

18 M. Kroesen
3. A Q-factor analysis has two advantages over cluster analysis. The first is that the factor analysis istheoretically and mathematically better founded than cluster analysis. In effect, it is less suscepti-ble to sampling fluctuations, which, in turn, enhances the reproducibility of the results. The secondadvantage is that factor analysis allows subjects to be (moderately) associated with a number oftypes or with no type at all, while cluster analysis assumes that subjects are always maximallyassociated with one type and not with other categories. This assumption is unlikely to hold empir-ically. Given these advantages factor analysis is to be preferred over cluster analysis. Comparingfactor analysis and latent class analysis it can be concluded that similar to factor analysis, latentclass analysis (as a model-based classification technique) is mathematically well founded. Latentclass models, however, become very complex with large numbers of indicators (>30), which, ineffect, can lead to identification problems. Factor analysis, on the other hand, does not suffer fromthis problem. Overall, a Q-factor analysis is therefore deemed the most suitable method for thisresearch.
4. http://forum.fok.nl/topic/979193/1/25 (last accessed on August 29, 2011).
Notes on contributorMaarten Kroesen is an Assistant Professor at the Section of Transport and Logistics at Delft Universityof Technology, the Netherlands. He has published numerous papers on the psychological effects ofaircraft noise in the residential environment. His current research interests cover people’s perspectiveson climate change and aviation, modeling fairness in choice experiments and advanced statisticalmethods (Q-methodology, latent class models and hierarchical linear models).
ReferencesAgger, R.E., Goldstein, M.N., & Pearl, S.A. (1961). Political cynicism-measurement and meaning.
Journal of Politics, 23(3), 477–506.Airbus. (2010). Global market forecast 2010–2029. Retrieved from http://www.airbus.com/
en/corporate/gmf2010/.Barr, S., Shaw, G., Coles, T., & Prillwitz, J. (2010). A holiday is a holiday: Practicing sustainability,
home and away. Journal of Transport Geography, 18(3), 474–481.Becken, S. (2004). How tourists and tourism experts perceive climate change and carbon-offsetting
schemes. Journal of Sustainable Tourism, 12(4), 332–345.Becken, S. (2007). Tourists’ perception of international air travel’s impact on the global climate and
potential climate change policies. Journal of Sustainable Tourism, 15(4), 351–368.Billig, M. (1987). Arguing and thinking: A rhetorical approach to social psychology. Cambridge:
Cambridge University Press.Blake, J. (1999). Overcoming the “value-action gap” in environmental policy: Tensions between
national policy and local experience. Local Environment, 4(3), 257–278.Boeing. (2010). Current market outlook 2011-2030. Seattle: Boeing. Retrieved from http://www.
boeing.com/commercial/cmo/.Bows, A., & Anderson, K.L. (2007). Policy clash: Can projected aviation growth be reconciled with
the UK Government’s 60% carbon-reduction target? Transport Policy, 14(2), 103–110.Brown, S.R. (1980). Political subjectivity: Applications of Q methodology in political science. New
Haven: Yale University Press.Cardiff University (2010). Energy futures and climate change survey 2010. Retrieved from Re-
trieved August 29, 2010 from http://www.ipsos-mori.com/Assets/Docs/Polls/climate-change-still-high-on-publics-agenda-topline.pdf
Cohen, S.A., & Higham, J.E.S. (2011). Eyes wide shut? UK consumer perceptions on aviation climateimpacts and travel decisions to New Zealand. Current Issues in Tourism, 14(4), 323–335.
Cohen, S.A., Higham, J.E.S., & Cavaliere, C.T. (2011). Binge flying. Behavioural addiction andclimate change. Annals of Tourism Research, 38(3), 1070–1089.
Dickinson, J.E., & Dickinson, J.A. (2006). Local transport and social representations: Challengingthe assumptions for sustainable tourism. Journal of Sustainable Tourism, 14(2), 192–208.
Dickinson, J.E., Robbins, D., & Lumsdon, L. (2010). Holiday travel discourses and climate change.Journal of Transport Geography, 18(3), 482–489.
Dow
nloa
ded
by [
Bib
lioth
eek
TU
Del
ft],
[M
aart
en K
roes
en]
at 0
1:01
07
June
201
2

Journal of Sustainable Tourism 19
Dubois, G., & Ceron, J.P. (2006). Tourism/leisure greenhouse gas emissions forecasts for 2050:Factors for change in France. Journal of Sustainable Tourism, 14(2), 172–191.
Dunlap, R. E. (2008). The new environmental paradigm scale: From marginality to worldwide use.Journal of Environmental Education, 40(1), 3–18.
Dunlap, R.E., Van Liere, K.D., Mertig, A.G., & Jones, R.E. (2000). Measuring endorsement of thenew ecological paradigm: A revised NEP scale. Journal of Social Issues, 56(3), 425–442.
Gossling, S., Bredberg, M., Randow, A., Sandstrom, E., & Svensson, P. (2006). Tourist perceptions ofclimate change: A study of international tourists in Zanzibar. Current Issues in Tourism, 9(4-5),419–435.
Gossling, S., Haglund, L., Kallgren, H., Revahl, M., & Hultman, J. (2009). Swedish air travellersand voluntary carbon offsets: Towards the co-creation of environmental value? Current Issues inTourism, 12(1), 1–19.
Gossling, S., & Peeters, P. (2007). “It does not harm the environment!” An analysis of industrydiscourses on tourism, air travel and the environment. Journal of Sustainable Tourism, 15(4),402–417.
Gross, S.J., & Niman, C.M. (1975). Attitude-behavior consistency–review. Public Opinion Quarterly,39(3), 358–368.
Group, A. (2009). A sectoral approach to addressing international aviation emissions. RetrievedAugust 29, 2009 from http://www.agdgroup.org/pdfs/090609_AGD_Discussion_Note_2.0.pdf
Hares, A., Dickinson, J., & Wilkes, K. (2009). Climate change and the air travel decisions of UKtourists. Journal of Transport Geography.
Higham, J.E.S., & Cohen, S.A. (2011). Canary in the coalmine: Norwegian attitudes towards climatechange and extreme long-haul air travel to Aotearoa/New Zealand. Tourism Management, 32(1),98–105.
Hobson, K. (2002). Competing discourses of sustainable consumption: Does the “rationalisation oflifestyles” make sense? Environmental Politics, 11(2), 95–120.
Holden, E., & Linnerud, K. (2011). Troublesome leisure travel: The contradictions of three sustainabletransport policies. Urban Studies, 48(4), 1–20.
Lassen, C. (2010). Environmentalist in business class: An analysis of air travel and environmentalattitude. Transport Reviews, 30(6), 733–751.
Lee, D.S., Fahey, D.W., Forster, P.M., Newton, P.J., Wit, R.C.N., Lim, L.L., et al. (2009). Aviation andglobal climate change in the 21st century. Atmospheric Environment, 43(22-23), 3520–3537.
Lorenzoni, I., Nicholson-Cole, S., & Whitmarsh, L. (2007). Barriers perceived to engaging with cli-mate change among the UK public and their policy implications. Global Environmental Change-Human and Policy Dimensions, 17(3 and 4), 445–459.
Mair, J. (2011). Exploring air travellers’ voluntary carbon-offsetting behaviour. Journal of SustainableTourism, 19(2), 215–230.
McKercher, B., Prideaux, B., Cheung, C., & Law, R. (2010). Achieving voluntary reductions in thecarbon footprint of tourism and climate change. Journal of Sustainable Tourism, 18(3), 297–317.
Miller, G., Rathouse, K., Scarles, C., Holmes, K., & Tribe, J. (2010). Public understanding ofsustainable tourism. Annals of Tourism Research, 37(3), 627–645.
Randles, S., & Mander, S. (2009). Aviation, consumption and the climate change debate: Are yougoing to tell me off for flying? Technology Analysis and Strategic Management, 21(1), 93–113.
Schuman, H., & Johnson, M. P. (1976). Attitudes and behavior. Annual Review of Sociology, 2,161–207.
Scott, D., Peeters, P., & Gossling, S. (2010). Can tourism deliver its “aspirational” greenhouse gasemission reduction targets? Journal of Sustainable Tourism, 18(3), 393–408.
Semenza, J.C., Hall, D.E., Wilson, D.J., Bontempo, B.D., Sailor, D.J., & George, L.A. (2008). Publicperception of climate change: Voluntary mitigation and barriers to behavior change. AmericanJournal of Preventive Medicine, 35(5), 479–487.
Shaw, S., & Thomas, C. (2006). Social and cultural dimensions of air travel demand: Hyper-mobilityin the UK? Journal of Sustainable Tourism, 14(2), 209–215.
Stephenson, W. (1935). Technique of factor analysis. Nature, 136, 297.Stephenson, W. (1936). The foundations of psychometry: Four factor systems. Psychometrika, 1(3),
195–209.Stephenson, W. (1953). The study of behavior: Q-technique and its methodology. Chicago, IL:
University of Chicago Press.Stephenson, W. (1978). Concourse theory of communication. Communication, 3(1), 21–40.
Dow
nloa
ded
by [
Bib
lioth
eek
TU
Del
ft],
[M
aart
en K
roes
en]
at 0
1:01
07
June
201
2
20 M. Kroesen
Stern, P.C. (2000). Toward a coherent theory of environmentally significant behavior. Journal ofSocial Issues, 56(3), 407–424.
Stoll-Kleemann, S., O’Riordan, T., & Jaeger, C.C. (2001). The psychology of denial concerningclimate mitigation measures: Evidence from Swiss focus groups. Global Environmental Change,11(2), 107–117.
Wicker, A.W. (1971). Examination of other variables explanation of attitude-behavior inconsistency.Journal of Personality and Social Psychology, 19(1), 18.
Dow
nloa
ded
by [
Bib
lioth
eek
TU
Del
ft],
[M
aart
en K
roes
en]
at 0
1:01
07
June
201
2