
Exploring Marketing Strategies for Agricultural Tourism Farmers in the
41
Exploring Marketing Strategies for Agricultural Tourism Farmers in the Commonwealth of Massachusetts and the State of Vermont Marlow A. Duffy University of Vermont College of Agriculture and Life Sciences Department of Community Development and Applied Economics Acknowledgment: Kenneth Bauer, Assistant Professor, CDAE Department Alan Howard, University of Vermont, Information Technology Specialist Jane Kolodinsky, Professor, CDAE Department Chairperson Kathleen (Chyi-Lyi) Liang, Research Mentor, Associate Professor, CDAE Department Brenda Tessmann, Lecturer, Honors College Director, Microbiology & Molecular Genetics Qingbin Wang, Associate Professor, CDAE Department
Transcript of Exploring Marketing Strategies for Agricultural Tourism Farmers in the

Exploring Marketing Strategies for Agricultural Tourism Farmers in the Commonwealth of Massachusetts and the State of Vermont
Marlow A. Duffy
University of Vermont College of Agriculture and Life Sciences
Department of Community Development and Applied Economics
Acknowledgment: Kenneth Bauer, Assistant Professor, CDAE Department Alan Howard, University of Vermont, Information Technology Specialist Jane Kolodinsky, Professor, CDAE Department Chairperson Kathleen (Chyi-Lyi) Liang, Research Mentor, Associate Professor, CDAE Department Brenda Tessmann, Lecturer, Honors College Director, Microbiology & Molecular Genetics Qingbin Wang, Associate Professor, CDAE Department

Exploring Marketing Strategies for Agricultural Tourism Farmers in the
Commonwealth of Massachusetts and the State of Vermont
This research explores the current marketing strategies for agri-tourism in Massachusetts
and Vermont. Questions include, the demographics of agri-tourism farms, operations
Massachusetts and Vermont farms are involved in, marketing strategies that have and have not
been successful for agri-tourism in Massachusetts and Vermont, and the impact of agri-tourism
on Massachusetts and Vermont farms.
Results show Massachusetts farms use fewer marketing methods than Vermont farms.
Both Massachusetts and Vermont farms agreed they were better off financially from agri-
tourism. In Massachusetts, agri-tourism does not have a very positive impact on the quality of
the operator or their family’s life, whereas it does in Vermont.
Agricultural Tourism Massachusetts Department of Agricultural Resources Massachusetts Office of Travel and Tourism Vermont Farms Association Vermont Department of Agriculture, Food, and Markets

Introduction of Issue
Agricultural businesses endure many hardships when fuel costs soar, weather conditions
are poor, and business is slow. Agricultural tourism merges the world of travel with experiences
of food and farming production1. According to the Small Farm Center at the University of
California, agri-tourism refers to a commercial enterprise at a working farm, ranch, or
agricultural plant conducted for the enjoyment of visitors that generates supplemental income for
the owner2. A few examples of agri-tourism include farm tours for families and school children,
hands-on chores, self-harvesting produce, hay or sleigh rides, and overnight stays in a farm-
based bed and breakfast3. The definition of agri-tourism is broad with both a roadside stand
selling harvested produce and an elaborate educationally-based operation open to school group
tours both qualifying. This research investigates the promotion of agri-tourism operations in
both the Commonwealth of Massachusetts and the State of Vermont through analysis of a four
page survey distributed to selected Massachusetts and Vermont agri-tourism farms.
Objectives
The findings of this research will provide Massachusetts and Vermont agri-tourism
farmers with an exploratory study of the differences in demographics, marketing strategies, and
the success of those strategies related to agri-tourism operations in both states. This research is
not designed to analyze similarities and differences in results, but to collect and present the facts. 1 LeBlanc, R. “Agri-Tourism Program and Farms.” Commonwealth of Massachusetts
Department of Agricultural Resources, 2007. Online. Available at http://www.mass.gov/agr/markets/agritourism/index.htm
2 “Agritourism and Nature Tourism in California.” Pg. 339, Small Farm Center, University of
California, Davis, 1999. 3 Rural Tourism: Small Towns and Villages Appeal to U.S. Travelers.” Travel Industry
Association of America, Washington, DC, 2001.

Exploring the successes, as well as the weaknesses the state of Vermont has faced with
agri-tourism is an aim of this research. Vermont’s agri-tourism success, specifically the
Vermont Farms Association, can serve as a model for Massachusetts farmers. Through the
exploration of private and government programs currently in place for promoting and supporting
agriculture in both Massachusetts and Vermont, the Commonwealth of Massachusetts agri-
tourism industry can flourish from improved marketing strategies.
The Massachusetts Office of Travel and Tourism works with other New England tourism
offices on joint programs4. A collaborative partnership between the Massachusetts Office of
Travel and Tourism and the Vermont Department of Travel and Tourism is a potential
opportunity that requires further examination to increase the promotion of agri-tourism within
each state.
Central Research Questions
What are the demographics of agri-tourism farms in Massachusetts and Vermont? What
agri-tourism operations are Massachusetts and Vermont farms involved in? What marketing
strategies have and have not been successful regarding agricultural tourism in the
Commonwealth of Massachusetts and the state of Vermont? How has involvement in agri-
tourism impacted Massachusetts and Vermont farms?
4 Wall, B. “Massachusetts Travel Industry Report.” Massachusetts Office of Travel and Tourism, Boston, MA, 2006.

Background and Literature Review
The successful promotion of agricultural tourism in Vermont has increased revenue for
the state and local farmers5. The former Commissioner of the Vermont Department of
Agriculture, Food, and Markets, Mr. Leon Graves, stated that, “Agri-tourism in Vermont has
grown to a $10 million a year segment of the economy6. Much of this growth is a result of
people wanting to renew their connection to the land, to understand where their food originates,
and rediscover a connection to community” (6). The Vermont Farms Association is one way
Vermont agri-tourism farmers have successfully promoted their operations.
The Vermont Farms Association, founded in 1998, is supported under the Vermont
Agency of Agriculture, Food and Markets7. The Vermont Farms Association provides
educational opportunities about agriculture to the public through a website and brochure at an
annual membership cost of $400 (7). The website includes a picture of each farm, contact
information, directions, and a brief description of activities and products offered. The uniform
organization of the farms allows for effective navigation of information. All members have a
link to their own website where the business can diversify and include additional information.
No association currently exists in Massachusetts similar to, and at the professional level of the
Vermont Farms Association. Using the Vermont Farms Association to improve the
Massachusetts Bureau of Markets’ Agri-tourism website is a potential way to improve agri-
tourism operations in Massachusetts.
5 Davis, A. R. “Vermont Agri-Tourism 2002.” National Agricultural Statistics Service
Research Report, New England Agricultural Statistics Service, Concord, NH, 2004. 6 Liang, K. “Vermont Agri-Tourism Survey 2003.” Vermont Tourism Data Center, University of Vermont, 2003. 7 Kennett, B. “Working Farms Open to the Public.” Vermont Farms Association, Montpelier, VT, 2007-2008.

Under the Massachusetts Department of Agricultural Resources, programs do exist to
assist in the promotion of agri-tourism, such as the Massachusetts Grown program to encourage
the purchase of Massachusetts’ agricultural products; and the Agricultural Directional Signage
Program which facilitates the placement of directional farm signs along state roadways8. These
two programs are available to assist agri-tourism farms, but the web marketing of both programs
is inadequate.
The Bureau of Markets exists under the Massachusetts Department of Agricultural
Resources. The Bureau of Markets, in cooperation with the University of Massachusetts
Extension and Massachusetts Office of Travel and Tourism, holds agri-tourism seminars to teach
farmers about agri-tourism as a means for expanding and diversifying their operations. Through
the use of marketing and educational activities, the Bureau encourages consumers to buy
Massachusetts food and agricultural products, and assists farmers with wholesale and direct
marketing9. Although the Bureau does have agri-tourism promotional activities in place, they
are limited and not operating to the best of their ability. The Massachusetts agri-tourism farms
page is disorganized and not engaging, with many links not operating. There are no visual
pictures of the agri-tourism farms, and for the farms that do have their own website, each website
is different and difficult to navigate.
8 LeBlanc, R. “Agricultural Directional Signage Program.” Commonwealth of Massachusetts Department of Agricultural Resources. Available at http://www.mass.gov/agr/markets/agritourism/signs.htm. 9 Petersen, D., W., Massachusetts Department of Agricultural Resources Commissioner, Bureau of Markets, 2008. Online. Available at www.mass.gov/agr.

Starting Agri-tourism
With the emergence of agri-tourism, farm operators have begun to think beyond crop
development and create an experience to sell at a retail price directly to the consumer10. The
following section discusses some of the potential pitfalls to consider prior to entering an agri-
tourism operation.
In order to successfully interact with the public, an agri-tourism enterprise requires
refined interpersonal relations skills as well as professional written and oral communication
skills11. More labor and the need for employees may also result from operating an agri-tourism
business (11). Increased marketing may interfere with normal farm activities, and hosting
visitors requires dealing with the public, which increases risk and liability (11). The business
operator must be well informed of the many aspects surrounding the safety and liability of
starting a new operation or expanding an existing one. Such aspects include understanding and
following local, state, and federal regulations regarding zoning, signage, food service, animal
exhibits, and health (11). In order to begin a successful agri-tourism business, protocol must be
met and laws must be carefully followed throughout the lifespan of the business.
Deciding to be involved in agri-tourism is not the best choice for every agricultural
operation. Operators of the business must understand that not all businesses are suitable for the
entry of visitors due to convenience of location, parking availability, employee availability,
increased regulations that must be followed, and time commitment involved. When a business is
10 Kline, C., D. Cardenas, Y.F. Leung, and S. Sanders, “Sustainable Farm Tourism: Understanding and Managing Environmental Impacts of Visitor Activities.” Journal of Extension 45, no. 2 (April 2007). Available at http://www.joe.org/joe/2007april/rb2.shtml. 11 Geisler, M. “Agritourism Profile.” Agricultural Marketing Resource Center. Iowa State University, July 2008.

open to the public environmental, health, and safety regulations must be strictly followed.
Operating under the eye of the public can sometimes bring about more stress for the business.
Agricultural businesses should analyze their finances prior to engaging in an agri-tourism
operation because diversifying activities can require high start-up costs (10). It is best that the
agricultural business understands their personal situation as well as the current market situation
before the decision is made to engage in an agri-tourism operation. Government programs and
outside organizations can have an immense impact on ensuring that research and educational
programs are available to farmers seeking involvement in agri-tourism.
Reasons for Offering Agri-tourism
Agri-tourism may be viewed as a strategy for improving the economic stability of rural
communities and farming enterprises (10). Rural landowners are searching for a means to
supplement their incomes; keep children working on the family farm, and act as a farming
ambassador to the urbanized visitors who are disconnected from their food source (10). Agri-
tourism is one tactic farm operators may choose to address these issues.
Low agricultural commodity prices, rising production costs, and the encroachment of
suburban development are all factors which have led farm families to explore agri-tourism12.
Agri-tourism offers opportunities to supplement income from farm production activities,
diversifies the income stream, and acts as a cushion against farm income fluctuations13.
12 Carpio, C.E, M.K. Wohlgenant, and T. Boonsaeng. “The Demand for Agritourism in the United States.” Journal of Agricultural and Resource Economics 33(2): 254-269, 2008. 13 Brown, D. M., and R. J. Reeder. “Farm-Based Recreation: A Statistical Profile.”
Economic Research Report No. 53, USDA/Economic Research Service, Washington, DC, December 2007.

Agricultural tourism provides an important niche market for farmers, but limited
information is available on the topic (13). In the rare instance that research has been conducted,
it often focuses on how a farm can start an agri-tourism operation and what to consider prior to
entering agri-tourism. Information regarding agri-tourism statistics throughout the U.S. and
within each state is difficult to obtain due to the broad definition of the topic (13). Often,
business owners do not realize their operation, such as selling their produce to the public or
managing a pick-your-own business, qualifies as agri-tourism (13).
Agri-tourism in the United States
In 2006, estimates of the U.S. farm income generated from agri-tourism ranged from
$800 million per year for small scale operations to $3 billion per year for large scale operations
(12). In 2004, agri-tourism provided income to approximately 52,000 U.S. farms, 2.5% of the
total number of farms in the U.S. (13). More recently, attractiveness of agri-tourism has been on
the rise throughout the U.S.14. Throughout New England, many farmers are becoming
increasingly creative about making their farms attractive to tourists by adding farm stands,
offering bus tours, corn mazes, bed and breakfasts, and recreational activities (1). Agri-tourism
might play a more important role in the future as a source of farm income and as a way for rural
communities to diversify and stimulate their economies (13).
14 Burrows, R., A. Fennell, M. Redlin, and L. Verschoor. “Agri-Cultural Tourism: Linking the Arts and Humanities with Agricultural Direct Marketers and Specialty Producers.” Journal of Extension 45, no. 6 (2007). Available at http://www.joe.org/joe/2007december/iw3.shtml.

Massachusetts Tourism Industry
The Massachusetts Office of Travel and Tourism is a state agency dedicated to promoting
Massachusetts as a travel destination in order to generate state and local tax revenues, create
jobs, and support the growth of travel-related businesses (4). Successful agri-tourism operations
attract visitors, and visitors will spend money therefore increasing revenue for Massachusetts.
Research on agricultural tourism benefit to state economies and the community in which the
farms are located is limited, and Massachusetts is no exception. In the year 2000 and 2002, the
State of Vermont published research through the National Agricultural Statistics Service
concerning agri-tourism impacts on the state15. In 2003, the Vermont Tourism Data Center
published a benchmark study of the economic impact of visitor expenditures on the Vermont
economy16. The Commonwealth of Massachusetts, however, was not surveyed by the same
service and similar data are not available.
Vermont Tourism Industry
Vermont’s tourist industry, which includes agri-tourism, represents 15% of the state’s
economy17. The Vermont tourism industry supports 36,470 jobs, approximately 1 in every 10
jobs in the state (16). Therefore, if agri-tourism operations in Vermont fail to grow and thrive,
state revenue will suffer and jobs will be cut.
15 Davis, A.R. United States Department of Agriculture, National Agricultural Statistics Service. Vermont Agri-Tourism 2000. USDA/NASS, Concord, NH, September 2001. 16 Vermont Tourism Data Center, Economic and Policy Resources. A Benchmark Study of the Economic Impact of Visitor Expenditure on the Vermont Economy. University of Vermont, Burlington, VT. 2003. 17 Wood, N., C. Halbrendt, K. Liang, and Q. Wang. “Interdependence of Agriculture and Tourism: Quantifying the Value of the Agricultural Working Landscape in Vermont.” Paper presented at annual meeting of the American Agricultural Economics Association, Tampa, FL, 30 July-2 August 2000.

Sustaining and further developing the working landscape that characterizes Vermont is a
state priority (7). Income from agri-tourism related activities on Vermont farms totaled $10.5
million in 2000, representing 2% of the total gross farm income generated in Vermont during
that year (15). In 2000, 31% of all farms in Vermont received income from agri-tourism (15).
These 2,100 farms received an average of $5,000 per farm from agri-tourism (15).
In 2002, income from agri-tourism related activities on Vermont farms totaled $19.5
million, representing 4% of total gross farm income generated in Vermont18. This was an 86%
increase from the value of agri-tourism in 2000 (18). In 2002, 33% of all farms in Vermont
received income from agri-tourism (18). These 2,200 farms received an average of $8,900 per
farm from agri-tourism (18).
The previous section included background information on agri-tourism, as well as a brief
history of agri-tourism in the United States, Massachusetts, and Vermont. The following
sections will discuss methodology, data collection, and conclude with discussion.
Methodology
A list of Massachusetts and Vermont farms was created based on the Massachusetts
Department of Agricultural Resources Agri-tourism website and the Vermont Farms Association
website. Of the total 295 farms listed on the 2007-2008 Massachusetts Agri-tourism Map, 67
Massachusetts farms were selected. The map was produced by the Massachusetts Department of
Agricultural Resources along with USDA Rural Development Office of Travel and Tourism (9).
Each farm selected engages in agricultural activities, welcomes visitors to their operation, and
sought promotion through the map (9).
18 Davis, A.R. United States Department of Agriculture, National Agricultural Statistics Service. Vermont Agri-Tourism 2002. USDA/NASS, Concord, NH, April 2004.

Any operation that wanted to be on the map was listed free of charge, but must be
involved in agri-tourism (1). As of September 2008, 434 farms in Massachusetts offer agri-
tourism activities, many of which are not listed on the 2007-2008 map (1). For the upcoming
2008-2009 Massachusetts Agri-tourism Map, the Massachusetts Department of Agricultural
Resources hopes to increase the number of farms listed from 295 to approximately 400 farms (1).
Several reasons explain why not all of the agri-tourism farms in Massachusetts are listed
on the map. One reason being the increase in the number of agri-tourism operations within the
last year. Second, a farm can be missed because the operation has not substantially advertised
and therefore the Massachusetts Department of Agricultural Resources did not know the business
exists. Another reason may be because some operations choose not to be on the map one year,
and decide to be on the map the following year (1).
All 295 farms from the map were not surveyed because the farms that operated private
vineyards, operated greenhouse or nursery facilities, had Christmas tree farms, or operated a
private equine facility were excluded. Exclusion of these farms was deemed necessary to have
similar farm samples between Massachusetts and Vermont. The Vermont Farms Association
permits only agri-tourism operations, and does not allow membership to private vineyards,
greenhouse or nursery facilities, Christmas tree farms, or private equine facilities.
Vermont farms were selected from the Vermont Farms Association brochure. All 69
farm members of the association were surveyed. Each farm provides agricultural education,
agricultural services, or sells agricultural products (7). Surveyed farms in Vermont were limited
to Vermont Farms Association members. This was decided because the Vermont Farms
Association is recognized for successful agri-tourism marketing strategies and was chosen as an
exemplary association to serve as a model for Massachusetts agri-tourism farms.

The results of this study only provide facts and information reported from the
respondents. The results should not be generalized to represent the agri-tourism population of
Massachusetts or the population of Vermont. This research represents a pilot study exploring
what the agri-tourism situation is in Massachusetts and Vermont and is not designed to discuss
what should be the situation and what should change. The Massachusetts confidence interval
was +/- 16.2% of the 24 returns out of 64 surveys. The Vermont confidence interval was
calculated to be +/- 9.8% from the 41 returns out of 69 surveys.
On March 28, 2008, 69 surveys were sent out to Vermont farms and 29 surveys were
returned on May 15, 2008 resulting in a 42% respondent rate. On April 4, 2008, 67 surveys were
sent out to Massachusetts farms and 3 were unable to forward, resulting in a total of 64 surveyed
farms. On May 15, 2008, 14 surveys were returned with a respondent rate of 22%.
In order to increase respondent rate and data reliability, the farms that did not participate
in the survey the first time were surveyed a second time on July 15, 2008. The second survey
was identical to the first, except for the cover page in which it stated, “This is the second time
you have been sent this survey in order to increase participation rate of those that did not
participate the first time. Again, your time is appreciated!!”
Surveys were returned by August 11, 2008. Of the Vermont Farms Association
members, 40 farms were surveyed the second time and 12 surveys were returned. The final
Vermont total was 41 returned surveys, including 3 returned but not applicable surveys. The
respondent rate for Vermont farms was 59%. As for Massachusetts agri-tourism farms, 50 farms
were surveyed a second time and 10 surveys were returned. The final Massachusetts total was
24 surveys, including 2 returned but not applicable. The respondent rate for Massachusetts farms
was 37%.

One issue noted on the comments section of the surveys by respondents from both states
was the issue of time available to take the survey. Several farmers expressed that they had been
filling out many surveys lately, and it was a busy time for them. No matter what season the
surveys were distributed in, farmers would be busy.
For the percentage of Massachusetts and Vermont agri-tourism farms surveyed compared
to the total number of agri-tourism farms in each state, 64 out of 434 Massachusetts farms
involved in agri-tourism were surveyed. This represents 15% of the agri-tourism farms in
Massachusetts. From that survey, 24 farms participated, representing 5% of the agricultural
tourism farms in Massachusetts (See Table 1).
For Vermont, 69 out of 2,200 farms involved in agri-tourism were surveyed. This
represents 3% of the agri-tourism farms in Vermont. From that survey, 41 Vermont farms
participated, or 2% of the agricultural tourism farms in Vermont (See Table 1).
Tests Used
Significance of results from questions was determined using the Pearson Chi-Square test
and Gamma test. The Pearson Chi-Square test was used for questions with nominal responses.
The Gamma test was used for questions with ordinal responses. P-values close to .1, .01 and .05
were considered most significant. The more significant the p-value, the greater the difference in
responses between Massachusetts and Vermont farms. If the p-value was close to 1.00 it
indicated the responses between the two states were the same. If the p-vales were not close to .1,
.05, or .01 it indicated the responses were not significant between the states. Significant
responses are evident in the tables with ** next to the question.
Data Analysis
Demographics
The demographics of farm operators in Massachusetts and Vermont were similar. Farm
operators in both states are predominately white and married with children. Out of the 67
surveyed farms in Massachusetts, 20 farms answered the gender question with 50% being female
and 50% being male. In Vermont, 37 of the 69 surveyed farms responded to the gender question
with 59.5% female and 40.5% male. Of the farms surveyed in Massachusetts and Vermont,
Vermont had a higher percentage of female operators and Massachusetts was divided almost
equally between genders.
In Massachusetts the most frequent operator age was 46-55 years old. For Vermont the
most frequent operator age was 56-65 years old. Vermont operators were overall older than
Massachusetts operators. Education levels for both states farms were similar with college being
the most frequent response to the highest education level completed.
Activities and Products Offered
Of the surveyed farms from the Massachusetts Agri-tourism Map, farm stands are the
most common operations related to agri-tourism. The second most common agri-tourism
activities are pick-your-own operations. Third are dairy farm operations open to the public,
which includes cows, goats, and llamas.
From the Vermont Farms Association brochure, of which all members were surveyed, the
most common operations related to agri-tourism are dairy farms open to the public, which
includes cows, goats and llamas. The second most common agri-tourism activity is farm stands;
followed by farm-based bed and breakfasts.

Farm Size and Business Structure
For Massachusetts farms the mean size in acres was 238.48. For Vermont, the mean farm
size in acres was 187.69. Massachusetts farms are overall larger than Vermont farms in terms of
acreage size.
The business structure of the farms in Massachusetts and Vermont did differ. In
Massachusetts a corporation structure was common with 40.90% response, and sole
proprietorship second with 36.40% response. In Vermont sole proprietorship was the most
frequent business structure with 52.60% of respondents choosing this form of business structure.
Funding Source for Operation
Monetary support for both Massachusetts and Vermont farms came from a family cash
reserve with 40.9% of farms from Massachusetts and 57.9% of farms from Vermont choosing
this form of funding source. As for loans, the most common loan used in Massachusetts was a
short term loan with 62.5% of farms using a short term loan. In Vermont, the most common loan
was a long term loan with 90% of farms using a long term loan.
Total Years of Operation of Farm (See Figure A.)
The most frequent response for Massachusetts and Vermont total years of operation of
farm was between 11 and 30 years; with 47.6% of farms from Massachusetts and 32.4% of farms
from Vermont. Massachusetts had 38.1% of farms in operation over 51 years while Vermont
had 13.5% of farms in operation over 51 years. In general, Massachusetts farms have been
operating longer than Vermont farms. In Massachusetts, 9.5% of farms began operating within
the last 10 years, whereas in Vermont 27% of farms began operating within the last 10 years.

Start Up Year of Agri-tourism Business (See Figure B.)
Massachusetts agri-tourism businesses have been in existence longer than the agri-
tourism businesses in Vermont. Of the businesses starting during 1970 or before, 23.5% of
Massachusetts farms began their agri-tourism business, and 9.4% of Vermont farms began their
agri-tourism business during or before 1970. For Massachusetts, the most frequent response was
between 1991 and 2000 with 47.1% of Massachusetts farms beginning their agri-tourism
business at this time. For Vermont, 34.4% of Vermont farms began their operation between
1971 and 1990 and this was the most frequent response.
Reasons for Offering Agri-tourism (See Table 2.)
Promoting farm tourism activities and promoting locally made products were significant
reasons for offering agri-tourism identified by both states. In Massachusetts, 35% of farms
agreed they offered agri-tourism to promote farm tourism activities. In Vermont, 62.2% of farms
agreed with the statement. Both Massachusetts and Vermont farmers agreed one reason they
offer agri-tourism is to promote locally made products, with 70% of farms from Massachusetts
and 68.4% of farms from Vermont. Responses to the remaining reasons for offering agri-tourism
were not significant between the states based on the chi square value. This means that of the
surveyed Vermont and Massachusetts farms, the responses to the remaining questions were not
significant because the response rates were low.
Farm Employment
In the employee section of the survey for Massachusetts, the mean number of full time
employees was 4, the mean number of part time employees was 12.52, and the mean number of

family members involved but not receiving regular salaries was 1.90. In Vermont, the mean
number of full time employees was 3.06, the mean number of part time employees was 4.53, and
the mean number of family members involved but not receiving regular salaries was 1.44. Of the
surveyed Massachusetts and Vermont farms, the most common form of employment was part
time. Massachusetts farms employed more people, which may be related to the farm size in
Massachusetts, which is overall larger in acreage compared to Vermont farms.
Total Sales from Farm Related Activities in 2007 (See Figure C.)
In Massachusetts, the most frequent response to total sales from farm related activities
was over $500,000 with 33.3% response. In Vermont, the most frequent response was less than
$50,000 with 27% response. Looking at the graph, there is a split distribution between the total
sales. Operations have either high total sales or low total sales; few farms total sales are between
$200,000 and $500,000. It is important to note that of the surveyed farms, the operations either
had high total sales or low total sales.
Total Operating Costs in 2007 (See Figure D.)
For total operating cost, 50% of Massachusetts farms said $250,000 and up in 2007 and
35.7% of Vermont farms said $250,000 and up in 2007. The findings show that agri-tourism
operations in both states have high operating costs. The graph depicts how operating costs are
distributed at both ends of the spectrum with either high total operating costs, or low total
operating costs. Few operations have an operating cost between $150,000 and $249,999. Using
the Spearman’s rho correlation in SPSS it was found that a correlation existed between total sales

in 2007 and total operating cost. The higher the operation’s total sales, the higher their total
operating cost.
Number of Tourists in 2007
For farms that have a high number of visitors, their operation has seen an increase in the
number of visitors for both Massachusetts and Vermont. For farms that have a smaller number
of visitors, their operations have seen no change in the number of visitors in Massachusetts and a
decrease in the number of visitors in Vermont. In Massachusetts and Vermont, the larger scale
operations are increasing in the number of visitors, whereas the smaller scale operations are
decreasing in the number of visitors.
In both states the most frequent response was more than 500 visitors and increasing with
62.5% from Massachusetts and 59.3% from Vermont responding this way. This is important to
note that the smaller scale operations are not maintaining their scale, but are in fact seeing a
decline in the number of visitors in Vermont and not seeing an increase in the number of visitors
in Massachusetts.
Promotional Methods (See Table 3.)
For the question asking whether or not the agri-tourism operation undertakes advertising,
both Vermont and Massachusetts farms said they did undertake advertising. One of the most
valuable sections of the survey concerned the methods of advertising the agri-tourism operation
used. In Massachusetts, 19% of farms said they did use the state government website. In
Vermont, 52.9% of Vermont farms said they did use the state government website.

Both Vermont and Massachusetts agri-tourism farms surveyed use their own website
with 61.9% from Massachusetts using their own website and 96.9% from Vermont using their
own website. Of the surveyed farms, the majority of those that responded are taking the time to
create their own websites and promote their operation.
For using a brochure or pamphlet to advertise, 42.9% of Massachusetts farms said they
did use this form of advertising; whereas 90.9% of Vermont farms said they did use this form of
advertising. Vermont overwhelmingly uses brochures and pamphlets to advertise. This may be
a result of the Vermont Farms Association’s brochure.
Another valuable question in the survey was whether or not the farms advertise in a local
farm association. In Massachusetts, 33.3% of farms said they did advertise in a local farm
association. In Vermont, 80.6% of farms said they did advertise in a local farm association. The
Vermont Farms Association was where the list of surveyed Vermont farms came from so this is
no surprise. The list of surveyed Massachusetts farms came from the Massachusetts Department
of Agricultural Resources. No similar association to the Vermont Farms Association exists in
Massachusetts.
For advertising in a regional tourism guide, 38.1% of Massachusetts farms said yes to
advertising in a regional tourism guide while 62.9% of Vermont farms said yes to advertising in
a regional tourism guide. More Vermont farms advertise in a regional tourism guide as
compared to Massachusetts farms.
Spend On Advertising in 2007 (See Figure E.)
For Massachusetts farms, the mean amount spent on advertising in 2007 was $4,829.29.
For Vermont farms, the mean amount spent on advertising in 2007 was $15,045.19. Of the

surveyed farms, 41.2% of Massachusetts farms spent between $0 and $1,000 on advertising in
2007. In Vermont, 37.5% of the surveyed farms spent $5001 and above on advertising in 2007.
Surveyed Massachusetts farms have higher total sales, approximately the same total operating
cost as Vermont farms, and spend less on advertising than Vermont farms.
Assessment of Agri-tourism Operations (See Table 4.)
Under the assessment of agricultural tourism operations section, the business is running
question was not determined significant due to low response rates. 50% of Massachusetts farms
and 72.2% of Vermont farms said about the same as expected. Of the surveyed agri-tourism
operations, both states agreed the business was neither running better than expected, nor worse
than expected.
For the sales are question the responses were determined significant with a 61.9% of
Massachusetts saying sales were about the same as expected, this means that sales were neither
better than nor worse than expected. For Vermont, 54.1% of farms said sales were about the
same as expected. Of the surveyed agri-tourism farms, operators were not surprised by the sales
of their agri-tourism business.
For the profits are and total costs are questions, the responses were not significant, but
52.6% of Massachusetts farms said profits and total costs were the same as expected and 51.4%
of Vermont farms said about the same as expected. For the total costs question, 57.9% of
Massachusetts farms said costs were better than expected and 42.1% of Massachusetts farms said
costs were about the same as expected. For Vermont, 47.2% of farms said costs were about the
same as expected.

In the last question, promotion and advertising plans are, 31.3% of Massachusetts farms
said promotion and advertising plans are very efficient and 50% said does not make any
difference. For Vermont, 54.5% of farms said promotion and advertising plans are very
efficient. Promotion and advertising plans are more efficient in Vermont than in Massachusetts,
as identified by the agri-tourism operators.
Challenges Being Involved in Agri-tourism Operation (See Table 5.)
In the challenges section of the survey many of the questions were determined
insignificant. The responses that were significant are analyzed below. Time consumption was a
challenge identified with being involved in agri-tourism and was determined significant. In
Massachusetts, 60% of farms agreed time consumption was a challenge in their agri-tourism
business and in Vermont 61.1% of farms agreed that time consumption was a challenge.
Both states significantly agreed several challenges were not challenges they faced being
involved with agri-tourism. First, for the challenge of limited knowledge about the market
situation, 100% of Massachusetts farms said it was not a challenge and 97.2% of Vermont farms
said this was not a challenge.
Similarly, 85% of Massachusetts farms and 83.3% of Vermont farms said limited
knowledge about farmers in other regions working in agri-tourism was not a challenge.
For the statement that agri-tourism activities interfere with my other agricultural
operation, 85% of Massachusetts farms agreed it was not a challenge they faced and 82.9% of
Vermont farms agreed it was not a challenge they faced in their agri-tourism operation.

Overall, the pressing challenges for farms involved in agri-tourism operations in
Massachusetts and Vermont are time consumption, difficulty in cash flow, and for Vermont,
finding efficient ad channels.
Support or Assistance from Other Organizations (See Table 6.)
In the support or assistance section of the survey many of the questions were determined
insignificant. Those questions that were significant are analyzed below. The question, is more
government support on marketing local agri-tourism needed, was not determined to be a
significant question between the two states, but the question itself is valuable to this research. In
Massachusetts, 40% of the farms agreed they would like to receive more government support on
marketing agri-tourism. In Vermont, 54.3% farms agreed they would like to receive more
government support on marketing agri-tourism.
Many of the responses determined significant were responses by both states saying they
did not wish to receive support or assistance in particular areas and that data is analyzed below.
As for support or assistance operators would like to receive from other organizations, lower
interest rate on loans was identified by 65% of Massachusetts farms replying not needed and
68.6% of the Vermont farms replying not needed.
For more research to provide information on increasing profitability and efficiency 75%
of Massachusetts and 77.1% of Vermont farms said more research in this area was not needed.
For more outreach programs for agri-tourism farmers to understand economic situation and
impacts on their operation, 80% of Massachusetts farms and 77.1% of Vermont farms agreed this
type of support was not needed. Overall, the agri-tourism operators in both states appear fairly
independent and did not indicate much support or assistance needed from outside organizations.

Agricultural Tourism Impact Statements (See Table 7.)
The final results of the survey are discussed below for the agri-tourism impact statements.
Many of the responses to the statements in this section were determined not to be significant due
to low response rate. The responses that were significant are analyzed below.
One statement under the impacts of agri-tourism section of the survey was, “I am better
off financially as a result of my agri-tourism decision.” In Massachusetts, 43.8% of farms agreed
with this statement. In Vermont 42.9% of farms agreed with this statement.
As for the statement, “Agri-tourism has a very positive impact on the quality of my life,”
31.3% of Massachusetts farms agreed with this statement and 60% of Vermont farms agreed
with this statement. This is a crucial response difference that agri-tourism does not very
positively impact Massachusetts agri-tourism farm operator’s quality of life and does very
positively impact Vermont agri-tourism farm operator’s quality of life.
For the statement, “The impact of agri-tourism has a very positive impact on the quality
of my family’s life,” 21.4% of Massachusetts farms agreed with this statement and 65.6% of
Vermont farms agreed with the statement. Based on the responses to this statement, agri-tourism
has a very positive impact on the quality of their family’s life for Vermont agri-tourism farmers,
but not for Massachusetts agri-tourism farmers.
Both states agreed they were better off financially as a result of their agri-tourism
decision, but agri-tourism does not have a very positive impact on the quality of Massachusetts
operator’s lives or their family’s lives, whereas it does in Vermont.

Implications and Summary
This exploratory study provides a benchmark for future agri-tourism researchers to build
off of. A wealth of information has been provided from the agri-tourism survey. A range of
questions were asked in the survey including farm demographics, business sales and costs,
promotional methods used, operator’s personal feelings about their agri-tourism business, as well
as many other questions that are discussed throughout this research paper. An abundant amount
of data has been generated, constructing a valuable foundation for future research. Research
questions for the future include, can an association similar to the Vermont Farms Association be
established in Massachusetts and have the same results? Also, why did Massachusetts farms say
agri-tourism does not have a very positive impact on their life or their family’s lives; whereas
Vermont farms said agri-tourism does have a very positive impact? In future analysis,
explanations why Massachusetts and Vermont agri-tourism farms replied differently to certain
questions can be investigated.
Overall, Vermont Farm Association members used more marketing strategies than
surveyed Massachusetts farms. Vermont agri-tourism farm operators also replied that both their
quality of life has been very positively impacted as a result of their decision to be involved in
agri-tourism, as well as their family’s quality of life. Massachusetts agri-tourism farm operators
replied that their involvement in agri-tourism has not positively impacted both their life and their
family’s quality of life. Farms from both states agreed they were better off financially because
of agri-tourism operations. Could it be that Massachusetts does not have effective marketing
strategies available, and therefore time commitment involved in promoting their agri-tourism
operation has negatively impacted their quality of life?
Below are policy recommendations based on knowledge attained throughout the research
process. A key to success of any business is the accessibility of outlets. In Vermont the
Vermont Farms Association is available to promote and support agricultural tourism farms
throughout the state. If more promotional outlets were available to Massachusetts agri-tourism
operations, or at least outlets that are maintained, impressive to viewers, and operate at the best
of their ability, I believe more farms in Massachusetts would choose to benefit from agri-tourism
activities.
If the poor implementation of agri-tourism marketing techniques through government
supported programs, such as the Massachusetts Bureau of Markets Agri-tourism farm page, is
not addressed now, as the economy fluctuates farmers may be forced to close their business
without ever knowing the advantages of agri-tourism and the possibility to save their operation
during harsh economic times.
Understanding the interdependence of agriculture and tourism and the economic impact
of that relationship will help policy makers decide the appropriate level of support systems for
agriculture in both the Commonwealth of Massachusetts and the State of Vermont (14).
Educational programming for farmers considering entering into farm-based tourism should be
offered through workshops held by state agriculture boards or associations. The workshops
should be recommended for anyone seeking a loan or grant from the Department of Agriculture
or any other government entity.
The next step of this research process is to disseminate results to all agri-tourism
operations surveyed in both Massachusetts and Vermont; this will include the operations that did
not respond. The Vermont Agency of Food and Agriculture has expressed desire for a copy of
the report, and the Massachusetts Bureau of Markets will receive a report.

Table 1. Farms and Agricultural Tourism in the United States
Vermont Massachusetts New England United States
Number of farms 6,300 6,100 27,950 2,128,982
Acreage of land in farms 1,240,000 520,000 3,990,000 938,279,056
Average farm size in Acres 197 85 143 441
Estimated number of farms
involved in Agritourism 2,200 434 N/A 52,000
Source: U.S. Department of Agriculture, National Agricultural Statistics Service. Massachusetts and Vermont State Agriculture Overviews. USDA/NASS, Washington, DC. 2007. LeBlanc, R. Personal interview on number of agricultural tourism operations in Massachusetts, conducted on September 17, 2008. Liang, K. “Vermont Agri-Tourism Survey 2003.” Vermont Tourism Data Center, University of Vermont, 2003. “Agritourism and Nature Tourism in California.” Pg. 339, Small Farm Center, University of California, Davis, 1999.
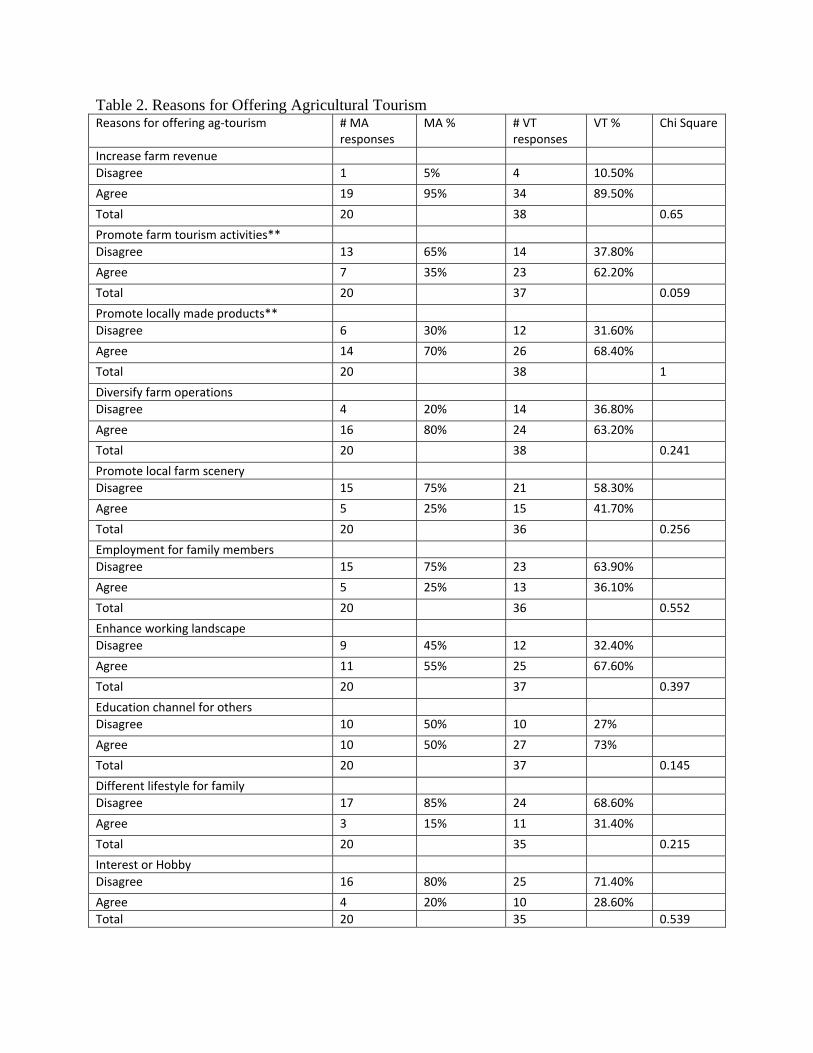
Table 2. Reasons for Offering Agricultural Tourism Reasons for offering ag‐tourism # MA
responses MA % # VT
responses VT % Chi Square
Increase farm revenue Disagree 1 5% 4 10.50%
Agree 19 95% 34 89.50%
Total 20 38 0.65
Promote farm tourism activities** Disagree 13 65% 14 37.80%
Agree 7 35% 23 62.20%
Total 20 37 0.059
Promote locally made products** Disagree 6 30% 12 31.60%
Agree 14 70% 26 68.40%
Total 20 38 1
Diversify farm operations Disagree 4 20% 14 36.80%
Agree 16 80% 24 63.20%
Total 20 38 0.241
Promote local farm scenery Disagree 15 75% 21 58.30%
Agree 5 25% 15 41.70%
Total 20 36 0.256
Employment for family members Disagree 15 75% 23 63.90%
Agree 5 25% 13 36.10%
Total 20 36 0.552
Enhance working landscape Disagree 9 45% 12 32.40%
Agree 11 55% 25 67.60%
Total 20 37 0.397
Education channel for others Disagree 10 50% 10 27%
Agree 10 50% 27 73%
Total 20 37 0.145
Different lifestyle for family Disagree 17 85% 24 68.60%
Agree 3 15% 11 31.40%
Total 20 35 0.215
Interest or Hobby Disagree 16 80% 25 71.40%
Agree 4 20% 10 28.60% Total 20 35 0.539

Table 3. Advertising Methods Do you advertise** # MA responses % MA # VT response % VT Chi Square No 6 28.60% 0 0%
Yes 15 71.40% 34 100%
Total 21 34 0.002 Newspaper
No 7 33.30% 13 38.20%
Yes 14 66.70% 21 61.80%
Total 21 34 0.779 Local magazines No 16 76.20% 21 63.60%
Yes 5 23.80% 12 36.40%
Total 21 33 0.383 State gov. website** No 17 81% 16 47.10%
Yes 4 19% 18 52.90%
Total 21 34 0.022 Own website** No 8 38.10% 1 3.10%
Yes 13 61.90% 31 96.90%
Total 21 32 0.002 Brochure or pamphlet** No 12 57.10% 3 9.10%
Yes 9 42.90% 30 90.90%
Total 21 33 0.0001 Flyers
No 16 76.20% 20 58.80%
Yes 5 23.80% 14 41.20%
Total 21 34 0.248 Local farm assoc** No 14 66.70% 7 19.40%
Yes 7 33.30% 29 80.60%
Total 21 36 0.001 Region tourism guide** No 13 61.90% 13 37.10% Yes 8 38.10% 22 62.90% Total 21 35 0.099 Radio/T.V. No 18 85.70% 27 77.10%
Yes 3 14.30% 8 22.90%
Total 21 35 0.508 Road signs No 8 38.10% 12 33.30% Yes 13 61.90% 24 66.70% Total 21 36 0.778

Table 4. Assessment of Agricultural Tourism Operations # MA
respondents MA % # VT
respondents VT % Significance
Assessment
Business is running Gamma
Worse than expected 4 20% 7 19.40%
About the same 10 50% 26 72.20%
Better than expected 6 30% 3 8.30%
Total 20 36 0.255
Sales are**
Worse than expected 1 4.80% 9 24.30%
About the same 13 61.90% 21 54.10%
Better than expected 7 33.30% 8 21.60%
Total 21 37 0.062
Profits are
Worse than expected 5 26.30% 12 32.40%
About the same 10 52.60% 19 51.40%
Better than expected 4 21.10% 6 16.20%
Total 19 37 0.57
Total costs are
Worse than expected 0 0% 3 8.30%
About the same 8 42.10% 17 47.20%
Better than expected 11 57.90% 16 44.40%
Total 19 36 0.22
Promotion and advertising plans are
Very inefficient 3 18.80% 6 18.20%
Does not make any difference 8 50% 9 27.30%
Very efficient 5 31.30% 18 54.50%
Total 16 33 0.218

Table 5. Challenges being involved in agricultural tourism operation Difficulty in getting loans # MA
responses % MA # VT
responses % VT Chi
Square Disagree 17 89.50% 34 97.10% Agree 2 10.50% 1 2.90% Total 19 35 0.28 Difficulty in cash flow Disagree 10 52.60% 20 57.10% Agree 9 47.40% 15 42.90% Total 19 35 0.781 Difficulty in cost control Disagree 15 78.90% 23 65.70% Agree 4 21.10% 12 34.30% Total 19 35 0.365 Finding customers Disagree 15 78.90% 24 68.60% Agree 4 21.10% 11 31.40% Total 19 35 0.532 Finding efficient ad channels Disagree 15 75% 23 62.20% Agree 5 25% 14 37.80% Total 20 37 0.389 Finding professionals to design ad Disagree 19 95% 29 80.60% Agree 1 5% 7 19.40% Total 20 36 0.236 Finding skilled workers Disagree 14 70% 28 77.80% Agree 6 30% 8 22.20% Total 20 36 0.536 Asking family to help Disagree 18 90% 28 77.80% Agree 2 10% 8 22.20% Total 20 36 0.304 Time consuming for myself** Disagree 8 40% 14 38.90% Agree 12 60% 22 61.10% Total 20 36 1 Low market prices for my products and services Disagree 16 80% 34 94.40% Agree 4 20% 2 5.60% Total 20 36 0.172 Limited knowledge about market situation** Disagree 20 100% 35 97.20% Agree 0 0% 1 2.80% Total 20 36 1 Limited knowledge about farmers in other regions** Disagree 19 95% 35 97.20% Agree 1 5% 1 2.80% Total 20 36 1

Farm location not convenient for tourists**
Disagree 17 85% 30 83.30%
Agree 3 15% 6 16.70%
Total 20 36 1
Ag‐tourism interferes with other ag operation**
Disagree 17 85% 29 82.90%
Agree 3 15% 6 17.10%
Total 20 35 1
Tourists create damage on farm
Disagree 17 85% 34 97.10%
Agree 3 15% 1 2.90%
Total 20 35 0.131
Sometimes too many tourists in one season, not enough in another
Disagree 16 80% 26 74.30%
Agree 4 20% 9 25.70%
Total 20 35 0.749

Table 6. Support or Assistance from Other Organizations Lower interest rate on loans** # MA
responses % MA # VT
responses % VT Chi
Square Disagree 13 65% 24 68.60%
Agree 7 35% 11 31.40%
Total 20 35 1
More gov. support on marketing local ag‐tourism
Disagree 12 60% 16 45.70%
Agree 8 40% 19 54.30%
Total 20 35 0.403
More research to provide info on inc. profitability and efficiency**
Disagree 15 75% 27 77.10%
Agree 5 25% 8 22.90%
Total 20 35 1
More info on bookkeeping and financial analysis
Disagree 19 95% 28 80%
Agree 1 5% 7 20%
Total 20 35 0.234
More outreach for ag‐tourism farmers to understand economic situation and impacts of their operation**
Disagree 16 80% 27 77.10%
Agree 4 20% 8 22.90%
Total 20 35 1
More networking for ag‐tourism farmers**
Disagree 16 80% 19 54.30%
Agree 4 20% 16 45.70%
Total 20 35 0.082
Improve road conditions/other infrastructure**
Disagree 15 75% 27 77.10%
Agree 5 25% 8 22.90%
Total 20 35 1

Table 7. Agricultural Tourism Impact Statements Family members supportive of me in ag‐tourism business
# MA responses
% MA # VT responses
% VT Gamma
Strongly agree 9 52.90% 22 62.90% Agree 5 29.40% 13 37.10% Disagree 1 5.90% 0 0% Strongly disagree 2 11.80% 0 0% Total 17 35 0.295 I am happier as a result of decision to support ag‐tourism
Strongly agree 4 25% 14 38.90% Agree 10 62.50% 20 55.60% Disagree 1 0% 1 2.80% Strongly disagree 1 6.30% 1 2.80% Total 16 36 .0234 My family is happier as a result of ag‐tourism decision
Strongly agree 3 20% 10 27.80% Agree 9 60% 23 63.90% Disagree 1 6.70% 3 8.30% Strongly disagree 2 13.30% 0 0% Total 15 36 0.291 I am better off financially as a result of ag‐tourism decision**
Strongly agree 3 18.80% 13 37.10% Agree 7 43.80% 15 42.90% Disagree 3 18.80% 4 11.40% Strongly disagree 3 18.80% 3 8.60% Total 16 35 0.1 My family thinks we're better off financially ad a result of ag‐tourism
Strongly agree 3 18.80% 7 19.40%
Agree 7 43.80% 18 50% Disagree 2 12.50% 8 22.20% Strongly disagree 4 25% 3 8.30% Total 16 36 0.536 Impact of ag‐tourism has a very positive impact on quality of my life**
Strongly agree 3 18.80% 8 22.90% Agree 5 31.30% 21 60% Disagree 7 43.80% 6 17.10% Strongly disagree 1 6.30% 0 0% Total 16 35 0.083 Impact of ag‐tourism has a very positive impact on quality of my family's life**
Strongly agree 3 21.40% 6 18.80% Agree 3 21.40% 21 65.60% Disagree 5 35.70% 5 15.60%
Strongly disagree 3 21.40% 0 0%
Total 14 32 0.08
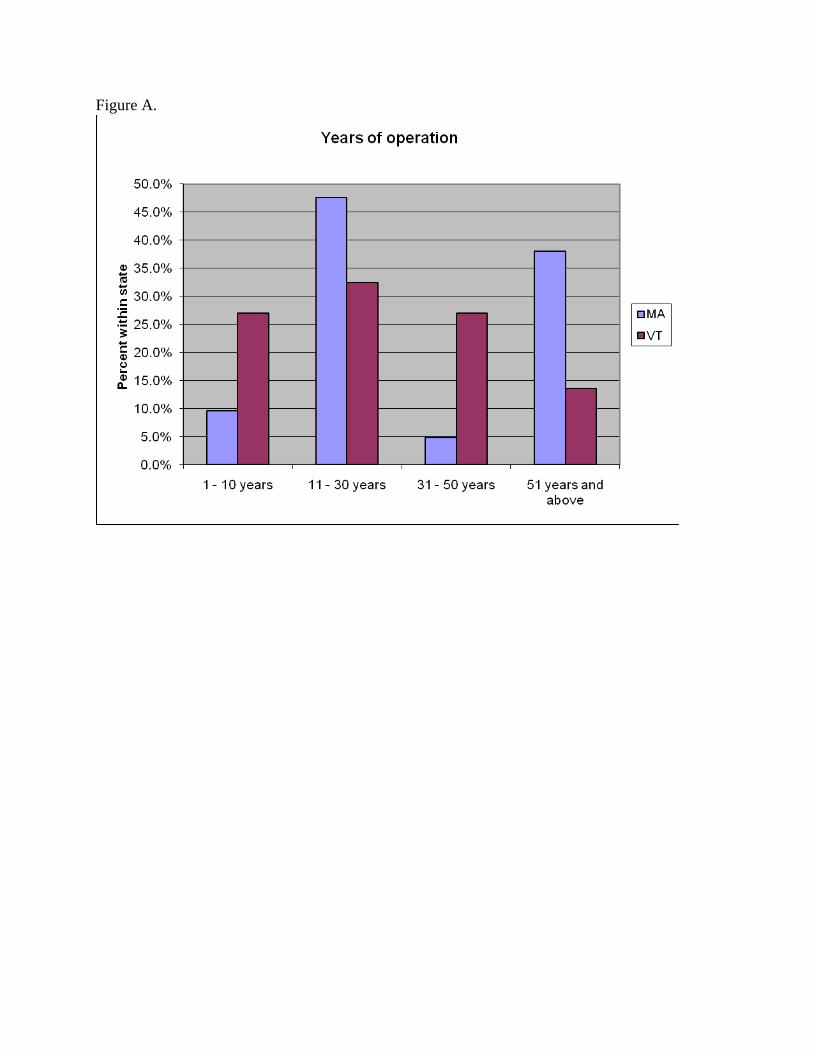
Figure A.
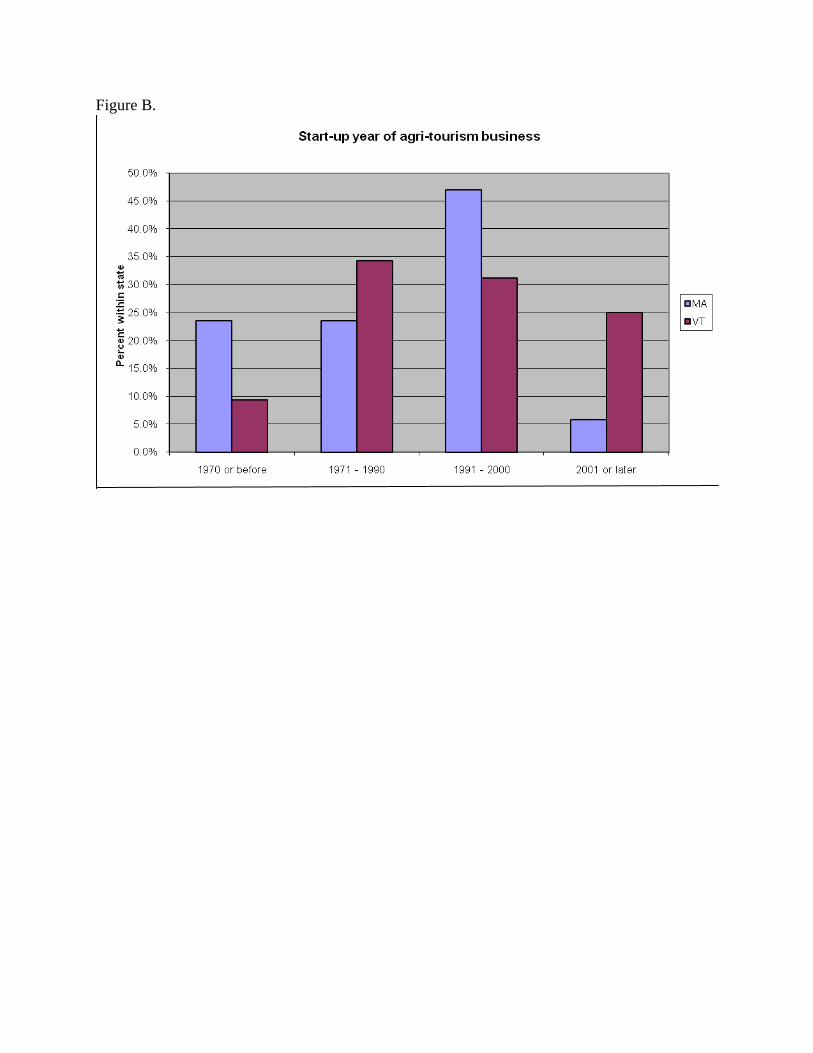
Figure B.

Figure C.

Figure D.

Figure E.

Reference Section
“Agritourism and Nature Tourism in California.” Pg. 339, Small Farm Center, University of California, Davis, 1999.
Brown, D. M., and R. J. Reeder. “Farm-Based Recreation: A Statistical Profile.” Economic Research Report No. 53, USDA/Economic Research Service, Washington, DC, December 2007. Burrows, R., A. Fennell, M. Redlin, and L. Verschoor. “Agri-Cultural Tourism: Linking the Arts and Humanities with Agricultural Direct Marketers and Specialty Producers.” Journal of Extension 45, no. 6 (2007). Available at http://www.joe.org/joe/2007december/iw3.shtml. Carpio, C.E, M.K. Wohlgenant, and T. Boonsaeng. “The Demand for Agritourism in the United States.” Journal of Agricultural and Resource Economics 33(2): 254-269, 2008. Davis, A.R. United States Department of Agriculture, National Agricultural Statistics Service. Vermont Agri-Tourism 2000. USDA/NASS, Concord, NH, September 2001. Davis, A.R. United States Department of Agriculture, National Agricultural Statistics Service. Vermont Agri-Tourism 2002. USDA/NASS, Concord, NH, April 2004. Davis, A. R. “Vermont Agri-Tourism 2002.” National Agricultural Statistics Service Research Report, New England Agricultural Statistics Service, Concord, NH, 2004. Geisler, M. “Agritourism Profile.” Agricultural Marketing Resource Center. Iowa State University, July 2008. Kennett, B. “Working Farms Open to the Public.” Vermont Farms Association, Montpelier, VT, 2007-2008. Kline, C., D. Cardenas, Y.F. Leung, and S. Sanders, “Sustainable Farm Tourism: Understanding and Managing Environmental Impacts of Visitor Activities.” Journal of Extension 45, no. 2 (April 2007). Available at http://www.joe.org/joe/2007april/rb2.shtml. LeBlanc, R. “Agricultural Directional Signage Program.” Commonwealth of Massachusetts Department of Agricultural Resources, 2007. Online. Available at thttp://www.mass.gov/agr/markets/agritourism/signs.htm.
LeBlanc, R. “Agri-Tourism Program and Farms.” Commonwealth of Massachusetts Department of Agricultural Resources, 2007. Online. Available at http://www.mass.gov/agr/markets/agritourism/index.htm.

Liang, K. “Vermont Agri-Tourism Survey 2003.” Vermont Tourism Data Center, University of Vermont, 2003. Petersen, D., W., Massachusetts Department of Agricultural Resources Commissioner, Bureau of Markets, 2008. Online. Available at www.mass.gov/agr. Rural Tourism: Small Towns and Villages Appeal to U.S. Travelers.” Travel Industry Association of America, Washington, DC, 2001. U.S. Department of Agriculture, National Agricultural Statistics Service. Massachusetts and Vermont State Agriculture Overviews. USDA/NASS, Washington, DC. 2007. Vermont Tourism Data Center, Economic and Policy Resources. A Benchmark Study of the Economic Impact of Visitor Expenditure on the Vermont Economy. University of Vermont, Burlington, VT. 2003. Wall, B. “Massachusetts Travel Industry Report.” Massachusetts Office of Travel and Tourism, Boston, MA, 2006. Wood, N., C. Halbrendt, K. Liang, and Q. Wang. “Interdependence of Agriculture and Tourism: Quantifying the Value of the Agricultural Working Landscape in Vermont.” Paper presented at annual meeting of the American Agricultural Economics Association, Tampa, FL, 30 July-2 August 2000.