Autism Survey Website Ashley Tillette SoCalBSI August 24, 2006.
date post
19-Dec-2015Category
view
213download
0
Exploring gene pathway interactions using SOM
Keala Chan
SoCalBSI
August 20, 2004

Microarray data analysis
Idea: Study relationships between functional terms or pathways
Gene expression data
Annotate and partition genes using functional terms

Interacting Gene Pathways
Hypothesis: Some relationship exists between Pathway 1 and Pathway 4

Network of pathways
Pathway 18
Pathway 4
Pathway 3
Pathway 2
Pathway 1Pathway 35
Pathway 12

Pathway 18
Pathway 4
Pathway 3
Pathway 2
Pathway 1Pathway 35
Pathway 12
Why use Self-Organizing Map?
• Serves as a data structure to represent the network
• Maps the network onto a 2-D grid, preserving the topological relationship between input vectors
(SOM)
Pathway 12Pathway 18
Pathway 1,
Pathway 2Pathway 4
Pathway 3Pathway 35

What is SOM?
• Tool for mapping similar input patterns onto contiguous locations in the output space
1. Clustering, or the creation of abstractions of the input space
2. Visualization of high-dimensional data in two-dimensional display
The SOM has two major effects:

Example
Each circle represents a number of input vectors. Hence, the input vectors have been clustered, or abstracted. Also, the topology has been preserved: neighboring representative vectors are similar.
Recall: SOM maps similar input patterns onto contiguous locations in the output space, resulting in clustering of the input space and 2-D visualization of the input space
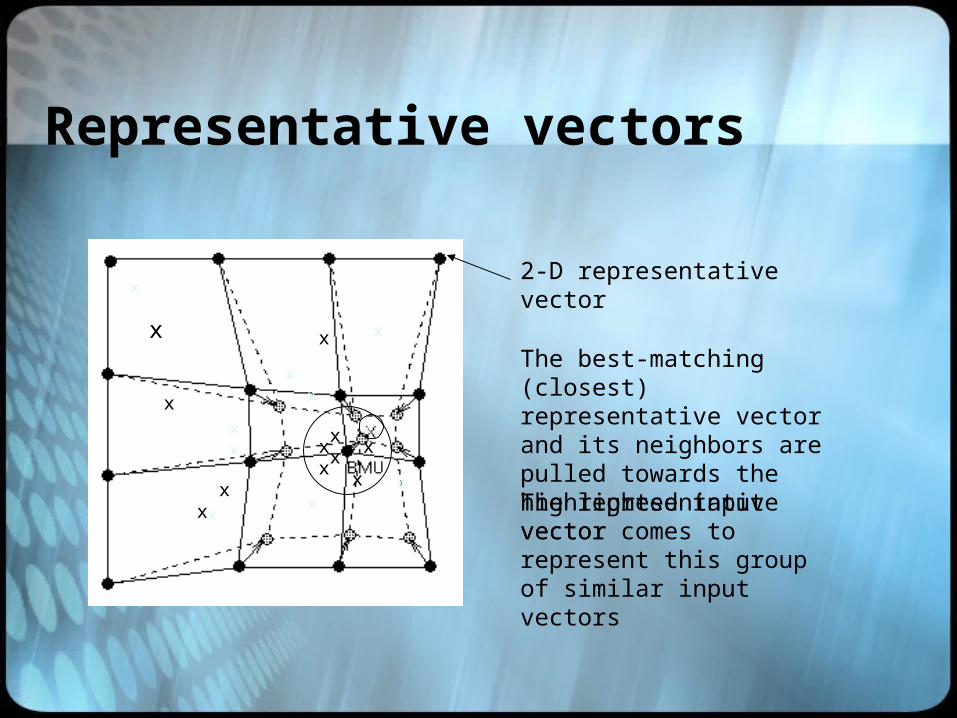
Representative vectors
x
xx
x
x
x
xx
x
x
x
xxx
xx
x
x
x
x
x
The representative vector comes to represent this group of similar input vectors
The best-matching (closest) representative vector and its neighbors are pulled towards the highlighted input vector
2-D representative vector

Method
Partition genes into GO terms
Apply GSEAAffymetrix data
Recall: The general goal is to train a SOM on a large dataset to form a network of pathways for further study.
Data:
Human healthy tissue from 31 adult sources (brain, kidney, skin, etc…), 108 replicants
Baseline: average

Method (continued)
GSEA scores
Train SOM on the pathway dataset
GSEA scores normalized so
mean=0 and stdev=1

Visualizing first resultsThese terms all map to, or are represented by, the same hexagon.
Biological_Process_glycolysis_(10)
Molecular_Function_3-oxo-5-alpha-steroid_4-dehydrogenase_(4)
Molecular_Function_ATP-binding_cassette_(ABC)_transporter_(65)
Molecular_Function_blood_coagulation_factor_IX_(3)
Molecular_Function_blood_coagulation_factor_VII_(4)
Molecular_Function_blood_coagulation_factor_X_(3)
Molecular_Function_fructose-bisphosphate_aldolase_(9)
Molecular_Function_interleukin_receptor_(6)
Molecular_Function_pyruvate_kinase_(3)
Molecular_Function_sodium:phosphate_symporter_(5)
Molecular_Function_transaminase_(24)
These pathways are most activated in the liver

K-means clusteringk-means (15) clustering of the representative vectors groups pathways that are often activated at the same time
Next: Examine which k-means clusters are activated under each condition.

Projecting a new dataset To test for pathways that interact consistently, I projected GSEA scores for 16 different brain tumor types onto the SOM
Biological_Process_glycolysis_(10)
Molecular_Function_3-oxo-5-alpha-steroid_4-dehydrogenase_(4)
Molecular_Function_ATP-binding_cassette_(ABC)_transporter_(65)
Molecular_Function_blood_coagulation_factor_IX_(3)
Molecular_Function_blood_coagulation_factor_VII_(4)
Molecular_Function_blood_coagulation_factor_X_(3)
Molecular_Function_fructose-bisphosphate_aldolase_(9)
Molecular_Function_interleukin_receptor_(6)
Molecular_Function_pyruvate_kinase_(3)
Molecular_Function_sodium:phosphate_symporter_(5)
Molecular_Function_transaminase_(24)
Mapped pathways and GSEA scores to the same location in the SOM

Brain tumor dataQuestions to ask:
What is the best we can do with respect to the visual smoothness of the projection?
What characterizes a “good” projection?
Next: Plot histogram of distances between any two pathways mapping to the same hexagon.
Calculate activation scores for kmeans clusters trained on healthy data.

Fetal tissue

Next?
• Validation by biologists
• Choose parameters wisely (projection data, normalization, distance metric)
• Study k-means clustering of SOM
• More projections on SOM

Acknowledgments
• SOM Toolbox
• All BioDiscovery software
• Stan Nelson Lab microarray data
• Michael Sneddon
• Dr. Bruce Hoff
• Dr. Soheil Shams
• Everyone at SoCalBSI