Exploring Digital Libraries: Integrating Browsing, Searching, and Visualization
z
Exploring efficient visualization of big data
using R shiny applicationMarlen Martinez-Lopez
Advisor: Dr. Daehee Kim
McNair Scholars Program
zIntroduction/Background
§ What is big data?
§ Processing high volumes of complex data
§ What is Rstudio?
§ What is shiny?
zMethods
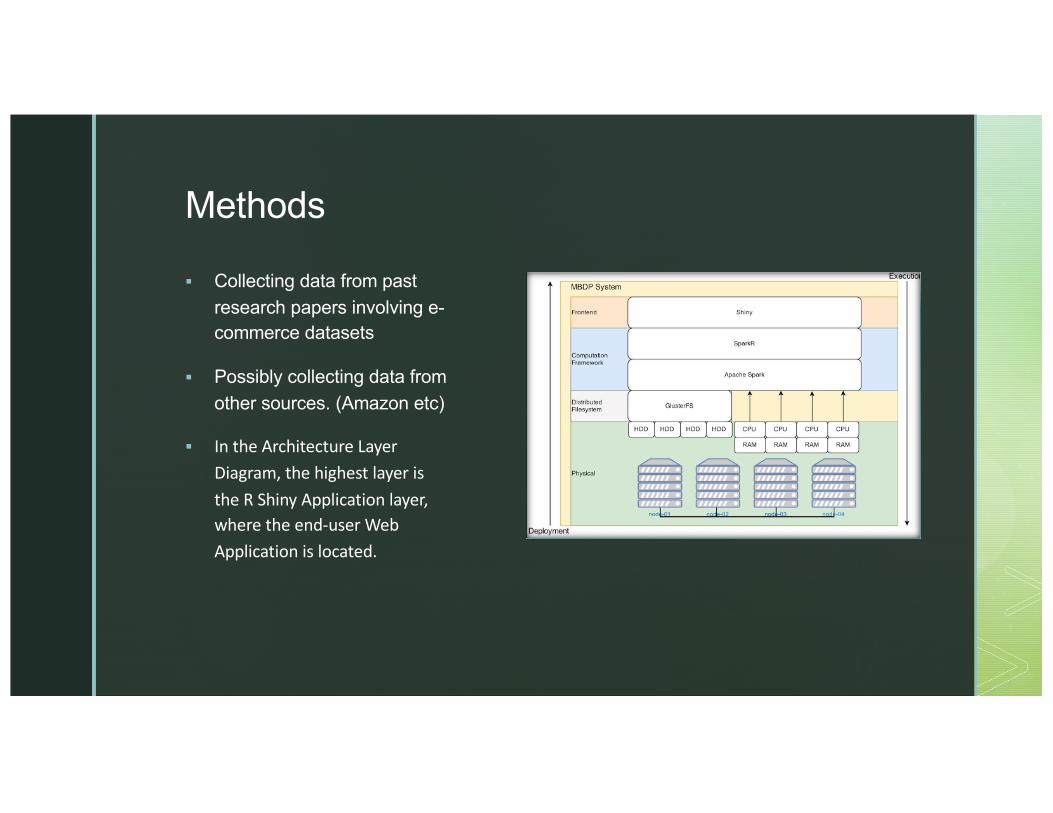
§ Collecting data from past research papers involving e-commerce datasets
§ Possibly collecting data from other sources. (Amazon etc)
§ In the Architecture Layer Diagram, the highest layer is the R Shiny Application layer, where the end-user Web Application is located.

zExpected Results & Conclusion§ The end result is then processed by R
Shiny, a powerful package that generates simple, but functional and efficient Web Applications with results displayed both as tables and various charts.
§ There are many necessary layers required for processing,
§ create an efficient web application with R shiny. Our research is aimed at optimizing layers to provide a more efficient performance with fewer runtime for e-commerce datasets.

z
Q & A
§ Thank you for watching! J
§ Questions?
§ Marlen Martinez
Email: [email protected]
§ Advisor: Dr. Daehee Kim
Email: [email protected]