Exploring ecosystem valuation to move towards net positive · PDF file ·...
49
Nathalie Olsen, Joshua Bishop and Stuart Anstee IUCN and Rio Tinto Technical Series No.1 Exploring ecosystem valuation to move towards net positive impact on biodiversity in the mining sector
Transcript of Exploring ecosystem valuation to move towards net positive · PDF file ·...

Nathalie Olsen, Joshua Bishop and Stuart Anstee
IUCN and Rio Tinto Technical Series No.1
Exploring ecosystem valuation
to move towardsnet positive impact
on biodiversity in the mining sector
Nathalie Olsen, Joshua Bishop and Stuart Anstee
IUCN and Rio Tinto Technical Series No.1
Exploring ecosystem valuation to move towards net positive impact on biodiversity in the mining sector

The designation of geographical entities in this book, and the presentation of the material, do not imply the expression of any opinion whatsoever on the part of IUCN or Rio Tinto concerning the legal status of any country, territory, or area, or of its authorities, or concerning the delimitation of its frontiers or boundaries.
The views expressed in this publication do not necessarily reflect those of IUCN or Rio Tinto.
Published by: IUCN, Gland, Switzerland and Rio Tinto, London, UK
Copyright: © 2011 International Union for Conservation of Nature and Natural Resources
Reproduction of this publication for educational or other non-commercial purposes is authorized without prior written permission from the copyright holder provided the source is fully acknowledged.
Reproduction of this publication for resale or other commercial purposes is prohibited without prior written permission of the copyright holder.
Citation: Olsen, Nathalie, Bishop, Joshua and Anstee, Stuart (2011). Exploring ecosystem valuation to move towards net positive impact on biodiversity in the mining sector. Gland, Switzerland: IUCN. vii + 41pp.
ISBN: 978-2-8317-1379-3
Cover photo: © Ravoahangy Andriamandranto
Layout by: millerdesign.co.uk
Printed by: SRO-Kundig SA
Available from: IUCN (International Union for Conservation of Nature) Publications Services Rue Mauverney 28 1196 Gland Switzerland
Tel +41 22 999 0000 Fax +41 22 999 0020 [email protected] www.iucn.org/publications
The text of this book is printed on FSC paper.

Contents Foreword
Executive Summary
1 Introduction and objectives 1
2 Context and issues 3
2.1 Biodiversity offsets in the Anosy region of Madagascar 3
2.2 Scope of study 4
2.3 Biodiversity status 6
2.4 Forest cover and deforestation 7
2.5 Drivers of deforestation 8
2.6 Population, livelihoods and opportunity costs 8
3 Approach 10
3.1 Methodology 10
3.2 Costs of conservation 11
3.2.1 Opportunity costs 11
3.2.2 Management and implementation costs 13
3.3 Benefits of conservation 14
3.3.1 Biodiversity 15
3.3.2 Hydrological Services 17
3.3.3 Carbon storage and sequestration 19
3.3.4 Bioprospecting 21
3.3.5 Ecotourism 21
4 Valuation results 23
4.1 Cost-based valuation 23
4.2 Benefit valuation 24
4.2.1 Value of benefits for TGK 24
4.2.2 Per hectare values 26
4.3 Distribution of costs and benefits 28
4.4 Sensitivity analysis 31
4.5 Key points 32
5 Application 34
6 Limitations and further work 35
Annex 1 36
Annex 2 37
Bibliography 38

List of Abbreviations/acronymsANGAP Association Nationale pour la Gestion des Aires Protégées
CBA Cost benefit analysis
CO2e Carbon dioxide equivalent
CDM Clean Development Mechanism
EU ETS European Union Emission Trading Scheme
Ha Hectare
NAP Nouvelle Aire Protégée (New Protected Area)
SAPM System of Protected Areas of Madagascar
NPI Net Positive Impact
NPV Net Present Value
NTFP Non-Timber Forest Product
QMM QIT Madagascar Minerals
PES Payments for Ecosystem Services
USAID United States Agency for International Development
WTP Willingness to Pay
List of Tables1 Area and forest cover of Tsitongambarika and NAP 4
2 Proposed use and zoning of Tsitongambarika 6
3 Summary of the annual costs of conservation per hectare 14
4 Derivation of existence value of biodiversity per hectare per year 16
5 Derivation of benefits associated with reduced erosion 18
6 Derivation of value of avoided CO2e emissions 20
7 Summary of the cost and benefit values 24
8 Per hectare annual and discounted present values of costs and benefits of conservation 26
9 Impact of lost agricultural opportunities on household income 29
10 Distribution of costs and benefits and potential compensation 30
11 Sensitivity analysis 32
List of Figures1 Tsitongambarika forest and region of Anosy 5
2 Present values of costs and benefits associated with conservation of TGK 25
3 Per hectare present values of costs and benefits of conservation 27

FOREWORD
Rio Tinto is a leading global mining group, combining Rio Tinto plc. and Rio Tinto Limited. The company is involved in every stage of the mining business. Products include aluminium, copper, iron ore, coal, and uranium. Activities span the world, however are concentrated in Australia and North America. Wherever Rio Tinto operates, health, safety, and a contribution to sustainable development are key values. Rio Tinto works closely with host countries and communities, respecting their laws and customs, and ensuring a fair share of benefits and opportunities.
IUCN, International Union for Conservation of Nature, is the world’s oldest and largest global environmental organisation, with more than 1,000 government and NGO members and almost 11,000 volunteer experts in 160 countries. IUCN’s work is supported by over 1,000 staff in 60 offices and hundreds of partners in public, NGO, and private sectors around the world. IUCN works on biodiversity, climate change, human livelihoods, and greening the world economy by supporting scientific research, managing field projects, and bringing governments, NGOs, the UN, and companies together to develop policy, laws, and best practice.
In 2004, at the World Conservation Congress, Rio Tinto made a public commitment to biodiversity conservation with a long term goal of having a “Net Positive Impact (NPI)” on biodiversity. Also in 2004, IUCN’s governing body, the IUCN Council, endorsed a “Strategy for Enhancing IUCN Interaction with the Private Sector”. The strategy envisions a sustainable global economy in which businesses are committed and effective partners in achieving a just world which values and conserves nature. IUCN engages, as a priority, private sectors where change is most important and urgent due to the scale of their impact on the environment and social equity, or where change is most likely based on commitment of the company and its leadership, or where greatest potential exists for a company to positively contribute to environmental conservation.
In 2010, after an intensive due diligence process, Rio Tinto and IUCN signed a three year collaborative relationship agreement. The overall purpose of the relationship is to build a business focused collaboration that enables Rio Tinto to improve its delivery of conservation outcomes, strengthen IUCN and Rio Tinto capacities for market-based approaches to conservation, and contribute to industry-wide improvements in the mining and associated sectors. IUCN and Rio Tinto recognise that in order to find sustainable solutions to environmental and conservation challenges, cross-sector engagement and collaboration are critical. By working together, both organisations are aiming to better understand each other’s issues and priorities, draw on each other’s experience and expertise, and develop programmes and actions that provide value and contribute to improved performance—for IUCN, Rio Tinto, and the mining sector.
Dennis Hosack and Stuart Anstee

EXECUTIVE SUMMARY
Rio Tinto has a policy goal of net positive impact (NPI) on biodiversity in its operations. The company aims to achieve NPI by combining state-of-the-art avoidance, mitigation and ecosystem restoration with biodiversity offsets and other conservation actions. In Madagascar, as part of its offset strategy, the company is considering supporting the conservation of approximately 60,000 hectares of lowland rainforest, to compensate in part for the unavoidable residual impacts of its mining operations in the region. The area to be conserved and the resulting biodiversity benefits are expected to meet and possibly exceed the conservation gains required to compensate for the residual impacts of the mining operation.
Rio Tinto commissioned IUCN to estimate the monetary value of the expected biodiversity benefits of the rainforest conservation project. This study examines the costs of conservation, including up-front investment as well as maintenance costs of protected areas, together with the opportunity costs that local people bear when they lose access to land that has historically provided food and cash income in lean periods, as well as a resource for agricultural expansion. The ecosystem benefits considered here include wildlife habitat (US$2.9 million), hydrological regulation (US$470,000) and carbon storage (US$26.8 million). Potential ecotourism benefits (US$2.5 million) were excluded from the analysis as changes in regional tourism are generally expected to result in a reduction in tourism activity elsewhere in the country. The study found that there were significant net economic benefits associated with conservation (about US$17.3 million net of all costs), mainly due to carbon storage values.
Many of these ecosystem service benefits accrue globally (e.g. wildlife habitat, carbon storage), while the costs of conservation are mainly borne by local communities, whose access to forest resources would be restricted under a conservation regime. The study underscored the need for, and potential scale of, compensation of local populations, for example through Payments for Ecosystem Services (PES). While the value of carbon storage is significant, local communities would need to receive about one-quarter of the potential revenues from Reduced Emissions from Deforestation and forest Degradation (REDD) to not be disadvantaged by conservation and roughly half of the potential REDD revenues to be better off, compared to business as usual. More generally, the analysis showed how the economic values of natural assets can be included in business as well as environmental decision making.
The study found that there were
significant net economic benefits
associated with conservation, mainly
due to carbon storage values.

Exploring ecosystem valuation to move towards net positive impact on biodiversity in the mining sector 1
1 INTRODUCTION AND OBJECTIVES
There is growing interest in the use of biodiversity offsets to compensate for the unavoidable adverse impacts of development projects and economic activity generally (Business and Biodiversity Offsets Programme, ten Kate et al., 2004). Rio Tinto, a major player in the mining sector, in 2004 adopted a policy goal of net positive impact (NPI) on biodiversity in its areas of operation. The company aims to achieve NPI by combining state-of-the-art avoidance, mitigation and ecosystem restoration with biodiversity offsets and other conservation actions (Rio Tinto, 2008).
The use of offsets to compensate for residual, unavoidable biodiversity loss is increasingly common in business and is required by law in several countries where Rio Tinto operates. In the appropriate circumstances, the development of an integrated package of offsets, as well as Additional Conservation Actions,1 may help the company achieve its NPI commitment, while also meeting legal requirements and maximizing conservation gains. Since 2004, Rio Tinto has piloted offset methodologies at some of its sites in Australia, the United States of America and at one of its newest operations, QIT Madagascar Minerals (QMM).
Based on the conservation activities of QMM, Rio Tinto expects the total realization of biodiversity benefits through biodiversity offset actions to exceed the amount required to compensate for the unavoidable residual impacts of its mining operations in Madagascar. This raises several questions:
• What is the value of these potential ‘surplus’ biodiversity benefits or ‘credits’?
• What are the costs of producing these credits and who pays these costs?
• Who benefits from the production of ‘surplus’ credits, and how much? This study examines the costs of conservation and the value of benefits associated with biodiversity around the QMM project area, with a focus on the Tsitongambarika (TGK) forest complex. The aim is to quantify and value changes in ecosystem services resulting from interventions that deviate from ‘business as usual’ in TGK, i.e. projected continued deforestation and ecosystem degradation, in favour of some form of forest conservation. The term biodiversity is interpreted broadly to include genetic, species and ecosystem diversity. While the focus is on forest biodiversity, this analysis includes the economic benefits
1 Additional Conservation Actions include a broad range of activities which are intended to benefit biodiversity, but whose effects or outcomes can be difficult to quantify. While the ‘biodiversity outcomes’ of these actions are difficult to measure, they form an essential part of Rio Tinto’s contribution to biodiversity conservation.
In 2004 Rio Tinto adopted a
policy goal of net positive impact
on biodiversity.

2 Exploring ecosystem valuation to move towards net positive impact on biodiversity in the mining sector
associated with carbon sequestration in biomass as well as the hydrological functions of forested watersheds.
Two approaches are used in this study to value forest biodiversity. First, the costs of conservation are assessed to estimate the costs of supplying a range of ecosystem services on a per hectare basis. Second, demand side valuation looks at the benefits to people from changes in the supply of these ecosystem services. If units or ‘hectares of biodiversity’ were traded in the context of offsets, as in conservation and wetland banking in the US, or biodiversity banking in New South Wales, Australia,2 prices would likely range between the lower, cost-based estimate and the higher estimate based on the benefits of biodiversity and ecosystem services. Benefits transfer (also known as value transfer) is the main source of unit values for ecosystem services used here (see Bateman et al., 2009; DEFRA, 2007; Navrud and Brouwer, 2007). Benefits transfer is a method to estimate economic values for ecosystem services by transferring information available from studies already completed in one location or context to another. This can be done as a unit value transfer or as a value function transfer (OECD, 2005).
Biodiversity offsets are understood as “measurable conservation outcomes resulting from actions designed to compensate for significant residual adverse biodiversity impacts arising from project development after appropriate prevention and mitigation measures have been taken” (BBOP, 2009). This paper uses the term ‘credit’ to refer to hectares of biodiversity that are conserved and that could be used to offset project impacts, but which have not yet been used as offsets. Biodiversity benefits are compared to the costs of conservation, but the costs of mining impacts have not been deducted.3 In this respect, this analysis should be seen as only a first step to assess the full environmental impact of the mine. In other words, net benefit refers here to the benefits of conservation minus the costs of conservation, but does not account for the costs of the residual impacts of the mine itself.
At least part of the latter costs are addressed separately through a dedicated biodiversity offset, financed by Rio Tinto and described in Temple et al., 2011.
2 See US Environment Protection Agency, www.epa.gov/wetlands, Ecosystem Marketplace www.ecosystemmarketplace.com/pages/dynamic/web.page.php?section=biodiversity_market&page_name=uswet_market, www.environment.nsw.gov.au/biobanking/
3 The net benefit of a biodiversity offset is the benefit of the offset minus the cost of the residual impact of the project and the cost of the offset (BBOP, 2009).
Exploring ecosystem valuation to move towards net positive impact on biodiversity in the mining sector 3
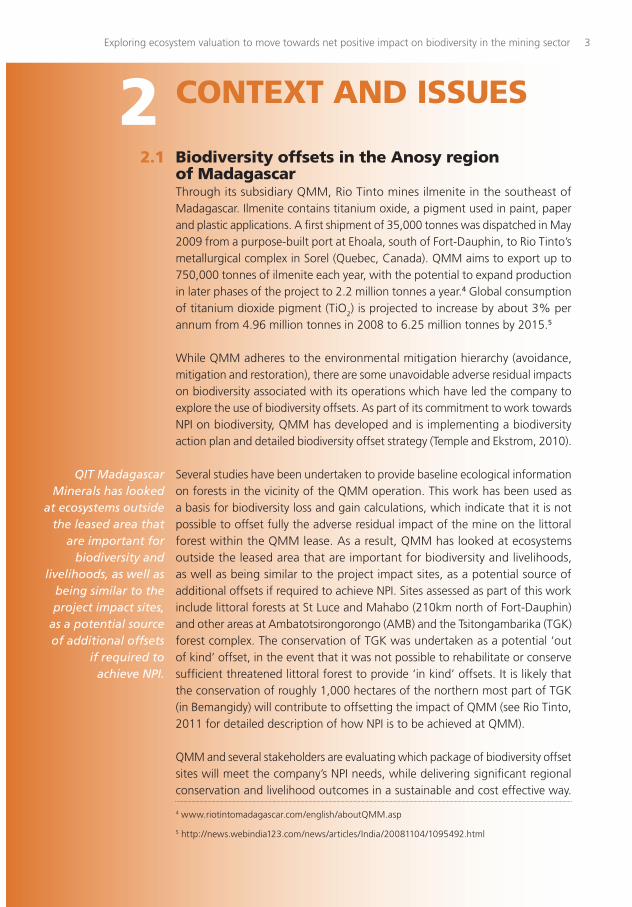
2 CONTEXT AND ISSUES
2.1 Biodiversity offsets in the Anosy region of Madagascar
Through its subsidiary QMM, Rio Tinto mines ilmenite in the southeast of Madagascar. Ilmenite contains titanium oxide, a pigment used in paint, paper and plastic applications. A first shipment of 35,000 tonnes was dispatched in May 2009 from a purpose-built port at Ehoala, south of Fort-Dauphin, to Rio Tinto’s metallurgical complex in Sorel (Quebec, Canada). QMM aims to export up to 750,000 tonnes of ilmenite each year, with the potential to expand production in later phases of the project to 2.2 million tonnes a year.4 Global consumption of titanium dioxide pigment (TiO
2) is projected to increase by about 3% per
annum from 4.96 million tonnes in 2008 to 6.25 million tonnes by 2015.5
While QMM adheres to the environmental mitigation hierarchy (avoidance, mitigation and restoration), there are some unavoidable adverse residual impacts on biodiversity associated with its operations which have led the company to explore the use of biodiversity offsets. As part of its commitment to work towards NPI on biodiversity, QMM has developed and is implementing a biodiversity action plan and detailed biodiversity offset strategy (Temple and Ekstrom, 2010).
Several studies have been undertaken to provide baseline ecological information on forests in the vicinity of the QMM operation. This work has been used as a basis for biodiversity loss and gain calculations, which indicate that it is not possible to offset fully the adverse residual impact of the mine on the littoral forest within the QMM lease. As a result, QMM has looked at ecosystems outside the leased area that are important for biodiversity and livelihoods, as well as being similar to the project impact sites, as a potential source of additional offsets if required to achieve NPI. Sites assessed as part of this work include littoral forests at St Luce and Mahabo (210km north of Fort-Dauphin) and other areas at Ambatotsirongorongo (AMB) and the Tsitongambarika (TGK) forest complex. The conservation of TGK was undertaken as a potential ‘out of kind’ offset, in the event that it was not possible to rehabilitate or conserve sufficient threatened littoral forest to provide ‘in kind’ offsets. It is likely that the conservation of roughly 1,000 hectares of the northern most part of TGK (in Bemangidy) will contribute to offsetting the impact of QMM (see Rio Tinto, 2011 for detailed description of how NPI is to be achieved at QMM).
QMM and several stakeholders are evaluating which package of biodiversity offset sites will meet the company’s NPI needs, while delivering significant regional conservation and livelihood outcomes in a sustainable and cost effective way.
4 www.riotintomadagascar.com/english/aboutQMM.asp
5 http://news.webindia123.com/news/articles/India/20081104/1095492.html
QIT Madagascar Minerals has looked
at ecosystems outside the leased area that
are important for biodiversity and
livelihoods, as well as being similar to the project impact sites,
as a potential source of additional offsets
if required to achieve NPI.

4 Exploring ecosystem valuation to move towards net positive impact on biodiversity in the mining sector
As part of this process, in partnership with stakeholders, QMM and Rio Tinto have been actively involved and supporting existing as well as new conservation programmes, including the Missouri Botanical Gardens Mahabo project and the TGK and AMB protected area designation work, with Asity Madagascar, Birdlife International and the Wildlife Conservation Society. Rio Tinto is also financing a set of trial community-based conservation projects in parts of TGK nearest to its operations.
2.2 Scope of studyThis analysis covers the biodiversity and ecosystem services of a large part of Tsitongambarika, the largest expanse of lowland humid forest remaining in southern Madagascar. This forest is characterized by high levels of biodiversity, provides important ecosystem services and is a key source of local livelihoods. However, over 10,000 hectares of forest have been lost, and the forest is currently being cleared at roughly 1–2% per annum, mainly through land conversion driven by shifting cultivation (known as tavy in Malagasy). Degradation also occurs through unsustainable and often illegal logging and unsustainable levels of harvesting of forest products and fuelwood.
TGK is the subject of a protected area designation which is still in the process of being finalized. The current political instability in Madagascar has delayed this process throughout the country and TGK has only temporary protected area status. When complete the new protected area (NAP) will cover 60,509 hectares.
Table 1 Area and forest cover of Tsitongambarika and NAP
Source: Data from Andriamasimanana, 2008; authors’ calculations
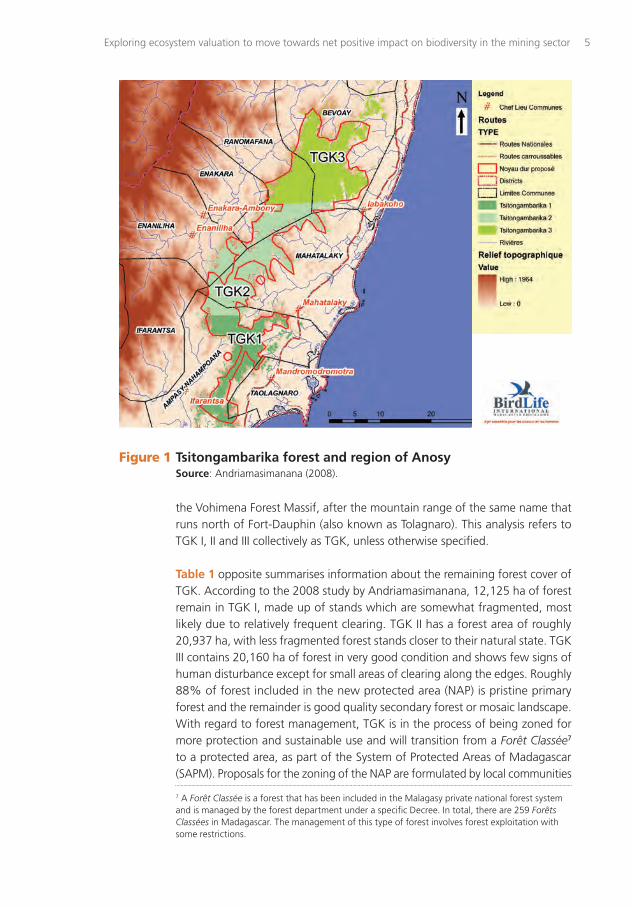
TGK is composed of three distinct areas, TGK I, II and III, covering an area of roughly 65,000 ha (Figure 1). TGK I (15,000 ha) and TGK II (25,000 ha) are part of the Private National Forest Domain and have been legally classified as ‘Forêts Classées’.6 TGK III (25,000 ha) is not yet classified, but is part of the Public National Forest Domain. TGK I, II and III are also collectively called TGK123 or
6 Decree 3240-MAER/FOR, 6 November 1965 for TGK I and Decree 2241-MAER/SEGREF/FOR DOM, 4 June 1970 for TGK II.
TGK 1 TGK 2 TGK 3 Total TGK
Total area (ha) 15,000 25,000 25,000 65,000
Area which is dense forest (ha) 12,125 20,937 20,160 53,222
Area of degraded forest or mosaic landscape (ha)
2,875 4,063 4,840 11,778
Area of TGK in the NAP (ha) 60,509
Area of NAP which is dense forest (ha) 53,222
% of NAP which is dense forest* 88%
*All remaining dense forest in TGK is included in NAP.
Over 10,000 ha of forest have been
lost, and the forest is currently being
cleared at roughly 1–2% per annum,
mainly through land conversion driven by shifting cultivation.
Exploring ecosystem valuation to move towards net positive impact on biodiversity in the mining sector 5
the Vohimena Forest Massif, after the mountain range of the same name that runs north of Fort-Dauphin (also known as Tolagnaro). This analysis refers to TGK I, II and III collectively as TGK, unless otherwise specified.
Table 1 opposite summarises information about the remaining forest cover of TGK. According to the 2008 study by Andriamasimanana, 12,125 ha of forest remain in TGK I, made up of stands which are somewhat fragmented, most likely due to relatively frequent clearing. TGK II has a forest area of roughly 20,937 ha, with less fragmented forest stands closer to their natural state. TGK III contains 20,160 ha of forest in very good condition and shows few signs of human disturbance except for small areas of clearing along the edges. Roughly 88% of forest included in the new protected area (NAP) is pristine primary forest and the remainder is good quality secondary forest or mosaic landscape.With regard to forest management, TGK is in the process of being zoned for more protection and sustainable use and will transition from a Forêt Classée7 to a protected area, as part of the System of Protected Areas of Madagascar (SAPM). Proposals for the zoning of the NAP are formulated by local communities
7 A Forêt Classée is a forest that has been included in the Malagasy private national forest system and is managed by the forest department under a specific Decree. In total, there are 259 Forêts Classées in Madagascar. The management of this type of forest involves forest exploitation with some restrictions.
Figure 1 Tsitongambarika forest and region of AnosySource: Andriamasimanana (2008).

6 Exploring ecosystem valuation to move towards net positive impact on biodiversity in the mining sector
and are summarised in Table 2 below. Forest area is classified into zones for conservation, local sustainable use, occupation and rehabilitation/reforestation. As of writing, proposed allocations are still under negotiation. More than half (54%) of the total area of TGK included in the NAP is to be protected for strict conservation. Slightly less than half (46%) has been allocated to sustainable local use. One percent is set aside for occupation. Degraded forest areas for rehabilitation and restoration are not included in the NAP. As the zoning is based on local proposals, this study assumes that the areas set aside for Malagasy sustainable local use are sufficient to meet the needs of local communities, now and in the foreseeable future.
Table 2 Proposed use and zoning of Tsitongambarika
Source: Data from Asity 2009 and Andriamasimanana 2008.
2.3 Biodiversity statusMadagascar is an island with a very high level of biological diversity and endemism (Myers et al., 2000; Critical Ecosystem Partnership Fund, 2000). TGK is recognized by biologists to have exceptionally high levels of biodiversity of flora and fauna (Ramanitra et al., 2006). More than 80% of species are endemic. A biodiversity survey was undertaken in TGK in 2005/6 (Ramanitra et al., 2006), focusing on the northeast and west of TGK III and smaller areas of TGK I and II. Botanic surveys found 165 genera and 76 families in the forest, including over 1,000 plant species. TGK has a high number of bat species (seven species), six of which are endemic. On the other hand, the diversity of lemurs (seven species) in TGK is low compared to other rainforests, a situation which has been attributed to human disturbance (loss of habitat and hunting). TGK is rich in herpetology fauna relative to other rainforests and neighbouring dry forests, including 70 species of reptiles and 56 species of frogs. TGK has also been identified as an Important Area for Bird Conservation—it contains two important and restricted-range, globally-threatened avian species8. Eighty-four bird species were identified
8 See www.birdlife.org/action/science/sites/index.html for categories.
Zone Zoned NAP area of TGK
ha % % of which is primary forest
Total area of NAP 60,509 100 88
Conservation (noyau dur) 32,383 54 100
Sustainable use (zone d’utilisation contrôlée)
27,533 46 75
Controlled habitation (zone d’occupation contrôlée)
498 1 0
Rehabilitation/restoration outside NAP 0
Exploring ecosystem valuation to move towards net positive impact on biodiversity in the mining sector 7
of which over 60% are endemic. Eleven species are classified as Threatened according to the IUCN Red List.
2.4 Forest cover and deforestationAnnual rates of deforestation in Madagascar as a whole range between 0.5% in isolated areas predominantly threatened by tavy to 2% in areas accessible by good roads (Brand et al., 2003). Despite recent efforts to improve the management of the TGK forest, pressure on the area remains high. In fact, the region of Anosy is one of the few regions in Madagascar where the rate of deforestation over the period 2000 to 2005 (1.02% compared to the national average of 0.55%) was higher than in the period from 1990 to 2000 (0.42%), predominantly due to heavy clearing and forest fires (Holmes and Burren, 2007). Illegal harvest of high value timber is also a recurrent problem, which the forest service and community management have not been able to address. Deforestation has been particularly rapid in the north of TGK (Manantenina and Ampasimena) and in parts of TGK I near Fort-Dauphin (see Annex 1).
Annex 2 presents changes in forest cover between 1990 and 2005 for thirteen communes containing parts of TGK. Rates of deforestation between 2000 and 2005 are highly variable and range from 0.16% in Ranomafana in the north to 8.83% in Mandromodromotra in the southeast, near Fort-Dauphin and the coast. The average annual deforestation rate for TGK as a whole from 2000 to 2005 was 0.83%. Deforestation in the eastern communes (1.46% per year from 2000 to 2005) is more rapid than in the western parts of TGK (0.37% per year from 2000 to 2005).
As deforestation rates vary spatially, this analysis assumes a 1% deforestation rate over the forest as a whole if no conservation action is taken. While the regional average deforestation rate is 1%, deforestation in the eastern communes occurs at rates of 2% and higher.
In the conservation scenario used in the cost-benefit analysis, it is assumed that the deforestation rate over the forest as a whole can be reduced to zero. It is assumed that the allocation of forest land for local use and sustainable production (as identified by the communes/fokontany9) is sufficient to prevent further forest degradation and deforestation. Roughly 20,000 individuals are estimated to be affected by the conservation of TGK (Jennifer Talbot, personal communication, 2010). The 27,533 ha (46%) allocated for sustainable local use (approximately 1.4 ha per person) are judged to be sufficient to meet the needs of affected households for forest products. Based on these assumptions, no leakage (displacement) of deforestation is expected to occur over the planning horizon (30 years). Future research could usefully assess the implications of leakage, in the event that local communities are not provided with sufficient forest areas to maintain their well-being and livelihoods.
9 The fokontany is an administrative subdivision in Madagascar that is smaller than the commune and usually contains a number of hamlets and villages.
Anosy is one of the few regions in
Madagascar where the rate of deforestation over the period 2000
to 2005 was higher than in the period
from 1990 to 2000, predominantly due
to heavy clearing and forest fires.

8 Exploring ecosystem valuation to move towards net positive impact on biodiversity in the mining sector
2.5 Drivers of deforestationWhile there is limited information on the drivers of deforestation in TGK, there is growing consensus that the predominant cause of forest clearing is tavy (M. Vincelette, personal communication). In addition, unsustainable harvesting of non-timber forest products (NTFPs) and illegal harvesting of timber are thought to be responsible for roughly 5–20% of deforestation in TGK (van der Plas, 2002, cited in Holmes and Burren, 2007). Based on local observations, this analysis assumes that 90% of deforestation is due to tavy, 5% due to unsustainable harvest of forest products and 5% due to illegal logging (J. Talbot, personal communication).
The threat of illegal logging may increase in light of the current political instability in Madagascar, which is likely to affect both mining and conservation operations at QMM. The presence of rosewood in the region combined with the weak enforcement of protected areas and logging rules suggests that the threat of logging is likely to increase (Barret et al., 2010).
2.6 Population, livelihoods and opportunity costsThe southeast of Madagascar is very poor, and malnutrition and food insecurity are persistent problems. Income inequality is high, depending on available employment opportunities. Average income in 1993 in the coastal communes east of TGK was relatively high at US$260–775 per household/year (Schéma de Développement Régional de l’Anosy, 2001, converted to US$ at 2008 values). A national highway runs from Manantenina to Tolagnaro and proximity to the coast brings greater employment opportunities. The more remote communes to the west of TGK are poorer with average incomes between US$93 and 135 per household per year. The communes in the northern part of TGK (Bevoay and Ampasimena) are the poorest, with annual average household income below US$95. Only three of fifteen communes have a significant area of irrigated land for rice production (rice is the main food staple) due to lack of irrigation infrastructure in isolated areas.
While detailed socioeconomic data for the population around TGK is limited, data is available for communities located around other protected areas in eastern Madagascar. The communities around the Mantadia National Park are considered to be very poor and are completely dependent on local land and forest resources. Average annual income per household in 1996 was US$279 of which 54% was based on subsistence agriculture, 31% on subsistence use of forest products and the remainder on other uses of labour (Shyamsundar and Kramer, 1996). However, Mantadia in the northeast is less remote than TGK in the southeast. It is likely that households in TGK rely more heavily on the forest to supplement household income and as a source of land for agricultural expansion, due to limited access to irrigated land. Due to fewer employment opportunities in remote areas, wages and incomes are also likely to be lower.
The threat of illegal logging may increase in light of the current political instability in
Madagascar.

Exploring ecosystem valuation to move towards net positive impact on biodiversity in the mining sector 9
While irrigated agriculture on the plain is an important source of food and income for most of the population around TGK, most households are not able to meet their consumption needs throughout the year. Tavy is critical for providing food in the lean period when grain stocks are depleted and the crop in the ground is not ready for harvest. Livestock husbandry (predominantly zebu cattle) is common, but is practised on a small scale. Basket weaving is an important supplementary source of income. Lobster fishing is profitable and is the preferred activity of households living around the northeast boundary of TGK, close to the coast. Evidence suggests that these households, occupied with fishing for nine months of the year, have little time and few resources to invest in agriculture; as a result, these households resort to tavy when lobster are out of season. In general, the rural population is heavily dependent on access to the forest for tavy and forest products, most importantly fuelwood, fibres for baskets and for lobster cages.
TGK does not experience some of the same pressures as other forests in Madagascar; there is almost no charcoal making and little exploitation for timber (at least not in the east). In general, fuelwood is harvested around the villages and charcoal is produced mainly from the dry forests and plantation stands. As a result, there is little degradation—forest is either pristine or has been cleared entirely for tavy (M. Vincelette, personal communication). This may be partly due to inaccessibility; much of the eastern humid forest is inaccessible, and TGK (particularly TGK III) is very poorly served by roads and other infrastructure. There is some collection of forest products (medicinal plants, honey, fruit), but little information is available. At the national level, the highest returns for forest land are from large-scale industrial logging (Kremen et al., 1999). The lack of infrastructure and paved roads in and around TGK, however, discourages logging as a commercially viable option.

10 Exploring ecosystem valuation to move towards net positive impact on biodiversity in the mining sector
3 APPROACH
3.1 MethodologyLack of resources prevented the collection of primary data, hence value estimates for a range of ecosystem services are ‘borrowed’ from other valuation studies undertaken in Madagascar (for local costs and benefits) and internationally (for global benefits) and are adjusted using local parameters, as discussed below. These values are used to estimate the costs and benefits of forest conservation in TGK. Estimates are expressed in US dollars adjusted to 2008 values. Estimates used from other studies are converted to US dollars adjusted to 2008 values using the US Department of Labour Consumer Price Index in the cost-benefit analysis. The period of analysis is 30 years due to the long-term nature of the scenarios. The discount rate used is 5% (see Ferraro, 2002, and Hockley and Razafindralambo, 2006, for detailed discussions) which falls between standard financial discount rates (8–10%) and a social discount rate (3%) recommended by public institutions such as the UK Treasury and the US National Oceanic and Atmospheric Administration (NOAA). Present values are calculated for both costs and benefits.
Two scenarios are compared:BAU The Business as Usual Scenario assumes the continuation of the current average annual rate of deforestation (1%). It is assumed that 88% of the forest area converted is primary forest and the remainder is secondary forest (Table 1). It is also assumed that ecosystem service provision depends on the condition of the forest. Biodiversity benefits accrue only in primary forest while carbon and hydrological benefits accrue in primary forest and at lower levels (50%) in secondary forest. Most deforestation is due to tavy (90%) with the remainder (10%) due to unsustainable levels of forest product collection (5%) and logging (5%).
Conservation The conservation scenario assumes that deforestation falls to zero immediately across the forest as a whole, as communities are prevented from (or given incentives to stop) converting forest for tavy within the protected area; households no longer clear new land for tavy and the forest areas set aside for sustainable use and production are sufficient to meet household needs for forest products and fuelwood. In short, the only impact of conservation on households is assumed to be reduced subsistence income from tavy.
In the calculation of the costs of conservation and the net benefits of conservation, management costs are incurred for the entire area of TGK included in the proposed NAP (60,509 ha). However, opportunity costs are only incurred on the land that would otherwise have been deforested, i.e. opportunity costs are included for 1% of 60,509 ha in year one, 2% in year two, 3% in year three,
This analysis measures the value
of changes in ecosystem services
associated with the area of forest
conserved that would otherwise have been
deforested.

Exploring ecosystem valuation to move towards net positive impact on biodiversity in the mining sector 11
and so on. Similarly, the values of ecosystem benefits are only included for the forest area that would otherwise be deforested every year. This analysis measures the value of changes in ecosystem services associated with the area of forest conserved that would otherwise have been deforested. In contrast, the costs of conservation are applied to the entire forest area of TGK, regardless of the level of threat, because protection incurs real financial costs and typically requires limiting the access of local people who rely on forest resources.
3.2 Costs of conservationThe costs of conservation are composed of:
• Opportunity costs borne by local communities, who must give up tavy, reduce collection of forest products to sustainable levels and halt illegal logging; and
• Costs associated with the establishment and management of TGK as a protected area.
3.2.1 Opportunity costs The opportunity cost of forest conservation may be defined as the net income per hectare per year or net present value (NPV) that is sacrificed as a result of not converting land to alternative uses like agriculture or of not degrading forests through unsustainable harvesting levels. Opportunity costs vary according to the drivers of deforestation in specific locations. Based on the drivers of deforestation and forest degradation in TGK, the calculation of opportunity costs assumes that 90% of deforestation is due to tavy, 5% to unsustainable harvest of NTFPs and 5% to logging.
3.2.1.1 Tavy As there is little local information on the economic returns to tavy in TGK, per hectare and per household returns to tavy from different parts of Madagascar have been reviewed. This analysis uses the annual per hectare estimate of US$88/ha/yr (Carret and Loyer, 2003, adjusted to US dollars at 2008 values). This estimate is based on the annual net revenue (farm gate price minus labour costs) from forest land cultivated under tavy which is equivalent to 0.5 tonnes/paddy/ha/yr or US$175/ha/yr. Under tavy in eastern Madagascar, land is cleared and cultivated for three years after which it lies fallow for five years to restore soil fertility. On the basis of returns to tavy of US$175/ha/yr for three years, followed by five years of no cultivation (fallow) and then renewed cultivation for a further three years (and so on), the annualized average economic returns to tavy each year were calculated to be US$88 per hectare (Carret and Loyer, 2003).
In the absence of information on what proportion of TGK is suitable for tavy production, the spread of tavy in TGK is assumed to continue at the rate of deforestation for 30 years. By year 30, roughly one-third of the forest would have been converted to tavy (at 1% annual deforestation rate). In other words, this analysis assumes that at least one-third of forest land would be suitable for tavy, given that much of tavy production occurs on sloping land.

12 Exploring ecosystem valuation to move towards net positive impact on biodiversity in the mining sector
3.2.1.2 Non-timber forest products (NTFPs) Households collect a range of NTFPs from forests for daily consumption and to supplement their incomes. The harvest of NTFPs generates relatively low economic returns per hectare. Based on a survey in the region of Ambohitantely, northeast Madagascar, revenue from the collection of fruits, animals and medicinal plants for artisanal use was estimated at US$4.4/ha/yr (cited in Carret and Loyer, 2003). Kremen et al. (2000) estimate the annual value for sustained use of NTFPs in the Masaola Peninsula to be US$17/ha/yr. This analysis uses the higher estimate of Kremen et al. (2000) adjusted to US dollars at 2008 values; to be conservative, the higher estimate is used so the benefits foregone by local communities are not underestimated. It should be noted that while the harvest of NTFPs may have low values on a per hectare basis, their share in household income in poor areas can be very large (Pearce and Pearce, 2001).
3.2.1.3 Logging USAID has financed a study (Holmes and Burren, 2007) to develop a management and conservation strategy/plan for TGK. The analysis of timber demand and supply and the inventory of forest resources are used here to assess the level of risk of continued forest degradation following the establishment of the NAP and to calculate the opportunity cost associated with a halt to logging within the NAP.
TGK is an important source of timber for Fort–Dauphin. Demand in 2002 was almost 8,000 m3/year and current demand is significantly higher due to rapid economic growth. Relative to other humid forests in Madagascar, TGK appears to have a relatively high number of commercially valuable timber species. By allocating 10% of the area of TGK to production forest, potential sustainable production would be 6,500–11,000 m3 timber per year (Holmes and Burren, 2007). Based on this information and the proposed zoning in Table 2, the forest area set aside for sustainable use (46% of the NAP) should be sufficient to meet local demand for timber.
To calculate the opportunity cost of conservation which is partly based on illegal logging, this analysis assumes that 5% of deforestation is due to illegal logging. To include this in the estimation of opportunity costs, the economic value of logging in TGK is, in the first instance, based on the per hectare economic returns to sustainable logging. Holmes and Burren (2007) assume a 60-year rotation and estimate the annual volume of production of currently commercially exploited species at 1 m3/ha/yr. The study also estimates that of the 12,500,000 m3 timber stock in TGK, 70% (9,000,000 m3) is exploitable and a further 30% (4,000,000 m3) sufficiently close to transport infrastructure as to be potentially exploitable. Their estimate of the per hectare annual value of sustainable timber exploitation is US$102, based on a rate of transformation of logs to sawn wood of 50% and average prices in local markets (Antananarivo). This estimate falls in the middle of the range of global values provided by Pearce and Pearce (2001) discussed below, which suggests it is a reasonable estimate.

Exploring ecosystem valuation to move towards net positive impact on biodiversity in the mining sector 13
The per hectare annual value of sustainable timber exploitation estimated for TGK is adjusted upwards by 50% to reflect the unsustainable nature of current timber extraction associated with forest degradation. In a comprehensive global survey of sustainable forestry practices, Pearce and Pearce (2001) find that sustainable forest management is less profitable than non-sustainable management. This is due to the role the discount rate plays in forest management, making future yields less valuable. Moreover, sustainable management has higher costs as greater care must be taken not to damage standing trees when logging. Pearce and Pearce (2001) estimate that globally tropical forests on average produce timber worth US$22–490/ha/yr under conventional logging (considered to be unsustainable) and US$35–300/ha/yr under sustainable logging. The difference in these ranges is roughly 50%, i.e. non-sustainable logging is roughly 50% more profitable than sustainable forest management.
The opportunity cost of timber extraction is therefore estimated to be US$153/ha/yr for TGK. It should, however, be noted that it is likely that there is rosewood in the area, which is likely at attract additional (illegal) logging. Coupled with the current political instability, the presence of rosewood in other forests of Madagascar has greatly increased the recent rate of forest degradation (Barret et al., 2010).
3.2.2 Management and implementation costsThe second major cost of conservation is the direct cost of establishing and managing the protected area. The System of Protected Areas of Madagascar (SAPM) has replaced the Association Nationale pour la Gestion des Aires Protégées (ANGAP) and is responsible for the management of 47 protected areas covering over 1.5 million hectares in Madagascar. The costs of managing this network of protected areas include the operational costs of the head office, regional offices, site operation and daily activities, and investment costs associated with managing biodiversity, developing ecotourism and environmental education (Carret and Loyer, 2003). In an audit report in 2002, ANGAP operational costs were estimated at US$2.7/ha/yr (US dollars adjusted to 2008 values) on average, for the protected area estate as a whole. For the five years to follow, it was projected that investment costs for surveillance and control of protected areas, continuing research on biodiversity, creating new park discovery trails and environmental education would be an additional US$2.7/ha/yr and operational costs were predicted to remain stable. In total, management costs are estimated to be US$5.4/ha/yr. Accordingly, this analysis assumes investment costs of US$2.7/ha/yr for the first five years and operational costs of US$2.7/ha/yr starting in year one and continuing indefinitely. Per hectare park management costs are only a crude estimation of the actual costs of managing protected areas and per hectare costs will vary with the area of a park. Table 3, page 14, summarises the annual per hectare returns to current uses of forest land and the share of each in causing deforestation. The opportunity cost of forest land is calculated as a weighted average of the returns to tavy, NTFPs and illegal logging. These
Coupled with the current political
instability, the presence of
rosewood in other forests of Madagascar has greatly increased
the recent rate of forest degradation.

14 Exploring ecosystem valuation to move towards net positive impact on biodiversity in the mining sector
per hectare estimates are later used to calculate NPVs for each land use and included in the cost-benefit analysis.
Table 3 Summary of the annual costs of conservation per hectare
Source: Data from Carret and Loyer (2003), Holmes and Burren (2007), Pearce and
Pearce (2001), Kremen et al. (2000). Authors’ own calculations.
3.3 Benefits of conservation TGK provides an important store of biodiversity as well as ecosystem services, some of which can be quantified and valued. Biodiversity is valued based on the willingness to pay (WTP) of rich country populations for the conservation of rainforests. The hydrological functions of the watersheds within the forest are valued based on the benefits of avoided erosion and on the regular provision of high quality water. The value of avoided greenhouse gas emissions associated with avoided deforestation and forest degradation is estimated based on the avoided damage costs of climate change. The value of potential revenue from ecotourism is discussed based on values estimated in other studies, but not included in the quantitative analysis.
Benefits are included based on the capacity of forest land that would otherwise be deforested to deliver ecosystem services. Biodiversity benefits are estimated on the area that would have been deforested of dense (primary) forest in the NAP (53,248 ha) rather than the total area of the NAP (60,509 ha) because good condition of forest is essential for the maintenance of high levels of biodiversity. On the other hand, benefits associated with carbon and the provision of water accrue on 1% of the area of both primary and secondary forest; however, secondary forest is assumed to produce ecosystem services at roughly half the
Land use
Esti
mat
ed c
ost
(U
S$/
ha/
yr)
Pro
po
rtio
n o
f co
st
incl
ud
ed in
CB
A (
%)
Shar
e o
f TG
K t
o w
hic
h
app
lied
(%
eac
h y
ear)
Are
a o
f TG
K t
o w
hic
h
app
lied
(h
a/yr
)
Co
st p
er y
ear
(US$
)
Opportunity cost of conservation
Weighted average 88 100 1 606 53,328**
Tavy 88 90 1 606
NTFPs 17 5 1 606
Timber harvest 153 5 1 606
Protected area management costs
Investment costs* 2.7 100 100 60,509 163,374
Operational costs 2.7 100 100 60,509 163,374
*Investment costs are incurred for the first five years of the programme**Opportunity costs are cumulative, i.e. 53,328 in year 1, 106,656 in year 2, etc.

Exploring ecosystem valuation to move towards net positive impact on biodiversity in the mining sector 15
levels of pristine rainforest. Soil conservation benefits are estimated from the area of rice paddies (3,343 ha) downstream of TGK. Details of the ecosystem benefits and how they are quantified and valued are described below.
3.3.1 Biodiversity Madagascar is one of 25 global biodiversity hotspots10— it has a very high number of plant and animal species concentrated in a small area. It is one of the top five hotspots globally and contains endemic plants and vertebrates amounting to at least 2% of total species worldwide (Myers et al., 2000). In addition, Madagascar retains less than 10% of its primary vegetation. In short, the magnificent biological diversity of Madagascar has been severely depleted, and the threat to the small amount of remaining intact ecosystems is extremely high. A recent survey undertaken in TGK III suggests that TGK has particularly high levels of biodiversity for some species, relative to other national forests (Ramanitra et al., 2006).
The value of biodiversity is difficult to estimate and a number of studies have reviewed valuation studies globally to derive likely ranges of values by ecosystem types (Pearce and Pearce, 2001; Mullan and Kontoleon, 2008). Non-use values for tropical forests in developing countries may be measured based on the willingness to pay of the populations of more affluent countries. People may value environmental goods and services that they do not use directly through recreation or tourism (direct use values) or indirectly, such as the water regulation and filtration functions of a distant watershed (indirect use values). These existence values are based on the benefits or utility people obtain simply knowing that a particular environmental resource continues to exist and are not related to current or future uses. Contingent valuation is a survey-based technique for the valuation of non-market resources. Contingent valuation studies provide estimates of the willingness to pay of individuals for environmental goods and services that do not have market prices.
In a review of contingent valuation studies, biodiversity values have been estimated to lie between US$7–42 per person or household per year (Mullan and Kontoleon, 2008). These estimates may be scaled up to reflect the WTP of OECD populations. Per hectare estimates are less common. The literature does, however, suggest that existence values can be substantial, particularly where the forests are in some sense unique or provide habitat for highly valued or charismatic species. Madagascar’s forests, which are characterized by high levels of endemism, are likely to have significant existence values. Nevertheless, per household WTP aggregated across the OECD and across all tropical forests produces low per hectare values.
Kramer and Mercer (1997) estimated the existence value of tropical rainforest to US residents. The study estimated the one-off willingness to pay for the creation of parks and reserves to protect an additional 5% of global tropical
10 See www.biodiversityhotspots.org
The magnificent biological diversity
of Madagascar has been severely depleted, and the
threat to the small amount of remaining
intact ecosystems is extremely high.

16 Exploring ecosystem valuation to move towards net positive impact on biodiversity in the mining sector
rainforests (in addition to the 5% already protected). Mean WTP ranged from US$21–31 per household. Pearce and Pearce (2001) transform this household willingness to pay into an annual per hectare estimate. Assuming the 91 million households in the US are willing to pay, the total fund available would be US$1.9 to 2.8 billion which, at a 5% interest rate, would provide US$95–140 million per annum in revenue. Dividing this by 5% of the area of tropical forest (720 million ha) to obtain a per hectare value suggests an annualized per hectare value of US$4. Pearce (2007) extends this WTP to the 580 million households in high-income countries to derive a value of roughly US$25/ha/yr, which is converted to US$ at 2008 values and used in this analysis.11 Table 4 below summarises the calculation.
Table 4 Derivation of existence value of biodiversity per hectare per year
A recent contingent valuation (Baranzini et al., 2010) study involving 500 residents in Geneva, Switzerland, estimated an average WTP of CHF110/year/person (equivalent to US$101 in US$ at 2008 values) to conserve tropical forests, which is over four times the value estimated in the Kramer and Mercer (1997) study. Another contingent valuation study (Horton et al., 2003) estimated British and Italian willingness to pay for a conservation programme in Amazonia at
11 To compare, Carret and Loyer (2003) estimate the value of biodiversity based on actual direct payments from international NGOs to ANGAP to be US$3/ha/yr. International payments are assumed to reflect the willingness to pay of more developed countries for conservation of Madagascar’s biodiversity resources, but may be an underestimate of true WTP.
Unit Low estimate
High estimate Source
WTP per household (hh) of US residents for conservation of additional 5% of global tropical forest
1997 US$/hh (one off payment)
21 31 Kramer and Mercer (1997)
US population (no. of hh) hhs 91 million Pearce and Pearce (2001)
Value of fund created 1997 US$ 1.9 billion 2.8 billion
Annual interest on fund % 5% 5%
Annual revenue from fund 1997 US$ 95 million 141 million
Total area of tropical forests globally
ha 720 million
5% of global tropical forests ha 36 million
Divide annual revenue from fund by area of 5% of tropical forest
1997 US$/ha/yr 2.64 3.9
Number of OECD hhs hh 580 million Pearce and Pearce (2007)
Adjustment of original estimate to OECD
1997 US$/ha/yr 16.9 25
Adjust for inflation between 1997 and 2008
2008 US$/ha/yr 20.2 30 Authors

Exploring ecosystem valuation to move towards net positive impact on biodiversity in the mining sector 17
US$47/ha/yr, roughly double the annualized estimate of the Kramer analysis. However, Horton et al. (2003) had doubts about the reliability of their results (Pearce, 2007). As such, this analysis uses the lower annualized WTP estimate developed by Pearce (2007) and based on Kramer and Mercer (1997).
3.3.2 Hydrological services
3.3.2.1 Avoided erosion and loss of downstream agricultural productionThe maintenance of forests provides a range of hydrological benefits, including regulation of water flow (associated with reduced frequency and severity of flooding), soil conservation due to reduced rates of erosion (associated with siltation of downstream water bodies and nutrient loss in soils), water supply and water quality (see Pearce and Pearce, 2001, and Mullan and Kontoleon, 2008, for reviews of global studies).
Empirical work in Madagascar has focused on the role of forests:
(i) in reducing erosion and siltation of land and irrigation infrastructure in downstream paddy production, and
(ii) as reliable sources of high quality potable water.
Brand et al. (2003) review evidence for the link between deforestation and increased erosion, reduced soil fertility and increased sedimentation in rice paddies. In northeast Madagascar, Brand et al. (2003) undertook a contingent valuation study to estimate the willingness to pay of rice farmers on the plains to conserve forest upstream in order to reduce flooding and sedimentation of rice paddies to be 25 kg rice/household/year (equivalent to US$4/household/year). In the watershed covered by the study, forest cover was high at over 65%, compared to the national average of less than 30% (Solonitompoarinony, 2000). The WTP estimate is considered to be conservative as the marginal effects of avoiding deforestation in watersheds where deforestation has been a greater problem in the past, as in most other parts of Madagascar, is likely to be greater. This WTP estimate is much lower than values estimated using production function approaches, most likely due to the low ability to pay of poor farm households.
Other studies (Rakotoarison, 2002, Brand et al., 2003) have used production function methods to estimate the value of reduced erosion. In Maroansetra, if deforestation doubled; Brand et al. (2003) estimate that rice yields would fall by 8% per year, equivalent to roughly US$40/ha/yr. Another study assessed both the loss in rice productivity and the loss of arable land due to siltation associated with deforestation (Solonitompoarinony, 2000). The value of lost rice production due to deforestation causing siltation in irrigation infrastructure and rice paddy fields was estimated at US$390,000 per year in 5,000 ha in the Alaotra region, equivalent to US$80/ha/yr.
Forests provide a range of hydrological
benefits, including regulation of water
flow, soil conservation due to reduced rates of
erosion, water supply and water quality.

18 Exploring ecosystem valuation to move towards net positive impact on biodiversity in the mining sector
TGK contains a number of important watersheds which protect downstream agriculture. Four communes have significant areas of irrigated rice production (Mahatalaky, 51–168 ha, Soanierana, 1286–3000 ha, Manambara, 365–1285 ha; Ranomafana, 169–364 ha) downstream of TGK (data from Schéma de Developpement Régional de l’Anosy 2001). The midpoint of each range is used as the basis for summing the total area of rice paddies benefitting from the watershed regulation of TGK. The area of rice paddies is estimated to be 3,344 ha. This analysis uses the lower production function estimate of the value of lost rice production at US$40/ha/yr (US$44 in US dollars at 2008 values) applied to the area of rice paddy fields that would be negatively affected by deforestation. It is assumed that at an annual rate of deforestation of 1%, rice yield will decrease 1% each year as irrigation infrastructure servicing the rice perimeters become increasingly silted. Table 5 below summarises the parameters used.
Table 5 Derivation of benefits associated with reduced erosion
3.3.2.2 Water supplyThe 1996 analysis in the National and Ecological Inventory provided evidence that one-half of protected areas (20 out of 41) provided hydrological benefits to 17 towns with an annual consumption of 8,400,000 m3 drinking water (Carret and Loyer, 2003). A survey of households in Fianarantsoa (unreferenced study cited in Carret and Loyer, 2003) has estimated the additional willingness to pay for clean and reliable water to be US$0.30/m3 (the existing price was US$0.15/m3). The per m3 estimate is converted to US$/ha forest area based on the area of watersheds in Madagascar and the provision of 8,400,000 m3 drinkable water annually to arrive at a figure of US$1.7/ha forest/year. Generally water use has to be related to demand, i.e. the number of households using
Unit Range Value applied Source
(a) Total area of paddies ha 3,344 Schéma de Developpement Régional de l’Anosy 2001
Mahatalaky ha 51–168 109.5
Soanierana ha 1,286–3,000 2,143
Manambara ha 365–1,285 825
Ranomafana ha 169–364 266.5
(b) Value of lost rice production due to siltation
US$/ha/yr 40–80 44 Rakotoarison (2002), Brand et al. (2003)
(c) Share of area affected % 1 Authors
(d) Total value of lost rice production for TGK =a*b*c
Year 1 = a*b*c US$/yr 1,471
Year 2 = y1+(a*b*c) US$/yr 2,942
Year 3 = y2+(a*b*c) US$/yr 4,413
Year 20 = y19+(a*b*c) US$/yr 29,418

Exploring ecosystem valuation to move towards net positive impact on biodiversity in the mining sector 19
water that will be adversely affected due to degradation. If population grows in the area, harm caused by deforestation will also increase. However, due to the lack of information on demand, this approach was not used.
TGK contains important sources of fresh water and watersheds which supply water, including drinking water, to Fort–Dauphin and to the QMM mining operations. In the absence of specific information for TGK, this analysis uses Carret and Loyer’s estimated value of US$1.7/ha forest for the supply of drinking water.
3.3.3 Carbon storage and sequestrationGlobal studies have estimated large values for the carbon storage functions of rainforests. For Madagascar, Meyers (2001) estimated the carbon content for Makira Forest based on a 1995 national study on the condition of Madagascar’s Classified Forests. The study estimates the carbon content per hectare (contained in trees of a range of sizes, palms and leaf litter) to be between 379 and 457 tonnes of carbon per hectare in the forests of north-eastern Madagascar. WinRock International (2004) (cited in Holmes et al., 2008) continued this research and estimated the weighted average forest carbon stock to be 286 tonnes of carbon per hectare. Other studies in Madagascar provide lower estimates: Hockley and Razafindralambo (2006) use 148 tonnes of carbon per hectare for the Zahamena-Mantadia Corridor. However, as both Makira and TGK are forests of the eastern humid rainforest and extensive work has been done to quantify carbon stocks in Makira, this study uses the carbon content estimated for Makira.
It is assumed that the condition of TGK and hence the distribution of carbon in TGK is similar to that of Makira. As land used for tavy contains roughly 80 tonnes of carbon per hectare (Pearce and Pearce, 2001), the net loss of carbon per hectare is roughly 200 tonnes. Carbon content per hectare is converted into carbon dioxide equivalent (CO
2e) using a standard conversion factor of 3.67.
As carbon sequestered in standing forests is not currently eligible for sale under the Kyoto Protocol’s Clean Development Mechanism (CDM), carbon credits from projects based on Reducing Emissions from Deforestation and forest Degradation (REDD) are traded in voluntary carbon markets. While prices in the EU Emission Trading Scheme (ETS) ranged between US$16–32/tonne CO
2e in 2008, prices
in the voluntary carbon market were lower. The weighted average price rose by 50% from US$4.1/tonne CO
2e in 2006 to US$6.1/tonne CO
2e in 2007 (Ecosystem
Marketplace). Due to policy uncertainty and the financial crisis, average prices in 2008 in the Over the Counter (OTC) market rose by only 22% from US$6.1 to US$7.34/tonne CO
2e. The average price for credits from avoided deforestation
projects in 2008 was US$6.3/tonne CO2e.
While these are the relevant market prices, it has been argued that it is appropriate for economic analysis to use estimates of the marginal damage cost of carbon emissions, based on damage estimates. This analysis follows Hockley and Razafindralambo (2006) in using Tol’s (2005) (cited in Hockley and
As carbon sequestered in
standing forests is not currently eligible for sale under the Kyoto
Protocol’s Clean Development
Mechanism, carbon credits from projects
based on Reducing Emissions from
Deforestation and forest Degradation
are traded in voluntary carbon markets.

20 Exploring ecosystem valuation to move towards net positive impact on biodiversity in the mining sector
Razafindralambo, 2006) social cost of carbon estimates of US$14.42/tonne carbon (US$3.9/tonne CO
2e) as a lower bound and US$44.29/tonne carbon
(US$12.07/tonne CO2e) as an upper bound.12 Current market prices, net of the
implementation and transaction costs of REDD programmes which are estimated to be roughly US$1/tonne CO
2e (Olsen and Bishop, 2009; Boucher, 2008), fall
in the lower part of this range. Table 6 below summarises the calculation.
Table 6 Derivation of value of avoided CO2e emissions
Finally, it should be noted that carbon storage is a stock value of ecosystems rather than a flow which is received every year, e.g. wildlife habitat or hydrological regulation are services which flow continuously from healthy ecosystems. As a result, in the analysis, the value of carbon storage is taken for the area of avoided deforestation each year, but unlike the other ecosystem services, this
12 Tol (2005) combines 103 estimates of the marginal damage costs of carbon emissions from 28 published studies to form a probability density function.
Unit Value Source
(a) Carbon content primary forest
tonne C/ha 286 WinRock International (2004)
(b) Carbon content of land converted to tavy
tonne C/ha 79 Pearce and Pearce (2001)
(c) Net loss of carbon from conversion = a-b
tonne C/ha 204 Authors
(d) Conversion factor carbon to CO2e
3.67 Standard
(e) Net loss of CO2e from conversion = c*d
749 Authors
(f) Price of carbon Market prices
Avg. price for REDD credits 2008
US$/tonne CO
2e
6.3 Ecosystem Marketplace (2009)
ETS 2008 low US$/tonne CO
2e
16
high 32
Social cost of carbon
low US$/tonne CO
2e
4.1 Tol (2005)
high 12.7
(g) Value of avoided CO2e emissions per hectare
Low estimate of social cost (US$4.1/tonne CO
2e)
US$/ha 3,070
Avg. market price for REDD credits (US$6.3/tonne CO
2e)
US$/ha 4,719
Average ETS 2008 price (US$24/tonne CO
2e)
US$/ha 17,976
(h) Annual value of avoided CO2e emissions for TGK at 1% deforestation rate (loss of 569ha/yr**) and carbon value of US$4.1/tonne CO2e = g*569ha
US$/TGK 1.745 million
**Based on 1% deforestation of TGK (60,509 ha) of which 88% primary forest (286 tonne/C/ha) and 12% secondary forest (50% of carbon content of primary forest).

Exploring ecosystem valuation to move towards net positive impact on biodiversity in the mining sector 21
value is not cumulative. Carbon values are counted on 1% of the area of TGK each year, not 1% in year 1, 2% in year 2, 3% in year 3, etc., as is the case for the other ecosystem services.
3.3.4 Bioprospecting Tropical rainforests contain high levels of biodiversity, including genetic information that can potentially be used by the pharmaceutical industry to develop new drugs and by the plant breeding industry to improve existing varieties of commercial crops. While per hectare bioprospecting values may be low at the level of global averages, evidence suggests that genetic material for pharmaceutical use could be worth several hundreds (even thousands) of dollars in many biodiversity hotspot areas. Pearce and Pearce (2001) review studies on Madagascar which estimate the WTP of pharmaceutical companies to be US$8.4/ha (Simpson et al., 1994, cited in Pearce and Pearce, 2001) and US$2,961/ha (Rausser and Small, 1998, cited in Pearce and Pearce, 2001), and the ‘social value of genetic material’ to be US$961/ha (Simpson and Craft, 1996, cited in Pearce and Pearce, 2001). These are values of marginal species, i.e. the contribution that one more species makes to the development of new pharmaceutical products. By extension, the value of one additional hectare of forest is the value associated with the number of species in that area. Due to the very large range in the values estimated in other studies, this study does not include bioprospecting values in the quantitative analysis.
Bioprospecting is not currently allowed in TGK and, given the current political instability in the country, it is unlikely that bioprospecting agreements would be successfully negotiated and implemented. However, due to its biodiversity hotspot status, TGK has the potential to receive payment for bioprospecting activities in future.
3.3.5 Ecotourism There is currently very little ecotourism in TGK due to its poor accessibility and lack of facilities. However, the ecotourism sector in Madagascar is growing at over 10% per annum (UNCTAD). In 2007, more than 350,000 tourists visited Madagascar. ANGAP data estimate that there were just under 100,000 park entries, of which about 75% were foreign and the remainder Malgache. It is likely that fewer than 100,000 individuals visit parks since some visitors go to more than one park. In short, it is likely that only 25% of tourists go to a national park. (Joy Hecht, personal communication, 2009).
For existing protected areas in Madagascar, the economic benefits have been estimated at US$4/ha/yr based on national visitation rates and expenditure by tourists (Carret and Loyer, 2003). Ranomafana National Park (41,601 ha), established in 1986, contains part of the eastern humid lowland forest and lies roughly 300km north of TGK. Ranomafana had 15,668 visitors in 2001; however, it lies only 60km east of the major town of Fianarantsoa and “with the completion of the road from the Vohiparara turnoff (RN25), the scenic overland
The ecotourism sector in Madagascar
is growing at over 10% per annum.

22 Exploring ecosystem valuation to move towards net positive impact on biodiversity in the mining sector
journey from the capital can be accomplished in 7 hours” (rainbowtours.co.uk). Andringitra (protected area of 31,160 ha) lies 100km to the north of TGK and had 1,636 visitors in 2001. It is likely that TGK would have fewer visitors as it is even more remote.
TGK does not yet have protected area status and is not promoted as a tourist destination due to the absence of ecotourism facilities. The closest sizeable airport in Fianarantsoa is poorly served by irregular charter flights and is roughly 350km away on poor quality roads. It is difficult to predict the potential for ecotourism with little information on the unique features of TGK. If ecotourism were to be included in a regional level analysis, it might be assumed that tourism could eventually develop in TGK, with no visitors the first year, 100 visitors the second year and a 10% per annum increase in visits up to year 10 after which the annual rate of increase falls to 5% (the average rate of increase of tourist visits to parks in Madagascar from 1992–95 was 12%, Swanson, 1996, cited in Kremen et al., 2000). This analysis assesses as appropriate the estimates for Madagascar of Kremen et al. (2000) of expenditures of US$38.87/day/visitor, for an average tourist stay of seven days and an annual increase in expenditure of 5%.
However, due to its poor accessibility, it is unlikely that TGK would attract international visitors that would not otherwise have visited Madagascar. As such, in terms of economic benefits at the national level there are no incremental economic benefits if TGK is simply diverting tourists from other protected areas. Therefore, while ecotourism benefits are discussed, they are not included in the quantitative analysis.

Exploring ecosystem valuation to move towards net positive impact on biodiversity in the mining sector 23
4 VALUATION RESULTS
The valuation results are presented separately for TGK as a whole and per hectare. The results for TGK are a function of unit costs and benefits and the areas on which they are incurred. Moreover, the timing of the costs and benefits affects the net benefits for the whole area. Benefits are only counted for the area that would otherwise be deforested each year, while costs are incurred to protect the entire forest. As a result, it is expected that the benefits will be relatively low, certainly lower than a per hectare analysis would suggest.
The per hectare analysis is based on an estimation of the present value of the stream of costs and benefits for one hectare of forest. This is estimated to inform decisions about the conversion of a threatened hectare of rainforest and to provide a per hectare estimate of the value of forest biodiversity and ecosystems net of the costs of protecting it. This per hectare estimation does not reflect the phasing of costs and benefits that is undertaken for the forest as a whole.
4.1 Cost-based valuation The cost of establishing TGK as a protected area is based on implementation and management costs for the whole of TGK and on opportunity costs borne by local communities on land that would have been deforested in the absence of conservation (1% per year). The results illustrate the financial and economic implications of conserving TGK at the level of the forest, given the dynamics of the actual situation. The present value (PV) of these costs over 30 years at a 5% discount rate is estimated to be US$13 million. While investment and operational costs are high in early years, these costs become an increasingly small share of the full cost of conservation over time. The costs of foregoing tavy increase steadily every year and, by year 20, cost local communities over a million dollars annually in foregone income on over 12,000 ha of land.
The costs of supplying a hectare of forest biodiversity, which could potentially be traded in a biodiversity offset market, suggest a rough minimum price: US$1,400/ha (see Table 9 for detail). This of course assumes that local communities are compensated for their loss of access to the forest resource. While the investment and recurrent costs are actual costs incurred (financial costs) the opportunity cost borne by local communities are economic costs (i.e. they are costs that reflect an impact on the welfare of these communities) rather than financial costs. However, once local communities are fully compensated for their loss of access to forests for swidden agriculture and the collection of forest products, these costs become financial in that they reflect transfer payments made.

24 Exploring ecosystem valuation to move towards net positive impact on biodiversity in the mining sector
4.2 Benefit valuation
4.2.1 Value of benefits for TGKThe cost-benefit analysis includes the benefits associated with avoided deforestation (biodiversity conservation, hydrological benefits, avoided CO
2
emissions) summarised in Table 7. Net benefits of conservation are net of the costs described above.
Table 7 Summary of the cost and benefit values (US$/ha/yr)
Source: Various studies cited in text.
The PV of net benefits using a 5% discount rate and a 30-year time horizon is roughly US$17.3 million for TGK, assuming a 1% per year deforestation rate. This significant and positive PV of conservation is predominantly driven by the value of avoided emissions of CO
2, despite conservative estimates of CO
2 unit
values; in fact, excluding carbon from the analysis results in a negative NPV of -US$7 million for TGK. Other potentially important benefits are relatively small as they occur only on an incremental 1% of the forest area of TGK each year, while management costs are incurred for the entire area of TGK in the proposed NAP. The results are summarised in Figure 2 opposite.
Costs US$/ha/yrArea applied to (ha/yr)
Notes
Investment 2.7 60,509 Area of NAP
Implementation 2.7 60,509 Area of NAP
Opportunity costs (weighted average)*
weighted average
88 1% of 60,509 Area of avoided deforestation in NAP
Benefits
Biodiversity conservation 30 1% of 53,248 Area of primary forest
Soil conservation 44 per ha paddy, 2.6 per ha forest
1% decline over 3,343
1% decline in yield per hectare on area of paddy downstream
Water supply 1.9 1% of 56,878 Area of primary and 50% of secondary forest
Carbon storage 200 (annualized) 1% of 56,878 Area of primary and 50% of secondary forest
Ecotourism** 315 Not applied
Bioprospecting 1–3,500 Not applied
*See Table 3 for derivation of weighted average opportunity cost
**US$/per visitor, 100 visitors in y2, 10% annual increase until y10, 5% annual increase thereafter—not expressed as US$ ha due to annual growth in ecotourism numbers and expenditure

Exploring ecosystem valuation to move towards net positive impact on biodiversity in the mining sector 25
Figure 2 Present values of costs and benefits associated with conservation of TGK (5% discount rate, 30-yr horizon, 1% deforestation)
The results may be compared to, and are consistent with, PV estimates from similar studies in Madagascar:
• The value of conserving the Ranomafana-Andringitra-Pic d’Ivohibe Corridor (Hockley and Razafindralambo, 2007) has been estimated at over US$330 million (US$ at 2006 values) based on a 5% discount rate and 60-year time horizon. It is difficult to identify what area is covered by the Hockley and Razafindralambo study, but it is probably around 360,000 ha. If this study also adopts a 60-year time horizon, the PV of the conservation of TGK is US$16.3 million. Adjusting for size, the Hockley and Razafindralambo estimate is roughly three times that of this study.
• The conservation of the Masaola National Park (230,000 ha) was valued at US$526 million (local benefits), -US$264 million (national benefits) and US$645 million (global benefits) based on a 3% discount rate and 30-year time horizon (Kremen et al., 2000). Only the global estimates are comparable between the studies. If this analysis adopts the same assumptions, the global benefit is estimated to be US$21.3 million. Adjusting for size, the Kremen et al. (2000) estimate is roughly five times the estimate of this study. This is

26 Exploring ecosystem valuation to move towards net positive impact on biodiversity in the mining sector
largely due to the different opportunity costs (logging rather than swidden agriculture) in the study areas. The Kremen et al. (2000) estimate of local benefits is positive because opportunity costs are included at the national rather than the local level (and the net benefits become negative at the national level as a result). Opportunity cost is included at the national level because the area was considered for industrial logging concessions. Value of benefits per hectare (30 years, 5% discount rate).
4.2.2 Per hectare valuesTo assess the per hectare net benefits of conserving a hectare of rainforest which is in direct danger of deforestation, the per hectare analysis is based on a simple calculation of the present value of costs and benefits summarised in Table 9, assuming full costs and benefits for one hectare. This estimate may be used to assess the net benefits of conserving an additional hectare of rainforest (rather than extracting minerals). This value is relevant in deciding between land-use options, e.g. whether to conserve a hectare of forest along the deforestation frontier. Table 8 presents both the per hectare annual values and the present values of costs and benefits per hectare.
Table 8 Per hectare annual and discounted present values of costs and benefits of conservation
Annual value of cost and benefits US$/ha/yr
PV of costs/benefits per hectare (US$/ha)
Costs Investment (5 yrs only) 2.7 12
Recurrent 2.7 42
Opportunity cost 88 1,353
Subtotal costs 93.4 1,406
Benefits
Ecotourism na na
Biodiversity 30 461
Soil conservation 2.6 40
Water supply 1.9 29
Carbon storage* 200 3,070
Subtotal benefits 234.5 3,597
Net benefits 141.1 2,191
*Carbon storage is a stock rather than a flow, and the full value of carbon stored over 30 years is measured upfront because if the hectare is deforested, the carbon is lost immediately. To make the treatment of carbon equivalent to ecosystem services flows in this analysis, the present value of the carbon stock over 30 years is annualized so that a stock value in year 1 of US$3,070 is treated as an annual flow, estimated to be US$200 per annum (with discounting).
The PV of benefits using a 5% discount rate and a 30-year time horizon are roughly US$3,597/ha, assuming a 1% deforestation rate. This significant and positive PV of conservation is predominantly driven by the value of avoided

Exploring ecosystem valuation to move towards net positive impact on biodiversity in the mining sector 27
emissions of CO2, followed by biodiversity values. The hydrological regulation
functions of rainforests account for less than 2% of the estimated economic value of rainforests. Ecotourism was excluded from the per hectare analysis as it is difficult to estimate per hectare values; ecotourism values do not change in a linear manner with the size of a protected area.
Figure 3 Per hectare present values of costs and benefits of conservation
The results are not dissimilar to those of other studies:
• The per hectare value of conserving the Ranomafana-Andringitra-Pic d’Ivohibe Corridor (Hockley and Razafindralambo, 2007) was estimated at US$916 (US$ at 2006 values) based on a 5% discount rate and 60-year time horizon. Adopting the same time period and discount rate, this study’s estimate of US$2,701 is three times the former estimate.
• In Kremen et al. (2000), the global benefit PV of Masaola National Park converted to per hectare values is US$2,804/ha. Applying the same time frame and the lower discount rate of the Kremen et al. (2000) study, this study finds a similar value of US$2,797/ha.
• Carret and Loyer (2003) estimate the PV per hectare of protected area in Madagascar to be US$15.70 (10% discount rate, 15-year time horizon) excluding carbon benefits. This national estimate masks great disparities between protected areas, according to the authors. In this analysis, the PV estimate for TGK at

28 Exploring ecosystem valuation to move towards net positive impact on biodiversity in the mining sector
a 10% discount rate with a 10-year time horizon and no carbon benefits is -US$358/ha. The difference is largely attributable to the exclusion of ecotourism benefits for TGK and the higher opportunity cost estimate used for TGK.
In short, if a market in hectares of biodiversity (or biodiversity offsets) existed in Madagascar, this study estimates that prices per rainforest hectare of the TGK type would range from roughly US$1,400 (the costs of supply) to US$3,597/ha (the value of ecosystem services). The values associated with the ecosystem services provided by TGK are economic values as it is unlikely that real financial transfers could be arranged to compensate for the provision of biodiversity and hydrological services. The ecosystem services with the greatest scope for converting economic values into financial values are ecotourism and carbon storage (innovative financial mechanisms). The distributional analysis below looks more closely at potential financial compensation for local communities.
4.3 Distribution of costs and benefitsWhile the focus of this study is to estimate the economic value of forest conservation in TGK from a global perspective, local level costs and benefits must be assessed to estimate the likelihood that conservation will be successful. If local communities are not compensated for loss of access to the forest and provided with alternative sources of income and forest products, the welfare implications of conservation will be negative, poverty will be increased and protection of the forest and its biodiversity may be ineffective.
Figure 2, page 25, indicates that the main economic benefits of conserving TGK are carbon storage and biodiversity; these benefits accrue globally. Madagascar receives little or no compensation for the continued provision of biodiversity and ecosystem services to countries that have already converted most of their forests to other land uses. On the other hand, most of the costs of conservation are borne locally—by relatively poor local communities and households who lose access to forest land for tavy and the collection of NTFPs.
While the PV of the global net benefits of conserving a hectare of TGK is roughly US$3,597/ha, the annual cost to local households are likely to be significant and have been estimated by various studies in other parts of Madagascar to be roughly US$44–93 per household (Ferarro, 2001; Minten, 2003). This asymmetry in who bears the costs and who reaps the benefits of biodiversity conservation is one of the underlying causes of deforestation and ecosystem degradation globally. When few benefits of conservation go to local communities, incentives to manage natural resources sustainably are weak.
Table 9 below summarises the parameters used to assess the potential impact on local livelihoods. The annual loss of income, due to restrictions on the conversion of forest for tavy, is compared to average annual household income in different parts of TGK. For households in the eastern part of TGK, where income is based on fishing and production from tavy is less important, the annual loss

Exploring ecosystem valuation to move towards net positive impact on biodiversity in the mining sector 29
in household income from tavy is between 12 and 35% of annual household income. However, for the poorer households in the western and northern communes, the value of lost tavy output can be up to 100% of household income, which suggests a serious impact on local livelihoods. Households in the poorer communes of TGK are more dependent on forest land for subsistence agricultural expansion—compensating these households is essential to avoid making local communities worse off as a direct result of conservation actions.
Table 9 Impact of lost agricultural opportunities on household income
Table 10 compares the opportunity costs of giving up tavy at the household level with potential financial revenue associated with REDD schemes. Opportunity cost is viewed from the perspective of the household rather than per hectare as in the analysis above. The returns to tavy per household per year have been calculated to be between US$44/hh/yr in US$ at 2008 values (Ferraro’s 2002 estimate for Ranomafana National Park) and US$93/hh/yr (Minten’s 2003 estimate of minimum willingness to accept compensation to abandon tavy in northeast Madagascar). The population affected by the programme around TGK is estimated to be roughly 20,000 individuals. With an average household size of six people (Talbot, personal communication, 2009) the value of tavy benefits to 3,330 households is roughly US$306,900 per year for all households, based on the upper estimate of opportunity cost.
Value Unit Sources/assumptions
Population affected 20,000 people Talbot personal communication, 2009
Average household size 6 people/hh Talbot personal communication, 2009
No. of households affected 3,330 households Authors’ calculations
Annual loss of hh income, US$/hh 93 US$/hh Minten, 2003
Average annual income
coastal communes eastern TGK
260–775 US$/hh Schéma de Développement Régional de l’Anosy, 2001, converted to US$ at 2008 values
Tavy income as % of annual hh income
12–35% % Authors’ calculations
western TGK 93–135 US$/hh Schéma de Développement Régional de l’Anosy, 2001, converted to US$ at 2008 values
Tavy income as % of annual hh income
70–100% % Authors’ calculations
northern TGK <95 US$/hh Schéma de Développement Régional de l’Anosy, 2001, converted to US$ at 2008 values
Tavy income as % of annual hh income
100% % Authors’ calculations

30 Exploring ecosystem valuation to move towards net positive impact on biodiversity in the mining sector
Table 10 indicates that local communities would need to receive roughly 22% of REDD revenue (at modest carbon prices and net of implementation and transaction costs) to not be made worse off as a result of conservation. Communities would need to receive a higher proportion of revenues to be made significantly better off. Benefit sharing in REDD projects and programmes is currently being explored in the TGK area. There are additional potential financial benefits at the local level associated with the expansion of ecotourism, but these are not explored here. It should be noted that broadly degradation is not automatically reduced even if local communities are compensated financially. If households’ source of income is removed, alternate employment is generally required—paying households in perpetuity not to work is not likely to be effective in eliciting changes in behaviour (Joy Hecht, personal communication).
Table 10 Distribution of costs and benefits and potential compensation
Is it realistic to aim for over a quarter of carbon revenue to go to local communities? The Makira Carbon project in north-eastern Madagascar has allocated carbon revenue as follows: 50% for the local population; 25% for the Wildlife Conservation Society (WCS) to manage Makira; 15% for forest administration; 5% for marketing to the Makira Carbon Company; 2.5% for verification costs; and 2.5% to operate a foundation to manage the funds (Ferguson, 2009).
Unit Value Source/notes
a) Opportunity cost (OC) to households
low $/hh/yr 44 Ferraro (2002)
high $/hh/yr 93 Minten (2003)
b) Number of hhs affected no. 3,300 Talbot (2010), pers comm. Based on 20,000 people affected and average hh size of 6
c) Total annual OC for hhs around TGK = a*b
US$/yr 306,900 no. of hhs*OC (high)
d) Area of TGK lost each year at 1% annual loss
ha/yr 605
e) CO2e released per ha per year tons/ha/yr 749 see carbon section
f) Price of CO2e US$/tonne CO2e 4.1 Tol’s lower bound estimate
g) CO2e price net of transaction costs
3.1 Olsen and Bishop (2010) and Boucher (2008) estimate US$1/tonne CO
2e in transaction and
implementation costs
h) Potential carbon revenue per year = d*e*(f-g)
US$/yr 1,404,749
i) OC as % of total carbon revenue per year = c/h
% 22%
Exploring ecosystem valuation to move towards net positive impact on biodiversity in the mining sector 31
While there is some scepticism that these results are realized on a regular basis (Hockley, personal communication) in Madagascar, this allocation may provide a good target. REDD projects in Madagascar and other rainforest nations are experimenting with different ways of allocating payments between stakeholders. Effective compensation of local communities depends not only on commitments to share PES benefits equitably, but also the capacity to ensure that individual households are compensated and that social inequalities at different levels do not negatively affect benefit distribution.
This analysis does not include the potential local benefits of community forestry (as does Kremen et al., 2000) due to lack of information. Nevertheless, the implementation of effective compensation mechanisms is essential for effective conservation. While direct payments are an option, annualized payments linked to PES schemes may provide a more secure continuous stream of income with which households can purchase goods and services equivalent to those previously produced through agricultural expansion on forest land.13
4.4 Sensitivity analysis Table 11 overleaf illustrates how the PV of the project changes under different assumptions regarding the discount rate, time horizon, rate of deforestation under BAU, WTP of rich country populations for biodiversity conservation and the inclusion/value of carbon and ecotourism. Each section varies one input parameter relative to the initial base case. As expected, the PV decreases with shorter time horizons and higher discount rates. Similarly, as the rate of deforestation in the BAU scenario rises, the PV of conservation rises as the benefits of higher levels of avoided deforestation are realized. The results are relatively robust with PVs of the base case ranging between roughly US$8.1 million to US$21.3 million for time horizons between 10 and 60 years and discount rates from 3–10%. The exclusion of carbon benefits, however, produces negative PVs for conservation, particularly over a 30-year time horizon. Benefits of conservation increase as the rate of deforestation under the BAU scenario increases because only benefits on the area of avoided deforestation are included in the cost-benefit analysis.
13 The BBOP Cost-Benefit Handbook provides detailed guidelines on how to estimate the costs and benefits to local stakeholders of project residual impacts and offset options.
Madagascar receives little or no
compensation for the continued provision of biodiversity and ecosystem services.

32 Exploring ecosystem valuation to move towards net positive impact on biodiversity in the mining sector
Table 11 Sensitivity analysis (US$ million)*
Time horizon (years)
Discount rate (percent) 10 30 60
0.03 11.2 21.3 18.3
0.05 10.2* 17.3* 16.3*
0.1 8.1 11.3 11.3
Deforestation rate (percent)
0.01 10.2* 17.3* 16.3*
0.02 22.3 37.8 37.8
0.05 58.6 99.2 102.4
Biodiversity (WTP US$/ha/yr)
30 10.2* 17.3* 16.3*
60 10.8 20.2 21.6
Carbon value (US$/tCO2e)
No carbon -3.3 -9.6 -16.8
Shadow price carbon, low end (US$4.1/tCO2e)
10.2* 17.3* 16.3*
Shadow price carbon, high end (US$12.7/tCO2e)
38.5 73.8 85.9
Market price REDD minus transaction costs (US$5.3/tCO2e)
14.1 25.1 26.0
US$20/tCO2e 62.4 121.3 144.5
No carbon -2.9 -7.1 -2.9
Ecotourism 100 visitors in yr2, 10% increase/yr to yr3–10, 5% thereafter
10.5 19.8 30.1
* base case = 5% discount rate, 1%deforestation.
Source: Authors’ calculations
4.5 Key pointsWhile there are significant economic benefits associated with the conservation of TGK, these are primarily driven by the value of stored carbon. This suggests that either biodiversity does not have much economic value or that the methods and data to measure and value biodiversity are inadequate. Science tells us that biodiversity and ecosystems are indispensable to human welfare so there is clearly a need to improve the availability of the data that is needed for biodiversity valuation.
It is likely that the existence values are underestimated because average WTP estimates were used to estimate these benefits, and averages do not take account of the high level of biodiversity and endemism, the prevalence of charismatic species, the high level of threat, etc. On the other hand, WTP for Malgache biodiversity might be lower than average, because it is less familiar than African
Exploring ecosystem valuation to move towards net positive impact on biodiversity in the mining sector 33
mega fauna or the Amazon rainforest. Original survey-based work establishing the WTP for the protection of the Tsitongambarika forest would better capture the premium that foreign populations may be willing to pay for conservation. The question is how much people from wealthy countires are really willing to pay for tropical biodiversity, if they had to pay. Contributions to NGOs like WWF might provide a useful lower bound and further work on these values and how to capture them via financial mechanisms is needed.
Linked to issues of value is the question of value to whom? The valuation of TGK indicates that the costs of conservation are predominantly borne locally (net benefits are negative in the absence of compensation) while benefits are global. This indicates the need for the development of financial mechanisms to transfer resources from those who benefit from biodiversity conservation to those who bear the costs locally.
In this context, payments for ecosystem services are being set up and resources transferred to local communities for the management and protection of parts of TGK. To date, Rio Tinto is paying for conservation because protecting biodiversity enhances the likelihood of getting a mining permit. Further work could usefully assess the adequacy and performance of PES schemes on the ground in maintaining or improving the well-being of local communities.
Finally, this analysis has attempted to value the biodiversity benefits associated with surplus hectares of forest biodiversity that are not needed to offset the environmental impact of Rio Tinto’s mining operations. As such, if a biodiversity banking system were to be established in Madagascar, a very rough approximation of the range of prices per hectare would be between US$1,400 (the costs of supply) to US$3,597/ha (the net benefits of conservation).
Existence values are underestimated
because average Willingness to pay
estimates were used to estimate these
benefits, and averages do not take
account of the high level of biodiversity and endemism, the
prevalence of charismatic species,
the high level of threat.

34 Exploring ecosystem valuation to move towards net positive impact on biodiversity in the mining sector
5 APPLICATION
This work has application for Rio Tinto at both a technical and strategic level. It has direct relevance to the company’s biodiversity strategy and will be used as a tool in programmes aimed at achieving NPI on biodiversity at an operational level.
At a technical level, this study has implications for the way Rio Tinto structures and manages the biodiversity offsets needed to achieve a net positive impact on biodiversity. The aim is to build valuation methodologies into corporate biodiversity action planning and into offset identification and implementation methodologies.
This study has addressed the question of the value of biodiversity benefits produced by conserving a forest biodiversity hotspot in Madagascar. The next phase of the project will integrate this methodology and its results into the existing biodiversity offset and NPI planning tool box. Valuation methodologies will be used to improve the rigour of the existing quality hectares methodology (Ekstrom and Anstee, 2010) that is used by Rio Tinto to calculate biodiversity losses and gains generated by development projects.
The use of valuation methodologies in this work presents new opportunities to identify ecosystem values and potential income streams that can be used to:
• provide long-term sustainable income streams for the TGK conservation programmes;
• provide long-term sustainable income streams for local communities that live and work in and around TGK, who may be disadvantaged by conservation programmes; and
• demonstrate that the company’s investment in the TGK conservation programmes is transparent, equitable across stakeholders, and commensurate with the value of the biodiversity impacts that are being offset by the TGK programme.
From a strategic point of view, Rio Tinto believes that the economic valuation of ecosystem services and the development of ecosystem service markets have the potential to change the way private companies manage their environmental footprints. Rio Tinto is using established relationships with its biodiversity partners and specifically its relationship with IUCN to explore how ecosystem services can be accurately valued and the implications for corporate risks and opportunities. For companies like Rio Tinto, robust methods of valuing ecosystem services and the development of well functioning markets for ecosystem services could provide an opportunity to use large non-operational land holdings to create new income streams for Rio Tinto and for local stakeholders and communities, through the sale of ecosystem service credits.

Exploring ecosystem valuation to move towards net positive impact on biodiversity in the mining sector 35
6 LIMITATIONS AND FURTHER WORK
This study has highlighted the limitations of using benefit transfer and the average values of a set of ecosystem services to estimate the value of conservation. Biodiversity values are highly sensitive to levels of biodiversity, endemism, the prevalence of charismatic species, the level of threat and other local factors. The application of global or regional average values does not capture the unique features of particular sites. It is therefore recommended that further work be based on site-specific surveys. Similarly, the livelihood and distributional impact of conservation was undertaken based on limited local data on how forests contribute to household livelihoods and further socioeconomic work is needed to estimate monetary levels and appropriate financial mechanisms for compensating local communities.
This study attempts to value biodiversity hectares which could potentially be used in an offsets programme, yet it does not directly address how ecosystem valuation could potentially contribute to developing biodiversity offsetting methodologies. The use of ecosystem valuation may or may not be able to address concerns over off-site or out-of-kind offsetting, for example.
This study does not look at the net benefits associated with the life cycle of a mining operation spanning from extraction and the damage associated with extraction through to restoration or rehabilitation and potentially off-site offsetting. As such, this study provides only a snapshot of a single section of the commercial extractive process.
This study has identified REDD as a potential new financial mechanism to provide a new income stream for both Rio Tinto as a large landholder to help finance its biodiversity conservation activities and for local communities who use and manage forest resources and who are affected by land-use decisions associated with mining and conservation. To move forward, it is envisaged that an independent forest carbon certification organization will be consulted to determine the potential for operationalizing REDD in this area.

36 Exploring ecosystem valuation to move towards net positive impact on biodiversity in the mining sector
ANNEX 1 Deforestation in the district of Fort-Dauphin and the southeast
of the district of Amboasary
Source: JariAla (2007)

Exploring ecosystem valuation to move towards net positive impact on biodiversity in the mining sector 37
ANNEX 2 Changes in forest cover by commune in the districts
of Fort-Dauphin and Amboasary
DISTRICT COMMUNE AireForêt
90Forêt
00Forêt
05 Base 90Perte 90–00
Taux 90–00 Base 00
Perte 00–05
Taux 00–05
Amboasary Atsimo 3908 3545 3462 3450 3545 83 0.23 3462 12 0.07
Behara 72522 67899 67334 66236 67899 564 0.08 67334 1098 0.33
Ifotaka 2042 1917 1906 1578 1917 11 0.06 1906 328 3.44
Manevy 7921 6733 6650 6555 5804 82 0.14 6583 81 0.25
Maromby 4528 3162 3097 3065 3159 64 0.20 3097 32 0.21
Tanandava Atsimo 4413 3831 3812 3791 3831 19 0.05 3812 21 0.11
Tranomaro 20892 17716 17343 16272 17716 373 0.21 17343 1070 1.23
Ambatoabo 40396 26534 26365 25429 26152 166 0.06 26298 881 0.67
Ampasimena 10272 9208 8054 7415 906 1116 1.25 7875 495 1.26
Ampasy 3335 2924 2559 1468 2899 364 1.25 1833 373 4.07
Analapasta I 772 666 628 614 666 38 0.57 617 3 0.09
Andranobory 7270 6086 5673 5613 6081 412 0.68 5660 53 0.19
Ankaramena 3630 3340 3136 3087 3133 0 0.00 3120 36 0.23
Ankarera 21739 15895 15715 15661 15586 55 0.04 15532 53 0.07
Bevoay 8803 7671 6995 6855 7504 652 0.87 6931 87 0.25
Enakara 7078 6715 6124 6053 5957 590 0.99 5922 61 0.21
Enaniliha 23580 22486 22199 22133 20302 287 0.14 21593 6 0.01
Fenoevo 5597 5178 5093 5013 4903 85 0.17 5093 80 0.32
Iabakoho 7622 7237 6800 6478 7041 425 0.60 6416 115 0.36
Ifarantsa 4393 3879 3567 3018 3793 312 0.82 3446 431 2.50
Isaka-Ivondro 7442 6816 6510 6465 5984 307 0.51 6492 39 0.12
Mahatalaky 19951 17397 16280 15336 16768 1043 0.62 15459 365 0.47
Manambaro 7160 6369 6337 6177 6206 15 0.02 6227 52 0.17
Manantenina 8118 7225 4469 3275 7137 2740 3.84 4322 1126 5.21
Mandiso 5313 4804 4758 4666 4678 46 0.10 4728 64 0.27
Mandromodromotra 594 552 475 233 552 77 1.39 418 185 8.83
Ranomafana 17694 16203 15228 15063 14104 940 0.67 14745 118 0.16
Ranopiso 6011 5302 5255 5208 5199 1 0.00 5193 41 0.16
Sarasambo 618 579 417 281 579 162 2.80 392 111 5.68
Soanierana 1917 1632 1586 1008 1621 42 0.26 1028 20 0.40
Tolanaro 56 47 47 17 47 0 0.00 19 1 1.30
Total Anosy 335585 289546 277875 267513 279662 11073 0.40 272896 7437 0.55
Source: JariAla (2007) cited in Holmes and Burren (2007).
AM
BO
ASA
RY
ATS
IMO
TAO
LAN
AR
O

38 Exploring ecosystem valuation to move towards net positive impact on biodiversity in the mining sector
BIBLIOGRAPHY
Andriamasimanana, R. 2008. Appui à l’élaboration du schéma d’aménagement du foret de Tsitongambarika, Tolagnaro, par des outils d’observations de la terre.
Asity Madagascar 2009. Plan d’aménagement et de gestion de la NAP Tsitongambarika, Fort-Dauphin, Région Anosy.
Baranzini, A., Faust, A.K., Huberman, D. 2010. Tropical forest conservation: attitudes and preferences. Forest Policy and Economics 12 (2010), 370–376.
Barret, M., Brown, J., Morikawa, M., Labat, J.N. and Yoder, A. 2010. CITES Designation for Endangered Rosewood in Madagascar. Science Vol. 328, May 2010.
Bateman, I., Brouwer, R., Cranford, M., Hime, S., Ozdemiroglu, E., Phang, Z., Provins, A. 2009. Valuing environmental impacts: practical guidelines for the use of value transfer in policy and project appraisal. Report to Defra.
Boucher, D. 2008. Out of the woods: A realistic role for tropical forests in curbing global warming. Union of Concerned Scientists, December 2008, Cambridge, MA.
Brand, J. 2004. Suivi de la cartographie du couvert forestier à Tsitongambarika II. Projet de gestion des ressources forestières dans la région de Fort-Dauphin.
Brand, J., Healy, T., Keck, A., Minten, B. and Randrianarisoa, J.C. 2003. Mythes et réalités sur l’aménagement des basins-versants: l’effet de la déforestation des versants sur la productivité des bas-fonds. Policy Brief. FOFIFA Programme ILO, March 2003.
Business and Biodiversity Offset Programme (BBOP). 2009. Biodiversity Offset Cost Benefit Handbook. BBOP, Washington, D.C. http://bbop.forest-trends.org/guidelines/index.php.
Carret, J.C. and Loyer, D. 2003. Madagascar protected area network sustainable financing – economic analysis perspective. Paper contributed to World Park’s Congress, Durban South Africa, September 2003.
Critical Ecosystem Partnership Fund 2000. Ecosystem of the Madagascar & Indian Ocean Islands Biodiversity Hotspot. http://www.cepf.net/Documents/final.madagascar.ep.pdf
DEFRA. 2007. An introductory guide to valuing ecosystem services. London, UK.

Exploring ecosystem valuation to move towards net positive impact on biodiversity in the mining sector 39
Ekstrom, J. and Anstee, S.D. 2010. Quality hectares: An area based method of quantifying biodiversity loss and gain as part of a mining company’s project development. In prep.
Ferguson, H. B. 2009. REDD in Madagascar: An Overview of Progress, Independent Report, November 2009.
Ferraro, P.J. 2002. The local costs of establishing protected areas in low income nations: Ranomafana National Park, Madagascar. Ecological Economics, 43, 261–275.
Hockley, N. and Razafindralambo, R. 2006. A social cost-benefit analysis of conserving the Ranomafana-Andringitra-Pic d’Ivohibe Corridor in Madagascar. USAID/Madagascar.
Holmes, C. and Burren, C. 2007. Stratégie d’aménagement pour le massif forestier de Vohimena. Rapport final, USAID Madagascar.
Holmes, C., Ingram, J.C., Meyers, D., Crowley, H. and Victurine, R. 2008. Forest carbon financing for biodiversity conservation, climate change mitigation and improved livelihoods: the Makira forest protected area, Madagascar. WCS Madagascar Programme.
Horton, B., Colarullo, G., Bateman, I., Peres, C. 2003. Evaluating non-user willingness to pay for a large scale conservation programme in Amazonia: a UK/Italian contingent valuation study. Environmental Conservation 30 (2), 139–146.
International Finance Corporation. 2008. Tapping tourism for growth in Madagascar. http://www.ifc.org/ifcext/africa.nsf/Content/Tourism_Main_Madagascar
Kramer, R. and Mercer, E. 1997. Valuing a global environmental good: US residents’ willingness to pay to protect tropical rain forests. Land Econ 73:196–210.
Kramer, R., Sharma and Munasinghe, M. 1995. Valuing tropical forests: methodology and case study of Madagascar. Environment Paper no. 13. World Bank, Washington, D.C.
Kremen, C., Razafimahatratra, V., Guillery, R.P., Rakotomalala, J., Weiss, A. and Ratsisompatrarivo, J-S. 1999. Designing the Masoala National Park in Madagascar based on Biological and Socio-economic Data. Conservation Biology, Volume 13, No. 5, October 1999.
Kremen, C., Niles, J., Dalton, M., Daily, G., Ehrlich, P, Fay, J., Grewal, D. and Guillery, R. 2000. Economic incentives for rain forest conservation across scales. Science, 9 June 2000, Vol. 288.

40 Exploring ecosystem valuation to move towards net positive impact on biodiversity in the mining sector
Meyers, D. 2001. Makira Forest Project Madagascar. Report for MEF-IRG/PAGE-USAID.
Minten, Bart. 2003. Compensation and cost of conservation payments for biodiversity. Cornell Food and Nutrition Policy Program Working Paper No. 142. Available at SSRN: http://ssrn.com/abstract=424121.
Mullan, K. and Kontoleon, A. 2008. Benefits and costs of forest biodiversity: economic theory and case study evidence.
Myers, N., Mittermeier, R., Mittermeier, C., da Fonseca, G. and Kent, J. 2000. Biodiversity hotspots for conservation priorities. Nature Vol. 43, 2000.
Navrud, S. and Brouwer. 2007. Good practice guidelines in benefit transfer for forest externalities. COST Action E45, European Forest Externalities (EUROFOREX).
OECD. 2005. http://stats.oecd.org/glossary/detail.asp?ID=6356
Olsen, N. and Bishop, J. 2009. The financial costs of REDD: Evidence from Brazil and Indonesia. IUCN, Gland, Switzerland.
Pearce, D.W. and Pearce, C. 2001. The value of forest ecosystems. Secretariat of the Convention on Biological Diversity Technical Series No. 4.
Pearce D. 2007. Do we really care about biodiversity? Environmental and Resource Economics (2007) 37: 313–333.
Rakotoarison, B.F. 2002. Evaluation économique des bénéfices hydrologiques du programme environnement III à Madagascar. Mémoire de fin d’études en vue de l’obtention du diplôme d’ingénieur agronome. Université d’Antananarivo école supérieure des sciences agronomiques.
Ramanitra, N., Safford, R., and Ekstrom, J. (eds.). 2006. Inventaire et identification des sites biologiques dans la forêt humide de Tsitongambarika et perspective de conservation. Rio Tinto/QMM/BirdLife/Asity/Madagascar Voakajy/MBG.
Rio Tinto 2008. Rio Tinto and biodiversity: Achieving results on the ground. Available at http://www.riotinto.com/ourapproach/17214_biodiversity.asp
Shyamsundar, P. and Kramer, R. 1996 Tropical forest protection: An empirical analysis of the costs borne by local people. Journal of Environmental Economics and Management, 3, 129–144.
Solonitompoarinony, J. 2000. Dommage hors site de l’érosion : les effets de l’ensablement sur la production rizicole. Etude de cas dans la Commune d’Ambohitrarivo. MINEV, ONE, USAID, CFSIGE, PAGE, FAC DEGS, Programme ILO.

Exploring ecosystem valuation to move towards net positive impact on biodiversity in the mining sector 41
Temple, H.J., Anstee, S., Ekstrom, J., Pilgrim, P., Rabenantoandro, J., Ramanamanjato, J.-B., Randriatafika, F. & Vincelette, M. 2011. Forecasting the path towards a Net Positive Impact on biodiversity for Rio Tinto QMM. IUCN and Rio Tinto Technical Series No. 2. Forthcoming.
ten Kate, K., Bishop, J. and Bayon, R. 2004. Biodiversity offsets: Views, experience, and the business case. IUCN, Gland, Switzerland and Cambridge, UK and Insight Investment, London, UK.
UNCTAD. E-tourism at a glance… Madagascar. http://www.unctadxi.org/sections/SITE/etourism/docs/Madagascar.pdf

Nathalie Olsen, Joshua Bishop and Stuart Anstee
IUCN and Rio Tinto Technical Series No.1
Exploring ecosystem valuation
to move towardsnet positive impact
on biodiversity in the mining sector