Exploring Differences between Large and Medium...
43
1 Exploring Differences between Large and Medium Organizations’ Corporate Governance of Information Technology Carla L. Wilkin* Department of Accounting, Monash Business School, Monash University, Victoria, Australia Email: [email protected] Paul K. Couchman Consultant Email: [email protected] Amrik Sohal Department of Management, Monash Business School, Monash University, Victoria, Australia Email: [email protected] Ambika Zutshi Department of Management, Deakin University, Victoria, Australia Email: [email protected] September 2015 * contact author
Transcript of Exploring Differences between Large and Medium...

1
Exploring Differences between Large and Medium Organizations’ Corporate Governance of Information Technology
Carla L. Wilkin* Department of Accounting, Monash Business School, Monash University, Victoria, Australia
Email: [email protected]
Paul K. Couchman Consultant
Email: [email protected]
Amrik Sohal Department of Management, Monash Business School, Monash University, Victoria, Australia
Email: [email protected]
Ambika Zutshi Department of Management, Deakin University, Victoria, Australia
Email: [email protected]
September 2015
* contact author

2
Exploring Differences between Large and Medium Organizations’ Corporate Governance of Information Technology
ABSTRACT As a subset of corporate governance, Corporate Governance of Information Technology (CGIT) is particularly targeted at maximizing IT investment, including for achieving organizational objectives and business value. Yet there is little empirical evidence concerning organizations’ attitudes to and use of CGIT, and related policies, practices, frameworks and methodologies to deliver such business value. Given our focus on governance rather than management of IT, we were guided by ISO/IEC 38500:2008’s six principles for CGIT to structure our investigation. Findings from our survey of Australian Chief Information Officers (CIOs) and executive managers of large and medium organizations inform this appraisal regarding the relevance, influential drivers, challenges and perceived benefits for organizations’ use of CGIT. Surprisingly our findings demonstrate substantially the same benefits, influences and challenges regardless of organizational size. Besides the widely-acknowledged role of IT strategic alignment, findings demonstrate the significance of risk management both in influencing the decision to adopt CGIT and as a perceived key CGIT benefit for improved organizational capability and resource-based value. This contributes new knowledge related to delivering business value through governing IT. Keywords: Corporate governance of information technology (CGIT), IT value, resource-based theory (RBV), capability theory, survey, alignment

3
1. Introduction
Given Information Technology’s (IT’s) pervasive role in organizational processes used to
support business objectives, and given global expenditure projected as $3.8 trillion in 2014
(Gartner, 2014), value delivery from IT investment remains a concern (Kohli and Grover, 2008;
Wilkin et al., 2013; Wu et al., 2015). Our paper focuses on a subset of corporate governance,
namely Corporate Governance of Information Technology (CGIT), particularly its strategic focus
on IT’s improved organizational performance and relevance. Such IT governance has been defined
as “the responsibility of the board of directors and executive management. It is an integral part of
enterprise governance and consists of the leadership and organizational structures and processes
that ensure that the organization’s IT sustains and extends the organization’s strategies and
objectives” (ITGI, 2003 p.10).
To enhance the capability of IT to create business value, a number of CGIT-related tools and
management systems have been developed. These include: PRINCE2 (Projects in Controlled
Environments); ITIL (IT Infrastructure Library); COBIT (Control Objectives for Information and
Related Technology); Val IT (Value from IT investments); and ISO/IEC 38500:2008 (an
international standard for CGIT). Whilst the body of research concerned with IT governance issues
in Australia is growing (e.g., Zhao et al., 2008; Campbell et al., 2009; Robb and Parent, 2009;
Wilkin and Riddett, 2009; Wilson and Pollard, 2009; Wilkin et al., 2013), few studies have
explored practitioner views of CGIT, including the influences, challenges and perceived benefits
as related to organizations’ application of CGIT policies and practices. Furthermore, there is a lack
of research into organizations’ perceptions of the relevance of ISO/IEC 38500:2008’s principles.
Our study addresses these knowledge gaps through a survey of Australian business and IT
executives whose roles engage with the CGIT. Coupled with this, given recognition that resource-

4
constrained small-and-medium enterprises (SEs and MEs) face significant challenges in managing
their assets to achieve sustainable competitive advantage (Beck et al., 2005; Cragg et al., 2011),
we were interested in any perceived differences between smaller and large organizations (LOs)
concerning use of, motivation for, and derived benefits from CGIT. Our survey respondents were
found to represent MEs and LOs. Findings show that: MEs were as equally engaged with CGIT
and business/IT alignment as their larger counterparts; that human engagement was a primary
source of challenge for both; and that risk management was a primary influence upon organizations
of both sizes to engage with CGIT.
To investigate these issues, our research questions were:
RQ1: What is the extent of awareness amongst IT and business executives regarding CGIT
and its related frameworks and/or methodologies that facilitate the delivery of
business value?
RQ2: How do the views of IT and business executives concerning CGIT differ between
smaller and larger organizations?
RQ3: For organizations with a CGIT policy, what practices are followed? What influences
adoption of CGIT as a policy? What are perceived as the principal benefits and
challenges associated with implementing CGIT? What structures, processes,
mechanisms and resources support CGIT?
RQ4: Given its specific CGIT focus, to what extent are ISO/IEC 38500:2008’s principles
applied in organizations?
The importance of investigating these issues can be gauged from prior studies, which
demonstrate a series of high profile IT project failures (e.g., Hutchinson, 2010; Toomey, 2009)
and organizations failing to realize benefits from their IT investments (e.g., Barua et al., 2010).

5
For example, a Commission of Inquiry into Queensland Health’s payroll IT disaster reported that
this failure related to governance practice, not the relevant standards (Chesterman, 2013). Even so,
Standards Australia released an updated standard as a response (Clarke, 2014). Similarly conflicted
reports are evident in the USA. The US Air Force’s development of the Expeditionary Combat
Support System (ECSS), which was scrapped after spending over a billion dollars for reportedly
“zero results” (Shaw, 2012 p.1), has been attributed to the lack of an assigned “accountable leader”
who would exercise authority to enforce organizational changes necessary for successful project
implementation (Stross, 2012 p.2). In other words, the failure was in the exercise of IT governance,
not necessarily in the relevance of an applicable standard.
These scenarios suggest that investigation is required into what constitutes current CGIT
practice, the relevance of related tools/standards, and their capability for delivering organizational
value from IT. Our reporting on these issues is organized as follows. After reviewing the relevant
literature we introduce our theoretical perspective. We then discuss the research methods and the
study’s context. After discussing our findings and their implications, we outline limitations and
suggest opportunities for future research.
2. Literature review and theoretical framework
2.1. Corporate Governance and CGIT
Corporate governance is the system that directs and controls organizations to manage their
operations effectively in order to meet stakeholder expectations concerning financial and
environmental matters (Cadbury, 1992; OECD, 1999). In its long history (Shleifer and Vishny,
1997; Daily et al., 2003), a number of challenges have been identified. For example, Berle and
Means (1932) identified problems created by separating ownership and control in modern

6
corporations. Mace (1971) highlighted the limited role of boards given managerial hegemony
within these corporations, while Jensen and Meckling (1976) formulated Agency Theory to
explain how corporations could prosper despite evident self-interest propensities in managers’
behaviour when acting as agents for the shareholders.
Reflected in the growing importance of IT to organizations’ operations and performance, CGIT
has become a more recent governance focus (Calder, 2008; Wilkin et al., 2013). Although its
nomenclature may vary (e.g., Henderson and Venkatraman, 1993; Weill, 2004; Van Grembergen
and De Haes, 2009; ISACA, 2012), a common theme of this burgeoning research concerns
ensuring that IT decision-making is directed towards achieving organizational goals and
objectives, including as part of organizational governance.
2.2. Use of CGIT to build capability and increase business value
IT research has long been concerned with generating value from/through IT. Foci have included
IT productivity, and achieving value through IT capability (Lim et al., 2011) using performance
metrics such as ROI and the Balanced Scorecard (Masli et al., 2011; Hirscheim and Klein, 2012).
Value creation is often conceptualized through strategic business/IT alignment with recognition
that “the next generation of IT value studies should focus on the co-creation of value through IT
rather than on IT value alone” (Kohli and Grover, 2008 p.28). This is challenging “in an
environment characterized by networks of inter-firm relationships, increasing prevalence of data
and sophisticated analytics, and hyper-competition that requires agility and responsiveness as
critical outcomes in the marketplace” (Kohli and Grover, 2008 p.36). In such contexts CGIT
becomes essential to reduce organizational risk and target IT capabilities that deliver on
organizational objectives (ITGI, 2009; Kohli and Grover, 2008). ISO/IEC 38500:2008 and COBIT

7
are some frameworks that claim to provide guidance regarding governing IT (ISO/IEC
38500:2008; ITGI, 2009) for such improved performance. Yet few studies have reviewed
organizational perceptions of what influences CGIT adoption, perceived benefits and challenges
associated with the application of CGIT principles (De Haes and Van Grembergen, 2010; Higgins
and Sinclair, 2008; Wilkin and Chenhall, 2010).
2.3. CGIT tools: related frameworks, methodologies and a standard
In response to building capability and increasing business value, industry-based associations such
as ISACA, PMI and ITGI1 have developed and promulgated tools and management systems. For
example COBIT 4.1 and COBIT 5, COSO, PRINCE 2, CMMI and ITIL outline a mixture of
appropriate structures, processes and relational mechanisms related to delivering more effective
IT outcomes (e.g., Burtscher et al., 2009; De Haes and Van Grembergen, 2009, see Figure 1).
Whilst our study primarily focuses on CGIT principles as evidenced in ISO/IEC 38500:2008, a
comparative review of these tools, management system and framework is reported in Appendix 1.
Each has its own emphasis, with ISO/IEC 38500:2008’s focus being those principles and three
main tasks that governing bodies should act upon in their corporate focus on IT governance
(Toomey, 2009).
1 Information Systems and Audit Control Association (ISACA); Project Management Institute (PMI); and IT Governance Institute (ITGI).

8
Figure 1. Relationship between the frameworks, methodologies, standard and IT functions Note: This model has been adapted from Cater-Steel et al. (2006) and in turn Ratcliffe (2004). More details about the purpose of these is provided in Appendix 1.
2.4. RBV and CGIT: Theorizing smaller and larger organizations’ differences
Our adopted perspective is grounded in the Resource-Based View (RBV) of the organization,
whose central proposition is that to achieve sustainable competitive advantage, an organization
should possess valuable, rare, inimitable and non-substitutable resources together with
organizational structures, systems and processes required to exploit the full potential of those
resources (Barney, 2001; Barney and Mackey, 2005). We contend that for organizations to have a
dynamic, fully operational and high performing IT function, a core capability is effective IT
governance i.e., ‘Integrating Information Systems (IS)/IT effort with business purpose and
activity’ (Feeny and Willcox, 1998). RBV’s particular significance for IS research is as “a valuable
way for IS researchers to think about how information systems relate to organization strategy and
performance. In particular, the theory provides a cogent framework to evaluate the strategic value
of information systems resources” (Wade and Hulland, 2004 p.109).

9
For our purposes, Wade and Hulland (2004) make two major contributions concerning
application of RBV to IS research. Firstly, they regard resources as comprising assets ‘anything
tangible or intangible a firm can use in its processes for creating, producing and/or offering its
products (goods or services) to a market’, and capabilities ‘repeatable patterns of actions in the
use of assets to create, and/or offering products to a market’. Tangible assets, such as IT systems,
are regarded as easy resources for competitors to copy and so not a source of sustainable
competitive advantage. Sources of advantage may include deployment of distinctive capabilities
(e.g., managerial abilities) and intangible assets (e.g., software patents and strong supply chain
relationships). This perspective is evident in recent studies of IT performance (Prasad et al., 2012;
Debreceny and Gray, 2013). Secondly, this RBV view emphasizes how resource complementarity
may create and sustain competitive advantage: resources influence each other with their inter-
relationships affecting competitive performance, notably by complementing/enhancing each other
(i.e., Kraaijenbrink et al., 2010).
From this RBV perspective, “the alignment between IT and complementary resources is what
ultimately makes IT a potential competitive enhancing resource” (Weingarten et al., 2013 p.32).
Drawing on contingency theory (e.g., Weill and Olson, 1989; Ifinedo, 2007), the organizational
resources of strategy, processes, culture and structure are complementary to IT resources (both
human and technological). The better that these two sets of resources are aligned, “the more likely
a firm is to develop IT-based organizational capabilities that can be a source of long-term
performance improvement” (Weingarten et al., 2013 p.41). Research provides inconclusive
answers regarding the relationship between CGIT and firm performance. CGIT has been shown
to: moderate the influence of IT-relatedness on organizational performance (Tanriverdi, 2006); be
linked to organizational performance through efficiency gains (Lunardi et al., 2014); contribute to

10
performance through improved IT-related capabilities (Prasad et al., 2012); and be mediated in its
effect on performance by IS alignment (Wu et al., 2015).
However, there is little consensus about the benefits of CGIT to RBV, or their derivation in
practice. We argue that development of effective IT governance mechanisms within an
organization, with related organization-specific components of leadership, structures, processes
and relational mechanisms (Burtscher et al., 2009), constitutes a distinctive organizational
competence. In this, we construe a competence as a systemic ability to deploy combinations of
resources to create a specific set of capabilities (Teece et al., 1997). IT governance competence
creates IT-related capabilities for the organization i.e., CGIT should contribute organizational IT
capabilities and competence through: (1) strategic alignment between business and IT, so IT
investments deliver value to the business; and (2) alignment of IT and non-IT organizational
resources to achieve resource complementarity such as strategy, structure, process and culture (i.e.,
Weingarten et al., 2013). This competence and associated IT-related capabilities are specific,
distinctive to the organization, non-substitutable and often difficult to imitate (not least because
they are embedded within the organization’s culture and routines). As such, according to the RBV,
they are a source of sustainable competitive advantage.
In comparison to LOs, SEs and MEs are resource-constrained (most notably of finance,
specialist personnel, and management capabilities). These resource constraints are widely
acknowledged as limiting their competitiveness and capabilities in areas such as innovation
(Kleinknecht, 1989; Rosenbusch et al., 2011), knowledge management (Hutchison and Quintas,
2008; Durst and Edvardsson, 2012), and IT/IS competency (Tippins and Sohi, 2003; Cragg et al.,
2011). On this basis, we would expect evidence of smaller organizations’ lesser use of IT
governance frameworks, methodologies and formal policies. Two particular resource constraints

11
inform this expectation. Firstly, a lack of personnel with specialist knowledge in CGIT issues could
lead to SEs’ and MEs’ reduced absorptive capacity in this area (Zahra and George, 2002). With
less internal capacity to identify, assess, acquire and apply such relevant knowledge (Madrid-
Guijarro et al., 2009), they could face significant obstacles in developing a distinctive IT
governance competence. This is consonant with the contingency approach of Sambamurthy and
Zmud (1999), who argued that IT-related absorptive capacity was one of three determinants of an
organization’s IT governance arrangements (the other two being corporate governance and
economies of scope).
Secondly, smaller organizations tend to have fewer managerial resources and skills (Georgiadis
and Pitelis, 2012). This is problematic as managerial capabilities are arguably the most important
for organization growth (Penrose, 1959). Further there is a widely-held view that links poor
managerial competence with small business failure (Walker et al., 2007). Managerial capability
constraints, deriving from limited knowledge, experience, training and development (Fuller-Love,
2006), can also limit the development of critical IS capabilities in areas such as strategy
formulation, defining IT’s contribution and capability, exploiting IT investments, delivering IT
business solutions, and maintaining IT resource capacity (Peppard and Ward, 2004). With such
limited management capacity, the overarching CGIT competence through which the IT and
business interdependencies are effectively addressed, is also less likely to be developed.
3. Context, research method, sample and data analysis
3.1. Research context: smaller and larger organizations
The decision to compare smaller and larger organizations stems from the important yet distinct
economic and employment contributions each make to national economies, including through IT

12
investment. Whilst no universal definition of small and medium organizations exists, as this study
was conducted in Australia, we adopted the ABS’ definition, where a small business is defined as
one that employs <20 people, a medium one 20-200, and large organizations >200 (ABS, 2012).
Regarding IT investment, in 2008–2011 larger Australian organizations spent 30% of total
investment on new technologies (Deloitte, 2012). Related evidence of similar objectives for SMEs
includes: (1) in May 2013 94% “of SMEs had an internet connection” and were active online; (2)
94% of connected SMEs used the internet for communication purposes (banking was the next
largest at 77%); (3) 50% “of connected SMEs performed seven or more different types of online
activities including multiple types of communications, financial transactions, search and
information, and marketing”; and (4) 18% were exploring business opportunities through
developing mobile-optimized websites (ACMA2, 2014 pp.1-2). Yet comparison of online sales
and orders illustrates some lagging by smaller Australian companies. For example (ABS, 2015),
in the period 2013-2014, 87.5% of LOs placed orders online, compared with 73.8% of MEs and
56.5% of SEs. Orders received via the internet were LOs 48.2%, MEs 45.6% and SEs 34.4%. For
the same period (ABS, 2015), internet income was A$b146.2 for LOs, and estimated as A$b59.2
for MEs and A$b30.7 for SEs. These figures, plus SMEs being collectively estimated to have
generated 57% of total business income in the period June 2011-12 (ACMA, 2014), suggest SEs’
and MEs’ business objectives are less IT-focused than LOs.
3.2. Research method
Through an anonymous Qualtrics survey deployed over a 25 week period in 2013/2014, we
sought the views of business executives and Chief Information Officers (CIOs) from Australian
2 Australian Communications and Media Authority

13
large and smaller organizations about their IT oversight/governance. Variation in organizational
size presented a unique opportunity to investigate common relationships and appreciate differences
(Sonquist and Dunkelberg, 1977; Gable, 1994).
Besides background information on respondents’ experience and their organizations’ size, our
survey focused on: use of IT governance frameworks and tools; interpretation of CGIT; incidence
of CGIT policies and associated practices; influences on the decision to adopt CGIT; extent of
achieved CGIT benefits; challenges associated with CGIT; and application/applicability of the
principles in ISO/IEC 38500:2008. Questionnaire items were developed using a deductive
approach. Firstly, we drew on an understanding of CGIT acquired from prior studies and secondly
used input from a project editor for ISO/IEC 38500:2008. Thirdly, we fine-tuned the instrument
using members of an ISACA chapter (where membership would indicate interest and/or work-
related expertise with IT governance), then pilot-tested it with six experts who independently
contributed their CGIT-related knowledge. Resultant minor revisions addressed
comprehensibility, question relevance and completion time.
To reach the targeted executive population, non-probability convenience sampling (Neuman,
2011) was used as a cost-effective, convenient and acceptably rigorous approach (Couper, 2000;
De Vaus, 2002; Alreck and Settle, 2004). The survey was conducted in partnership with an
Australian organization whose strong online presence and publication of a leading practitioner
magazine targeted CIOs and/or those interested in IT matters. Besides providing a link on the home
page of their online magazine, the survey was promoted on LinkedIn and at public events such as
summits and roadshows. To enhance response rates respondents could enter into a draw for an
Apple iPad.

14
3.3. Description of the sample
In total 190 people connected to the survey website, with 144 providing answers to the
descriptive questions and most of the items. After eliminating one response for capricious answers,
the final sample comprised 143 responses: 127 (89%) male and 16 (11%) female respondents.
Given the survey’s specific nature and related characteristics of our target population (i.e., high
pressured, time-poor executives including CIOs, CEOs and CFOs), when compared with our
partner magazine’s ‘annual state of the CIO survey with just over 200 respondents in 2013, we
argue a satisfactory response. Overall 30.1% of respondents held the position of CIO; 16.8% were
IT Directors; 13.3% Operations Managers; with a range of other IT and senior management
personnel included. Such findings confirmed we reached our target population, namely middle-to-
upper level managers or executives with links to IT roles (see Table 1 below). Consistent with the
ABS, we used employee numbers to categorize the represented organizations. Of the 143
respondents:
• 100 were from organizations in the LO category i.e., the median was 1,500 employees,
the mean 7,322, and the range 200-9000 employees.
• 43 were from MEs i.e., the median was 50 and the mean was 57. This aligns with ABS’
definition of an ME having 20-200 employees.
Given these figures and that SEs do not normally have position descriptions such as CIOs, it
seemed reasonable to construe our sample as 30.1% Medium Enterprises (MEs) and 69.9% LOs.
We therefore report our findings in these terms of MEs and LOs.
As current economic conditions have engendered fluidity in the corporate environment, it is
unsurprising that 101 (71%) respondents have been in their current position for ≤ 5 years; and 97
(68%) respondents in their current organization for ≤5 years. Only 1.4% had been in their position

15
for >20 years: 3.5% in their organization for >20 years. Such trends were consistent regardless of
organization size. Whilst respondents represented diverse industry sectors, the strongest
representation was Government Administration and Defence (21%), Finance and Insurance
(10.5%), Education (9.8%) and Manufacturing (7%). Interestingly 83.9% of the respondents’
organizations had headquarters in Australia (US next at 7%), with six Australian states being
represented. Given our sample we acknowledge potential Australian bias.
Table 1: Descriptive statistics of the sample3
MEs n = 43
LOs n = 100
Overall n = 143
Gender % % % Male 81.4 92 88.8 Female 18.6 8 11.2 Position Chief Executive Officer (CEO) 4.7 1 2.1 Chief Information Officer (CIO) 20.9 34 30.1 IT Director 16.3 17 16.8 Chief Operating Officer (COO) 2.3 0.7 Operations Manager 11.6 14 13.3 Other 44.2 34 37.1 Time in position (years) 0 – 2 44.1 31 35 3 – 5 27.9 39 35.7 6 – 10 11.6 19 16.8 10+ 13.9 11 11.9 Missing 2.3 0.7 Time in org. (years) 0 – 2 44.1 29 33.6 3 – 5 27.9 37 34.3 6 – 10 6.9 22 17.5 10+ 18.5 10 12.6 Missing 2.3 2 2.1 Industry Accomm., cafes and restaurants 1 0.7 Retail trade 9.3 1 3.5 Communication services 2.3 5 4.2 Cultural and recreational services 1 0.7 Transport and storage 2.3 5 4.2 Electricity, gas and water supply 5 3.5 Education 4.7 12 9.8 Government admin. + defence 18.6 22 21 Finance and insurance 7 12 10.5 Health and community services 7 3 4.2 Manufacturing 4.7 8 7 Mining 4.7 3 3.5
3 Not all respondents completed every item, resulting in missing data. Thus, in some tables the percentages do not add to 100%. This missing data could be due to factors such as respondent fatigue, unwillingness to divulge or ascertain specific data, time pressures and or perceived lack of knowledge about a question/set of questions.

16
Construction 4 2.8 Property and business services 2.3 5 4.2 Personal and other services 4.7 1.4 Others IT/ICT 6.9 5 5.6 Others Professional services 3 2.1 Others (Mgmt) Consulting 9.3 2.8 Others Various 16.1 5 8.4
3.4. Data Analysis
We analyzed the quantitative data using SPSS v20. Having differentiated respondents’
organizational size using the ABS’ definition, in accord with conventional statistical practice, we
used two tests of significance to compare the two groups: the t-test where means were compared;
and the chi-square test for contingency tables where the variables were nominal data. In each test,
the null hypothesis was proved meaning that there was no difference between MEs and LOs.
For the open-ended questions, we used qualitative data analysis to interrogate responses (single
words, phrases and/or sentences). Based upon analytical induction manual thematic analysis we
identified categories or themes (Braun and Clarke, 2006; Guest et al., 2011). Rather than drawing
on any theoretical perspective or a priori framework, three independent experts derived categories
from the data in a process akin to that of ‘open coding’ (Glaser and Strauss, 1967; Strauss and
Corbin, 1990). Here, using a coding sheet without prompts, our experts independently categorized
responses according to a set of identified emergent themes. Consequently, this semantic analysis
(Braun and Clarke, 2006) was oriented towards description and interpretation of the broader
meanings encapsulated in the identified themes. When tallied for MEs and LOs, findings showed
strong inter-rater reliability (about 88%).
Having contextualized our method, sample and analytical approaches, we report findings.

17
4. Findings
4.1. CGIT Frameworks and methodologies – awareness and implementation
Premised upon the framework presented in Figure 1 (see above), we explored practices and
attitudes towards CGIT by probing awareness and implementation of the identified IT
management and governance frameworks. Holistically (see Table 2 below) our findings reveal that
Val IT, COBIT and Risk IT (frameworks related to IT management and governance) have medium
levels of awareness (42.7%, 56.6% and 44.8% respectively), but low levels of Awareness and
Implementation (5.6%, 19.6% and 14.7% respectively). In comparison, methodologies that
facilitate project management, such as Prince 2, have higher instances of Awareness and
Implementation (53.1%).
Table 2: Frameworks and methodologies that assist with CGIT
Val IT COBIT Risk IT COSO Aware A+Imp * Total Aware A+Imp Total Aware A+Imp Total Aware A+Imp Total ME 44.2 7 51.2 58.1 9.3 67.4 53.5 11.6 65.1 39.5 4.7 44.2 LO 42 5 47 56 24 80 41 16 57 36 7 43
Overall 42.7 5.6 48.3 56.6 19.6 76.2 44.8 14.7 59.4 37.1 6.3 43.4
CMMI Prince 2 ITIL Other** Aware A+Imp Total Aware A+Imp Total Aware A+Imp Total Aware A+Imp Total
ME 44.2 11.6 55.8 44.2 37.2 81.4 53.5 32.6 86 14 7 20.9
LO 46 17 63 29 60 89 24 71 95 3 11 14
Overall 45.5 15.4 60.8 33.6 53.1 86.7 32.9 59.4 92.3 6.3 9.8 16.1 Note: *A+Imp = Awareness and Implementation ** The ‘other’ category included Agile, ISO 27001, PMBOK and TOGAF
Regarding awareness of COBIT, MEs and LOs showed almost identical results (58.1% vs
56%), yet LOs’ Awareness and Implementation was more than double (9.3% vs 24%) and
significant at the 0.1 level (chi-square = 5.34, df = 2, p < 0.1). This difference was not apparent for
Val IT and Risk IT. Awareness and implementation of COBIT ranked third (76.2%) behind Prince
2 (86.7%) and ITIL (92.3%), with differences between MEs and LOs for Prince 2 and ITIL being
significant at the 0.05 level (for Prince 2 chi-square = 6.31, df = 2, p < 0.05, and for ITIL chi-
square = 18.57, df =2, p < 0.01).
18
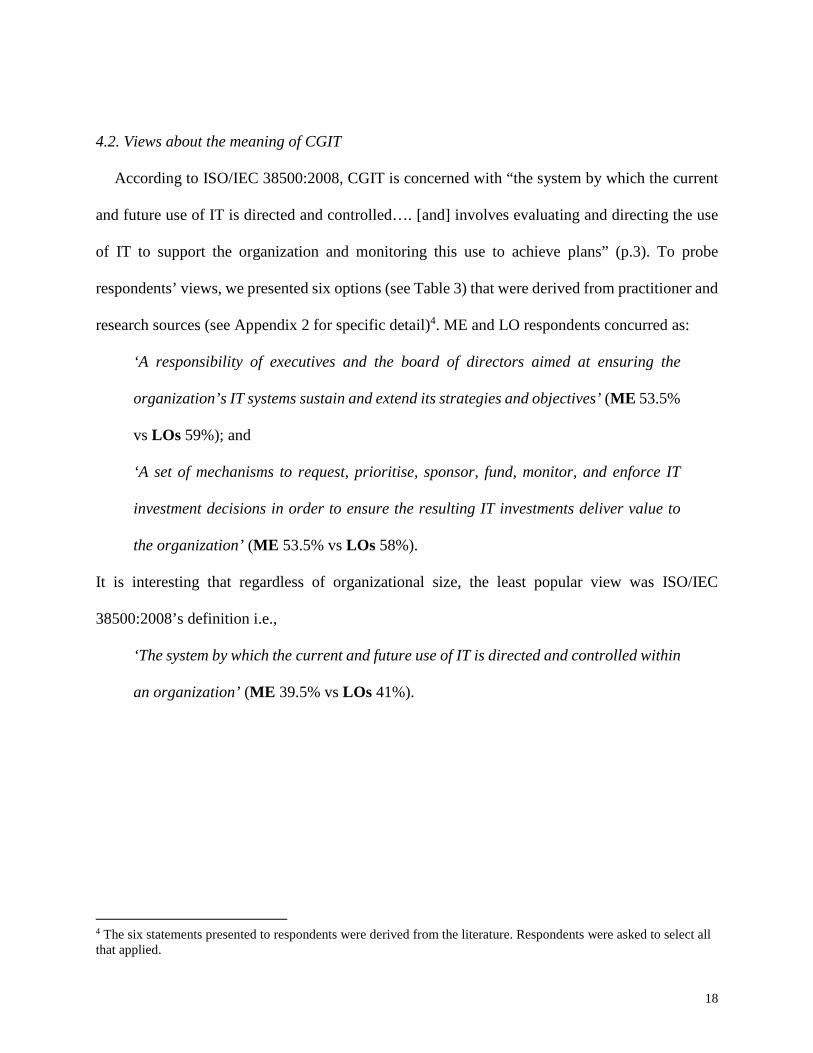
4.2. Views about the meaning of CGIT
According to ISO/IEC 38500:2008, CGIT is concerned with “the system by which the current
and future use of IT is directed and controlled…. [and] involves evaluating and directing the use
of IT to support the organization and monitoring this use to achieve plans” (p.3). To probe
respondents’ views, we presented six options (see Table 3) that were derived from practitioner and
research sources (see Appendix 2 for specific detail)4. ME and LO respondents concurred as:
‘A responsibility of executives and the board of directors aimed at ensuring the
organization’s IT systems sustain and extend its strategies and objectives’ (ME 53.5%
vs LOs 59%); and
‘A set of mechanisms to request, prioritise, sponsor, fund, monitor, and enforce IT
investment decisions in order to ensure the resulting IT investments deliver value to
the organization’ (ME 53.5% vs LOs 58%).
It is interesting that regardless of organizational size, the least popular view was ISO/IEC
38500:2008’s definition i.e.,
‘The system by which the current and future use of IT is directed and controlled within
an organization’ (ME 39.5% vs LOs 41%).
4 The six statements presented to respondents were derived from the literature. Respondents were asked to select all that applied.

19
Table 3: Views concerning the meaning of CGIT (see Appendix 2 for details regarding the sources of these definitions)
ME %
LO %
Overall %
A responsibility of executives and the board of directors aimed at ensuring the organization’s IT systems sustain and extend its strategies and objectives
53.5 59 57.3
A set of mechanisms to request, prioritize, sponsor, fund, monitor, and enforce IT investment decisions in order to ensure the resulting IT investments deliver value to the organization
53.5 58 56.6
A framework for decision rights and accountabilities designed to encourage desirable behavior in the use of IT within an organization 41.9 51 48.3
The system by which the current and future use of IT is directed and controlled within an organization 39.5 41 40.6
A subset of the overall corporate governance of the organization concerned specifically with decisions about key IT activities and investments 41.9 50 47.6
The strategic alignment of IT with business goals and objectives 51.2 44 46.2 Other including (1)necessarily and sufficiently capable of managing and delivering the organization’s ICT-enabled investment agenda and business continuity; (2) performance and accountability of IT; (3) controls to ensure proper investment and management for IT capability; (4) Policies, strategies
11.6 3 5.6
These results confirmed that respondents appreciated CGIT’s strategic organizational role and
the need for mechanisms by which to devolve authorities (see Table 9).
4.3. CGIT policy: Incidence of, responsibility for and its communication
Policies have a crucial role in communicating strategically important matters. Here, despite
general agreement about CGIT’s meaning, in practice policy formulation manifested differently
(see Table 4). For example, compared with MEs (38.55%), LOs (56.1%) more often had a written
CGIT policy. This difference was smaller when organizations with policies under development
were included (MEs 51.3% vs LOs 67.1%), with the differences not statistically significant (chi-
square = 4.54, df = 4, p > 0.1). Still many MEs (48.7%) and LOs (32.9%) either lacked a CGIT
policy or respondents were unaware of one.

20
Table 4: CGIT policy, its formulation and communication
ME LO Overall Written CGIT policy % % % Yes standalone 23.1 30.8 28.5 Yes component of CG 15.4 25.3 22.3 Total yes 38.5 56.1 50.8 No but under development 12.8 11 11.5 No 41 24.2 29.2 Total no 53.8 35.2 40.7 Don’t know 7.7 8.8 8.5
The next section excludes respondents who did not answer or answered ‘no’ to having a written CGIT policy. Thus, n = 81
Respondent involvement in developing a policy on CGIT
1 (not) 20 19.7 19.8 2 (a little) 0 11.5 8.6 Total (not and/or little) 20 31.2 28.4 3 (moderately) 15 16.4 16 4 (largely) 15 11.5 12.3 5 (fully involved) 50 37.7 40.7 Total (largely and/or fully involved) 65 49.2 53
Next, those who had a policy under development were excluded. Thus, n = 66
Responsibility for updating it CEO 13.3 5.9 7.6 CFO 0 0 0 COO 0 2 1.5 CIO 40 56.9 53 Board 20 5.9 9.1 Don’t know – 11.8 9.1 Other 26.7 13.7 16.7 Responsibility for implementing CEO 26.7 2 7.6 CFO 6.7 2 3 COO 0 5.9 4.5 CIO 20 58.8 50 Board 20 2 6.1 Don’t know 6.7 9.8 9.1 Other (i.e., executive team, advisory board, CIO + governance committee)
20 15.7 16.7
Frequency reviewed and updated Monthly 0 2 1.5 3 monthly 13.3 15.7 15.2 6 monthly 0 5.9 4.5 Annually 40 33.3 34.8 Ad Hoc 46.7 19.6 25.8 Don’t know 0 13.7 10.6 Other (i.e., biennially, complex, too early to tell) 0 5.9 4.5 The CGIT policy is communicated Yes 66.7 64.7 65.2 No 33.3 19.6 22.7 Don’t know 0 11.8 9.1 Form of communication of CGIT policy Email 13.3 9.8 10.6 Verbally by supervisor 6.7 2 3 Intranet 20 35.3 31.8 Internet 6.7 0 1.5 Other (i.e., all, email, many of the above, governance groups)
6.7 5.9 6.1
21
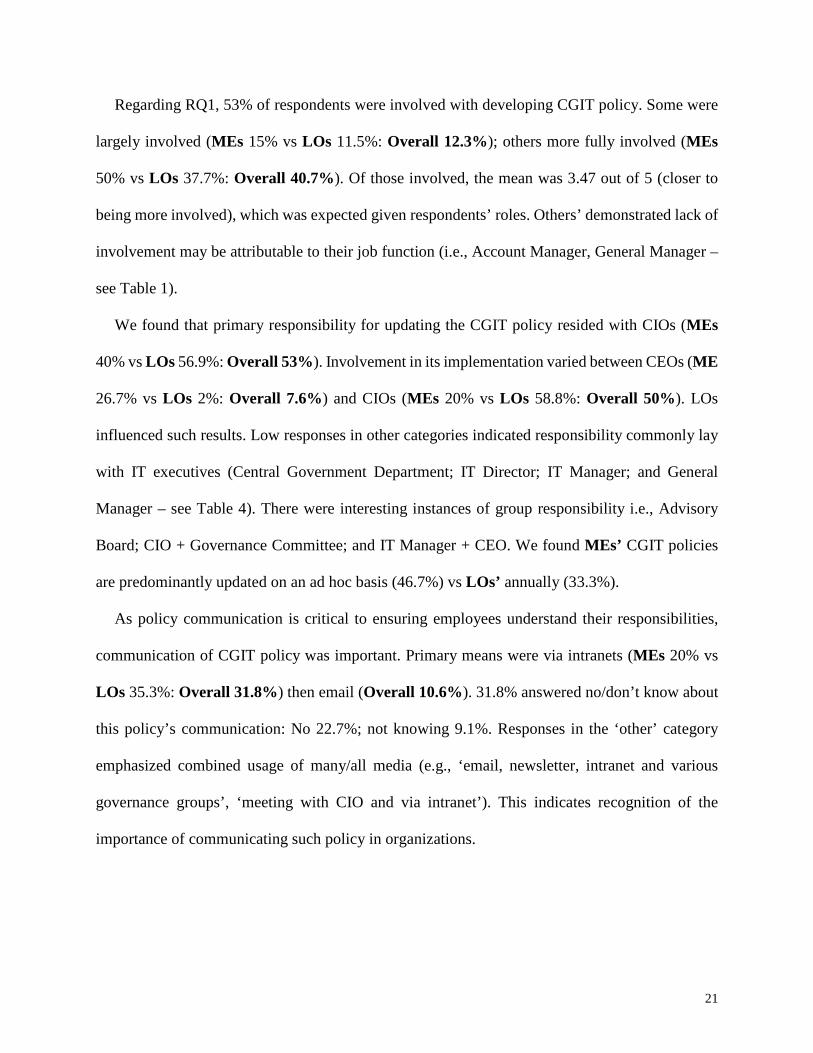
Regarding RQ1, 53% of respondents were involved with developing CGIT policy. Some were
largely involved (MEs 15% vs LOs 11.5%: Overall 12.3%); others more fully involved (MEs
50% vs LOs 37.7%: Overall 40.7%). Of those involved, the mean was 3.47 out of 5 (closer to
being more involved), which was expected given respondents’ roles. Others’ demonstrated lack of
involvement may be attributable to their job function (i.e., Account Manager, General Manager –
see Table 1).
We found that primary responsibility for updating the CGIT policy resided with CIOs (MEs
40% vs LOs 56.9%: Overall 53%). Involvement in its implementation varied between CEOs (ME
26.7% vs LOs 2%: Overall 7.6%) and CIOs (MEs 20% vs LOs 58.8%: Overall 50%). LOs
influenced such results. Low responses in other categories indicated responsibility commonly lay
with IT executives (Central Government Department; IT Director; IT Manager; and General
Manager – see Table 4). There were interesting instances of group responsibility i.e., Advisory
Board; CIO + Governance Committee; and IT Manager + CEO. We found MEs’ CGIT policies
are predominantly updated on an ad hoc basis (46.7%) vs LOs’ annually (33.3%).
As policy communication is critical to ensuring employees understand their responsibilities,
communication of CGIT policy was important. Primary means were via intranets (MEs 20% vs
LOs 35.3%: Overall 31.8%) then email (Overall 10.6%). 31.8% answered no/don’t know about
this policy’s communication: No 22.7%; not knowing 9.1%. Responses in the ‘other’ category
emphasized combined usage of many/all media (e.g., ‘email, newsletter, intranet and various
governance groups’, ‘meeting with CIO and via intranet’). This indicates recognition of the
importance of communicating such policy in organizations.

22
4.4. Factors influencing organizations to develop CGIT-related policies
With no pre-defined categories, respondents with a written CGIT policy (n = 66) were asked to
identify the top three influences for its development. Experts’ initial thematic analysis revealed six
distinct sources of influence: (1) those external to the organization; (2) those arising from business
strategy and IT alignment; (3) governance; (4) leadership and management; (5) costs and
resourcing; and (6) responses to a problem or issue.
In reviewing this independently derived analysis, we identified commonality between these
findings and the five focus areas consistently identified by ITGI (2003, 2007) and ISACA (2012),
namely: strategic alignment (Business/IT); value delivery; resource management; risk
management; and performance measurement (see Table 5 below for explanations). In Table 5 we
demonstrate this alignment.
Table 5: Factors influencing organizations to develop policies for CGIT
ITGI focus area ME LO Strategic alignment concerns ensuring that IT is in harmony with an organization’s strategic objectives, thereby providing capability to deliver business value by positioning IT to assist with adding value to products and/or services, and accordingly in achieving competitive position. Therefore business/IT alignment strategies should detail how all IT components (related to business processes, functionality, staffing and funding) are attuned to business’ strategic direction
Identified as an influence 16 times (27%). Most cited influences were: • Ensure & oversee delivery of
appropriate digital support (2); • Business objectives & risk (2); • Need to manage IT investment &
value (2); and • Support from executive team/ focus
leadership attention (2).
Identified as an influence 28 times (22.6%). Most cited influences were: • IT supports business direction
(alignment) + IT treated as strategic by board (17); and equally:
• Innovation (2); • Value adding (2); • Improved business understanding (2); • Good/best practice (2); and • Business relationship management
(2). Value delivery concerns identifying IT benefits sought vs those achieved . This is difficult as determining IT/business value diminishes as IT functions are absorbed into business processes. Correct IT alignment delivers value through timely delivery of required IT capability with budgeted costs; and by supporting growth through new IT that facilitates business goals i.e., improved resource capability, new market entry and revenue growth
Identified as an influence 7 times (11.9%). Most cited influence was: • As small org. we need to manage
IT investments to yield value (2).
Identified as an influence 12 times (9.7%). Most cited influences were: • Reducing complexity/Standardization
(4); • Ensuring projects delivered on time
(4); and • Significant IT spend (3).

23
Resource management concerns resources (people, applications, data and technology that serve business needs) + the best financial allocation for IT investment and ongoing budgets, re IT use/resources. Boards delegate to management through determining key responsibilities and accountability for decision-making. This requires determining skills to manage IT projects (or financial support to recruit/retain skilled people); oversight of plans, training and change management. Software licences, service contracts and human resources must be managed
Identified as an influence 8 times (13.6%). Most cited influence was: • Focus leadership attention/ Support
from IT executive team (2). Other influences included: • Staff usage; and • Change management.
Identified as an influence 13 times (10.4%). Most cited influences were: • Poor practices (4); and • CIO (2). Other influences included: • Maintain stable environment; • Effective use of resources; and • Guidelines for staff.
Risk management concerns financial and operational exposure including technological risk and information security, breakdowns in internal control and oversight, plus business vulnerability due to lack of protection for IT infrastructure. Risk awareness re regulatory obligations, transparent determination of significant risks and associated risk avoidance policies/strategies are included. Responsibilities to management must include clear direction re constraints
Identified as an influence 18 times (30.5%). Most cited influences were: • Understanding IT Governance (2);
and • Corporate governance inc. as
Advisory Organization (2).
Identified as an influence 61 times (49.2%). Most cited influences were: • Regulatory compliance (inc. external
audit) (13); • Risk management (inc. minimizing
outages) (11); and equally • Business relationship management
(4); Good/best practice (4); Poor practices (4); and Poor IT performance (4).
Performance measurement involves measuring tangible assets with financial figures + intangible assets that often defy financial measurement (i.e., relationships, databases and knowledge assets). Hence customer retention, efficient processes and growing human resources should all be measured. One means is using a balanced scorecard for more comprehensive view
Identified as an influence 10 times (16.9%). Influences included: • Transparency across the
organization; • Overseeing IT direction; and • Industry reports.
Identified as an influence 10 times (8.1%), with ROI cited 8 times. Other influences were: • Ensuring results as promised to the
board; and • Visibility of returns on investment.
Regarding influences upon organizations to adopt a CGIT policy, both MEs and LOs identified
need for corporate/IT strategic alignment and risk management as significant influences. Beyond
the evident synergies between these (i.e., risk may be an outcome of poor alignment), for LOs risk
exposures have additional implications related to organizational size, stakeholder numbers and
legacy systems. The focus areas of value delivery and performance measurement were less
influential: performance measurement being more important for MEs than for LOs. The reverse
was true for value delivery, which may be attributable to the difficulty of measuring IT value when
it is absorbed into business processes (an outcome likely to be more complex for LOs). Further for
LOs, given identified influences include reducing complexity/standardization, ensuring projects
are delivered on time and significant IT spend, value delivery appears to be related to risk
management. Resource management was relatively uninfluential.

24
Overall, findings about influences for CGIT policy development appear to demonstrate
organizational focus on what IT could do for the organization (risk management and achieving
alignment) rather than the capacity of the organization to handle an IT initiative (resource
management).
4.5. Benefits achieved from implementing a policy for CGIT
Respondents from organizations with a written CGIT policy were asked to indicate the extent
to which their organization had achieved each of six generally recognized benefits (see Table 6),
with these derived from relevant literature (Wilkin and Chenhall, 2010; ISACA, 2012; ITGI,
2003). 59 respondents answered this question, which used a five-point Likert scale ranging from
1 (not at all) to 5 (extensively). “Alignment of IT with business needs” was the most widely
achieved benefit (mean = 3.66, SD5 0.94), as 64.5% had largely or extensively achieved this
benefit. Next were “Clarity of accountability among the organization’s personnel” (mean 3.54,
SD 1.02, 59.4%) and “Clarity of responsibility among the organization’s personnel” (mean 3.54,
SD 0.97, 56%). Results suggest that CGIT’s claimed benefits were largely achieved by the
majority of organizations who had implemented a CGIT policy.
Table 6: Extent of achievement of benefits as a result of implementing a policy for CGIT
Benefit Group 1 (not at all)
2 3 4 5 (extensively)
Combined 4/5
Mean SD
Improved engagement with stakeholders
ME 0 15.4 15.4 53.8 15.4 69.2 3.69 0.95
LO 4.3 15.2 37.0 32.6 10.9 43.5 3.30 1.00 Overall 3.4 12.1 32.2 37.3 11.9 49.2 3.39 1.00
Cost savings from reduced liability due to risk management
ME 0 15.4 15.4 53.8 15.4 69.2 3.69 0.95
LO 4.3 19.0 41.3 26.1 8.7 34.8 3.15 0.99 Overall 3.4 18.6 35.6 32.2 10.2 42.4 3.27 1.00
Clarity of responsibility among the organization’s personnel
ME 0 15.4 15.4 38.5 30.8 69.3 3.85 1.07
LO 2.2 13.0 32.6 41.3 10.9 52.2 3.46 0.94
Overall 1.7 13.6 28.8 40.7 15.3 56.0 3.54 0.97
ME 0 15.4 7.7 38.5 38.5 77.0 4.00 1.08
5 SD = Standard Deviation

25
Clarity of accountability among the organization’s personnel
LO 4.3 13.0 28.3 45.7 8.7 54.4 3.41 0.98
Overall 3.4 13.6 23.7 44.1 15.3 59.4 3.54 1.02
Alignment of IT with business needs
ME 0 7.7 30.8 30.8 30.8 61.6 3.85 0.99 LO 4.3 6.5 23.9 54.3 10.9 65.2 3.61 0.93
Overall 3.4 6.8 25.4 49.2 15.3 64.5 3.66 0.94
Efficient allocation of resources
ME 0 15.4 23.1 38.5 23.1 61.6 3.69 1.03 LO 4.3 23.9 43.5 26.1 2.2 28.3 2.98 0.88
Overall 3.4 22.0 39.0 28.8 6.8 35.6 3.14 0.96
Comparing results for MEs and LOs revealed three statistically significant instances (at the 10%
or 5% level) where the extent of achievement was higher for MEs than LOs: cost savings (means
3.69 vs 3.15 + t = 1.76, df = 57, p < 0.1), clarity of accountability (means 4.00 vs 3.41 + t = 1.87,
df = 57, p < 0.1) and efficient allocation of resources (means 3.69 vs 2.98 + t = 2.48, df = 57, p <
0.05). Findings suggest that MEs’ perceived benefits were more related to organizational
efficiencies (cost, resource allocation, staff accountabilities). In every case MEs’ perceived
achievement of benefits was more positive than LOs’.
4.6. Challenges associated with CGIT
Previous studies have shown that regardless of the presence of a formal CGIT policy,
organizations find CGIT challenging. Through an open-ended question that did not include pre-
defined categories, respondents were asked to list their top three challenges6. Our initial thematic
analysis identified six categories: (1) ensuring CGIT knowledge and understanding; (2) resourcing;
(3) building awareness and achieving acceptance and compliance (‘buy-in’); (4) roles of the
executive and senior managers; (5) organizational culture and the change required; and (6) practical
issues associated with CGIT implementation. As with influences (see Section 4.4), these responses
related to ITGI’s focus areas. The findings are summarized in Table 7.
6 Idiosyncratic responses and challenges specific to particular organizations are not covered here.

26
Table 7: Challenges associated with CGIT
ITGI focus area ME LO
Strategic alignment
Identified as a challenge 18 times (23.7%). Most cited challenges: • Change management whilst operating
existing business (3); • IT risks/ Risk management (3); and • Appropriate oversight and decision-making
for risk management (2).
Identified as a challenge 96 times (33%). Most cited challenges: • Ensuring/alignment the appropriate issues
are being addressed (12); • Appropriate business planning (12); • Executive commitment (7); • Shared understanding of benefits (5); and • Balancing innovation and operations (5).
Value delivery
Identified as a challenge 4 times (5.3%). Most cited challenge: • Value from IT/ Demonstrated benefits
realization (3).
Identified as a challenge 7 times (2.4%). Most cited challenges: • Value/Cost (3); and • Lack of maturity and understanding of
benefits (2).
Resource management
Identified as a challenge 35 times (46%). Most cited challenges: • Change management (5); and equally: • Shared understanding of IT governance &
benefits (2); • Budget and Resource allocation (2); • Compliance of staff to policy (2); • Internet security (2) i.e., cloud services,
web; • Maintaining currency with method changes
(2); and • Procuring software/cloud services (2).
Identified as a challenge 128 times (44%). Most cited challenges: • Commitment (10); • Acceptance (9); • Communication (9); • Managing resistance (7); • Staff & user understanding (7); and • Change management whilst operating
existing business (5).
Risk management
Identified as a challenge 19 times (25%). Most cited challenges: • Change management whilst operating
existing business (3); • IT risks/ Risk management (3); • Appropriate oversight and decision-making
for risk management (2); and • Bring your own device (2).
Identified as a challenge 49 times (16.8%). Most cited challenges: • Introducing a culture of accountability (6); • Resistance i.e., middle management, tenured
staff (5); • Enforcing compliance/governance (4); • Integration of outsourced providers (3); • Risk management vs commercial success
(2); • Risk taking ability among senior executives
(2); and • Inappropriate control by executives (2).
Performance measurement
Was not mentioned as a challenge. Identified as a challenge 11 times (3.8%). Most cited challenges: • Demonstrated benefits realization (6); • Audit, review (2); and • Consequences re non-compliance (2).
In summary we found that the challenges concerned the human element: issues such as
acceptance, commitment, executive buy-in, assigning accountabilities, communication and change
management were identified by both MEs and LOs. For LOs these challenges were reasonably
consistent with their identified influences: alignment was important, with value delivery and
performance measurement of lesser importance. Interestingly, resource management became most

27
significant, particularly for HR issues such as communication, resistance and training, and
technical issues such as evaluating old IT, determining IT capability and managing
outsourced/external providers. LOs identified issues with old IT including unwillingness to cede
ownership, bureaucracy and ascertaining its real contribution.
MEs did not report the same concerns, possibly because smaller organizational size reduced
any capacity to achieve such opaqueness. Strategic alignment and risk management were raised
proportionately more by MEs than by LOs, although MEs’ risk issues related more to change
management and accommodating innovation/flexibility. Value delivery and performance
measurement were less important in terms of IT value rather than value delivered through IT,
perhaps acknowledging the difficulty of the latter.
4.7. Application of ISO/IEC 38500:2008 principles
Given interest in whether organizations were following CGIT principles as defined in the
standard ISO/IEC 38500:2008, we asked respondents to indicate their level of agreement with
statements capturing the essence of its six principles. On the basis of 94 responses, it would appear
that both ME and LO Australian organizations seem to be following these principles, with no
differences being statistically significant (see Table 8). Of particular note, relatively few
respondents disagreed with the statements (MEs 9.3% – 21% vs LOs 6% – 20%). Highest
agreement (see Table 8) was with:
• Principle 5: “In my organization, IT complies with all mandatory legislation and
regulations” (MEs 34.9% agree vs LOs 47%: Overall 43.4%). Enforceability of legislative
requirements makes this result somewhat unsurprising, although the differences are
interesting.

28
• Principle 1: “Those with responsibility for actions have the authority to perform those
actions” (MEs 37.2% agree vs LOs 43%: Overall 41.3%).
• Principle 3: “IT acquisitions are made on the basis of appropriate and ongoing analysis,
with clear and transparent decision-making” (MEs 34.9% agree vs LOs 38%: Overall
37.1%).
Table 8: Application of ISO/IEC 38500:2008’s principles in the respondents’ organizations
Group % Disagree Neutral % Agree Mean SD
Prin
cipl
e 1:
R
esp
onsi
bilit
y
Individuals and groups within my organization understand and accept their responsibilities with respect to demand for IT
ME 14 11.6 39.6 3.36 1.22 LO 20 14 32 3.20 0.95
Overall 18.2 13.3 34.3 3.24 1.03 Individuals and groups within my organization understand and accept their responsibility with respect to the supply of IT
ME 14 11.6 39.5 3.39 1.26 LO 12 19 35 3.33 0.87
Overall 12.6 16.8 36.4 3.35 0.99
Those with responsibility for actions have the authority to perform those actions
ME 16.3 11.6 37.2 3.46 1.40 LO 9 14 43 3.56 0.79
Overall 11.2 13.3 41.3 3.53 1.00
Prin
cipl
e 2:
S
tra
tegy
My organization’s business strategy takes into account the current capabilities of IT
ME 18.6 7 39.6 3.39 1.37 LO 17 16 33 3.36 1.00
Overall 17.5 13.3 35 3.37 1.12
My organization’s business strategy takes into account the future capabilities of IT
ME 21 16.3 27.9 2.96 1.37 LO 16 20 30 3.29 0.92
Overall 17.5 18.9 29.4 3.19 1.08 My organization’s strategic plans for IT satisfy the current and ongoing needs of our organization’s business strategy
ME 20.9 9.3 34.9 3.14 1.33 LO 18 16 32 3.29 1.00
Overall 18.9 14 32.9 3.24 1.10
Prin
cipl
e 3:
A
cqu
isiti
on IT acquisitions are made on the basis of
appropriate and ongoing analysis, with clear and transparent decision-making
ME 16.3 14 34.9 3.32 1.31 LO 17 11 38 3.35 1.09
Overall 16.8 11.9 37.1 3.34 1.15 When we make IT acquisition decisions, an appropriate balance is achieved between benefits, opportunities, costs and risks
ME 14 16.3 34.9 3.36 1.19 LO 16 14 36 3.42 1.08
Overall 15.4 14.7 35.7 3.40 1.11
Prin
cipl
e 4:
P
erf
orm
ance
IT is fit for purpose in supporting my organization, in terms of providing the services, the levels of service and service quality required to meet the current and future business requirements
ME 21 2.3 41.8 3.39 1.32
LO 17 15 34 3.32 1.03
Overall 18.2 11.2 36.4 3.34 1.11
Prin
cipl
e 5:
C
onfo
rma
nce
In my organization, IT complies with all mandatory legislation and regulations
ME 9.3 20.9 34.9 3.50 1.20 LO 6 13 47 3.77 0.82
Overall 7 15.4 43.4 3.69 0.95 In my organization, IT-related policies and practices are clearly defined, implemented and enforced
ME 20.9 14 30.2 3.18 1.34 LO 15 22 29 3.24 0.99
Overall 16.8 19.6 29.4 3.22 1.10
Prin
cipl
e 6:
H
um
an
Beh
avior
In my organization, IT policies, practices and decisions demonstrate respect for Human Behaviour, including the current and evolving needs of all ‘people in the process
ME 11.6 18.6 34.9 3.29 1.24
LO 10 25 31 3.36 0.85
Overall 10.5 23.1 32.2 3.34 0.98

29
Strongest disagreement was with:
• Principle 2: “My organization’s strategic plans for IT satisfy the current and ongoing needs
of our organization’s business strategy” (Disagree: MEs 20.9% vs LOs 18%: Overall
18.9%).
• Principle 1: “Individuals and groups within my organization understand and accept their
responsibilities with respect to demand for IT” (Disagree: MEs 14% vs LOs 20%: Overall
18.2%).
• Principle 4: “IT is fit for purpose in supporting my organization, in terms of providing the
services, the levels of service and service quality required to meet the current and future
business requirements” (Disagree: MEs 21% vs LOs 17%: Overall 18.2%).
4.8. Structures, processes, mechanisms and resources
Regardless of the presence of a formal policy, a series of questions explored the level of support
for CGIT. For each question respondents could select multiple options (see Table 9 below). This
was answered by 90 of our 143 respondents. The most common structural mechanisms for
effective alignment of business and IT were: (1) IT steering committees (57%); (2) formal policies
and procedures (50%), i.e., consonant with the response to our earlier question; (3) IT strategy
committee (34%); and (4) job specifications to help promote alignment (33%). The only
statistically significant difference between MEs and LOs concerned IT steering committees: 36%
of MEs had one vs nearly 65% of LOs (chi-square with continuity correction = 4.91, df = 1, p <
0.05, Fisher’s Exact Test p = 0.018).
The most commonly reported approach to assist with CGIT was service level agreements –
64% of organizations. By contrast only 28% reported IT alignment models. There were no

30
statistically significant differences between MEs and LOs on this question. To facilitate
commitment, involvement and communication, regular briefings were used by 67% of the
organizations, while the next most common was business/IT collocation (56%). Rewards and
incentives were used for this purpose by 18% of organizations. There were no significant
differences between MEs and LOs on the incidence of facilitation mechanisms.
Table 9: Structures, processes, mechanisms and resources
ME LO Overall
Str
uctu
ral
Mec
hani
sm
CIO has a role on the board 44.0 32.3 35.6 IT strategy committee 44.0 30.8 34.4 Job specifications promote this 36.0 32.3 31.3 IT steering committee 36.0 64.6 56.7 Formal policies or procedures 40.0 53.8 50.0 Others: CIO part of exec; alignment program; project governance group; portfolio gov. comm.; …
17.8
Pla
nnin
g,
Impl
emen
tatio
n an
d M
onito
ring
App
roac
hes
Service Level Agreements (SLAs) 60.0 66.2 64.4
Balanced scorecard 24.0 41.5 36.7
Strategic information systems planning 36.0 44.6 42.2
IT Alignment models 36.0 24.6 27.8
Other: none, weekly catch-up with GM; informal only; … 18.9
Fac
ilita
tion
Mec
hani
sms Business/IT Co-location 64.0 52.3 55.6
Rewards and incentives 12.0 20.0 17.8
Regular briefings 72.0 64.6 66.7
Other: exec. meetings; none; senior exec. make up technology governance committee; …
15.6
Tra
inin
g M
etho
ds Online training 48.0 38.5 41.1
On-site training that is run by external providers 12.0 13.8 13.3 On-site training that is run internally 56.0 29.2 36.7 Off-site training that is run by external providers 12.0 10.8 11.1 Other: advisors; briefings; email communication; … 36.7
Training is generally agreed to be crucial for effective CGIT implementation. Responses
indicate that: (1) the largest proportion (41%) used online training; and (2) on-site training
conducted internally (37%) was the next most common with this showing the only significant
difference (MEs 56% vs. LOs 29.2%). Findings show an average 1.4 training methods per
organization, with well under one-half of respondents reporting each of the methods. This

31
apparently low incidence of such training in Australian organizations warrants further
investigation.
Finally, when asked to estimate the proportion of annual turnover expended on CGIT, responses
varied from 0% to 50% (with no statistically significant difference between MEs and LOs). Given
increasing IT dependency, some organizations could be seriously under-investing in this critical
area.
5. Discussion and research contributions
This study explored whether CGIT was perceived as useful to organizations with respect to
improving IT performance and generating IT business value, and whether there were differences
between MEs and LOs in this regard. Theoretically, this perspective is relevant to organizational
RBV, if CGIT is perceived as a distinctive competency that facilitates the capabilities which ensure
linkage of intangible assets (i.e., people, commitment and consistency) with tangible assets (IT
functionality appropriate to the business scenario) to deliver improved organization performance
(Weingarten et al., 2013; Weill and Olsen, 1989) and hence sustainable competitive advantage.
How findings demonstrate CGIT’s relation to organizational performance is now discussed,
including in terms of ME and LO differences (RQ2).
CGIT’s meaning. Respondents generally preferred definitions concerned with delivering value
through strategic and inclusive practices, including defining accountabilities.
Factors influencing adoption of CGIT policies (RQ3). Qualitative analysis suggested both saw
risk management as the most important influence. For LOs, it related more to regulatory
compliance, audit, minimizing IT downtime and poor IT performance: for MEs it related more to
process. Further, both saw IT strategic alignment with business objectives as a primary influence,

32
and in line with the RBV, identified this as important to value delivery. LOs were more specific
about value delivery through performance measurement such as ROI and timeliness.
CGIT practices (RQ3). Enhanced awareness of project management tools (Prince 2 and ITIL)
rather than COBIT and Val IT was evident. Given 30.1% of respondents were CIOs, such findings
may reflect a background in project management. Despite awareness of COSO (37.1%), there was
little acknowledgement of its use (6.3%). Concerning CGIT policy, LOs were more proactive in
having written policy: MEs recognized its importance with more having a policy under
development.
CGIT influences (RQ3). Interestingly ME respondents’ terminology related more to internal
organizational perspectives, with words such as “we” and “need”. There was less of the external
outcomes/governance jargon employed by LOs i.e., “policy”, “regulatory”, “align”, “ROI” and
“compliance”. Consonant with the perspective of MEs’ resource constraints, MEs may be more
engaged with delivering the practicalities than the formalities.
Delivering CGIT (RQ3). The human element was the primary source of challenge. All
organizations faced challenges with: (1) ensuring an understanding of CGIT and its benefits
necessary to achieve the required stakeholder buy-in (apparently a lesser problem for the MEs);
(2) achieving strategic alignment of IT with business goals and strategies; and (3) ensuring
organizational capacity and capability – including the executive – to enable CGIT implementation.
LOs’ challenges involved concepts more relevant to larger/more bureaucratic organizations, i.e.,
corporate levels, business model, and stakeholders. Further, LOs saw emergent themes as
managing organizational change and understanding the value offered by CGIT. Resource
management was regarded as a significant challenge for both (see Table 7), with resource-

33
constrained MEs seeing this in practical terms such as training, a lack of critical resources and
leadership capacity.
CGIT benefits (RQ3). All indicated alignment as a key benefit i.e., by delivering a distinctive
competence for improved organizational performance CGIT was regarded as beneficial to
delivering RBV. The top benefits reported by organizations with written CGIT policies were: (1)
alignment of IT with business needs; (2) clarity of accountability and of responsibility among the
organization’s personnel; and (3) improved stakeholder engagement. Given the least liked
definition concerned control, it is surprising that the most popular benefit from implementing
CGIT was clarity of accountability, followed by clarity of responsibility. This must be linked to
findings regarding structures, processes, mechanisms and resources (where emphasis related to
planning, implementing, monitoring as well as facilitation mechanisms i.e., to governing action
rather than people). This focus is consistent with HR being perceived as a challenge for CGIT to
deliver RBV.
The applicability of ISO/IEC 38500:2008 to CGIT delivery (RQ4). MEs and LOs reported that
they delivered on Principles 3 (Acquisition) and 5 (Conformance), but had problems with
Principles 1 (Responsibility), 2 (Strategy), and 4 (Performance). Regarding Principle 1, assigned
authorities were reportedly effected but their acceptance rather less so (more in LOs than MEs).
Delivering on assigned accountabilities must be acknowledged as significant for both LOs and
MEs as it affects the delivery of organizational capability. Further, approximately 65% of
respondents indicated need for organizational improvement regarding Principle 2 (Strategy),
despite it being identified as a significant influence and benefit. Similarly, for Principle 4
(Performance), approximately 60% indicated need to improve the capacity of their organization’s
IT to deliver on current and future business requirements.
34
As IT has become integral to the enactment of business strategy and processes, being tightly
incorporated into business cycles as an integrated part of IT-enabled business capability
(Chaudhuri, 2011), organizations have recognized CGIT’s importance. Many studies have focused
on CGIT delivering RBV through IT alignment with business objectives and improved IT
capability (Wu et al., 2015; Prasad et al., 2012; Lunardi et al., 2014). Our findings contribute
knowledge that besides such alignment, risk management is a key influence. Of the two influences,
risk management was considerably more important for LOs (for MEs only marginally so).
Regarding benefits from CGIT adoption, alignment was identified as a primary benefit. However,
endorsement of clarified responsibilities and accountabilities, and cost savings, would suggest that
the importance of effective delivery (i.e., risk management). Supporting evidence includes the
findings about ISO/IEC 38500:2008’s six principles. Principle 2 (Strategy) had the weakest mean
scores and higher SDs, particularly concerning organizational strategy accounting for future IT
capability i.e., the strategic focus seemed to be more immediate. In fact, MEs indicated stronger
interest in IT acquisitions being fit for purpose than LOs, although there was common agreement
of the need to balance benefits and risk (Principle 3, Part 2).
In fact, findings suggest that CGIT has been top-down driven as evident in the emphasis on
written policy and identification of resource management as a primary challenge by both LOs and
MEs. Weak support for Principle 5’s policies being clearly identified, implemented and enforced
and similarly weak endorsement of Principle 6 (Human Behaviour), support this conclusion. Again
reported structures, processes, mechanisms and resources show reliance on formal mechanisms
(IT steering committees, formal policies, SLAs, strategic planning, briefing) – it was the MEs who
were more inclusive with considerably more bottom-up focus on training.

35
Two limitations in this study create opportunities for future research. Firstly, our study being
limited to Australian organizations, warrants further research involving other countries, i.e., a
comparative study with other Asia-Pacific countries vs those in the United States or Europe.
Secondly, the survey captures primarily perceptive information, which imposes some limitations
on derivable conclusions as this form of data collection has susceptibility to bias and error. Follow-
up interviews with different stakeholder groups would strengthen the conclusions as would further
investigation into instances where managers were either marginally or not involved with CGIT
i.e., 28.4% of organizations.
6. Conclusion
Given that MEs are widely regarded as having an operational rather than strategic focus, the
extent of ME engagement with CGIT and their primary focus on alignment constitutes new
knowledge about their governance rather than simply management focus on IT to achieve RBV.
Both MEs and LOs indicated human engagement as a primary source of challenge, with
responsibilities managed in terms of assigned responsibility and commitment rather than control.
Whilst prior research has found IT strategic alignment with business objectives as a primary factor
in delivering IT value through CGIT, this research provides some indication of the importance of
risk management to CGIT regardless of organizational size.
In general our findings demonstrate that LOs and MEs both acknowledge CGIT as an initiative
by which to enhance business value through delivering organizational capabilities. However, some
significant challenges for Australian organizations are apparent. Areas for improved CGIT practice
include more attention on actioning a written policy through better delivery on assigned
accountabilities and attention to human resource issues related to change management. Of
36
particular interest are the lack of significant differences in key indicators between MEs and LOs.
This contributes new knowledge of MEs’ engagement with CGIT to generate business value in
ways comparable with those of their larger counterparts.
REFERENCES Alreck PL, Settle RB. The Survey Research Handbook. 2004. 3rd ed., Irwin, New York. Australasian SME Alliance (ASMEA) SME Facts.2014. Available at:
http://www.asmea.org.au/SMEFacts. Australian Bureau of Statistics (ABS) 2011. Available at:
http://www.abs.gov.au/ausstats/[email protected]/Products/8167.0~2009-10~Main+Features~Business+Use+of+Information+Technology?OpenDocument.
Australian Bureau of Statistics ABS 8165.0 Counts of Australian Businesses, Including Entries and Exits, June 2008 to June 2012, 2013. Australian Bureau of Statistics, Commonwealth of Australia, Canberra.
Australian Bureau of Statistics (ABS), Australian Small Business, Key Statistics and Analysis. 2012. Commonwealth of Australia. ISBN 978-1-922125-91-0
Australian Bureau of Statistics, Summary of IT Use and Innovation in Australian Business.2013-14 2015. Commonwealth of Australia. www.abs.gov.au/ausstats/[email protected]/mf/8166.0
Australian Communications and Media Authority (ACMA) Communications Report 2012-13 Series: Report 1-Australian SMEs in the Digital Economy, 2014. Commonwealth of Australia, Melbourne.
Barney JB. Is the Resource-Based “View” a Useful Perspective for Strategic Management Research? Yes, Acad. Manag. Review, 2001;26:41-56.
Barney JB, Mackey TB. Testing Resource-Based Theory, in (eds.) David J. Ketchen, Donald D. Bergh Research Methodology in Strategy and Management, Volume 2, 2005. Emerald Group Publishing Limited, pp.1-13.
Barua A, Brooks L, Gillon K, Hodgkinson R, Kohli R. Creating, Capturing and Measuring Value from IT Investments: Could we do Better?, Comm. Assoc. Info. Syst., 2010;27(1):13–36.
Beck T, Demirgüç-Kunt ASLI, Maksimovic V. Financial and legal constraints to growth: Does firm size matter? J. of Finance, 2005;60(1):137-177.
Berle A, Means G. The Modern Corporation and Private Property, 1932. Macmillan, New York. Braun V, Clarke V. Using Thematic Analysis in Psychology, Qualit. Res. in Psych., 2006;3(2):77-
101. Burtscher, C., Manwani, S. and Remenyi, D. Towards a Conceptual Map of IT Governance: A
Review of Current Academic and Practitioner Thinking, UK Academy for Info. Syst. Conf. Proc. 2009, Paper 15, Available at: http://aisel.aisnet.org/ukais2009/15.
Cadbury A. The Committee on the Financial Aspects of Corporate Governance, 1992. Gee and Company, London.
Calder A. ISO/IEC 38500: The IT governance standard, 2008. IT Governance Publishing, Cambridgeshire, United Kingdom.
Campbell J, McDonald C, Sethibe T. Public and Private Sector IT Governance: Identifying Contextual Differences, Australasian J. Info. Syst., 2009;16(2):5–18.
37
Cater-Steel A, TanW-G, Toleman M. Challenge of Adopting Multiple Process Improvement Frameworks, 4th European Conference on IS, 12-14 June, 2006. Goteborg, Sweden.
Chaudhuri A. Enabling Effective IT Governance: Leveraging ISO/IEC 38500:2008 and COBIT to Achieve Business–IT Alignment. EDPACS, 2011;44(2):1-18.
Chesterman RN. Queensland Health Payroll System Inquiry Report. 2013. Available at http://www.parliament.qld.gov.au/documents/tableOffice/TabledPapers/2013/5413T2967.pdf
Clarke, T. Australian IT project failures spark new ICT governance standard. 2014. Available at: http://www.theage.com.au/it-pro/business-it/australian-it-project-failures-spark-new-ict-governance-standard-20140114
Couper MP. Web Surveys: A Review of Issues and Approaches, The Public Opinion Q., 2000;64(4):464–494.
Cragg P, Caldeira M, Ward J. Organizational Information Systems Competences in Small and Medium-Sized Enterprises, Info. & Manag., 2011;48:353–363.
Daily CM, Dalton DR, Cannella AA. Corporate Governance: Decades of Dialogue and Data, Acad. Manag. Review, 2003;28(3):371–382.
De Haes S, Van Grembergen W. IT Governance and its Mechanisms, Info. Syst. Control J., 1. 2004. Retrieved on 29 June 2014 from http://www.isaca.org/Journal/Past-Issues/2004/Volume-1/Pages/IT-Governance-and-Its-Mechanisms.aspx.
De Haes S, Van Grembergen W. An Exploratory Study into IT Governance Implementations and its Impact on Business/IT Alignment, Info. Syst. Manag., 2009;26:123-137.
De Haes S, Van Grembergen W. Analysing the Impact of Enterprise Governance of IT Practices on Business Performance, Int. J. IT/Bus. Alignment & Governance, 2010;1(1): 14–38.
Deloitte The Australian Industry Group National CE Survey: Business Investment in New Technologies. 2012. The Australian Industry Group, Walker Street, North Sydney NSW
De Vaus DA. Surveys in Social Research, 5th ed., 2002. Allen & Unwin, St. Leonards. Debreceny RS, Gray GL. IT Governance and Process Maturity: A Multinational Field Study, J.
Info. Syst. 2013;27(1):157–188. Durst S, Edvardsson IR. Knowledge Management in SMEs: A Literature Review, J. Knowledge
Manag. 2012;16(6):879-903. Feeny D, Willcocks L. Core IS Capabilities for Exploiting Information Technology, Sloan Manag.
Review, 1998;39(3):9–21. Fuller-Love N. Management Development in Small Firms, Int. J. Manag. Reviews,
2006;8(3):175–190. Gable GG. Integrating Case Study and Survey Research Methods: An Example in Information
Systems. Eur. J. Info. Syst., 1994;3(2):112–126. Gartner. Gartner Says Worldwide IT Spending on Pace to Reach $3.8 Trillion in 2014, 2014.
Available at http://www.gartner.com/newsroom/id/2643919 Georgiadis A., Pitelis CN. Human resources and SME performance in services: empirical evidence
from the UK. Int. J. Human Resource Manag., 2012;23(4):808-825. Glaser B, Strauss A. The Discovery of Grounded Theory: Strategies for Qualitative Research.
1967. Aldine, New York. Guest G, MacQueen KM, Namey EE. Applied Thematic Analysis. 2011. Sage, Thousand Oaks,
CA. Henderson JC, Venkatraman N. Strategic Alignment: Leveraging Information Technology for
Transforming Organisations, IBM Syst. J., 1993;32(1):472–484. Higgins LH, Sinclair DT. A New Look at IT Governance, J. Cor. Acc.& Fin. 2008;19(5):31–36.

38
Hirscheim R, Klein HK. A Glorious and Not-So-Short History of the Information Systems Field, J. Assoc. Info. Syst, 2012;13(4):188-235.
Hutchinson J. When IT Governance Goes Wrong – Stories from the Trenches of Government IT Staff, Computerworld, 21 September 2010, Available at http://www.computerworld.com.au/index.php?search=when+It+governance+goes+wrong&op.x=0&op.y=0&op=SEARCH.
Hutchison V, Quintas P. Do SMEs do Knowledge Management? Or Simply Manage What They Know? Int. Small Bus. J. 2008;26:131-51.
Ifinedo P. Interactions Between Organizational Size, Culture, and Structure and Some IT Factors in the Context of ERP Success Assessment: An Exploratory Investigation, J. Comp. Info. Syst. 2007;47:28–44.
ISACA. COBIT 5. A Business Framework for the Governance and Management of Enterprise IT, 2012. Available at www.isaca.org.
ISO/IEC 38500:2008. Corporate Governance of Information Technology. 2008. International Standards Organization.
ITGI Board Briefing on IT Governance, 2nd Edition, 2003. http://www.isaca.org/Knowledge-Center/Research/ResearchDeliverables/Pages/Board-Briefing-on-IT-Governance-2nd-Edition.aspx
ITGI. COBIT 4.1, 2007. IT Governance Institute, Rolling Meadows, IL, USA. ITGI Enterprise Value: Governance of IT Investments – The Val IT Framework 2.0, 2009. IT
Governance Institute, Rolling Meadows, IL, USA. Jensen M, Meckling W. Theory of the Firm: Managerial Behaviour, Agency Costs, and Ownership
Structure, J. Fin. Econ., 1976;3:305-360. Kleinknecht A. Market Structure, Firm Characteristics and Innovative Activity, J. Indust. Econ.
1989;37:327–336. Kohli R, Grover V. Business Value of IT: An Essay for Expanding Research Directions To Keep
Up with the Times, J. Assoc. Info. Syst. 2008;9(1):23–39. Kraaijenbrink J, Spender JC, Groen AJ The Resource-Based View: A Review and Assessment of
Its Critiques, J. Manag., 2010;36(1):349-372. Lim J-H, Dehning B, Richardson VJ, Smith RE. A Meta-Analysis of the Effects of IT Investment
on Firm Financial Performance, J. Info. Syst., 2011;25(2):145-169. Lunardi GL, Becker JL, Maçada ACG, Dolci PC. The impact of adopting IT governance on
financial performance: An empirical analysis among Brazilian firms. Int. J. Acc. Info. Syst. 2014;15(1):66-81.
Mace M. Directors: Myth and reality, 1971. Harvard Business School Press, Cambridge MA. Madrid-Guijarro A, Garcia D, Van Auken H. (2009). Barriers to innovation among Spanish
manufacturing SMEs. J. Small Bus. Manag., 2009;47(4):465-488. Masli A, Richardson VJ, Sanchez JM, Smith RE. The Business Value of IT: A Synthesis and
Framework of Archival Research, J. Info. Syst., 2011;25(2):81–116. Neuman WL Social Research Methods: Qualitative and Quantitative Approaches (7th ed.), 2011
Allyn and Bacon, Massachusetts. OECD. OECD Principles of Corporate Governance. 1999. Available online at
http://www.ecgi.org/codes/code.php?code_id=89. Penrose E. The Theory of the Growth of the Firm 1959 Wiley, New York. Peppard J, Ward, J. Beyond Strategic Information Systems: Towards an IS Capability, J. Strat.
Info. Syst. 2004;13:167–194.
39
Prasad A, Green P, Heales J. On IT Governance Structures and their Effectiveness in Collaborative Organizational Structures, Int. J. Accounting Info. Systems, 2012;13:199–220.
Ratcliffe D. The World of IT Service Management – The Past, Present and Future of ITIL, Paper presented at the itSMF LIG Meeting, Houston, 2004.
Robb A, Parent M. Understanding IT Governance: A Case of Two Financial Mutuals, J. of Global Info. Manag., 2009;17(3):59–77.
Rosenbusch N, Brinckmann J, Bausch A. Is Innovation Always Beneficial? A Meta-Analysis of the Relationship Between Innovation and Performance in SMEs, J. Bus. Venturing, 2011;26(4):441–457.
Sambamurthy V, Zmud RW. Arrangements for Information Technology Governance: A Theory of Multiple Contingencies, MIS Q, 1999;23(2):261-290.
Shaw K. Lessons from a Billion-Dollar Project Failure. 2012. http://www.itbusinessedge.com/blogs/governance-and-risk/lessons-from-a-billion-dollar-project-failure.html
Shleifer A, Vishny RW. A survey of corporate governance, J. of Fin., 1997;52(2):737–783. Sonquist JA, Dunkelberg WC. Survey and opinion research: Procedures for processing and
analysis. 1977. Prentice-Hall, Englewood Cliffs, London. Strauss A, Corbin J. Basics of Qualitative Research: Grounded Theory Procedures and Techniques.
1990. Sage, Newbury Park, CA. Stross R. Billon-Dollar Flop: Air Force Stumbles on Software Plan. 2012.
http://www.nytimes.com/2012/12/09/technology/air-force-stumbles-over-software-modernization-project.html
Tanriverdi H. Performance Effects of Information Technology Synergies in Multibusiness Firms, MIS Q. 2006;(30:1):57-77.
Teece D, Pisano G, Shuen A. Dynamic Capabilities and Strategic Management, ? Strat. Manag. J 1997;18:509–533.
Tippins MJ, Sohi RP. IT Competency and Firm Performance: Is Organizational Learning a Missing Link? Strat. Manag. J., 2003;24:745-761.
Toomey M. Waltzing with the Elephant: A comprehensive guide to directing and controlling formation technology. 2009. Infonomics, Melbourne.
Van Grembergen W, De Haes S. Achieving Strategic Alignment and Value, Enterprise Governance of Information Technology, 2009. Springer, Berlin.
Wade M, Hulland J. Review: the Resource-Based View and Information System Research: Review, Extension, and Suggestions for Future Research. MIS Q., 2004;28(1):107–142.
Walker E, Redmond J, Webster B, Le Clus M. Small Business Owners: Too Busy to Train? J. Small Bus. & Enterprise Dev. 2007;14(2):294–306.
Weill P. Don’t just lead govern. How top-performing firms govern IT, MIS Q. Exec. 2004;3(1):1–17.
Weill P, Olson M. An Assessment of the Contingency Theory of Management Information Systems, J. Manag. Info. Syst. 1989;6:59–85.
Weingarten F, Humphreys P, Cao G, McHugh M. Exploring the Important Roles of Organizational Factors in IT Business Value: Taking a Contingency Perspective on the Resource-Based View, Int. J. Manag. Rev. 2013;15:30-46.
Wilkin CL, Chenhall RH. A Review of IT Governance: A Taxonomy to Inform Accounting Information Systems, J. Info. Syst. 2010;24(2):107–146.

40
Wilkin CL, Campbell J, Moore S. Creating Value Through Governing IT Deployment in a Public/Private-Sector Inter-Organisational Context: A Human Agency Perspective, European J. Info. Syst. 2013;22:498–511.
Wilkin CL, Riddett J. IT Governance Challenges in a Large Not-for-Profit Healthcare Organisation: The Role of Intranets, Elect. Comm. Res. 2009;9(4):351–374.
Wilson P, Pollard C. Exploring IT Governance in Theory and Practice in a Large Multi-National Organisation in Australia, Info. Syst. Manag. 2009;26(2):98–109.
Wu SPJ, Straub DW, Liang TP. How information technology governance mechanisms and strategic alignment influence organizational performance: Insights from a matched survey of business and IT managers. MIS Q. 2015;39(2):497-518.
Zahra SA, George G. Absorptive Capacity: A Review, Reconceptualization and Extension, Acad. Manag. Rev. 2002;25(2):185-203.
Zhao F, McMurray AJ, Toomey M. Effectiveness of Information Technology Governance: Perceptions of Board Directors and Senior Managers, in Information Technology Entrepreneurship and Innovation, IGI Global, Hershey PA, 2008:60–78.
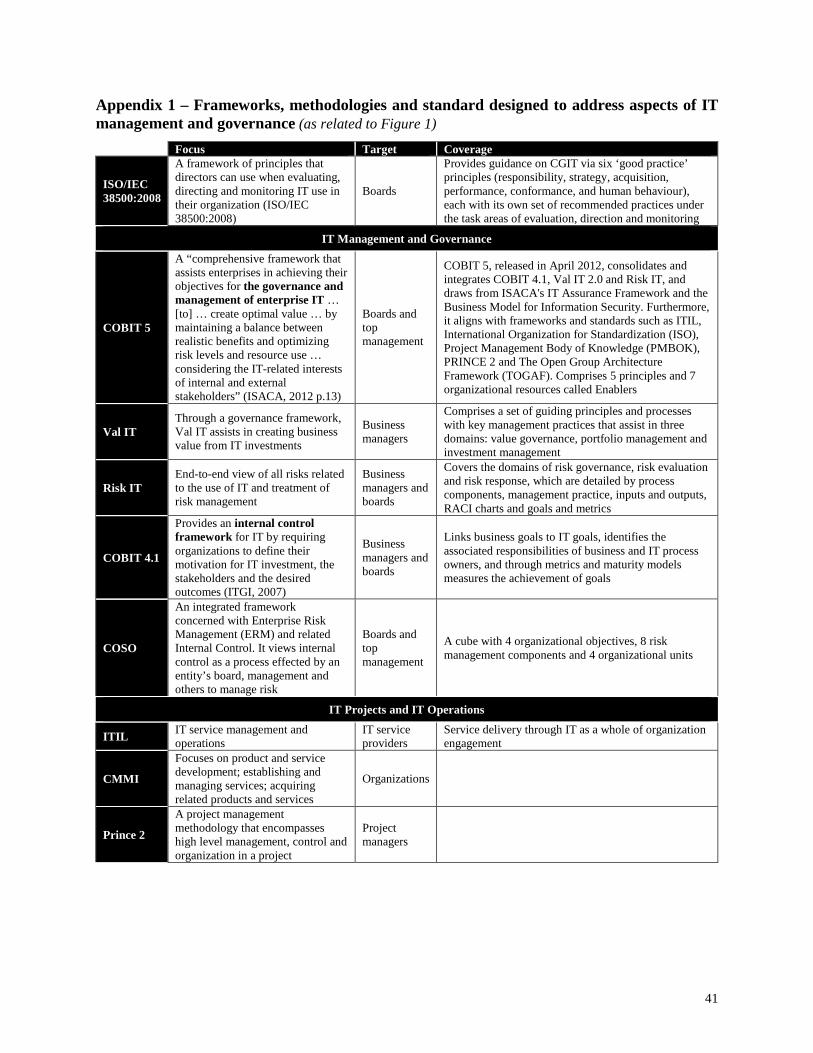
41
Appendix 1 – Frameworks, methodologies and standard designed to address aspects of IT management and governance (as related to Figure 1)
Focus Target Coverage
ISO/IEC 38500:2008
A framework of principles that directors can use when evaluating, directing and monitoring IT use in their organization (ISO/IEC 38500:2008)
Boards
Provides guidance on CGIT via six ‘good practice’ principles (responsibility, strategy, acquisition, performance, conformance, and human behaviour), each with its own set of recommended practices under the task areas of evaluation, direction and monitoring
IT Management and Governance
COBIT 5
A “comprehensive framework that assists enterprises in achieving their objectives for the governance and management of enterprise IT … [to] … create optimal value … by maintaining a balance between realistic benefits and optimizing risk levels and resource use … considering the IT-related interests of internal and external stakeholders” (ISACA, 2012 p.13)
Boards and top management
COBIT 5, released in April 2012, consolidates and integrates COBIT 4.1, Val IT 2.0 and Risk IT, and draws from ISACA's IT Assurance Framework and the Business Model for Information Security. Furthermore, it aligns with frameworks and standards such as ITIL, International Organization for Standardization (ISO), Project Management Body of Knowledge (PMBOK), PRINCE 2 and The Open Group Architecture Framework (TOGAF). Comprises 5 principles and 7 organizational resources called Enablers
Val IT Through a governance framework, Val IT assists in creating business value from IT investments
Business managers
Comprises a set of guiding principles and processes with key management practices that assist in three domains: value governance, portfolio management and investment management
Risk IT End-to-end view of all risks related to the use of IT and treatment of risk management
Business managers and boards
Covers the domains of risk governance, risk evaluation and risk response, which are detailed by process components, management practice, inputs and outputs, RACI charts and goals and metrics
COBIT 4.1
Provides an internal control framework for IT by requiring organizations to define their motivation for IT investment, the stakeholders and the desired outcomes (ITGI, 2007)
Business managers and boards
Links business goals to IT goals, identifies the associated responsibilities of business and IT process owners, and through metrics and maturity models measures the achievement of goals
COSO
An integrated framework concerned with Enterprise Risk Management (ERM) and related Internal Control. It views internal control as a process effected by an entity’s board, management and others to manage risk
Boards and top management
A cube with 4 organizational objectives, 8 risk management components and 4 organizational units
IT Projects and IT Operations
ITIL IT service management and operations
IT service providers
Service delivery through IT as a whole of organization engagement
CMMI
Focuses on product and service development; establishing and managing services; acquiring related products and services
Organizations
Prince 2
A project management methodology that encompasses high level management, control and organization in a project
Project managers

42
Appendix 2: Sources of definitive statements regarding CGIT’s meaning (related to Table 3) Definitive Statement Source Details A responsibility of executives and the board of directors aimed at ensuring the organization’s IT systems sustain and extend its strategies and objectives
Adapted from ITGI (2007 p.5).
Actual words “IT governance is the responsibility of executives and the board of directors, and consists of the leadership, organisational structures and processes that ensure that the enterprise’s IT sustains and extend the organisation’s strategies and objectives”
A set of mechanisms to request, prioritise, sponsor, fund, monitor, and enforce IT investment decisions in order to ensure the resulting IT investments deliver value to the organization
Adapted from Heier et al. (2009 p.1)
Actual words “Congruent with Korac-Kakabadse and Kakabadse (2001), as well as with Weill and Vitale (2002) we define IT governance as the set of enabling mechanisms to request, prioritize, fund, monitor, enforce, and realign IT investment decisions”
A framework for decision rights and accountabilities designed to encourage desirable behaviour in the use of IT within an organization
Adapted from Weill and Ross, (2004 p. 1) and Weill (2004 p.3)
Actual words “IT governance is the decision rights and accountability framework for encouraging desirable behaviors in the use of IT”“
The system by which the current and future use of IT is directed and controlled within an organization
ISO 38500 (2008 p.3)
Actual words
A subset of the overall corporate governance of the organization concerned specifically with decisions about key IT activities and investments
Adapted from Debreceny and Gray (2013)
“In broad terms, IT governance is the exercise of decision rights, as a subset of corporate governance, and the design and execution of structures and processes to manage risk and implement organizational objectives”
The strategic alignment of IT with business goals and objectives
Adapted from Mueller and Phillipson (2007)
Van Grembergen et al. (2005 p.1) a crucial element of IT governance is achieving a better link between business and IT, also referred to as strategic alignment” “Good IT governance is a strategic enabling force of your business” page 1. Authors are from IBM
Other including: (1)necessarily and sufficiently capable of managing and delivering the organization’s ICT-enabled investment agenda and business continuity; (2) performance and accountability of IT; (3) controls to ensure proper investment and management for IT capability; (4) Policies, strategies
Adapted from Government ICT Strategy (2011); AS 8015:2005; Cater-Steel (2008); Weill and Ross (2005); Moeller (2013); ISO 38500:2008.
References AS 8015-2005 Corporate Governance of Information & Communication Technology, Standards Australia,
Sydney. Cater-Steel, A. (Ed.). Information Technology Governance and Service Management: Frameworks and
Adaptations. 2008. IGI Global.
43
Debreceny RS, Gray GL. IT Governance and Process Maturity: A Multinational Field Study, J. Info. Syst. 2013;27(1):157–188.
Government ICT Strategy, Cabinet Office. 2011. Whitehall, London. https://www.gov.uk/government/uploads/system/uploads/attachment_data/file/85968/uk-government-government-ict-strategy_0.pdf
Heier H, Borgman HP, Mileos C. Examining the relationship between IT governance software, processes, and business value: a quantitative research approach. In System Sciences, 2009. HICSS'09. 42nd Hawaii International Conference on (pp. 1-11). IEEE.
Henderson JC, Venkatraman N. Strategic alignment: Leveraging information technology for transforming organizations. IBM Syst. J.1993;32(1):4-16.
ISO/IEC 38500:2008. Corporate Governance of Information Technology. 2008. International Standards Organization.
ITGI. COBIT 4.1, 2007. IT Governance Institute, Rolling Meadows, IL, USA. Moeller, R. R. Executive's guide to IT governance: improving systems processes with service
management, COBIT, and ITIL. 2013. John Wiley & Sons. Mueller LM, Phillipson A. The emerging role of IT governance
http://www.ibm.com/developerworks/rational/library/dec07/mueller_phillipson/ index.html. 2007 Van Grembergen W, De Haes S, Moons J. Linking business goals to IT goals and COBIT processes.
Inform. Syst. Control J. 2005;4:18-21. Weill P. Don’t just lead govern. How top-performing firms govern IT, MIS Q. Exec. 2004;3(1):1–17. Weill P, Ross J. Designing IT governance. MIT Sloan Management Review, 2005;46(2). Weill P, Ross JW. IT governance on one page. 2004. Weill P, Vitale M. What it infrastructure capabilities are needed to implement e-business models? MIS
Quarterly, 2002;1(1):17.