Exploring Data In Engineering, the Sciences, and Medicine ...
98
Exploring Data In Engineering, the Sciences, and Medicine Solutions Manual Ronald K. Pearson December 31, 2011 This manual presents detailed solutions to all of the problems in Exploring Data in Engineering, the Sciences and Medicine except those designated as computer exercises. Chapter 3 Exercise 1: Show that the first moment of the binomial distribution is m 1 = np. [Hint—the following result may be useful: k n k = kn! k!(n − k)! = n(n − 1)! (k − 1)!([n − 1] − [k − 1])! = n n − 1 k − 1 . It is easily derived from the definition of the binomial coefficient and the properties of factorials.] Solution: 1. First, write out the defining expression for m 1 and note that: m 1 = n k=0 kp k = n k=0 k n k p k (1 − p) n−k = n k=1 k n k p k (1 − p) n−k , since the term in the sum for k = 0 vanishes. 2. Next, use the hint to rewrite this result as: m 1 = n k=1 n n − 1 k − 1 p k (1 − p) n−k . 1
Transcript of Exploring Data In Engineering, the Sciences, and Medicine ...

Exploring Data
In Engineering, the Sciences, and Medicine
Solutions Manual
Ronald K. Pearson
December 31, 2011
This manual presents detailed solutions to all of the problems in Exploring Data
in Engineering, the Sciences and Medicine except those designated as computerexercises.
Chapter 3
Exercise 1:
Show that the first moment of the binomial distribution is m1 = np.[Hint—the following result may be useful:
k
(nk
)=
kn!
k!(n − k)!=
n(n − 1)!
(k − 1)!([n − 1] − [k − 1])!= n
(n − 1k − 1
).
It is easily derived from the definition of the binomial coefficient andthe properties of factorials.]
Solution:
1. First, write out the defining expression for m1 and note that:
m1 =
n∑
k=0
kpk =
n∑
k=0
k
(nk
)pk(1 − p)n−k
=
n∑
k=1
k
(nk
)pk(1 − p)n−k,
since the term in the sum for k = 0 vanishes.
2. Next, use the hint to rewrite this result as:
m1 =
n∑
k=1
n
(n − 1k − 1
)pk(1 − p)n−k.
1

3. To simplify, define j = k − 1 and m = n − 1 and rewrite the aboveexpression as:
m1 =m∑
j=0
n
(mj
)pj+1(1 − p)m−j
= np
m∑
j=0
(mj
)pj(1 − p)m−j
4. It follows immediately from this result that m1 = np since the sum in thisexpression is simply the normalization sum for the binomial distribution.
Exercise 2:
Show that the Poisson distribution satisfies the normalization re-quirement that
∑∞k=0 pk = 1.
Solution:
1. First, substitute the definition for the Poisson probability pk into the sum:
∞∑
k=0
pk =
∞∑
k=0
e−λ λk
k!= e−λ
∞∑
k=0
λk
k!
2. Second, note that the sum appearing above is the Taylor series represen-tation for the exponential function, yielding:
∞∑
k=0
pk = e−λ · eλ = 1
Exercise 3:
Derive the moments m1 and µ2 for the Poisson distribution.
Solution:
1. From the definition of m1, for the Poisson distribution we have:
m1 =
∞∑
k=0
kpk =
∞∑
k=0
ke−λ λk
k!
= λe−λ∞∑
k=1
λk−1
(k − 1)!
= λe−λ∞∑
j=0
λj
j!
= λe−λeλ
= λ
2

2. The easiest way to compute the central moment µ2 is to recall that µ2 =m2 − m2
1 where:
m2 =
∞∑
k=0
k2pk = e−λ∞∑
k=0
k2λk
k!
= e−λ∞∑
k=1
kλk
(k − 1)!
3. As before, write j = k − 1, converting this sum to:
m2 = e−λ∞∑
j=0
(j + 1)λj+1
j!
= λe−λ
∞∑
j=0
jλj
j!+
∞∑
j=0
λj
j!
= λe−λ
λ
∞∑
j=1
λj−1
(j − 1)!+ eλ
= λe−λ
[λ
∞∑
ℓ=0
λℓ
ℓ!+ eλ
]
= λe−λ[λeλ + eλ
]
= λ2 + λ
4. Combining these results yields:
µ2 = m2 − m21 = (λ2 + λ) − λ2 = λ
Exercise 4:
Derive the mean and variance for the discrete uniform distribution.
Solution:
1. For the discrete uniform distribution with M > 1 levels, pk = 1/M for allk, and the mean m1 is given by:
m1 =
M∑
k=1
kpk =1
M
M∑
k=1
k =1
M
[M(M + 1)
2
]=
M + 1
2
2. To compute the variance µ2, again use the fact that µ2 = m2 − m21. It
follows from Eq. (3.21) that m2 is given by:
m2 =
M∑
k=1
k2pk =1
M
M∑
k=1
k2 =1
M
[M(M + 1)(2M + 1)
6
]=
(M + 1)(2M + 1)
6
3

3. Combining these results and simplifying the algebra yields:
µ2 =(M + 1)(2M + 1)
6−[M + 1
2
]2
=2M2 + 3M + 1
6− M2 + 2M + 1
4
=1
2
[2(2M2 + 3M + 1) − 3(M2 + 2M + 1)
6
]
=1
2
[4M2 + 6M + 2 − 3M2 − 6M − 3
6
]
=M2 − 1
12
Exercise 5: NOTE that there is an error in the original problem
statement. This error has een corrected here.
The standard estimator for the variance σ2x of a sequence {xk} of N
real numbers is given in Chapter 1 and discussed further in Chapter6. It is:
σ2 =1
N − 1
N∑
k=1
(xk − x)2,
where x is the mean of the sequence. Show that the Simpson hetero-geneity measure for a normalized sequence {pi} of M probabilitiesis exactly equal to Mσp
2.
Solution:
1. First, note that for a normalized sequence of probabilities, we have:
M∑
i=1
pi = 1 ⇒ p =1
M
M∑
i=1
pi =1
M
2. Thus, the estimated variance is:
σ2p =
1
M − 1
M∑
i=1
(pi − p)2
=1
M − 1
M∑
i=1
(pi − 1/M)2
=1
M − 1
M∑
i=1
(p2i − 2pi/M + 1/M2)
=1
M − 1
[M∑
i=1
p2i −
2
M
M∑
i=1
pi + M · 1
M2
]
4

=1
M − 1
[M∑
i=1
p2i −
2
M+
1
M
]
=1
M − 1
[M∑
i=1
p2i −
1
M
]
3. Thus, it follows from the definition of the Simpson measure that:
ISimpson =M∑M
i=1 p2i − 1
M − 1= Mσ2
p
Chapter 4
Exercise 1—NOTE: there is an error in the original problem
statement. The term r in the original statement should be n.
Prove the relationship between the central moments µn and the non-central moments mr given in Eq. (4.15).
Solution:
1. From the definition of central moments, µn = E{(x − m1)n}. By the
binomial expansion—Eq. (3.12) on page 118—we have:
(x − m1)n = (x + [−m1])
n =
n∑
j=0
(nj
)xj [−m1]
n−j .
2. Since the expectation operator is linear, taking the expectation with re-spect to the random variable x leads to the final result:
µn = E
n∑
j=0
(nj
)xj [−m1]
n−j
=
n∑
j=0
(nj
)E{xj}[−m1]
n−j
=
n∑
j=0
(nj
)mj [−m1]
n−j
Exercise 2:
Suppose the density p(x) is symmetric about x0. Prove that themean satisfies x = x0.
Solution:
1. The mean is given by:
x = E{x} =
∫ ∞
−∞xp(x)dx
5

2. Let z = x − x0 so that x = x0 + z, giving:
x =
∫ ∞
−∞(x0 + z)p(x0 + z)dz
= x0
∫ ∞
−∞p(x0 + z)dz +
∫ ∞
−∞zp(x0 + z)dz
≡ x0
∫ ∞
−∞g(z)dz +
∫ ∞
−∞zg(z)dz,
where g(z) = p(x0 + z) is simply a shifted version of p(x).
3. Note that the first of these integrals is equal to 1 by the normalizationcondition for g(z), while the second integral is the mean of the shifteddistribution g(z). For notational convenience, denote this second integralby I.
4. Since p(x) is symmetric about x0, it follows that g(z) is symmetric aboutzero:
g(z) = p(x0 + z) = p(x0 − [−z]) = p(−z − x0) = p(−[x0 + z]) = g(−z).
5. Thus, the integral I is:
I =
∫ ∞
−∞zg(z)dz =
∫ ∞
−∞zg(−z)dz
6. Let w = −z and rewrite this integral as:
I =
∫ ∞
−∞(−w)g(w)d(−w)
=
∫ −∞
+∞wg(w)dw
= −∫ ∞
−∞wg(w)dw = −I.
7. Thus, it follows that I = 0 and that x = x0 as claimed.
Exercise 3:
Suppose the density p(x) is symmetric about x0. Prove that themedian satisfies x† = x0.
Solution:
6

1. As in Exercise 2, define z = x−x0 and g(z) = p(x0 + z), and consider theintegral:
I =
∫ x0
−∞p(x)dx
=
∫ 0
−∞p(x0 + z)dz
=
∫ 0
−∞g(z)dz
2. Note that
1 − I =
∫ ∞
−∞g(z)dz −
∫ 0
−∞g(z)dz
=
∫ ∞
0
g(z)dz
=
∫ ∞
0
g(−z)dz (by the symmetry of p(x) about x0)
=
∫ −∞
0
g(w)d(−w) (substituting w = −z)
= −∫ −∞
0
g(w)dw
=
∫ 0
−∞g(w)dw = I
3. It follows from this result that 1−I = I, implying I = 1/2. Consequently,we have: ∫ x0
−∞p(x)dx =
1
2,
which is the defining condition for the median x†.
Exercise 4:
Suppose the density p(x) is unimodal and symmetric about x0.Prove that the mode satisfies x∗ = x0.
Solution:
1. As in the previous two problems, define z = x − x0 and g(z) = p(x0 + z),from which it follows that g(−z) = g(z) (see the solution to Exercise 2). Ifp(x) is unimodal with a mode at x∗, it follows that g(z) is also unimodal,with a mode at z∗ = x∗ − x0.
2. It follows from the above definitions that g(−z∗) = g(z∗). Since g(z) isunimodal with a mode at z∗, this implies −z∗ = z∗ = 0, which furtherimplies x∗ = x0.
7

Exercise 5:
Consider the Pareto distribution:
p(x) =aka
xa+1, x ≥ k > 0, a > 0.
For this distribution, compute:
a. the mean x,
b. the median x†,
c. the mode x∗.
Solution:
1. The mean of this distribution is:
x = E{x} =
∫ ∞
k
xp(x)dx
=
∫ ∞
k
x
(aka
xa+1
)dx
= aka
∫ ∞
k
x−adx
=akax−a+1
−a + 1
∣∣∣∣∞
k
= 0 − akak−a+1
−a + 1(provided a > 1)
=ak
a − 1
2. The median is the value x† for which:∫ x†
k
p(x)dx =1
2
Integrating the density yields:
∫ x†
k
p(x)dx =
∫ x†
k
aka
xa+1dx
= (aka)
∫ x†
k
x−a−1dx
=akax−a
−a
∣∣∣∣x†
k
= −(
k
x
)a∣∣∣∣x†
k
= 1 −(
k
x†
)a
8

Solving for the median yields:
1 −(
k
x†
)a
=1
2⇒
(k
x†
)a
=1
2
⇒(
x†
k
)a
= 2
⇒ x†
k= 21/a
⇒ x† = 21/ak.
3. The mode is the value for which the density is a maximum. Plotting thePareto distribution for any values of a and k shows that it is J-shaped,decaying monotonically from its mode at x∗ = k. To prove this result,note that the derivative of the density with respect to x is:
dp(x)
dx=
d
dx
(aka
xa+1
)
= aka[−(a + 1)x−a−2]
= −a(a + 1)ka
xa+2.
Since a, k, and x are all positive numbers, it follows that this derivative isnegative for all x, implying that the function is nonincreasing. Thus, themode must occur at the minimum possible value for x, at x∗ = k.
Exercise 6:
Consider the Laplace distribution:
p(x) =1
2φe−|x−µ|/φ, φ > 0.
a. For this distribution, compute the exact probability P{|x−µ| >cφ};
b. Construct either a plot or a small table, comparing these exactvalues with those given by Chebyshev’s inequality.
Solution:
1. Since this distribution is symmetric about µ, it follows that:
P{|x − µ| > cφ} = 2P{x − µ > cφ}= 2P{x > µ + cφ}
= 2
∫ ∞
µ+cφ
p(x)dx
=1
φ
∫ ∞
µ+cφ
e−|x−µ|/φdx
=1
φ
∫ ∞
µ+cφ
e−(x−µ)/φdx
9

1 2 3 4 5
0.0
0.2
0.4
0.6
0.8
1.0
Normalized deviation, c
Exc
eede
nce
prob
abili
ty
Figure 1: Comparison of exact probability that |x − µ| > cφ (solid line) withthe corresponding Chebyshev bound (dashed line).
2. To simplify the subsequent algebra, define z = (x − µ)/φ and note that:
P{|x − µ| > cφ} =
∫ ∞
c
e−zdz
= −e−z |∞c= −[0 − e−c] = e−c.
3. The plot in Fig. 1 compares these exact values (solid line) with the Cheby-shev bounds (dashed line).
10

Chapter 5
Exercise 1:
Derive the expressions given in Eq. (5.79) for the maximum likeli-
hood estimates σ2 and φ of the Gaussian and Laplace scale param-eters.
Solution:
1. For the Gaussian case, the likelihood as a function of a, b, and σ2 may bewritten as the following slight modification of Eq. (5.71):
ℓ(a, b, σ2) = −N
2ln(2π) − N
2lnσ2 − 1
2σ2
N∑
k=1
(yk − axk − b)2
2. Necessary conditions for minimizing this funtion with respect to thesethree parameters are:
∂ℓ(a, b, σ2)
∂a=
1
σ2
N∑
k=1
(yk − axk − b)xk = 0
∂ℓ(a, b, σ2)
∂b=
1
σ2
N∑
k=1
(yk − axk − b) = 0
∂ℓ(a, b, σ2)
∂σ2= − N
2σ2+
1
2σ4
N∑
k=1
(yk − axk − b)2 = 0.
3. The first two of these conditions lead to the minimization problem for fixedσ given in Eq. (5.72). Since these ML estimates do not depend on σ2, we
can fix these coefficients at their estimated values a and b. Substitutingthese into the third equation above and solving yields the desired result:
− N
2σ2+
1
2σ4
N∑
k=1
(yk − axk − b)2 = 0
⇒ N
2σ2=
1
2σ4
N∑
k=1
(yk − axk − b)2
⇒ σ2 =1
N
N∑
k=1
(yk − axk − b)2
4. For the Laplace distribution, the likelihood is given by Eq. (5.74) as:
ℓ(a, b, φ) = −N ln 2 − N lnφ − 1
φ
N∑
k=1
|yk − axk − b|
11

Here, because ℓ(a, b, φ) is not a smooth function of a and b, the ML es-timate is not obtained by setting partial derivatives to zero. As in theGaussian case just considered, however, the ML estimates a and b do notdepend on the scale parameter φ (i.e., they correspond to the solutionof the optimization problem defined by Eq. (5.75)), so we can fix these
parameters at their ML estimates and solve for φ. Since the dependenceof ℓ(a, b, φ) on φ is smooth, we can differentiate ℓ(a, b, φ) with respect to
φ to obtain Eq. (5.79) for the ML estimate φ:
∂ℓ(a, b, φ)
∂φ= −N
φ+
1
φ2
N∑
k=1
|yk − axk − b| = 0
⇒ N
φ=
1
φ2
N∑
k=1
|yk − axk − b|
⇒ φ =1
N
N∑
k=1
|yk − axk − b|
Exercise 2:
Derive Eqs. (5.53), (5.54), and (5.55) for the TLS line-fitting solu-tion.
Solution:
1. For the TLS case, the distance to be minimized is:
JTLS(a, b, x(k)) =N∑
k=1
{[y(k) − ax(k) − b]2 + [x(k) − x(k)]2}
To determine x(k), set the corresponding partial derivative to zero:
∂JTLS(a, b, x(k))
∂x(k)= −2a[y(k) − ax(k) − b] + 2[x(k) − x(k)] = 0
This leads to the desired result (Eq. (5.53)):
2a[y(k) − b] + 2x(k) = 2(a2 + 1)x(k)
⇒ x(k) =x(k) + a[y(k) − b]
1 + a2
2. From Eq. (5.30) we obtain Eq. (5.54) as:
y(k) = ax(k) + b
= a
[x(k) + a(y(k) − b)
1 + a2
]+ b
=ax(k) + a2y(k) − a2b + (1 + a2)b
1 + a2
=a2y(k) + ax(k) + b
1 + a2
12

3. Combining these results yields Eq. (5.55):
ρ(vk,vk) = [y(k) − y(k)]2 + [x(k) − x(k)]2
=
[y(k) − a2y(k) + ax(k) + b
1 + a2
]2+
[x(k) − x(k) + a[y(k) − b]
1 + a2
]2
= (1 + a2)−2{[(1 + a2)y(k) − a2y(k) − ax(k) − b]2
+[(1 + a2)x(k) − x(k) − a(y(k) − b)]2}
= (1 + a2)−2{[y(k) − ax(k) − b]2 + [a2x(k) − ay(k) + ab]2
}
= (1 + a2)−2{[y(k) − ax(k) − b]2 + [(−a)(y(k) − ax(k) − b)]2
}
= (1 + a2)−2{[y(k) − ax(k) − b]2 + a2[y(k) − ax(k) − b]2
}
=[y(k) − ax(k) − b]2
1 + a2
Exercise 3:
Prove that the second derivative of JTLS(a, b) with respect to a ata = aTLS is given by Eq. (5.63).
Solution:
1. From Eq. (5.60), we have:
JTLS(a, bTLS) = N
[σ2
y − 2acxy + a2σ2x
1 + a2
]
Defining λ = [σ2x − σ2
y]/cxy, note that σ2y = σ2
x − λcxy. Substituting thisresult into the above expression yields:
JTLS(a, bTLS) = N
[σ2
x − λcxy − 2acxy + a2σ2x
1 + a2
]
= N
[σ2
x(1 + a2) − cxy(λ + 2a)
1 + a2
]
= Nσ2x − Ncxy(λ + 2a)
1 + a2
2. The first derivative of this expression with respect to a is:
∂JTLS(a, bTLS)
∂a= −Ncxy
∂
∂a
[λ + 2a
1 + a2
]
= −Ncxy
[(1 + a2) · 2 − (λ + 2a) · 2a
(1 + a2)2
]
= −(
2Ncxy
(1 + a2)2
)[1 + a2 − aλ − 2a2]
=
(2Ncxy
(1 + a2)2
)[a2 + aλ − 1]
13

Note that setting this derivative to zero yields Eq. (5.61) for the TLSestimator aTLS .
3. Differentiating again yields:
∂2JTLS(a, bTLS)
∂a2= 2Ncxy
∂
∂a
[a2 + aλ − 1
(1 + a2)2
]
=2Ncxy
(1 + a2)4[(1 + a2)2(2a + λ) − (a2 + aλ − 1) · 4a(1 + a2)
]
=2Ncxy
(1 + a2)3[(1 + a2)(2a + λ) − 4a(a2 + aλ − 1)
]
=2Ncxy
(1 + a2)3[2a + λ + 2a3 + a2λ − 4a3 − 4a2λ + 4a
]
=2Ncxy
(1 + a2)3[6a + λ − 2a3 − 3a2λ
]
4. To evaluate this result for a = aTLS , note that this quantity is defined byEq. (5.61):
a2TLS + λaTLS − 1 = 0 ⇒ a2
TLS = 1 − λaTLS
Let T denote the term in brackets in the second derivative expression,evaluated at aTLS :
T = 6aTLS + λ − 2a3TLS − 3a2
TLSλ
= 6aTLS + λ − 2aTLS(1 − λaTLS) − 3(1 − λaTLS)λ
= 6aTLS + λ − 2aTLS + 2λa2TLS − 3λ + 3λ2aTLS
= 4aTLS − 2λ + 2λ(1 − λaTLS) + 3λ2aTLS
= 4aTLS − 2λ + 2λ − 2λ2aTLS + 3λ2aTLS
= 4aTLS + λ2aTLS
= (λ2 + 4)aTLS
5. From Eq. (5.64), we have λ2 + 4 = (λ + 2aTLS)2. Substituting this ex-pression into the second derivative result yields:
∂2JTLS(a, bTLS)
∂a2
∣∣∣∣a=aT LS
=2Ncxy
(1 + a2TLS)3
(λ + 2aTLS)2aTLS
To simplify this result to the desired one, note that:
(λ + 2aTLS)aTLS = λaTLS + 2a2TLS
= λaTLS + 2(1 − λaTLS)
= 2 − λaTLS
= 1 + a2TLS
14
Thus, the above result reduces to Eq. (5.63):
∂2JTLS(a, bTLS)
∂a2
∣∣∣∣a=aT LS
=2Ncxy(λ + 2aTLS)(1 + a2
TLS)
(1 + a2TLS)3
=2Ncxy(λ + 2aTLS)
(1 + a2TLS)2
Exercise 4:
In 1923, Subotin proposed the following family of probability distri-butions:
p(x) =1
Cφexp
[−1
2
∣∣∣∣x − θ
φ
∣∣∣∣2/δ]
,
C = 2(δ/2)+1Γ
(δ
2+ 1
),
where θ is an arbitrary real constant and φ and δ are positive con-stants. Suppose the line fit errors {ek} form a statistically indepen-dent, identically distributed, zero-mean sequence corresponding tothis distribution with θ = 0 and δ > 0 fixed and known. Reduce themaximum likelihood estimation problem to an optimization prob-lem. What norm of {ek} is being minimized?
Solution:
1. The likelihood function for this problem is defined by Eq. (5.69):
ℓ(a, b) =
N∑
k=1
ln p(ek)
where ek = axk + b − yk.
2. For the distribution considered here—with θ = 0 and δ known and fixed—we have:
ln p(ek) = − ln C(δ) − lnφ − 1
2
∣∣∣∣ek
φ
∣∣∣∣2/δ
Thus, since φ > 0, the log likelihood can be expressed as:
ℓ(a, b) = −N lnC(δ) − N lnφ − 1
2φ2/δ
N∑
k=1
|yk − axk − b|2/δ
3. Since only the last term in this expression depends on the parameters aand b, the maximum likelihood estimation problem is equivalent to theminimization of:
J(a, b) =
N∑
k=1
|yk − axk − b|2/δ
Note that this is a minimization of the ℓp norm of the model errors forp = 2/δ.
15

Chapter 6
Exercise 1:
Suppose {xk} is a sequence of N independent, identically distributedrandom variables with mean µ and variance σ2. If µ and σ2 are finite,show that the following estimator of σ2 is unbiased:
σ2 =1
N − 1
N∑
k=1
(xk − xN )2.
Solution:
1. To show that the estimator is unbiased, we need to show that E{σ2} = σ2.To do this, first note that:
E{σ2} = E
{1
N − 1
N∑
k=1
(xk − x)2
}
=1
N − 1
N∑
k=1
E{(xk − x)2}
=
(N
N − 1
)E{(xk − x)2}
2. Next, note that:
(xk − x)2 = [(xk − µ) − (x − µ)]2
= (xk − µ)2 − 2(xk − µ)(x − µ) + (x − µ)2
⇒ E{(xk − x)2} = σ2 − 2E{(xk − µ)(x − µ)} + E{(x − µ)2}
3. Expanding the first of these expectations gives:
E{(xk − µ)(x − µ)} = E
(xk − µ)
1
N
N∑
j=1
xj − µ
= E
(xk − µ)
1
N
N∑
j=1
(xj − µ)
=1
N
N∑
j=1
E{(xk − µ)(xj − µ)}
=1
N
∑
j 6=k
E{(xk − µ)(xj − µ)} + E{(xk − µ)2}
16

=1
N
∑
j 6=k
E{(xk − µ)}E{(xj − µ)} + σ2
=σ2
N
4. The second expectation yields:
E{(x − µ)2} = E
1
N
N∑
j=1
xj − µ
2
= E
1
N
N∑
j=1
[xj − µ]
2
=1
N2E
N∑
j=1
(xj − µ)
N∑
k=1
(xk − µ)
=1
N2
N∑
j=1
N∑
k=1
E{(xj − µ)(xk − µ)}
As in the previous result, the only nonzero term in the sum over k is thatfor j = k, which is equal to σ2. Thus, the second expectation is:
E{(xk − µ)2} =1
N2
N∑
j=1
σ2 =σ2
N
5. Combining these results yields:
E{(xk − x)2} = σ2 − 2σ2
N+
σ2
N
= σ2
[1 − 1
N
]
=
(N − 1
N
)σ2
Thus, the estimator is unbiased as claimed since:
E{σ2} =
(N
N − 1
)E{(xk − x)2} =
(N
N − 1
)(N − 1
N
)σ2 = σ2
Exercise 2:
For the unbiased estimator considered in Exercise 1, show that theestimator variance is given by:
var {σ2} =(κ + 2)σ4
N+
2σ4
N(N − 1),
17

where κ is the kurtosis of the common distribution of {xk}.
Solution:
1. To simplify subsequent algebra, define zk = xk − µ and note that:
E{zk} = E{xk} − µ = 0
⇒ var{zk} = E{z2k} = σ2
and E{zkzℓ} = E{zk}E{zℓ} = 0 if k 6= ℓ
2. Also note that:
xk − x = (xk − µ) − (x − µ)
= zk −
1
N
N∑
j=1
xj − µ
= zk −
1
N
N∑
j=1
[xj − µ]
= zk − 1
N
N∑
j=1
zj
= zk − z
3. Thus, the variance estimator is:
σ2 =1
N − 1
N∑
k=1
(xk − x)2
=1
N − 1
N∑
k=1
(zk − z)2
=1
N − 1
N∑
k=1
(z2k − 2zkz + z2)
=1
N − 1
[N∑
k=1
z2k − 2z
N∑
k=1
zk +
N∑
k=1
z2
]
=1
N − 1
[N∑
k=1
z2k − 2Nz2 + Nz2
]
=1
N − 1
[N∑
k=1
z2k − Nz2
]
=1
N − 1
N∑
k=1
(z2k − z2)
18

4. The variance of σ2 is:
var {σ2} = E{[σ2]2} − [E{σ2}]2
= E{[σ2]2} − σ4 (from Exercise 1)
5. The first expectation is:
E{[σ2]2} = E
(1
N − 1
N∑
k=1
[z2k − z2]
)2
= E
{1
(N − 1)2
N∑
k=1
[z2k − z2]
N∑
ℓ=1
[z2ℓ − z2]
}
=1
(N − 1)2
N∑
k=1
N∑
ℓ=1
E{z2kz2
ℓ − z2kz2 − z2
ℓ z2 + z4}
=1
(N − 1)2
[N∑
k=1
N∑
ℓ=1
E{z2kz2
ℓ } −N∑
k=1
N∑
ℓ=1
E{z2kz2}
−N∑
k=1
N∑
ℓ=1
E{z2ℓ z2} +
N∑
k=1
N∑
ℓ=1
E{z4}]
=1
(N − 1)2
[N∑
k=1
N∑
ℓ=1
E{z2kz2
ℓ } − NN∑
k=1
E{z2kz2}
−N
N∑
ℓ=1
E{z2ℓ z2} + N2E{z4}
]
=1
(N − 1)2
[N∑
k=1
N∑
ℓ=1
E{z2kz2
ℓ } − 2N
N∑
k=1
E{z2kz2} + N2E{z4}
]
6. Define the double sum as:
S1 =
N∑
k=1
N∑
ℓ=1
E{z2kz2
ℓ }
=
N∑
k=1
E{z4
k} +∑
ℓ 6=k
E{z2kz2
ℓ }
=
N∑
k=1
(κ + 3)σ4 +
∑
ℓ 6=k
E{z2k}E{z2
ℓ }
=
N∑
k=1
(κ + 3)σ4 +
∑
ℓ 6=k
σ4
19

=
N∑
k=1
[(κ + 3)σ4 + (N − 1)σ4]
= N [(κ + 3)σ4 + (N − 1)σ4]
= N(N + κ + 2)σ4
7. Next, define:
S2 = 2NN∑
k=1
E{z2kz2}
= 2NN∑
k=1
E
{z2k
(1
N
N∑
ℓ=1
zℓ
)(1
N
N∑
m=1
zm
)}
=2
N
N∑
k=1
N∑
ℓ=1
N∑
m=1
E{z2kzℓzm}
Note that if m 6= ℓ, then we must consider three cases:
k = ℓ 6= m ⇒ E{z2kzℓzm} = E{z3
kzm} = E{z3k}E{zm} = 0
k = m 6= ℓ ⇒ E{z2kzℓzm} = E{z3
kzℓ} = E{z3k}E{zℓ} = 0
k 6= m, ℓ ⇒ E{z2kzℓzm} = E{z2
k}E{zℓ}E{zm} = 0
Thus, the only nonzero contribution from the sum over m in S2 is theterm m = ℓ, which implies:
S2 =2
N
N∑
k=1
N∑
ℓ=1
E{z2kz2
ℓ }
=2
NS1
= 2(N + κ + 2)σ4
8. Finally, define:
S3 = N2E{z4}
= N2E
(1
N
N∑
k=1
zk
)4
=1
N2E
{N∑
k=1
N∑
ℓ=1
N∑
m=1
N∑
n=1
zkzℓzmzn
}
=1
N2
N∑
k=1
N∑
ℓ=1
N∑
m=1
N∑
n=1
E{zkzℓzmzn}
20

=1
N2
N∑
k=1
N∑
m=1
N∑
n=1
E{z2kzmzn} +
N∑
k=1
∑
ℓ 6=k
N∑
m=1
N∑
n=1
E{zkzℓzmzn}
=1
N2
NS2
2+
N∑
k=1
∑
ℓ 6=k
N∑
m=1
N∑
n=1
E{zkzℓzmzn}
Note that for k 6= ℓ, it follows that E{zkzℓzmzn} = 0 unless either m = ℓand n = k or m = k and n = ℓ. In either of these cases:
E{zkzℓzmzn} = E{z2kz2
ℓ } = E{z2k}E{z2
ℓ } = σ4
Thus, the quadruple sum above reduces to:
N∑
k=1
∑
ℓ 6=k
N∑
m=1
N∑
n=1
E{zkzℓzmzn} =N∑
k=1
∑
ℓ 6=k
2σ4
= 2N(N − 1)σ4
This implies that:
S3 =1
N2
[NS2
2+ 2N(N − 1)σ4
]
=1
N2
[N
2· 2(N + κ + 2)σ4 + 2N(N − 1)σ4
]
=1
N2· [N(N + κ + 2)σ4 + 2N(N − 1)σ4]
=σ4
N· [N + κ + 2 + 2(N − 1)]
=(3N + κ)σ4
N
9. Combining these results yields:
E{[σ2]} =1
(N − 1)2[S1 − S2 + S3]
=1
(N − 1)2
[N(N + κ + 2)σ4 − 2(N + κ + 2)σ4 +
3N + κ
Nσ4
]
=σ4
N(N − 1)2[N2(N + κ + 2) − 2N(N + κ + 2) + 3N + κ]
=σ4
N(N − 1)2[N3 + 2N2 − 2N2 − 4N + 3N + κ(N2 − 2N + 1)]
=σ4
N(N − 1)2[N3 − N + κ(N − 1)2]
=σ4(N2 − 1)N
N(N − 1)2+
κ(N − 1)2σ4
N(N − 1)2
21

=(N + 1)σ4
N − 1+
κσ4
N
Thus, the variance is given by:
var{σ2} = E{[σ2]2} − σ4
= σ4
[N + 1
N − 1+
κ
N− 1
]
= σ4
[N + 1 − (N − 1)
N − 1+
κ
N
]
=2σ4
N − 1+
κσ4
N
10. Note that this result can be re-written in the desired form:
2σ4
N − 1+
κσ4
N=
2σ4
N − 1− 2σ4
N+
(κ + 2)σ4
N
= 2σ4
[1
N − 1− 1
N
]+
(κ + 2)σ4
N
= 2σ4
[N − (N − 1)
N(N − 1)
]+
(κ + 2)σ4
N
=2σ4
N(N − 1)+
(κ + 2)σ4
N
Exercise 3:
Using the convolution representation for the density of the sum oftwo independent random variables, determine the distribution of thesum of N independent random variables, each uniformly distributedon the interval [0, 1]. (Hint: start with the simplest case N = 2and then proceed by induction to obtain the Irwin-Hall distributiondiscussed in Sec. 6.3.1.)
Solution:
1. To prove the result by induction, first show that the form of the Irwin-Halldistribution is correct for N = 2, and then show that if it is true for N ,this implies it is also truen for N + 1. For N = 2, the Irwin-Hall densityis:
p2(x) =1
1!
k∑
j=0
(−1)j
(2j
)(x − j) for k ≤ x ≤ k + 1,
where k = 0 or 1. More explicitly:
p2(x) =
(20
)x for 0 ≤ x ≤ 1
(20
)x −
(21
)(x − 1) for 1 ≤ x ≤ 2
22

=
{x for 0 ≤ x ≤ 1x − 2(x − 1) for 1 ≤ x ≤ 2
=
{x for 0 ≤ x ≤ 12 − x for 1 ≤ x ≤ 2
2. From the convolution result Eq. (6.21), the density for z = x + y wherex has density p(x) and y is statistically independent and uniformly dis-tributed on [0, 1] is given by:
g(z) =
∫ ∞
−∞p(x)u(z − x)dx
where the uniform density is:
u(y) =
{1 0 ≤ y ≤ 10 otherwise
Thus, the shifted uniform distribution in the convolution integral is:
u(z − x) =
{1 0 ≤ z − x ≤ 10 otherwise
=
{1 −z ≤ −x ≤ 1 − z0 otherwise
=
{1 z − 1 ≤ x ≤ z0 otherwise
Combining these results yields:
g(z) =
∫ z
z−1
p(x)dx
3. Applying this result first to the case p(x) = u(x) shows that the distribu-tion of the sum of two independent uniformly distributed random variableson [0, 1] is the Irwin-Hall distribution p2(x):
g(z) =
∫ z
z−1
u(x)dx
=
0 z < 0∫ z
0dx 0 ≤ z ≤ 1∫ 1
z−1dx 0 ≤ z − 1 ≤ 1
0 z − 1 > 1
=
0 z < 0z 0 ≤ z ≤ 11 − (z − 1) 1 ≤ z ≤ 20 z > 2
23

=
0 z < 0z 0 ≤ z ≤ 12 − z 1 ≤ z ≤ 20 z > 2
= p2(z)
4. Now, suppose the Irwin-Hall distribution is correct for the sum of N inde-pendent random variables, each uniformly distributed on [0, 1], and con-sider the distribution of the sum of N + 1 such variables. From the con-volution results just discussed, this sum has the distribution:
g(z) =
∫ ∞
−∞pN (x)u(z − x)dx
=
∫ z
z−1
pN (x)dx
5. For 0 ≤ z ≤ 1, since pN (x) = 0 for x < 0, this integral becomes:
g(z) =
∫ z
0
pN (x)dx
Note that this range corresponds to k = 0 in the definition of pN (x), sothat:
pN (x) =1
(N − 1)!
0∑
j=0
(−1)j
(Nj
)(x − j)N−1
=1
(N − 1)!
(N0
)xN−1
=xN−1
(N − 1)!
Thus, for 0 ≤ z ≤ 1, we have:
g(z) =
∫ z
0
xN−1
(N − 1)!dx
=xN
N(N − 1)!
∣∣∣∣z
0
=zN
N !
By the same reasoning as in Step 1 above, note that:
pN+1(z) =zN
N !for 0 ≤ z ≤ 1
⇒ g(z) = pN+1(z) for 0 ≤ z ≤ 1
24

6. More generally, note that the sum of N + 1 uniformly distributed randomvariables on [0, 1] can take values on the interval [0, N + 1]. For 1 ≤ z ≤N + 1, there exists a unique integer k between 1 and N such that:
k ≤ z ≤ k + 1 ⇒ z − 1 ≤ k ≤ z ≤ k + 1
This implies that:
g(z) =
∫ z
z−1
pN (x)dx
=
∫ k
z−1
pN (x|k − 1 ≤ x ≤ k)dx +
∫ z
k
pN (x|k ≤ x ≤ k + 1)dx
7. The first of these integrals is:
I1 =
∫ k
z−1
pN (x|k − 1 ≤ x ≤ k)dx
=
∫ k
z−1
1
(N − 1)!
k−1∑
j=0
(−1)j
(Nj
)(x − j)N−1
dx
=1
(N − 1)!
k−1∑
j=0
(−1)j
(Nj
)∫ k
z−1
(x − j)N−1dx
=1
(N − 1)!
k−1∑
j=0
(−1)j
(Nj
)[(x − j)N
N
]k
z−1
=1
(N − 1)!
k−1∑
j=0
(−1)j
(Nj
)[(k − j)N
N− (z − j − 1)N
N
]
=1
N(N − 1)!
k−1∑
j=0
(−1)j
(Nj
)(k − j)N
− 1
N(N − 1)!
k−1∑
j=0
(−1)j
(Nj
)(z − [j + 1])N
=1
N !
k−1∑
j=0
(−1)j
(Nj
)(k − j)N − 1
N !
k∑
ℓ=1
(−1)ℓ−1
(N
ℓ − 1
)(z − ℓ)N
=1
N !
k−1∑
j=0
(−1)j
(Nj
)(k − j)N +
1
N !
k∑
j=1
(−1)j
(N
j − 1
)(z − j)N
where the last line follows from the fact that ℓ and j are dummy summationindices.
8. The second integral is:
I2 =
∫ z
k
pN (x|k ≤ x ≤ k + 1)dx
25

=
∫ z
k
1
(N − 1)!
k∑
j=0
(−1)j
(Nj
)(x − j)N−1
dx
=1
(N − 1)!
k∑
j=0
(−1)j
(Nj
)[(x − j)N
N
]z
k
=1
N !
k∑
j=0
(−1)j
(Nj
)[(z − j)N − (k − j)N ]
=1
N !
k∑
j=0
(−1)j
(Nj
)(z − j)N − 1
N !
k∑
j=0
(−1)j
(Nj
)(k − j)N
9. Thus, the density of the sum is:
g(z) = I1 + I2
=1
N !
k−1∑
j=0
(−1)j
(Nj
)(k − j)N +
1
N !
k∑
j=1
(−1)j
(N
j − 1
)(z − j)N
+1
N !
k∑
j=0
(−1)j
(Nj
)(z − j)N − 1
N !
k∑
j=0
(−1)j
(Nj
)(k − j)N
=1
N !
k−1∑
j=0
(−1)j
(Nj
)(k − j)N −
k∑
j=0
(−1)j
(Nj
)(k − j)N
k∑
j=1
(−1)j
(N
j − 1
)(z − j)N +
k∑
j=0
(−1)j
(Nj
)(z − j)N
=1
N !
{−(−1)k
(Nk
)(k − k)N + (−1)0
(N0
)(z − 0)N
+
k∑
j=1
(−1)j
[(N
j − 1
)+
(Nj
)](z − j)N
=1
N !
zN +
k∑
j=1
(−1)j
[(N
j − 1
)+
(Nj
)](z − j)N
10. By result 3.1.4 from Abramowitz and Stegun, p. 10 [1]:
(N
j − 1
)+
(Nj
)=
(N + 1
j
)
⇒ g(z) =1
N !
zN +
k∑
j=1
(−1)j
(N + 1
j
)(z − j)N
26

=1
N !
k∑
j=0
(−1)j
(N + 1
j
)(z − j)N
= pN+1(z)
Exercise 4:
The rescaled Irwin-Hall density for N = 3 was considered in Sec. 6.3.1:
p(x) =
(3 − x2)/8 |x| ≤ 1,(3 − |x|)2/16 1 ≤ |x| ≤ 3,0 |x| ≥ 3,
where it was noted that this density provides a reasonable basisfor approximating the Gaussian cumulative distribution function(CDF). Integrate this density to obtain this approximation to theGaussian CDF.
Solution:
1. The cumulative distribution function is given by:
P (x) =
∫ x
−∞p(z)dz =
∫ x
−3
p(z)dz
2. For −3 ≤ x ≤ −1, we have:
P (x) =
∫ x
−3
(3 − |z|)216
dz
=1
16
∫ x
−3
(3 + z)2dz
=1
16
∫ x+3
0
w2dw (substitute w = z + 3)
=w3
16 · 3
∣∣∣∣x+3
0
=(x + 3)3
48
Note that at the upper limit of this range, P (−1) = 23/48 = 1/6.
3. For −1 ≤ x ≤ 0, we have:
P (x) =
∫ x
−3
p(z)dz
=
∫ −1
−3
p(z)dz +
∫ x
−1
p(z)dz
27

=1
6+
∫ x
−1
(3 − z2
8
)dz
=1
6+
1
8
[3z − z3
3
]x
−1
=1
6+
1
8
[3x − x3
3+ 3 − 1
3
]
=1
2+
9x − x3
24
Note that at the upper limit of this range, we have P (0) = 1/2.
4. For 0 ≤ x ≤ 1, we have:
P (x) =
∫ 0
−3
p(z)dz +
∫ x
0
p(z)dz
=1
2+
∫ x
0
(3 − z2
8
)dz
=1
2+
1
8
[3z − z3
3
]x
0
=1
2+
9x − x3
24
For the upper limit of this range, we have P (1) = 5/6.
5. For 1 ≤ x ≤ 3, the result is:
P (x) =
∫ 1
−3
p(z)dz +
∫ x
1
p(z)dz
=5
6+
∫ x
1
(3 − z)2
16dz
=5
6+
1
16
∫ x−3
−2
w2dw (substitute w = z − 3)
=5
6+
1
16
[w3
3
]x−3
−2
=5
6+
1
48[(x − 3)3 + 8]
= 1 +(x − 3)3
48
= 1 − (3 − x)3
48
Note that the upper limit of this distribution is P (3) = 1.
28

6. Overall, the cumulative distribution function is:
P (x) =
0 x < −3(x+3)3
48 −3 ≤ x < −112 + 9x−x3
24 −1 ≤ x < 1
1 − (3−x)3
48 1 ≤ x < 31 x ≥ 3
Exercise 5:
Consider the following weighted sum of a sequence {xk} of indepen-dent, identically distributed random variables:
zN =
N∑
k=1
ζkxk.
Show that the kurtosis κ(zN ) of this sum is related to the kurtosisκ(x) of the data sequence via:
κ(zN ) = κ(x)
∑Nk=1 ζ4
k(∑Nk=1 ζ2
k
)2
.
Solution:
1. Since kurtosis is independent of both location and scale, there is no lossof generality in assuming the variables have zero mean and unit variance,implying:
E{xi} = 0
E{x2i } = 1
E{xixj} = 0 if i 6= j, and
E{zN} = E{N∑
i=1
ζixi} =N∑
i=1
ζiE{xi} = 0
2. Thus, the desired kurtosis is:
κ(zN ) =E{(zN − E{zN})4}
[E{(zN − E{zN})2}]2 − 3 =E{z4
N}[E{z2
N}]2 − 3
3. For the denominator, we have:
E{z2N} = E
(N∑
i=1
ζixi
)2
29

= E
N∑
i=1
ζixi
N∑
j=1
ζjxj
=
N∑
i=1
N∑
j=1
ζiζjE{xixj}
=
N∑
i=1
ζ2i E{x2
i }
=N∑
i=1
ζ2i
4. For the numerator, by analogous reasoning:
E{z4N} = E
N∑
i=1
N∑
j=1
N∑
k=1
N∑
ℓ=1
ζiζjζkζℓxixjxkxℓ
=
N∑
i=1
N∑
j=1
N∑
k=1
N∑
ℓ=1
ζiζjζkζℓE{xixjxkxℓ}
5. Note that if any of the four indices i, j, k, or ℓ are distinct from all ofthe others, the expectation vanishes. Specifically, if ℓ is distinct from theother three, we have:
E{xixjxkxℓ} = E{xixjxk}E{xℓ} = 0
The same reasoning applies to the other three indices. Thus, the onlynonzero contributions are the following four cases:
i = j = k = ℓ ⇒ E{xixjxkxℓ} = E{x4i } = κ(x) + 3
i = j 6= k = ℓ ⇒ E{xixjxkxℓ} = E{x2i }E{x2
ℓ} = 1
i = k 6= j = ℓ ⇒ E{xixjxkxℓ} = E{x2i }E{x2
j} = 1
i = ℓ 6= j = k ⇒ E{xixjxkxℓ} = E{x2i }E{x2
k} = 1
6. Thus, the quadruple sum above reduces to the following terms:
E{z4N} =
N∑
i=1
ζ4i [κ(x) + 3] +
N∑
i=1
N∑
ℓ 6=i
ζ2i ζ2
ℓ +
N∑
i=1
∑
j 6=i
ζ2i ζ2
j +
N∑
i=1
∑
k 6=i
ζ2i ζ2
k
= κ(x)
N∑
i=1
ζ4i +
N∑
i=1
N∑
ℓ=1
ζ2i ζ2
ℓ +
N∑
i=1
N∑
k=1
ζ2i ζ2
k +
N∑
i=1
N∑
j=1
ζ2i ζ2
j
= κ(x)
N∑
i=1
ζ4i + 3
(N∑
i=1
ζ2i
)2
30

7. Combining these results yields:
κ(zN ) =κ(x)
∑Ni=1 ζ4
i + 3(∑N
i=1 ζ2i
)2
(∑Ni=1 ζ2
i
)2 − 3
= κ(x)
∑Ni=1 ζ4
i(∑Ni=1 ζ2
i
)2
Exercise 6:
Derive Eq. (6.25): suppose x1 and x2 are independent, exponentiallydistributed random variables with the common distribution:
p(x) =
{e−x x ≥ 0,0 x < 0,
and let y = x1 − x2. Show that y has the Laplace distribution:
φ(y) =1
2e−|y|.
Solution:
1. Write the difference y = x1 −x2 as the sum of x1 and z = −x2, which hasthe density:
g(z) =
{ez z ≤ 00 z > 0
2. Since x1 and x2 are statistically independent, so are x1 and z, and thedistribution for their sum follows from the convolution relationship:
f(y) =
∫ ∞
−∞p(z)g(y − z)dz
=
∫ ∞
0
e−zg(y − z)dz
3. Note that:
g(y − z) =
{ey−z y − z ≤ 00 otherwise
=
{eye−z z ≥ y0 otherwise
31

4. Thus, for y ≥ 0, the density for the sum is:
f(y) =
∫ ∞
y
e−zeye−zdz
= ey
∫ ∞
y
e−2zdz
= ey
[e−2z
−2
]∞
y
= ey
[0 − e−2y
−2
]
=1
2e−y
=1
2e−|y|
5. Note that if y < 0, the lower limit on the integral defining f(y) onlyextends to zero, implying:
f(y) =
∫ ∞
0
ey−2zdz
= ey
[e−2z
−2
]∞
0
=1
2ey
=1
2e−|y|
6. Note that the same expression holds for both y > 0 and y < 0, corre-sponding to the density for the Laplace distribution, as claimed.
Chapter 7
Exercise 1:
For the Laplace distribution defined by:
p(x) =1
2φe−|x−µ|/φ,
compute the normalization factor γ required so that the MADMscale estimate S = γS0 is an unbiased estimator of φ.
Solution:
32

1. By the results presented in Sec. 7.4.2, the expected value of the un-normalized MADM scale estimator S0 is:
E{S0} = F−1
(3
4
)− µ
2. For the Laplace distribution, the inverse cumulative distribution functionis given by Eq. (4.80):
F−1(q) = µ + φ ln
[1
2(1 − q)
]
3. Combining these results gives:
E{S0} = φ ln 2
Thus, the required normalization factor is:
γ =1
ln 2≃ 1.443
Exercise 2:
For Galton’s skewness measure γG discussed in Sec. 7.6.1, prove that|γG| ≤ 1 provided x0.75 6= x0.25. (Hint: define α = x0.75 − x0.25 andβ = x0.50 − x0.25. What do we know about α and β?)
Solution:
1. The Galton skewness measure is:
γG =x0.75 + x0.25 − 2x0.50
x0.75 − x0.25
2. Defining α = x0.75 − x0.25 and β = x0.50 − x0.25, note that γG can bewritten as:
γG =(x0.75 − x0.50) − (x0.50 − x0.25)
x0.75 − x0.25
=(α − β) − β
α
=α − 2β
α
= 1 − 2β
α
3. Since x0.25 ≤ x0.50 ≤ x0.75, it follows that:
0 ≤ β ≤ α
33

Further, since x0.75 6= x0.25, it follows that α > 0, which implies:
0 ≤ β
α≤ 1 ⇒ −2 ≤ −2(β/α) ≤ 0
⇒ −1 ≤ 1 − 2(β/α) ≤ 1
⇒ |γG| ≤ 1
Exercise 3:
Consider the following data sequence:
xk =
{µ k = 1, 2, . . . , N − p,λµ k = N − p + 1, . . . , N.
This sequence may be viewed as a collection of N − p nominal datapoints with value µ and p outlying data points with value λµ.
a. Suppose λ > 1 and define ǫ = p/N as the contamination level.What is the maximum contamination permitted if the error inestimating the nominal mean µ is less than 10%?
b. What is the limiting value of this contamination as λ → ∞?
c. Under what conditions will the sample median fail to give thedesired result (i.e., µ)? Do these conditions depend on λ?
Solution:
1. For part a, note that the mean of the sequence {xk} is:
x =1
N
N∑
k=1
xk =1
N
N−p∑
k=1
µ +N∑
k=N−p+1
λµ
=1
N[(N − p)µ + pλµ]
= µ − (p/N)µ + (p/N)λµ
= µ[1 − ǫ + λǫ]
= µ[1 + (λ − 1)ǫ]
2. Note that since λ > 1 and ǫ > 0, it follows that x > µ. Thus, we want toknow, for fixed λ, the largest value of ǫ such that x does not exceed 1.10µ,i.e.:
x ≤ 1.10µ ⇒ 1 + (λ − 1)ǫ ≤ 1.10
⇒ (λ − 1)ǫ ≤ 0.10
⇒ ǫ ≤ 0.1
λ − 1
34

3. For part b, note that the limiting value of ǫ as λ → ∞ is ǫ = 0. This iswhy the average is a “zero-breakdown estimator.”
4. To compute the median, note that the sample consists of N − p valuesequal to µ and p values equal to λµ > µ. Thus, the median can assumeonly the following three values:
a. x† = µ if N − p > p, implying p < N/2 and ǫ < 1/2;
b. x† = λµ if N − p < p, implying p > N/2 and ǫ > 1/2;
c. x† = µ+λµ2 = 1+λ
2 µ if N − p = p, implying p = N/2 and ǫ = 1/2.
Thus, the correct result is obtained so long as ǫ < 1/2, which is why themedian is called a “50% breakdown estimator.” Also, note that this resultdoes not depend on the magnitude of the contamination λ, in contrast tothe case of the mean considered above.
Exercise 4:
Prove that σ = 0 implies xk = xN for all k, where σ is the traditionalstandard deviation estimate and xN is the arithmetic mean of thesample.
Solution:
1. Note that the standard estimator σ is:
σ =
[1
N − 1
N∑
k=1
(xk − xN )2
]1/2
2. Thus, σ = 0 implies:
1
N − 1
N∑
k=1
(xk − xN )2 = 0 ⇒ (xk − xN )2 = 0 for all k
⇒ xk = xN for all k
Chapter 8
Exercise 1:
Show that for the negative binomial distribution, the following rela-tion holds:
kpk
pk−1= (1 − p)k + (1 − p)(r − 1).
Solution:
35

1. For the negative binomial distribution, the probability pk is given by:
pk =
(r + k − 1
r − 1
)(1 − p)kpr =
Γ(r + k)
Γ(r)Γ(k + 1)· (1 − p)kpr
2. The ratio pk/pk−1 is therefore given by:
pk
pk−1=
Γ(r + k)
Γ(r)Γ(k + 1)· Γ(r)Γ(k)
Γ(r + k − 1)· (1 − p)kpr
(1 − p)k−1pr
=Γ(r + k)
Γ(r + k − 1)· Γ(k)
Γ(k + 1)· (1 − p)
3. A defining characteristic of the gamma function is that Γ(z + 1) = zΓ(z),which implies that:
pk
pk−1=
r + k − 1
k· (1 − p)
4. Substituting this result into the ratio requested in the problem statementand rearranging yields the desired result:
kpk
pk−1= (r + k − 1)(1 − p) = (1 − p)k + (1 − p)(r − 1)
Exercise 2:
NOTE:
There is an error in Eq. (8.19), which was carried over into thisexercise. Eq. (8.20) is correct, resulting in the correct expressionfor the negative binomial count metameter. This statement of theexercise and its solution correct the error in Eq. (8.19).
Corrected statement:
The negative binomialness plot is based on the following result forthe negative binomial distribution:
ln pk = r ln p + k ln(1 − p) + lnΓ(r + k) − ln Γ(r) − ln Γ(k + 1).
Prove this result.
Solution:
1. The solution follows immediately on applying the logarithm to the expres-sion for the negative binomial probability pk given above:
pk =Γ(r + k)
Γ(r)Γ(k + 1)· (1 − p)kpr
⇒ ln pk = ln Γ(r + k) − ln Γ(r) − ln Γ(k + 1) + k ln(1 − p) + r ln p
36

Exercise 3:
Consider the box and triangle kernel density estimates discussed inSec. 8.6. For a fixed data distribution p(x), a fixed sample size N ,and a fixed bandwidth h:
a. which kernel has smaller bias?
b. which kernel has smaller variance?
Solution:
1. The bias for the different kernels is determined by the factor defined inEq. (8.51):
µ2(K) =
∫ ∞
−∞z2K(z)dz
2. For the box kernel:
K(z) =
{1 |z| ≤ 1/20 |z| > 1/2
⇒ µ2(K) =
∫ 1/2
−1/2
z2dz
=z3
3
∣∣∣∣1/2
−1/2
=1/8
3− (−1/8)
3
=1
12
3. For the triangle kernel:
K(z) =
{1 − |z| |z| ≤ 10 |z| > 1
⇒ µ2(K) =
∫ 1
−1
z2[1 − |z|]dz
= 2
∫ 1
0
z2(1 − z)dz
= 2
[z3
3− z4
4
]1
0
= 2
(1
3− 1
4
)
=1
6
37
4. Comparing the results from 2 and 3 above, the box kernel exhibits thesmaller bias, consistent with the visual appearance of the plots for thesetwo kernels shown in Figs. 8.17 through 8.20.
5. By Eq. (8.59), the variance for different estimators is proportional to:
V =
∫ ∞
−∞K2(z)dz
6. For the box kernel, this factor is:
V =
∫ 1/2
−1/2
dz = 1
while for the triangle kernel, it is:
V =
∫ 1
−1
[1 − |z|]2dz
= 2
∫ 1
0
[1 − z]2dz
= 2
∫ 1
0
[1 − 2z + z2]dz
= 2
[z − z2 +
z3
3
]1
0
=2
3
7. Thus, the triangle kernel has smaller variance, again consistent with theappearance of the plots for the box and triangle kernel results shown inFigs. (8.17) through (8.20).
Exercise 4:
Show that the Nadaraya-Watson kernel estimator does not dependon the kernel Ky(·), provided it is a symmetric, proper density func-tion; that is, derive Eq. (8.68).
Solution:
1. This estimator is obtained by substituting p(x, y) from Eq. (8.67) intoEq. (8.66):
m(x) =
∫∞−∞ yp(x, y)dy∫∞−∞ p(x, y)dy
38
2. Note that both the numerator and denominator of this expression may bewritten in the following form, for a suitable choice of the function f(y):
∫ ∞
−∞f(y)p(x, y)dy =
∫ ∞
−∞f(y)
[1
Nhxhy
N∑
k=1
Kx
(x − xk
hx
)Ky
(y − yk
hy
)]dy
=1
Nhx
N∑
k=1
Kx
(x − xk
hx
)∫ ∞
−∞f(y)Ky
(y − yk
hy
)dy
hy
3. For the denominator, the corresponding function is f(y) = 1 and theresulting integral over y simply yields Eq. (8.46):
∫ ∞
−∞K
(y − yk
hy
)dy
hy= 1
Thus, the denominator of m(x) is:
D(x) =1
Nhx
N∑
k=1
Kx
(x − xk
hx
)
4. The numerator corresponds to f(y) = y, and the integral over y becomes:∫ ∞
−∞yK
(y − yk
hy
)dy
hy= yk
Thus, the numerator of m(x) is:
N(x) =1
Nhx
N∑
k=1
ykKx
(x − xk
hx
)
5. Combining these results yields Eq. (8.68):
m(x) =N(x)
D(x)=
∑Nk=1 ykKx
(x−xk
hx
)
∑Nk=1 Kx
(x−xk
hx
)
Chapter 9
Exercise 1:
It was noted in Sec. 9.4.4 that the Yuen-Welch test is a generalizationof the Welch test of the hypothesis that two means are equal in thecase where the variances are both unknown and unequal, obtained byreplacing ordinary means with trimmed means. The original Welchmethod computes the same test statistic as the standard t-test, butevaluates it relative to a t-distribution with a modified number ofdegrees of freedom ν. From the results given for the Yuen-Welchtest, derive an expression for ν for the classical Welch test.
39

Solution:
1. The degrees of freedom for the Yuen-Welch test is given by:
ν =(d2
x + d2y)2
d2x
nx−1 +d2
y
n−y−1
where dx =(nx − 1)s2
Wx
(nx − 2gx)(nx − 2gx − 1)
with dy defined analogously.
2. The classical Welch test corresponds to the case of no trimming, implyinggx = 0 and s2
Wx = s2x, the classical variance estimator. In this case:
dx = s2x/nx and dy = s2
y/ny
Note: there is an error in the text on page 404, where dx is incorrectlygiven as s2
x/(nx − 1).
3. Substituting the (correct) un-trimmed result into the Yuen-Welch degreesof freedom expression yields the classical Welch test degrees of freedom:
ν =
(s2
x
nx+
s2
y
ny
)2
s4x
n2x(nx−1) +
s4y
n2y(ny−1)
Exercise 2:
Prove that the Benjamani-Hochberg FDR control procedure can beexpressed as a sequence of tests of hypotheses at a constant targetlevel α using the modified individual rank-ordered p-values definedin Eq. (9.81):
p(m) = p(m),
p(i) = min{
p(i+1),m
ip(i)
}for i = m − 1,m − 2, . . . , 1.
Solution:
1. Note that the definition of the modified probabilities p(i) implies threethings:
(1) p(i) = min{p(i+1),m
ip(i)} ≤ p(i+1)
(2) p(i) ≥ α ⇒ m
ip(i) ≥ p(i) ≥ α
⇒ p(i) ≥ iα
m
(3) p(i) < α ≤ p(i+1) ⇒ p(i) =m
ip(i) < α
⇒ p(i) <iα
m
40

2. From (1), it follows that if p(m) < α, then p(i) < α for i = 1, 2, . . . ,m,and the modified procedure rejects all m null hypotheses. Conversely,if p(m−1) < α ≤ p(m), it follows from (2) that p(m) ≥ α, and from (3)that p(m−1) < (m − 1)α/m. Hence, the modified procedure accepts thenull hypothesis H(m) but rejects null hypotheses 1 through m − 1. Notethat these results correspond exactly to Step m of the original Benjamani-Hochberg procedure.
3. More generally, if p(j) < α for some j, the condition also holds for alli = 1, 2, . . . , j − 1 and the results correspond to Step j of the originalprocedure.
4. Finally, note that if p(1) ≥ α, it follows from (1) that p(i) ≥ α for all i,and from (2) that p(1) ≥ α/m. Hence, all m null hypotheses are acceptedunder exactly the same conditions as in Step 1 of the original procedure.
Exercise 3:
The Holm stepdown procedure for controlling FWER in multiplecomparison problems can also be written in terms of modified rankedp-values, like those given in Eq. (9.81) for the Benjamani-Hochbergprocedure. Derive these modified p-values.
Solution:
1. As with the Benjamani-Hochberg procedure, the form of the modifiedHolm stepdown procedure is to first define:
p(m) = p(m)
p(i) = min{p(i+1), γ(i)p(i)}, for i = 1, 2, . . . ,m − 1
This structure leads to the following three conditions, analogous to thosefor the modified Benjamani-Hochberg procedure:
(1′) p(i) = min{p(i+1), γ(i)p(i)} ≤ p(i+1)
(2′) p(i) ≥ α ⇒ γ(i)p(i) ≥ p(i) ≥ α
⇒ p(i) ≥ α/γ(i)
(3′) p(i) < α ≤ p(i+1) ⇒ p(i) = γ(i)p(i) < α
⇒ p(i) < α/γ(i)
2. Since the general structure of the Holm stepdown procedure is identicalto that of the Benjamani-Hochberg procedure, the key to obtaining themodified Holm procedure of interest here is to choose the function γ(i)to yield the test conditions of the original Holm procedure. Since thethreshold at Step i in the Holm procedure is α/(m+1−i), this requirementyields γ(i) = m + 1 − i.
41

3. Thus, the modified Holm stepdown procedure tests each null hypothesisusing the following modified ranked p-values:
p(m) = p(m)
p(i) = min{p(i+1), (m + 1 − i)p(i)}
Chapter 10
Exercise 1:
Using the transformation defined by Eq. (10.53), show that E{x} =µ for the multivariate normal random vector with the distributionN(µ,Σ).
Solution:
1. Using the representation (10.53), we have:
E{x} = E{µ + Uv}= µ + E{Uv}= µ + UE{v}= µ
This last result follows from the fact that v is the N -vector defined inEq. (10.54) with statistically independent, zero-mean components.
Exercise 2:
Again using the transformation defined by Eq. (10.53), show thatthe covariance of x is given by Eq. (10.55):
cov x ≡ E{(x − µ)(x − µ)T } = Σ.
Solution:
1. Again by Eq. (10.53), the covariance is:
E{(x − µ)(x − µ)T } = E{Uv(Uv)T }= E{UvvT UT }= UE{vvT }UT
2. Since v has N statistically independent components, each with varianceσ2
i , E{vvT } = D, the diagonal matrix defined in Eq. (10.52). Thus,E{(x − µ)(x − µ)T } = UDUT = Σ, as claimed.
Exercise 3:
42

Once more using this transformation, show that if x ∼ N(µ,Σ), thenAx + b is normally distributed with mean Aµ + b and covarianceAT ΣA.
Solution:
1. First, note that by Eq. (10.53):
Ax + b = A[µ + Uv] + b
= Aµ + b + AUv
2. Taking the expectation of this result yields:
E{Ax + b} = Aµ + b + E{AUv}= Aµ + b + AUE{v}= Aµ + b
3. The covariance matrix C is given by:
C = E{(Ax + b − [Aµ + b])(Ax + b − [Aµ + b])T }= E{(Ax − Aµ)(Ax − Aµ)T }= E{A(x − µ)(x − µ)T AT }= AE{(x − µ)(x − µ)T }AT
= AΣAT
4. Since Ax + b is a linear combination of the jointly Gaussian componentsof x, it follows that this combination is also Gaussian and thus completelyspecified by the mean and covariance given here.
Exercise 4:
Consider the Laplace distribution with mean 0 and scale parameterφ, defined by the density:
p(x) =e−|x|/φ
2φ.
Further, consider the truncated version of this distribution, restrictedto the interval −L ≤ x ≤ L.
a. Derive an expression for the truncated density p(x| − L ≤ x ≤L).
b. Show that all odd moments of this distribution vanish.
c. Derive an expression for the variance of this distribution, as afunction of the truncation limit L.
43

d. Derive an expression for the kurtosis κ(L). Is this distributionplatykurtic, leptokurtic, or mesokurtic?
Solution:
1. The general form for a truncated distribution is given by Eq. (10.31) as:
p(x| − L ≤ x ≤ L) =p(x)
F (L) − F (−L)
2. For the Laplace distribution, it follows from Eq. (4.79) that:
F (L) = 1 − 1
2e−L/φ
F (−L) =1
2e−L/φ
Thus, the denominator in the above expression is:
F (L) − F (−L) = 1 − e−L/φ
The truncated Laplace density is therefore given explicitly by:
p(x| − L ≤ x ≤ L) =e−|x|/φ
2φ(1 − e−L/φ)
3. Since the truncated distribution is symmetric, it follows from the dis-cussion on page 147 that all odd-order moments—including the mean—vanish.
4. Since the distribution has mean zero, the variance is simply equal to thesecond moment:
σ2 =
∫ L
−L
x2p(x| − L ≤ x ≤ L)dx
=1
2φ(1 − e−L/φ)
∫ L
−L
x2e−|x|/φdx
=1
φ(1 − e−L/φ)
∫ L
0
x2e−x/φdx
=1
1 − e−L/φ
∫ L/φ
0
(φz)2e−zdz (substituting z = x/φ)
=φ2
1 − e−c
∫ c
0
z2e−zdz (defining c = L/φ)
5. From Gradshteyn and Ryzhik [122], integral 2.322, no. 2:∫ c
0
z2e−zdz =[e−z(−z2 − 2z − 2)
]c0
= [−e−c(c2 + 2c + 2) − (−2)]
= 2 − e−c[2 + 2c + c2]
44

6. Thus, combining these results yields:
σ2 ={2 − e−c[2 + 2c + c2]}φ2
1 − e−c
Note that as L → ∞ we also have c → ∞ and σ2 → 2φ2, correspondingto the correct limiting value for the un-truncated Laplace distribution.
7. Again since the distribution is zero-mean, the kurtosis is:
κ =E{x4}
[E{x2}]2 − 3
In terms of the truncation parameter c, the fourth moment is:
E{x4} =1
2φ(1 − e−c)
∫ L
−L
x4e−|x|/φdx
=1
2(1 − e−c)
∫ c
−c
(φz)4e−|z|dz (substitute z = x/φ)
=φ4
2(1 − e−c)
∫ c
−c
z4e−|z|dz
=φ4
(1 − e−c)
∫ c
0
z4e−zdz
8. From integral 2.321, no. 2 in Gradshteyn and Rhyzhik [122]:
∫xneaxdz = eax
(x4
a+
n∑
k=1
(−1)k n(n − 1) · · · (n − k + 1)
ak+1xn−k
)
For n = 4, this result specializes to:∫
x4eaxdx = eax
(x4
a− 4x3
a2+
12x2
a3− 24x
a4+
24
a5
)
9. The desired fourth moment is thus:
E{x4} =
(φ4
1 − e−c
)[e−z(−z4 − 4z3 − 12z2 − 24z − 24)
]c0
=φ4
1 − e−c[−e−c(c4 + 4c3 + 12c2 + 24c + 24) + 24]
=φ4[24 − (24 + 24c + 12c2 + 4c3 + c4)e−c]
1 − e−c
Combining this with the variance result given above, the kurtosis is:
κ =E{x4}
[E{x2}]2 − 3
=φ4[24 − (24 + 24c + 12c2 + 4c3 + c4)e−c]
1 − e−c· (1 − e−c)2
φ4[2 − (2 + 2c + c2)e−c]2− 3
=(1 − e−c)[24 − (24 + 24c + 12c2 + 4c3 + c4)e−c]
[2 − (2 + 2c + c2)e−c]2− 3
45

0 2 4 6 8 10
−2
−1
01
23
Truncation parameter, c
Kur
tosi
s
Figure 2: Plot of the kurtosis of the truncated Laplace distribution versus thetruncation parameter c = L/φ.
10. This expression is messy enough to yield little insight by itself, but notethat as c → ∞, we should recover the un-truncated result. Note that inthis limit e−c → 0 rapidly enough that cne−c → 0 for all finite n. Thus:
c → ∞ ⇒ κ → 24
22− 3 = 6 − 3 = 3
which is the correct limiting kurtosis for the un-truncated Laplace distri-bution. It can also be shown by a limiting argument that κ → −6/5 (theuniform distribution limit) as c → 0. It is, however, more informativeto plot κ over a reasonable range of c values to see the general behavior,which can be platykurtic, mesokurtic, or leptokurtic, depending on theparticular value of c. This plot is shown in Fig. 2.
46

Exercise 5—NOTE: there is an error in the original problem
statement, which has been corrected here
For the bivariate Gaussian distribution defined by Eq. (10.65), showthat E{(x − x)(y − y)} = ρσxσy.
Solution:
1. To simplify subsequent algebra, first define the following quantities:
A = 1 − ρ2
u =x − x
σx⇒ x = x + σxu
v =y − y
σy⇒ y = y + σyv
2. The required expectation is:
E{(x − x)(y − y)} =
∫ ∞
−∞
∫ ∞
−∞(x − x)(y − y)p(x, y)dxdy
where p(x, y) is defined in Eq. (10.65):
p(x, y) =1
2πσxσy
√1 − ρ2
exp
{− 1
2(1 − ρ2)
[(x − x)2
σ2x
− 2ρ(x − x)(y − y)
σxσy+
(y − y)2
σ2y
]}
=1
2πσxσy
√A
exp
{−u2 − 2ρuv + v2
2A
}
3. Thus, the expectation may be written as:
E{(x − x)(y − y)} =1
2πσxσy
√A
∫ ∞
−∞
∫ ∞
−∞σxuσyv exp
{−u2 − 2ρuv + v2
2A
}σxduσxdv
=σxσy
2π√
A
∫ ∞
−∞
∫ ∞
−∞uv exp
{−u2 − 2ρuv + v2
2A
}dudv
4. For simplicity, denote the expectation incorporating this integral by I andnote that:
u2 − 2ρuv + v2 = u2 − 2ρuv + ρ2v2 + (1 − ρ2)v2
= (u − ρv)2 + Av2
Thus, the expectation becomes:
I =σxσy
2π√
A
∫ ∞
−∞
∫ ∞
−∞uv exp
{− (u − ρv)2 + Av2
2A
}dudv
=σxσy
2π√
A
∫ ∞
−∞
∫ ∞
−∞uv exp
{− (u − ρv)2
2A
}exp
{−v2
2
}dudv
47

Define w = u − ρv so that u = w + ρv and rewrite the integral as:
I =σxσy
2π√
A
∫ ∞
−∞
∫ ∞
−∞(w + ρv)e−w2/2Ae−v2/2dwdv
=σxσy
2π√
A
[∫ ∞
−∞
∫ ∞
−∞wve−w2/2Ae−v2/2dwdv
+ρ
∫ ∞
−∞
∫ ∞
−∞v2e−w2/2Ae−v2/2dwdv
]
=σxσy
2π√
A
[∫ ∞
−∞we−w2/2Adw
∫ ∞
−∞ve−v2/2dv
+ ρ
∫ ∞
−∞e−w2/2Adw
∫ ∞
−∞v2e−v2/2dv
]
5. Note that the first pair of integrals both vanish, corresponding to theexpressions for the means of the zero-mean Gaussian random variables wand v. Thus, the expectation reduces to:
I =ρσxσy
2π√
A
∫ ∞
−∞e−w2/2Adw
∫ ∞
−∞v2e−v2/2dv
= ρσxσy
[1√2πA
∫ ∞
−∞e−w2/2Adw
] [1√2π
∫ ∞
−∞v2e−v2/2dv
]
Note that the first term in brackets is the normalization integral for w,equal to 1, while the second integral is the variance of v, which is alsoequal to 1. Thus, we have the final result:
E{(x − x)(y − y)} = ρσxσy
Exercise 6:
In what follows, suppose P is any N × N permutation matrix.
a. Define e = [1, 1, . . . , 1]T ∈ RN and show that Pe = e.
b. Define E as the N × N matrix, all of whose elements are 1.Show that PE = E and EPT = E.
c. Consider the N -dimensional random vector x ∼ N(µ,Σ) where:
µ = [x, x, . . . , x]T
Σ =
σ2 ρσ2 · · · ρσ2
ρσ2 σ2 · · · ρσ2
......
......
ρσ2 ρσ2 · · · σ2
.
Show that Px ∼ N(µ,Σ), implying that the components of x
are exchangeable, even though they are not independent unlessρ = 0.
48

Solution:
1. A permutation matrix is an N ×N matrix with one element equal to 1 ineach row and each column, with all other elements equal to zero. Thus,if P is a permutation matrix and e = [1, 1, . . . , 1]T , the ith element of theproduct Pe is:
[Pe]i =N∑
j=1
Pijej =N∑
j=1
Pij = 1
for i = 1, 2, . . . , N . Thus, it follows that Pe = e.
2. If E is the N × N matrix with all 1’s, it follows that:
[PE]ij =
N∑
k=1
PikEkj =
N∑
k=1
Pik = 1
for i, j = 1, 2, . . . , N . Thus, it follows that PE = E. Similarly:
[EPT ]ij =
N∑
k=1
EikPTkj =
N∑
k=1
EikPjk =
N∑
k=1
Pjk = 1
for i, j = 1, 2, . . . , N , implying EPT = E.
3. If x ∼ N(µ,Σ) and P is a permutation matrix, it follows from Eq. (10.56)that Px ∼ N(Pµ,PT ΣP). Here:
µ = [x, x, . . . , x]T = xe
⇒ Pµ = xPe = xe = µ
4. For the covariance result, note that Σ may be written as:
Σ =
ρσ2 ρσ2 · · · ρσ2
......
......
ρσ2 ρσ2 · · · ρσ2
−
(ρ − 1)σ2 0 · · · 0...
......
...0 0 · · · (ρ − 1)σ2
= ρσ2E − (ρ − 1)σ2I
Thus, the transformed covariance matrix is:
PT ΣP = PT [ρσ2E − (ρ − 1)σ2I]P
= ρσ2PT EP − (ρ − 1)σ2PT IP
For any permutation matrix P, the transpose PT is also a permutationmatrix and corresponds to the inverse of P. These results imply that:
PT EP = EP = E
PT IP = PT P = I
49

Combining these results yields:
PT ΣP = ρσ2E − (ρ − 1)σ2I = Σ
Thus, it follows that Px ∼ N(µ,Σ) for any permutation matrix P.
Exercise 7:
Let Rx(i) denote the ranks for the N elements of a data sequence{xk}.
a. Show that the average of the sequence {Rx(i)} is (N + 1)/2.
b. Show that the variance of this sequence is (N2 − 1)/12.
Solution:
1. The ranks Rx(i) for the N element sequence {xk} consist of the numbersfrom 1 to N in some specified order. Thus:
R =1
N
N∑
i=1
Rx(i) =1
N
N∑
j=1
j =1
N
(N(N + 1)
2
)=
N + 1
2
2. The variance is most easily computed as:
var{Rx(i)} = E{Rx(i)2} − R2
The first of these expectations is:
E{Rx(i)2} =1
N
N∑
i=1
Rx(i)2 =1
N
N∑
j=1
j2 =1
N
(N(N + 1)(2N + 1)
6
)=
N(2N + 1)
6
Thus, the variance is given by:
var{Rx(i)} =(N + 1)(2N + 1)
6− (N + 1)2
4
=
(N + 1
2
)[2N + 1
3− N + 1
2
]
=
(N + 1
2
)[4N + 2 − 3N − 3
6
]
=
(N + 1
2
)[N − 1
6
]
=N2 − 1
12
Exercise 8:
50

Show that the ranks Rx(i) for a data sequence are invariant underarbitrary increasing transformations. That is, if yk = f(xk) for anyincreasing function f(·), then Ry(i) = Rx(i).
Solution:
1. The ranks Rx(i) are the integers from 1 through N that define the positionof each individual element xk in the re-ordered sequence:
x(1) ≤ x(2) ≤ · · · ≤ x(N)
That is, if xk = x(j), then Rx(k) = j. Now, suppose yk = f(xk) wheref(·) is an increasing function. This means that:
xk ≤ xℓ ⇒ yk = f(xk) ≤ f(xℓ) = yℓ
Thus, the order in the transformed sequence:
y(1) ≤ y(2) ≤ · · · ≤ y(N)
is the same for {yk} as it is for the original sequence {xk}. Thus:
Rx(k) = j ⇒ xk = x(j) ⇒ yk = y(j) ⇒ Ry(k) = j
Exercise 9:
Consider the Spearman rank correlation coefficient ρS between twosequences {xk} and {yk} introduced in Sec. 10.5.
• Show that ρS = +1 if and only if yk = f(xk) for some increasingfunction f(·).
• Show that ρS = −1 if and only if yk = f(xk) for some decreas-ing function f(·).
(Hint: remember that Rx(i) and Ry(i) must assume every valuebetween 1 and N once and only once. Also, note Exercise 8.)
Solution:
1. The Spearman rank correlation ρS is the product-moment correlation co-efficient between the ranks Rx(i) and Ry(i). Thus, ρS = +1 if and onlyif:
Ry(i) = aRx(i) + b
for some a > 0. Since Rx(i) and Ry(i) each take on all of the integervalues between 1 and N , this condition can only be met for a = 1 andb = 0, implying that Rx(i) = Ry(i) for all i. In other words, ρS = +1 ifand only if the ranks of {xk} and {yk} are identical, implying that thesesequences are related by an increasing transformation.
51

2. Similarly, ρS = −1 implies Ry(i) = aRx(i) + b for some a < 0. This isonly possible for a = −1 and b = N + 1, giving:
Ry(i) = N + 1 − Rx(i)
Note that this linear transformation reverses the rank order, requiringthat x(1) be mapped into y(N), that x(2) be mapped into y(N−1), and soforth. This implies that these two sequences are related via a decreasingtransformation f(·) such that:
xi < yj ⇒ yi = f(xi) > f(xj) = yj
Exercise 10:
Show that the variance of the the mixture density defined by Eq. (10.105)is given by Eq. (10.110). Hint: recall that var{x} = E{x2}−[E{x}]2.
Solution:
1. Consider the mixture density defined in Eq. (10.105):
p(x) =
p∑
j=1
πjfj(x)
As noted in the hint, the variance of this distribution can be written interms of the non-central first and second moments as:
var{x} = E{x2} − [E{x}]2
These moments are given by:
E{x} =
p∑
j=1
πjE{xj} =
p∑
j=1
πj xj
E{x2} =
p∑
j=1
πjE{x2j} =
p∑
j=1
πj [x2j + σ2
j ]
2. The square of the first moment may be written as:
[E{x}]2 =
p∑
j=1
πj xj
2
=
N∑
j=1
N∑
k=1
πjπkxj xk
Combining these results yields Eq. (10.110):
var{x} =
p∑
j=1
πjσ2j +
p∑
j=1
πj x2j −
p∑
j=1
p∑
k=1
πjπkxj xk
=
p∑
j=1
πjσ2j +
p∑
j=1
πj xj
[xj −
p∑
k=1
πkxk
]
52

Exercise 11:
Show that the following expressions are equivalent, provided thecoefficients πj are nonnegative and sum to 1:
p∑
j=1
πjzj
[zj −
p∑
k=1
πkzk
]=
1
2
p∑
j=1
p∑
k=1
πjπk(zj − zk)2 ≥ 0.
Further, show that this lower bound is achievable if and only ifzj = zk for all 1 ≤ j, k ≤ p.
Solution:
1. First, note that since the coefficients πi sum to 1, we have:
S =
p∑
j=1
πjzj
[zj −
p∑
k=1
πkzk
]=
p∑
j=1
πjzj
[zj
p∑
k=1
πk −p∑
k=1
πkzk
]
=
p∑
j=1
πjzj
[p∑
k=1
πk(zj − zk)
]
=
p∑
j=1
p∑
k=1
πjπkzj(zj − zk)
2. Note that:
zj(zj − zk) = [(zj − zk) + zk](zj − zk)
= (zj − zk)2 + zk(zj − zk)
Thus, we have:
S =
p∑
j=1
p∑
k=1
πjπk[(zj − zk)2 + zk(zj − zk)]
=
p∑
j=1
p∑
k=1
πjπk(zj − zk)2 +
p∑
j=1
p∑
k=1
πjπkzk(zj − zk)
=
p∑
j=1
p∑
k=1
πjπk(zj − zk)2 −p∑
j=1
p∑
k=1
πjπkzk(zk − zj)
=
p∑
j=1
p∑
k=1
πjπk(zj − zk)2 − S
⇒ 2S =
p∑
j=1
p∑
k=1
πjπk(zj − zk)2
⇒ S =1
2
p∑
j=1
p∑
k=1
πjπk(zj − zk)2
53

3. Since all of the terms in this double sum are nonnegative, the lower boundof zero is achievable if and only if each term is separately zero, implyingzj = zk for all 1 ≤ j, k ≤ p.
Exercise 12:
Show that, if all component densities fj(x) in the mixture densitydefined by Eq. (10.109) are zero-mean and symmetric, the kurtosisκ(x) for the mixture density is given by Eq. (10.112).
Solution:
1. If all component densities are symmetric about zero, it follows that xj = 0for all j and the variance expression reduces to:
var{x} = E{x2} =
p∑
j=1
πjσ2j
2. Similarly, the fourth moment expression becomes:
E{x4} =
p∑
j=1
πjE{x4j}
=
p∑
j=1
πj [(κj + 3)σ4j ]
=
p∑
j=1
πjκjσ4 + 3
p∑
j=1
πjσ4j
where κj is the kurtosis of component j.
2. Combining these results, it follows that the kurtosis for the mixture dis-tribution is given by Eq. (10.112):
κ(x) =E{x4}
[E{x2}]2 − 3
=E{x4} − 3[E{x2}]2
[E{x2}]2
=
p∑
j=1
πjσ2j
−2
p∑
j=1
πjκjσ4j + 3
p∑
j=1
πjσ4j − 3
p∑
j=1
πjσ2j
p∑
k=1
πkσ2k
=
p∑
j=1
πjσ2j
−2
p∑
j=1
πjκjσ4j + 3
p∑
j=1
πjσ2j
[σ2
j −p∑
k=1
πkσ2k
]
Exercise 13:
54

Show that, if all component densities fj(x) in the mixture densitydefined by Eq. (10.109) have the same mean, xj = x0, the centralmoments µn of the mixture density depend only on the central mo-ments µn
j of the component densities.
Solution:
1. If all component densities have mean x0, it follows from Eq. (10.109) that:
E{x} =
p∑
j=1
πj x0 = x0
p∑
j=1
πj = x0
Thus, we can consider the zero-mean deviation variable z = x− x0, notingthat its density is given by:
p(z) =
p∑
j=1
πjφj(z)
where φj(z) is the density for the component deviation variable zj =xj − x0.
2. The advantage of this representation is that the central moments of x arethe moments of z, i.e.:
E{(x − x0)n} = E{zn} =
p∑
j=1
πjE{znj }
by Eq. (10.108). Note that E{znj } is simply the nth central moment of the
original component variable xj .
Exercise 14:
Show that the kurtosis κ(x) for the p-component zero-mean, Gaus-sian mixture density is given by the result presented in Eq. (10.121).Also, show that κ(x) ≥ 0 with κ(x) = 0 if and only if σ1 = σ2 =· · · = σp.
Solution:
1. From Eq. (10.112) for the general symmetric, zero-mean case with κj = 0for all j, we have Eq. (10.121) from the results of Exercise 11:
κ(x) =
p∑
j=1
πjσ2j
−23
p∑
j=1
πjσ2j
[σ2
j −p∑
k=1
πkσ2k
]
=
p∑
j=1
πjσ2j
p∑
k=1
πkσ2k
−1
3
2
p∑
j=1
p∑
k=1
πjπk(σ2j − σ2
k)2
=3
2
(∑pj=1
∑pk=1 πjπk(σ2
j − σ2k)2∑p
j=1
∑pk=1 πjπkσ2
j σ2k
)
55

2. Since πj ≥ 0 and σ2j ≥ 0 for all j¡ it follows that κ(x) ≥ 0 for cases.
Further, note that to achieve the lower bound κ(x) = 0, it is necessarythat all terms σ2
j − σ2k vanish, implying that σj = σk for all j and k.
Exercise 15:
Derive Eq. (10.122) for the first three moments of the slippage model.Next, suppose µ = λσ and derive a simplified expression for theskewness that does not depend on σ. Finally, derive an approximateexpression for the skewness in the limit as λ → ∞.
Solution:
1. The slippage model has the distribution:
p(x) = (1 − ǫ)φ(x; 0, σ2) + ǫφ(x;µ, σ2)
where φ(x;µ, σ2) represents the Gaussian density with mean µ and vari-ance σ2. The mean of the slippage model is therefore:
E{x} = (1 − ǫ) · 0 + ǫ · µ = ǫµ
2. The variance is most easily obtained as:
var{x} = E{x2} − [E{x}]2
In this case, the second moment is:
E{x2} = (1 − ǫ)σ2 + ǫ[σ2 + µ2]
= σ2 + ǫµ2
⇒ var{x} = σ2 + ǫµ2 − ǫ2µ2
= σ2 + ǫ(1 − ǫ)µ2
3. Note: there is an error in the skewness result given in Eq. (10.122). Thesolution presented here derives the correct result.
4. The skewness is given by:
γ(x) =E{(x − x)3}
[E{(x − x)2}]3/2
To compute the numerator, note that:
E{(x − x)3} = E{x3 − 3x2x + 3xx2 − x3}= E{x3} − 3xE{x2} + 3x2E{x} − x3
= E{x3} − 3x[σ2x + x2] − 3x3 + 3x3 − x3
= E{x3} − 3xσ2x − x3
= E{x3} − 3ǫµ[σ2 + ǫ(1 − ǫ)µ2] − ǫ3µ3
56

5. From Eq. (10.116) for the general two-component Gaussian mixture model,note that the slippage model corresponds to α = ǫ, µ1 = µ, µ2 = 0, andσ1 = σ2 = σ. Thus:
E{x3} = µ2(µ22 + 3σ2
2) + 3α(µ1σ21 − µ2σ
22) + α(µ3
1 − µ32)
= 3ǫµσ2 + ǫµ3
6. Combining these results yields:
E{(x − x)3} = 3ǫµσ2 + ǫµ3 − 3ǫµσ2 − 3ǫ2(1 − ǫ)µ3 − ǫ3µ3
= ǫµ3[1 − 3ǫ(1 − ǫ) − ǫ2]
= ǫµ3[1 − 3ǫ + 3ǫ2 − ǫ2]
= ǫµ3[1 − 3ǫ + 2ǫ2]
= ǫ(1 − ǫ)(1 − 2ǫ)µ3
7. Thus, the corrected skewness result is:
γ(x) =ǫ(1 − ǫ)(1 − 2ǫ)µ3
[σ2 + ǫ(1 − ǫ)µ2]3/2
Note that if ǫ = 0 or µ = 0, the slippage model reduces to the uncon-taminated Gaussian distribution N(0, σ2) and γ(x) vanishes, as it should.Also, note that for 0 < ǫ < 1/2, the skewness has the same sign as µ,indicating that the slippage model is skewed in the direction of the con-tamination µ. For ǫ = 1/2, the distribution is bimodal and symmetric,implying zero skewness. For 1/2 < ǫ < 1, the roles of the “normal” and“contaminating” terms reverses and so does the sign of the skewness. Forǫ = 1, the model reduces to N(µ, σ2) and the skewness again vanishes.
Exercise 16:
Suppose r = x/y where the distribution of x is arbitrary and yis normally distributed. If x and y are independent, show that rdoes not have a finite second moment. (Hint: note that E{r2} =E{x2y−2}.)
Solution:
1. From the hint, note that:
E{r2} = E{x2y−2} = E{x2}E{y−2} = (σ2x + µ2
x)E{y−2}
2. To evaluate E{y−2}, define z = 1/y and note that E{y−2} is the secondmoment of the transformed variable z. A detailed discussion of the non-existence of the moments of the reciprocal Gaussian distribution exhibitedby z is given in Section 12.7.1.
57

Exercise 17:
Derive Eq. (10.128) for the variance of x in terms of its conditionalmean and conditional variance:
var{x} = E{var{x|θ}} + var{E{x|θ}}.
Solution:
1. First, note that:
var{x|θ} = E{[x − E{x|θ}]2|θ}= E{x2 − 2xE{x|θ} + [E{x|θ}]2|θ}= E{x2|θ} − 2E{x|θ}E{x|θ} + [E{x|θ}]2
= E{x2|θ} − [E{x|θ}]2
2. The first term on the right-hand side of the variance expression given inthe problem statement is:
Eθ{var{x|θ}} = E{x2} − Eθ{[E{x|θ}]2} (by Eq. (10.47)
3. The second term on the right-hand side of the variance expression is:
varθ{E{x|θ}} = Eθ{(E{x|θ} − Eθ{E{x|θ}})2}= Eθ{(E{x|θ} − E{x})2} (again by Eq. (10.47))
= Eθ{[E{x|θ}]2 − 2E{x|θ}E{x} + [E{x}]2}= Eθ{[E{x|θ}]2} − 2E{x}Eθ{E{x|θ}} + [E{x}]2
= Eθ{[E{x|θ}]2} − 2[E{x}]2 + [E{x}]2
= Eθ{[E{x|θ}]2} − [E{x}]2
4. Combining these results yields:
Eθ{var{x|θ}} + varθ{E{x|θ}} = E{x2} − Eθ{[E{x|θ}]2} + Eθ{[E{x|θ}]2} − [E{x}]2
= E{x2} − [E{x}]2
= var{x}
Chapter 11
Exercise 1:
Show that the restricted solution θRW of the weighted least squaresproblem discussed in Sec. 11.3.2 satisfies the constraint CθRW = h.
Solution:
58

1. The expression for θRW is given in Eq. (11.35):
θRW = θ + (XT WX)−1CT [C(XT WX)−1CT ]−1(h − Cθ)
where θ is the unconstrained weighted least square estimator of θ.
2. By direct computation:
CθRW = Cθ + C(XT WX)−1CT [C(XT WX)−1CT ]−1(h − Cθ)
= Cθ + h − Cθ
= h
Exercise 2—Note: the equation numbers listed in the original
problem statement are not correct; the numbers given here have
been corrected.
Show that the condition (11.41) for the M-estimator θ discussed inSec. 11.4.2 is equivalent to the condition (11.42).
Solution:
1. Note that the matrices X and W and the vector r are defined as:
X =
φ1(x1) φ2(x1) · · · φp(x1)φ1(x2) φ2(x2) · · · φp(x2)
......
......
φ1(xN ) φ2(xN ) · · · φp(xN )
(Eq. (11.11)
W =
w1 0 · · · 00 w2 · · · 0...
......
...0 0 · · · wN
r =
r1
r2
...rN
2. Combining these results yields:
Wr =
w1r1
w2r2
...wNrN
⇒ XT Wr =
φ1(x1) φ1(x2) · · · φ1(xN )φ2(x1) φ2(x2) · · · φ2(xN )
......
......
φp(x1) φp(x2) · · · φp(xN )
w1r1
w2r2
...wNrN
59

=
∑Nk=1 φ1(xk)wkrk∑Nk=1 φ2(xk)wkrk
...∑Nk=1 φp(xk)wkrk
3. It follows from this result that the ith component of the vector equationXT WR = 0 corresponds to the corresponding element of Eq. (11.41).
Chapter 12
Exercise 1—NOTE: this problem is poorly formulated as stated.
This solution is for a corrected version.
Using the same format as the 25 pig transforms considered in Sec. 12.1.1,generate the corresponding 25 plots for the following circle:
(x − 0.5)2 + (y − 0.5)2 = 0.42
Solution:
1. The original formulation of this problem is inappropriate because both thex and y values in the original problem statement can be non-positive, whilethe square root and log transformations are only appropriate to positivevalues. The reformulation given here restricts both x and y to the interval[0.1, 0.9]; over this range, all five of the transformations considered arewell-behaved.
2. Unfortunately, R does not generate useable plots in a 5 × 5 array, so therequested plots must be displayed in a different format. Here, all of therequired plots are displayed in the sequence of four 3 × 3 plots shown inFigs. 3 through 6.
Exercise 2:
A model that arises frequently is the thremally activated model:
x(T ) = x0e−E/kT ,
where x0 and E are parameters to be detrmined from measurementsof the observed response x(T ) vs. the absolute temperature T andk is Boltzmann’s constant. Derive a linearizing transformation forthis model.
Solution:
60

0.3 0.5 0.7 0.9
0.3
0.6
0.9
Square Root
Squ
are
Roo
t
0.2 0.4 0.6 0.8
0.3
0.6
0.9
Linear
Squ
are
Roo
t0.0 0.2 0.4 0.6 0.8
0.3
0.6
0.9
Square
Squ
are
Roo
t0.3 0.5 0.7 0.9
0.2
0.6
Square Root
Line
ar
0.2 0.4 0.6 0.8
0.2
0.6
Linear
Line
ar
0.0 0.2 0.4 0.6 0.8
0.2
0.6
Square
Line
ar
0.3 0.5 0.7 0.9
0.0
0.4
0.8
Square Root
Squ
are
0.2 0.4 0.6 0.8
0.0
0.4
0.8
Linear
Squ
are
0.0 0.2 0.4 0.6 0.8
0.0
0.4
0.8
Square
Squ
are
Figure 3: Plots of circles transformed by square root, linear, and square trans-formations applied to both the x and y axes.
1. Taking the logarithm of x(T ) yields:
lnx(T ) = lnx0 −E
kT
2. To linearize this equation, define:
y = lnx
s = 1/T
⇒ y = a + bs
where a = lnx0 and b = −E/k.
Exercise 3:
61

−2.0 −1.0
−2.
0−
1.0
Logarithm
Loga
rithm
0.2 0.4 0.6 0.8
−2.
0−
1.0
Linear
Loga
rithm
1.2 1.6 2.0 2.4
−2.
0−
1.0
Exponential
Loga
rithm
−2.0 −1.0
0.2
0.6
Logarithm
Line
ar
0.2 0.4 0.6 0.8
0.2
0.6
Linear
Line
ar
1.2 1.6 2.0 2.4
0.2
0.6
Exponential
Line
ar
−2.0 −1.0
1.2
1.8
2.4
Logarithm
Exp
onen
tial
0.2 0.4 0.6 0.8
1.2
1.8
2.4
Linear
Exp
onen
tial
1.2 1.6 2.0 2.4
1.2
1.8
2.4
Exponential
Exp
onen
tial
Figure 4: Plots of circles transformed by logarithm, linear, and exponentialtransformations applied to both the x and y axes.
Consider the triangular density:
p(x) =
0 x < −1,C(x + 1) −1 ≤ x < 0,C(1 − x) 0 ≤ x < 1,0 x ≥ 1.
a. Determine the normalization constant C.
b. Derive an expression for the cumulative distribution functionF (x) for this density.
c. Derive an expression for F−1(x).
d. Use this result to generate triangularly distributed random num-bers.
62

−2.0 −1.0
0.3
0.6
0.9
Logarithm
Squ
are
Roo
t
0.2 0.4 0.6 0.8
0.3
0.6
0.9
Linear
Squ
are
Roo
t1.2 1.6 2.0 2.4
0.3
0.6
0.9
Exponential
Squ
are
Roo
t−2.0 −1.0
0.2
0.6
Logarithm
Line
ar
0.2 0.4 0.6 0.8
0.2
0.6
Linear
Line
ar
1.2 1.6 2.0 2.4
0.2
0.6
Exponential
Line
ar
−2.0 −1.0
0.0
0.4
0.8
Logarithm
Squ
are
0.2 0.4 0.6 0.8
0.0
0.4
0.8
Linear
Squ
are
1.2 1.6 2.0 2.4
0.0
0.4
0.8
Exponential
Squ
are
Figure 5: Plots of circles with the x axis transformed by logarithm, linear, andexponential transformations and the y axes transformed by square root, linearand square transformations.
Solution:
1. To address both parts a and b of this problem, first compute:
F (x) =
∫ x
−∞p(z)dz =
∫ x
−1
p(z)dz
For x in the range −1 ≤ x ≤ 0, this integral is:
F (x) =
∫ x
−1
C(z + 1)dz
=
[C
(z2
2+ z
)]x
−1
63

0.3 0.5 0.7 0.9
−2.
0−
1.0
Square Root
Loga
rithm
0.2 0.4 0.6 0.8
−2.
0−
1.0
Linear
Loga
rithm
0.0 0.2 0.4 0.6 0.8
−2.
0−
1.0
Square
Loga
rithm
0.3 0.5 0.7 0.9
0.2
0.6
Square Root
Line
ar
0.2 0.4 0.6 0.8
0.2
0.6
Linear
Line
ar
0.0 0.2 0.4 0.6 0.8
0.2
0.6
Square
Line
ar
0.3 0.5 0.7 0.9
1.2
1.8
2.4
Square Root
Exp
onen
tial
0.2 0.4 0.6 0.8
1.2
1.8
2.4
Linear
Exp
onen
tial
0.0 0.2 0.4 0.6 0.8
1.2
1.8
2.4
Square
Exp
onen
tial
Figure 6: Plots of circles with the x axis transformed by square root, linear andsquare transformations and the y axes transformed by logarithm, linear, andexponential transformations.
= C
(x2
2+ x −
[1
2− 1
])
= C
(x2
2+ x +
1
2
)
= C(x + 1)2
2
For 0 ≤ x ≤ 1, the integral is:
F (x) =
∫ 0
−1
p(z)dz +
∫ x
0
p(z)dz
=C
2+ C
∫ x
0
(1 − z)dz
64

=C
2+ C
[z − z2
2
]x
0
=C
2+ C
(x − x2
2
)
= C
(1 + 2x − x2
2
)
Thus, at x = 1, we have:
F (1) = C
(1 + 2 − 1
2
)= C
Since F (1) = 1 for normalization, this implies C = 1 and the cumulativedistribution is:
F (x) =
0 x ≤ −1(x+1)2
2 −1 ≤ x < 01+2x−x2
2 0 ≤ x < 11 x ≥ 1
2. To compute the inverse of F (x), consider the equation F (x) = p. First,note that for −1 ≤ x ≤ 0, the corresponding range of p is 0 ≤ p ≤ 1/2and the relationship is:
(x + 1)2
2= p ⇒ (x + 1)2 = 2p
⇒ x + 1 =√
2p
⇒ x =√
2p − 1
For 0 ≤ x ≤ 1, the corresponding range of p is 1/2 ≤ p ≤ 1 and therelationship is:
1 + 2x − x2
2= p ⇒ 1 + 2x − x2 = 2p
⇒ x2 − 2x + 2p − 1 = 0
⇒ x =2 ±
√4 − 4(2p − 1)
2= 1 ±
√2(p − 1)
Note that since the range of x here is 0 ≤ x ≤ 1, only the negative sign inthe solution is consistent, so we have:
x = 1 −√
2(1 − p) for 1/2 ≤ p ≤ 1
3. Combining these results gives the final expression for F−1(p) as:
F−1(p) =
{ √2p − 1 0 ≤ p ≤ 1/2
1 −√
2(1 − p) 1/2 ≤ p ≤ 1
65

4. To generate triangularly distributed random numbers, first generate asequence {un} that is uniformly distributed on [0, 1] and then apply thetransformation tn = F−1(un) to obtain the desired sequence {tn}.
Exercise 4:
The logarithmic transformation is widely used. Suppose x is a ran-dom variable with density p(x) that is nonzero only for x ≥ 0.
a. Derive a general expression for the density φ(z) of z = lnx.
b. Apply this result to the beta distribution with shape parameterq = 1 (see Chapter 4).
c. The resulting distribution is well known: what is it?
d. Apply this transformation result to the Pareto type I distribu-tion, P (I)(k, a).
e. How does this distribution differ from that considered in parts[b] and [c]?
Solution:
1. For T (z) = ln z, it follows that:
T ′(z) = 1/z
T−1(z) = ez
Thus, the general transformed result is:
φ(z) =p(T−1(z))
|T ′(T−1(z))|
=p(ez)
|1/ez|= ezp(ez)
2. The beta distribution with q = 1 has the density:
p(x) =Γ(p + 1)
Γ(p)Γ(1)xp−1 = pxp−1
The transformed result is therefore:
φ(z) = ezp(ez) = pez[ez]p−1 = pepz
Note that the range of z here is −∞ < z < 0. Re-writing this density interms of β = 1/p, this density corresponds to the exponential distribution,reflected about zero.
66

3. For the Pareto distribution:
p(x) =aka
xa+1for x ≥ k
Applying the log transformation to this distribution gives:
φ(z) = ezp(ez) =akaez
ez(a+1)= akae−az
4. This distribution differs from the previous result in its domain:
parts b & c: −∞ < z < 0
parts d & e: k ≤ z < ∞
Exercise 5:
Determine the density φ(z) that results when the angular transfor-mation discussed in Sec. 12.3.3 is applied to the uniform distributionon [0, 1]. Plot the resulting density.
Solution:
1. The angular transformation is:
T (x) = arcsin(2x − 1)
To determine the inverse function T−1(z), solve:
T (x) = z ⇒ arcsin(2x − 1) = z
⇒ 2x − 1 = sin z
⇒ x =1 + sin z
2
The derivative is given by:
T ′(x) =d
dxarcsin(2x − 1)
=1√
1 − (2x − 1)2· d
dx(2x − 1)
=1√
1 − 4x2 + 4x − 1· 2
=2√
4x − 4x2
=1√
x(1 − x)
67

2. The transformed density is:
φ(z) =p(T−1(z))
|T ′(T−1(z))|
The denominator in this expression is given by:
T ′(T−1(z)) = T ′(
1 + sin z
2
)
=
[1 + sin z
2
(1 − 1 + sin z
2
)]−1/2
=
[1 + sin z
2· 1 − sin z
2
]−1/2
=
[1 − sin2 z
4
]−1/2
=
[cos2 z
4
]−1/2
=2
cos z
Thus, the transformed density is:
φ(z) =p(
1+sin z2
)∣∣ 2cos z
∣∣
=| cos z|
2p
(1 + sin z
2
)
3. For the uniform distribution, we have:
p(x) =
{1 0 ≤ x ≤ 10 otherwise
⇒ p
(1 + sin z
2
)=
{1 0 ≤ 1+sin z
2 ≤ 10 otherwise
=
{1 0 ≤ 1 + sin z ≤ 20 otherwise
=
{1 −1 ≤ sin z ≤ 10 otherwise
Since −1 ≤ sin z ≤ 1 for all z, it follows that, for all z:
p
(1 + sin z
2
)= 1 ⇒ φ(z) =
| cos z|2
68
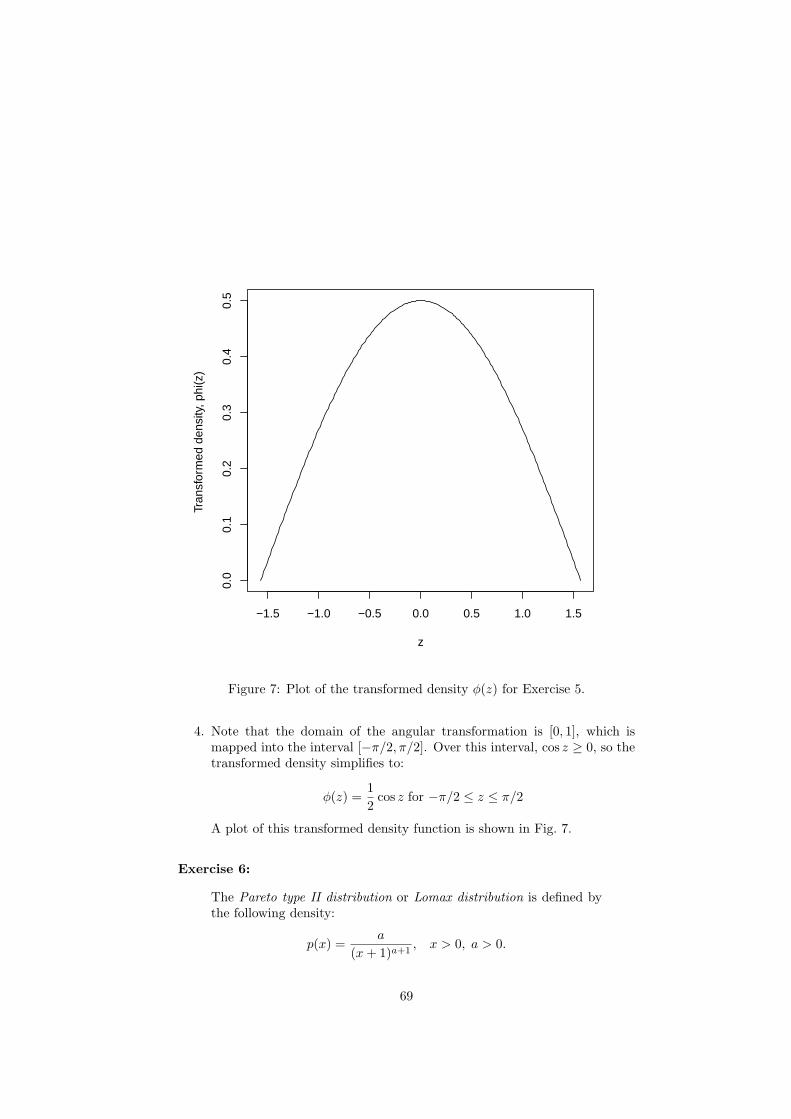
−1.5 −1.0 −0.5 0.0 0.5 1.0 1.5
0.0
0.1
0.2
0.3
0.4
0.5
z
Tran
sfor
med
den
sity
, phi
(z)
Figure 7: Plot of the transformed density φ(z) for Exercise 5.
4. Note that the domain of the angular transformation is [0, 1], which ismapped into the interval [−π/2, π/2]. Over this interval, cos z ≥ 0, so thetransformed density simplifies to:
φ(z) =1
2cos z for −π/2 ≤ z ≤ π/2
A plot of this transformed density function is shown in Fig. 7.
Exercise 6:
The Pareto type II distribution or Lomax distribution is defined bythe following density:
p(x) =a
(x + 1)a+1, x > 0, a > 0.
69

a. Consider the transformation z = lnx and derive an expressionfor the density of z. Plot this density.
c. Consider the transformation r = 1/x and derive an expressionfor the density of r. Plot this density.
Solution:
1. For the transformation z = lnx, it follows from the results of Exercise 4athat:
φ(z) = ezp(ez)
=aez
(ez + 1)a+1
Plots of this density function are shown in Fig. 8 for a = 0.5, 1.0 and 2.0.
2. For the reciprocal transformation, it follows from Eq. (12.67) that:
φ(z) =p(1/z)
z2
=a
z2(1/z + 1)a+1
=aza−1
(z + 1)a+1
Plots of this density function are shown in Fig. 9 for a = 0.5, 1.0 and 2.0.
Chapter 13
Exercise 1:
Suppose {xk} and {yk} are binary sequences, where xk = 1 withprobability p and yk = 1 with probability q. Define the population
odds ratio as the ratio of the probabilities:
Oxy =p00p11
p01p10,
where pij denotes the joint probability that xk = i and yk = j fori, j = 0 or 1. Show that Oxy = 1 when {xk} and {yk} are statisticallyindependent.
Solution:
1. Under independence, the joint probability pij may be factored as:
pij = piqj
where pi is the probability that x assumes its ith value and qj is theprobability that y assumes its jth value.
70

−4 −2 0 2 4
0.00
0.05
0.10
0.15
0.20
0.25
0.30
0.35
z
Tran
sfor
med
den
sity
, phi
(z)
a = 2
a = 0.5
a = 1
Figure 8: Plots of the transformed density φ(z) for Exercise 6a.
2. Thus, the population odds ratio under independence is:
Oxy =p00p11
p01p10
=(p0q0)(p1q1)
(p0q1)(p1q0)
=p0p1q0q1
p0p1q0q1
= 1
Exercise 2:
Derive the sum of squares partition from Eq. (13.11):
C∑
i=1
n∑
j=1
(yij − y··)2 = n
C∑
i=1
(yi· − y··)2 +
C∑
i=1
n∑
j=1
(yij − yi·)2.
71

0 1 2 3 4 5
0.0
0.2
0.4
0.6
0.8
1.0
z
Tran
sfor
med
den
sity
, phi
(z)
a = 2
a = 1
a = 0.5
Figure 9: Plots of the transformed density φ(z) for Exercise 6b.
Solution:
1. First, re-write the difference yij − y·· as:
yij − y·· = (yij − yi·) + (yi· − y··)
⇒ (yij − y··)2 = (yij − yi·)
2 + 2(yij − yi·)(yi· − y··) + (yi· − y··)2
2. From this, it follows that the total sum of squares SST may be written as:
SST =C∑
i=1
n∑
j=1
(yij − y··)2
=C∑
i=1
n∑
j=1
(yij − yi·)2 + 2
C∑
i=1
n∑
j=1
(yij − yi·)(yi· − y··) +C∑
i=1
n∑
j=1
(yi· − y··)2
72

= SSW + 2
C∑
i=1
n∑
j=1
(yij − yi·)(yi· − y··) + n
C∑
i=1
(yi· − y··)2
= SSW + SSB + 2
C∑
i=1
(yi· − y··)n∑
j=1
(yij − yi·)
3. To simplify this result, note that from Eqs. (13.6) and (13.10):
yij − yi· = µ + αi + eij − µ − αi −1
n
n∑
k=1
eik
= eij −1
n
n∑
k=1
eik
⇒n∑
j=1
(yij − yi·) =n∑
j=1
eij −n∑
j=1
[1
n
n∑
k=1
eik
]
=
n∑
j=1
eij − n
[1
n
n∑
k=1
eik
]
=
n∑
j=1
eij −n∑
k=1
eik
= 0
Thus, the above result reduces to SST = SSW + SSB as claimed.
Exercise 3:
Derive the expectations for the between groups and within groupssums of squares, SSB and SSW , given in Eq. (13.12):
E{SSB} = n
C∑
i=1
α2i + (C − 1)σ2
e ,
E{SSW } = C(n − 1)σ2e .
Solution:
1. It is simpler to start with the second result first since that builds on thesolution of Exercise 2:
E{SSW } = E
C∑
i=1
n∑
j=1
(yij − yi·)2
=
C∑
i=1
n∑
j=1
E{(yij − yi·)2}
73

From Exercise 2, we have:
yij − yi· = eij − ei
where ei =1
n
n∑
k=1
eik
⇒ (yij − yi·)2 = e2
ij − 2eij ei + e2i
2. Since E{eij} = 0 and var{eij} = E{e2ij} = σ2
e , it follows that:
E{(yij − yi·)2} = E{e2
ij} − 2E{eij ei} + E{e2i }
= σ2e − 2E
{1
n
n∑
k=1
eikeij
}+ E
1
n2
n∑
j=1
n∑
k=1
eikeij
= σ2e − 2
n
n∑
k=1
E{eijeik} +1
n2
n∑
j=1
n∑
k=1
E{eijeik}
= σ2e − 2
nσ2
e +1
n2
n∑
j=1
σ2e
= σ2e − 2
nσ2
e +1
nσ2
e
= σ2e − 1
nσ2
e
3. Thus, for the sum of squares within, we have:
E{SSW } =
C∑
i=1
n∑
j=1
[σ2e − 1
nσ2
e ]
=
C∑
i=1
[nσ2e − σ2
e ]
= C(n − 1)σ2e
4. For the between sum of squares, we have:
E{SSB} = E
{n
C∑
i=1
(yi· − y··)2
}
= n
n∑
i=1
E{(yi· − y··)2}
5. From Eqs. (13.9) and (13.10):
yi· − y·· = µ + αi + ei − µ − 1
C
C∑
ℓ=1
eℓ
74

= αi + δi
where δi = ei −1
C
C∑
ℓ=1
eℓ
⇒ (yi· − y··)2 = (αi + δi)
2
= α2i + 2δiαi + δ2
i
Taking the expectation of this result gives:
E{(yi· − y··)2} = α2
i + 2αiE{δi} + E{δ2i }
To simplify this result, note that:
E{eℓ} = E
{1
n
n∑
k=1
eℓk
}
=1
n
n∑
k=1
E{eℓk}
= 0
Thus:E{(yi· − y··)
2} = α2i + E{δ2
i }6. For this expectation:
E{δ2i } = E
{e2i −
2ei
C
C∑
ℓ=1
eℓ +1
C2
C∑
ℓ=1
C∑
m=1
eℓem
}
= E{e2i } −
2
C
C∑
ℓ=1
E{eieℓ} +1
C2
C∑
ℓ=1
C∑
m=1
E{eℓem}
7. For arbitrary ℓ and m, note that:
E{eℓem} = E
1
n
n∑
j=1
eℓj ·1
n
n∑
k=1
emk
=1
n2
n∑
j=1
n∑
k=1
E{eℓjemk}
Under the assumption that the errors {eij} are uncorrelated, it followsthat E{eℓjemk} = 0 unless ℓ = m and j = k. Thus:
E{eℓem} =1
n2
n∑
j=1
E{eℓjemj}
=E{eℓjemj}
n
=
{σ2
e/n m = ℓ0 m 6= ℓ
75

8. From this result, we have:
E{e2i } =
σ2e
n
2
C
C∑
ℓ=1
E{eieℓ} =2σ2
e
nC
1
C2
C∑
ℓ=1
C∑
m=1
E{eℓem} =1
C2
C∑
ℓ=1
E{e2ℓ}
=σ2
e
nC
Combining these results yields:
E{δ2i } =
σ2e
n− 2σ2
e
nC+
σ2e
nC
=σ2
e
n
(1 − 1
C
)
=σ2
e(C − 1)
nC
This leads to the desired final result, which is:
E{SSB} = n
C∑
i=1
α2i + nC · σ2
e(C − 1)
nC
= nC∑
i=1
α2i + (C − 1)σ2
e
Exercise 4:
Show that the C components of the least squares solution θ given inSec. 13.3.2 are identical with the estimators for µ and α1, α2, . . . , αC−1
given in Sec. 13.3 for the ANOVA model.
Solution:
1. The key to the equivalence to be shown here lies in recognizing that theobservation yk in the regression formulation corresponds to the ANOVAobservation yij if k defines the jth data record for which xk = vi, whichimplies bi,k = 1. Thus, from Eq. (13.18),
yk = yij ⇒ yij = µ + αi + ek
= µ + αi + eij
which corresponds exactly to Eq. (13.6).
76

2. Thus, the C components of the regression parameter vector θ are µ andα1 through αC−1. The remaining ANOVA model parameter αC followsdirectly from the constraint in Eq. (13.7):
C∑
i=1
αi = 0 ⇒ αC = −C−1∑
i=1
αi
Exercise 5:
Show that by defining Di,k as in Eq. (13.31), yk can be expressed asin Eq. (13.20) for the unbalanced one-way ANOVA problem, fromwhich it follows that the regression formulation of this problem hasthe same form as the balanced one-way ANOVA problem.
Solution:
1. As in the balanced ANOVA problem, the first step in deriving the regres-sion formulation is to write Eq. (13.18):
yk = µ +C∑
i=1
αibi,k + ek
with bi,k defined as in Eq. (13.17).
2. By Eq. (13.26), we have:
C∑
i=1
niαi = 0 ⇒ nCαC = −C−1∑
i=1
niαi
⇒ αC = −C−1∑
i=1
ni
nCαi
Substituting this result into Eq. (13.18) yields:
yk = µ +
C−1∑
i=1
αibi,k + αCbC,k + ek
= µ +
C−1∑
i=1
αibi,k −C−1∑
i=1
ni
nCbi,k + ek
= µ +
C−1∑
i=1
αi
(bi,k − ni
nCbC,k
)+ ek
3. Defining Di,k = bi,k−(ni/nC)bC,k as in Eq. (13.31) thus yields Eq. (13.20),just as in the balanced ANOVA problem.
77

Exercise 6:
a. Show that the Gaussian distribution belongs to the exponentialfamily defined by Eq. (13.46); that is, for y ∼ N(µ, σ) determinethe constants θ and φ and the functions a(φ), b(θ), and c(y, φ)appearing in this expression.
b. For the Gaussian case with the cannonical link g(x) = x, showthat the deviance defined in Eq. (13.52) is equal to the residualsum of squares:
RSS =
N∑
k=1
(yk − x′kβ)2.
Solution:
1. The exponential family of distributions is defined by densities of the fol-lowing form:
f(y; θ, φ) = exp
{yθ − b(θ)
a(φ)+ c(y, φ)
}
2. The Gaussian density is:
p(y) =1√2πσ
exp
{−1
2
(y − µ
σ
)2}
= exp
{−y2 − 2µy + µ2
2σ2− ln[σ
√2π]
}
= exp
{yµ − µ2/2
σ2+
[− y2
2σ2− ln
√2πσ2
]}
These expressions are the same if we make the following definitions:
θ = µ
b(θ) = θ2/2
φ = σ2
a(φ) = φ
c(y, φ) = − y2
2φ− 1
2ln 2πφ
3. The deviance is defined as:
D(yk;xTk β) = 2
N∑
k=1
wk(yk[g(yk) − xTk β] − b(g(yk)) + b(xT
k β))
78

Here, we consider the uniformly weighted case wk = 1 for all k and theidentity link g(x) = x, so the deviance expression simplifies to:
D(yk;xTk β) = 2
N∑
k=1
(yk[yk − xTk β] − y2
k/2 + (xTk β)2/2)
= 2N∑
k=1
[y2
k − xTk βyk − 1
2y2
k +1
2(xT
k β)2]
=
N∑
k=1
[y2k − 2xT
k β + (xTk β)2]
=
N∑
k=1
(yk − xTk β)2
Exercise 7:
Show that the variance of the two-component mixture of Poissondistributions discussed in Sec. 13.6.1 is given by:
var{n} = µ + π(1 − π)(λ1 − λ2)2,
where µ = πλ1 + (1 − π)λ2 is the mean of the mixture distribu-tion, π is the mixing parameter, and λ1 and λ2 are the parametersassociated with the component Poisson distributions on which themixture is based.
Solution:
1. The two-component Poisson mixture density is defined by Eq. (13.66) as:
P{n} = πP{n;λ1} + (1 − π)P{n;λ2}
The mean of this distribution is:
µ = E{n} = πE1{n} + (1 − π)E2{n}= πλ1 + (1 − π)λ2
2. The variance is most easily computed as:
var{n} = E{n2} − [E{n}]2
where E{n2} = πE1{n2} + (1 − π)E2{n2}= π(var1{n} + [E1{n}]2) + (1 − π)(var2{n} + [E2{n}]2)= π[λ1 + λ2
1] + (1 − π)[λ2 + λ22]
= πλ1 + (1 − π)λ2 + πλ21 + (1 − π)λ2
2
= µ + πλ21 + (1 − π)λ2
2
(E{n})2 = µ2 = π2λ21 + 2π(1 − π)λ1λ2 + (1 − π)2λ2
2
79

3. Combining these results yields:
var{n} = µ + πλ21 + (1 − π)λ2
2 − π2λ21 − 2π(1 − π)λ1λ2 − (1 − π)2λ2
2
= µ + [π − π2]λ21 − 2π(1 − π)λ1λ2 + [(1 − π) − (1 − π)2]λ2
2
= µ + π(1 − π)λ21 − 2π(1 − π)λ1λ2 + (1 − π)[1 − (1 − π)]λ2
2
= µ + π(1 − π)λ21 − 2π(1 − π)λ1λ2 + (1 − π)πλ2
2
= µ + π(1 − π)[λ21 − 2λ1λ2 + λ2
2]
= µ + π(1 − π)(λ1 − λ2)2
Chapter 14
Exercise 1:
Suppose D is a sequence {xk} of N random variables drawn fromany continuous distribution and let R denote the sample maximum:R = x(N). Consider a bootstrap sample {x∗
k} and let R = x∗(N).
Show that:
P{R = R} = 1 − (1 − 1/N)N → 1 − e−1 ≃ 0.632 as N → ∞.
(Hint: note that P{R 6= R} = P{x(N) is not drawn from D in N draws}.)This result illustrates a difficulty that can arise with the bootstrapmethod since for any continuous distribution the probability that Rhas any specified value is zero.
Solution:
1. The probability of drawing the unique maximum element R = x(N) is:
P{R = R} = 1 − P{R 6= R}= 1 − P{x(N) not drawn in N draws}
2. The probability of not drawing x(N) in N draws is:
P{x(N) not drawn in N draws} = P{x(N) not drawn on draw 1}·P{x(N) not drawn on draw 2}· · ·
·P{x(N) not drawn on draw N}
3. The probability that x(N) is not drawn on draw j is:
P{x(N) not drawn on draw j} = 1 − P{x(N) drawn on draw j}= 1 − 1/N
80

4. Combining these results gives:
P{x(N) not drawn in N draws} = (1 − 1/N) · (1 − 1/N) · · · (1 − 1/N)
= (1 − 1/N)N
⇒ P{R = R} = 1 − (1 − 1/N)N
5. It is a standard result (see, for example, Abramowitz and Stegun [1], p.70, no. 4.2.21) that:
limm→∞
(1 +
z
m
)m
= ez
Letting z = −1 then yields the result:
limN→∞
(1 +
1
N
)N
= e−1
Exercise 2:
Recall from Chapter 3 that the probability of drawing m black ballsin a sample of size p from an urn containing Q white balls and N−Qblack balls is given by the hypergeometric distribution. For a datasetof size N containing a single outlier, compute the probability thata subsample of size m contains this outlier. For a data sequence oflength N = 100, how many of B = 1000 independent 10% subsam-ples can be expected to contain the outlier? Of 50% subsamples?Of 90% subsamples?
Solution:
1. Given a dataset of size N containing Q outliers, the probability of drawinga sample of size m with k outliers is given by Eq. (3.17):
P{k outliers} =
(mk
)(N − mQ − k
)/(NQ
)
2. For Q = k = 1, this probability reduces to:
P{outlier in sample} =
(m1
)(N − m
0
)/(N1
)
=
(m1
)/(N1
)
=m!
(m − 1)!1!· (N − 1)!1!
N !
=m
N
81

3. For B repeated, independent draws, the result corresponds to a sequenceof B Bernoulli trials, each with probability p = m/N that the samplecontains the outlier. Thus, the expected number of B independent sub-samples containing the outlier is Nout = pB = Bm/N . For the specificcases considered here, we have:
– 10% subsample: p = 0.10, implying 100 subsamples with the outlier
– 50% subsample: p = 0.50, implying 500 subsamples with the outlier
– 90% subsample: p = 0.90, implying 900 subsamples with the outlier
Chapter 15
Exercise 1:
For the OLS linear regression model, the prediction vector y is givenby y = Hy where H is the hat matrix introduced in Sec. 15.3.1.Prove that the mean of the predictions is equal to the data mean,i.e.:
1
N
N∑
k=1
yk =1
N
N∑
k=1
yk.
Solution:
1. Note that the OLS solution {yk} minimizes:
J =
N∑
k=1
(yk − yk)2 =
N∑
k=1
r2k
2. Now, suppose the mean of the predictions differs from that of the datavalues:
1
N
N∑
k=1
yk 6= 1
N
N∑
k=1
yk
⇒ r =1
N
N∑
k=1
rk =1
N
N∑
k=1
yk − 1
N
N∑
k=1
yk
6= 0
3. Under this assumption, write rk = r + r0k where:
1
N
N∑
k=1
r0k = 0
⇒ J =
N∑
k=1
(r + r0k)2
82

=
N∑
k=1
[r2 + 2rr0k + (r0
k)2]
= Nr2 + 2r
N∑
k=1
r0k +
N∑
k=1
(r0k)2
= Nr2 +N∑
k=1
(r0k)2
4. This result implies that
J >
N∑
k=1
(r0k)2
from which it follows that J is minimized by forcing r = 0, which is alwayspossible in OLS models that include an intercept term.
Exercise 2:
Prove that if the variance of the predictions {yk} is no larger thanthe variance of the data sequence {yk}, the maximum achievable R2
value defined in Eq. (15.1) is 1.
Solution:
1. The R2 value is defined as:
R2 =
∑Nk=1 (yk − y)2
∑Nk=1 (yk − y)2
Under the assumption that the average of the predictions {yk} is equal tothe average of the data values {yk}, it follows that R2 is simply the ratioof the prediction error variance to the data variance. Under the workingassumptions of the problem, it follows that R2 ≤ 1.
Exercise 3:
Prove that the OLS parameter estimate vector θ is given by:
θ = VD−1UT y,
where U, V, and D are the matrices defined by the singular valuedecomposition of the data matrix X given in Eq. (15.21).
Solution:
1. First, represent X in terms of its singular value decomposition as:
X = UDVT
83

2. Next, note that the explicit form of the OLS solution is:
θ = (XT X)−1XT y
3. Note that:
XT = (UDVT )T = VDUT
⇒ θ = (VDUT UDVT )−1VDUT y
= (VD2VT )−1VDUT y (since UT U = I)
= VD−2VT VDUT y (since V−1 = VT )
= VD−2DUT y
= VD−1UT y
Exercise 4—NOTE: the term σ2e was omitted from the original
problem statement; the corrected version and its solution are given
here.
Show that the matrix C = σ2e(XT X)−1 can be written as:
C = σ2eVD−2VT ,
where D and V are the matrices defined by the singular value de-composition of the data matrix X given in Eq. (15.21) and σ2
e is thevariance of the model error term ek.
Solution:
1. From the solution to the previous problem:
X = UDVT
⇒ XT = VDUT
⇒ XT X = VDUT UDVT
= VD2VT
2. Thus, we can write the required inverse as:
(XT X)−1 = (VD2VT )−1
= (VT )−1D−2V−1
= VD−2VT
3. Substituting this result into the definition of C yields:
C = σ2e(XT X)−1 = σ2
eVD−2VT
Exercise 5:
84

It was shown that the condition number for the modified matrix C =(kI+XT X)−1 appearing in the ridge regression problem formulationis given by:
κ =k + λ+
k + λ−,
where k is the ridge regression tuning parameter. Show that κ de-creases with increasing k.
Solution:
1. Note that:
κ =k + λ+
k + λ−
=k + λ− + (λ+ − λ−)
k + λ−
= 1 +λ+ − λ−k + λ−
2. Differentiating with respect to k gives:
dκ
dk= − (λ+ − λ−)
(k + λ−)2
3. Since λ+ > λ−, it follows that this derivative is negative for all k, implyingthat κ decreases with increasing k.
Exercise 6:
Prove that an N×N idempotent matrix with rank r has r eigenvaluesequal to 1 and N − r eigenvalues equal to 0.
Solution:
1. Suppose A is an N × N idempotent matrix and x is an eigenvector of A
with eigenvalue λ. Thus:
Ax = λx
⇒ A2x = A[Ax]
= A[λx]
= λAx
= λ2x
2. Since idempotence implies that A2 = A and eigenvectors are nonzero, thisresult implies that:
λ2x = λx
⇒ λ2 = λ
⇒ λ(1 − λ) = 0
85

3. Since the only two solutions of this quadratic equation are λ = 0 andλ = 1, it follows that these are the only possible eigenvalues.
Exercise 7:
Show that the change in the OLS parameter vector θ on deletion ofthe ith observation from the dataset is given by:
θ − θ(i) =(XT X)−1ziri
1 − Hii,
where zi is the deleted row of the data matrix X, ri is the residualri = yi − yi associated with the ith response in the full data model,and Hii is the i, i diagonal element of the hat matrix H.
Solution:
1. The original and deletion-based OLS estimates are:
θ = (XT X)−1XT y
θ(i) = (XT(i)X(i))
−1XT(i)y(i)
2. From Eq. (15.34), we have:
(XT(i)X(i))
−1 = (XT X)−1 +(XT X)−1ziz
Ti (XT X)−1
1 − Hii
3. Also, note that:XT
(i)y(i) = XT y − ziyi
4. Combining these results gives:
θ(i) = (XT X)−1[XT y − ziyi] +(XT X)−1ziz
Ti (XT X)−1[XT y − ziyi]
1 − Hii
= θ − (XT X)−1ziyi +(XT X)−1ziz
Ti (XT X)−1XT y
1 − Hii
− (XT X)−1zizTi (XT X)−1ziyi
1 − Hii
= θ − (XT X)−1ziyi +(XT X)−1ziz
Ti θ
1 − Hii− (XT X)−1ziHiiyi
1 − Hii
= θ − (XT X)−1ziyi
[1 +
Hii
1 − Hii
]+
(XT X)−1ziyi
1 − Hii
= θ − (XT X)−1ziyi
1 − Hii+
(XT X)−1ziyi
1 − Hii
= θ − (XT X)−1zi(yi − yi)
1 − Hii
= θ − (XT X)−1ziri
1 − Hii
86

5. From this result, the influence of deletion on the OLS parameter estimateis:
θ − θ(i) =(XT X)−1ziri
1 − Hii
Exercise 8:
Show that the maximum number of models built and evaluated inforward stepwise regression without backward elimination is C(C −1)/2.
Solution:
1. Stage 1 of forward stepwise regression without backward elimination buildsthe univariate models for each covariate. Each of these models is testedfor significance relative to the intercept-only model, and if any are foundsignificant at the specified level, the best-fitting of these models is selectedas the basis for Stage 2; otherwise, the process terminates without selectingany of the covariates. Stage 1 thus requires building and evaluating Cmodels.
2. In Stage 2, the best of the Stage 1 models is selected and the other C − 1covariates are each included as a second predictor in the model and theseC − 1 models are evaluated to determine whether any of these additionalcovariates yields a significant improvement in fit at the specified level. Ifnot, the procedure terminates, selecting the Stage 1 model; otherwise, theprocedure goes on to Stage 3.
3. In general, Stage j begins with a j − 1 component model from Stage j − 1and evaluates the remaining C − j + 1 covariates as possible additions tothe model, either accepting the Stage j − 1 model and terminating, oradding the best fitting new covariate and proceeding on to Stage j + 1.The total number of models evaluated by the end of Stage j is:
Nj =
j∑
i=1
(C − i + 1)
= j(C + 1) −j∑
i=1
i
= j(C + 1) − j(j + 1)
2
4. If a new covariate is selected at every stage, the procedure can continueuntil Stage C, where C−1 covariates have been included in the model andthe single remaining covariate is evaluated for possible inclusion. Whetherthis covariate is included in or excluded from the model, the procedure
87

necessarily terminates here. Thus, the largest number of models thatwould need to be evaluated is:
NC = C(C + 1) − C(C + 1)
2=
C(C + 1)
2
Chapter 16
Exercise 1:
Show that the expected number of incomplete observations (i.e.,observatations with xk missing, yk missing, or both) is p(1− p/4)Nfor the MCAR simulation dataset.
Solution:
1. The MCAR dataset is generated from a set of N bivariate data samples{(xk, yk)} by randomly omitting pN/2 values from both xk and yk. Whilethe numbers of both of these deletions is fixed, the indices k are randomlyselected in both cases and it can happen that the same index k is selectedfor both x-deletion and y-deletion. Since each data point can only bedeleted once, the effect of these “collisions” is to reduce the total numberof deleted observations from pN to pN − C where C is the number ofdoubly-selected points.
2. Since each selection is made independently, the probability of double se-lection is:
P{select both xk and yk} = P{select xk} · P{select yk}= (p/2) · (p/2)
= p2/4
3. Thus, the expected number of double selections from N observations isNp2/4, so the expected number of omitted observations is:
Nomit = pN − Np2/4 = p(1 − p/4)N
Exercise 2:
Show that the complete data log likelihood for the univariate exam-ple with nonignorable missing data considered in Sec. 16.7.3 is givenby Eq. (16.14):
Lc{{xk} | µ, σ2} = −N
2ln(2πσ2) − m
2ln τ2 − 1
2σ2S2 +
µ
σ2S1
− µ2
2σ2[N − m + mλ2/τ2],
where S1 and S2 are the sufficient statistics defined in Eq. (16.15).
88

Solution:
1. The MNAR model has xk distributed as:
xk ∼{
N(µ, σ2) k = 1, 2, . . . , N − m (xk not missing)N(λµ, τ2σ2) k = N − m + 1, . . . , N (xk missing)
⇒ pk =
1√2πσ
exp[− 1
2
(xk−µ
σ
)2]k = 1, 2, . . . , N − m
1√2πτσ
exp
[− 1
2
(xk−λµ
τσ
)2]
k = N − m + 1, . . . , N
2. Thus, the complete data log likelihood is:
Lc({xk}|µ, σ2} =N∑
k=1
ln pk
=
N−m∑
k=1
[−1
2ln 2π − lnσ − 1
2
(xk − µ
σ
)2]
+
N∑
k=N−m+1
[−1
2ln 2π − ln τσ − 1
2
(xk − λµ
τσ
)2]
= − (N − m)
2ln 2π − (N − m) ln σ − 1
2σ2
N−m∑
k=1
(xk − µ)2
−m
2ln 2π − m ln τσ − 1
2τ2σ2
N∑
k=N−m+1
(xk − λµ)2
= −N
2ln 2π − N lnσ − m ln τ
− 1
2σ2
[N−m∑
k=1
(xk − µ)2 +1
τ2
N∑
k=N−m+1
(xk − λµ)2
]
= −N
2ln 2π − N lnσ − m ln τ
− 1
2σ2
[N−m∑
k=1
(x2k − 2xkµ + µ2) +
1
τ2
N∑
k=N−m+1
(x2k − 2λµxk + λ2µ2)
]
= −N
2ln 2π − N lnσ − m ln τ
− 1
2σ2
[N−m∑
k=1
x2k +
N∑
k=N−m+1
x2k/τ2
]
+µ
σ2
[N−m∑
k=1
xk +N∑
k=N−m+1
(λ/τ2)xk
]
− (N − m)µ2 + mλ2µ2/τ2
2σ2
89

3. Defining the sums S1 and S2 as in Eq. (16.15), this result simplifies toEq. (16.16):
Lc({xk}|µ, σ2) = −N
2ln 2π − N lnσ − m ln τ
− S2
2σ2+
µS1
σ2− (N − m)µ2 + mλ2µ2/τ2
2σ2
Exercise 3:
Derive the maximum likelihood estimators µ and σ2 shown in Eq. (16.16)for the nonignorable missing data example considered in Sec. 16.7.3.
Solution:
1. To solve for µ, differentiate the complete data likelihood with respect toµ, giving:
∂Lc({xk}|µ, σ2)
∂µ=
S1
σ2− µ[N − m + mλ2/τ2]
σ2
2. Setting this derivative to zero yields:
S1
σ2=
µ[N − m + mλ2/τ2]
σ2
⇒ µ =S1
N − m + mλ2/τ2
3. For σ2, differentiate the complete data likelihood with respect to σ2, yield-ing:
∂Lc({xk}|µ, σ2)
∂σ2= − N
2σ2+
S2
2σ4− µS1
σ4
+µ2[N − m + mλ2/τ2]
2σ4
4. Setting this derivative to zero yields:
N
2σ2=
S2 − 2µS1 + µ2[N − m + mλ2/τ2]
2σ4
⇒ σ2 =S2 − 2µS1 + µ2[N − m + mλ2/τ2]
N
5. To simplify this result, note that:
S1 = µ[N − m + mλ2/τ2]
⇒ σ2 =S2 − 2µ2[N − m + mλ2/τ2] + µ2[N − m + mλ2/τ2]
N
=S2 − [N − m + mλ2/τ2]µ2
N
90

Exercise 4:
Compute the limiting values µ(∞) and σ2(∞) for the EM algorithm
described in Sec. 16.7.3 for the univariate MNAR problem consideredthere.
Solution:
1. To obtain the limiting estimator for µ, set µ(j) = µ(j+1) = µ(∞) in thefirst equation in Eq. (16.18), which gives:
µ(∞) =
∑N−mk=1 xk + (mλ2/τ2)µ(∞)
N − m + mλ2/τ2
⇒ [N − m + mλ2/τ2]µ(∞) =N−m∑
k=1
xk + (mλ2/τ2)µ(∞)
⇒ (N − m)µ(∞) =
N−m∑
k=1
xk
⇒ µ(∞) =1
N − m
N−m∑
k=1
xk
2. Similarly, setting σ2(j) = σ2
(j+1) = σ2(∞) yields:
σ2(∞) =
1
N
[N−m∑
k=1
x2k − (N − m)µ2
(∞) + mσ2(∞)
]
⇒ Nσ2(∞) =
N−m∑
k=1
x2k − (N − m)µ2
(∞) + mσ2(∞)
⇒ (N − m)σ2(∞) =
N−m∑
k=1
x2k − (N − m)µ2
(∞)
⇒ σ2(∞) =
1
N − m
N−m∑
k=1
x2k − µ2
(∞)
Exercise 5:
Show that the complete data log likelihood for the bivariate Gaussianexample considered in Sec. 16.7.4 is given by Eq. (16.21).
Solution:
1. To obtain the desired result, it is necessary to first write the joint densityexplicitly in terms of its components. To do this, first note that the inverse
91

covariance matrix is:
Σ−1 =
[σ2
x ρσxσy
ρσxσy σ2y
]−1
=1
σ2xσ2
y − ρ2σ2xσ2
y
[σ2
y −ρσxσy
−ρσxσy σ2x
]
=1
ζ
[σ2
y −ρσxσy
−ρσxσy σ2x
]
2. From this result, we have:
Σ−1(w − µ) =1
ζ
[σ2
y −ρσxσy
−ρσxσy σ2x
] [x − µx
y − µy
]
=1
ζ
[σ2
y(x − µx) − ρσxσy(y − µy)−ρσxσy(x − µx) + σ2
x(y − µy)
]
⇒ (w − µ)T Σ−1(w − µ) =1
ζ[x − µx, y − µy]
[σ2
y(x − µx) − ρσxσy(y − µy)−ρσxσy(x − µx) + σ2
x(y − µy)
]
=1
ζ[σ2
y(x − µx)2 − ρσxσy(x − µx)(y − µy)
−ρσxσy(x − µx)(y − µy) + σ2x(y − µy)2]
=σ2
y(x − µx)2 − 2ρσxσy(x − µx)(y − µy) + σ2x(y − µy)2
ζ
3. Taking the log of p(xk, yk) then gives:
ln p(xk, yk) = − ln 2π − 1
2ln ζ
− 1
2ζ[σ2
y(xk − µx)2 − 2ρσxσy(xk − µx)(yk − µy) + σ2x(yk − µy)2]
= − ln 2π − 1
2ln ζ − 1
2ζ[σ2
y(x2k − 2µxxk + µ2
x)
−2ρσxσy(xkyk − µxyk − µyxk + µxµy) + σ2x(y2
k − 2µyyk + µ2y)]
= − ln 2π − 1
2ln ζ − 1
2ζ{σ2
yx2k − 2ρσxσyxkyk + σ2
xy2k
−2[(µxσ2y − µyρσxσy)xk + (µyσ2
x − µxρσxσy)yk]
+µ2xσ2
y + µ2yσ2
x − 2ρµxµyσxσy}
3. The complete data likelihood is obtained by summing over the N obser-vations (xk, yk) to obtain:
Lc{D|µ,Σ} =
N∑
k=1
ln p(xk, yk)
92

= −N ln 2π − N
2ln ζ
− 1
2ζ
{σ2
y
N∑
k=1
x2k − 2ρσxσy
N∑
k=1
xkyk + σ2x
N∑
k=1
y2k
}
+1
ζ
[(µxσ2
y − µyρσxσy)
N∑
k=1
xk + (µyσ2x − µxρσxσy)
N∑
k=1
yk
]
−N(µ2
xσ2y + µ2
yσ2x − 2ρµxµyσxσy)
2ζ
4. Note that these sums correspond to those defined in Eq. (16.22), leadingto the final result (Eq. (16.21)):
Lc{D|µ,Σ} = −N ln 2π − N
2ln ζ − 1
2ζ{σ2
yT11 − 2ρσxσyT12 + σ2xT22
−2[(µxσ2y − µyρσxσy)T1 + (µyσ2
x − µxρσxσy)T2]
+N(µ2xσ2
y + µ2yσ2
x − 2ρµxµyσxσy)}
Exercise 6:
Show that the complete data maximum likelihood estimators for thebivariate Gaussian parameters are given by Eq. (16.23).
Solution:
1. The complete data likelihood is given by Eq. (16.20) as:
Lc(D|µ,Σ) = −N ln 2π − N
2ln ζ − 1
2ζ{σ2
yT11 − 2ρσxσyT12 + σ2xT22
−2[(µxσ2y − µyρσxσy)T1 + (µyσ2
x − µxρσxσy)T2]
+N(µ2xσ2
y + µ2yσ2
x − 2ρµxµyσxσy)}
To compute µx, solve ∂Lc/∂µx = 0. Computing the derivative yields:
∂Lc
∂µx=
∂
∂µx
[− 1
2ζ{−2µxσ2
yT1 + 2µxρσxσyT2 + Nµ2xσ2
y − 2Nρµxµyσxσy}]
= − 1
2ζ[−2σ2
yT1 + 2ρσxσyT2 + 2Nµxσ2y − 2Nρµyσxσy]
=σ2
y(T1 − Nµx) − ρσxσy(T2 − Nµy)
ζ
Setting this derivative to zero yields the following equation:
σ2y(T1 − Nµx) − ρσxσy(T2 − Nµy) = 0
93

2. Differentiating Lc with respect to µy and setting the result to zero yieldsan analogous equation, but with µx ↔ µy, σx ↔ σy, and T1 ↔ T2, giving:
σ2x(T2 − Nµy) − ρσxσy(T1 − Nµx) = 0
Rearranging these two equations yields the following pair of simultaneouslinear equations for µx and µy:
−Nσ2yµx + Nρσxσyµy = ρσxσyT2 − σ2
yT1
Nρσxσyµx − Nσ2xµy = ρσxσyT1 − σ2
xT2
Multiplying the first of these equations by ρσx and the second by σy, weobtain:
−Nρσxσ2yµx + Nρ2σ2
xσyµy = ρ2σ2xσyT2 − ρσxσ2
yT1
Nρσxσ2yµx − Nσ2
xσyµy = ρσxσ2yT1 − σ2
xσyT2
Adding these equations yields:
Nσ2xσ2
y(ρ2 − 1)µy = (ρ2 − 1)σ2xσyT2
⇒ Nµy = T2
⇒ µy =T2
N
Substituting this result into the original equation obtained by setting∂Lc/∂µx = 0 gives:
σ2y(T1 − Nµx) = 0 ⇒ µx =
T1
N
3. To solve for σx, σy, and ρ, substitute µx and µy into Lc(D|µ,Σ) to obtain:
Lc(D|µ,Σ) = −N ln 2π − N
2ln ζ − 1
2ζ{σ2
yT11 − 2ρσxσyT12 + σ2xT22
−2[(µxσ2y − µyρσxσy)(Nµx) + (µyσ2
y − µxρσxσy)(Nµy)]
+N(µ2xσ2
y + µ2yσ2
x − 2ρµxµyσxσy)}
= −N ln 2π − N
2ln ζ − 1
2ζ{σ2
yT11 − 2ρσxσyT12 + σ2xT22
−2N [µ2xσ2
y + µ2yσ2
x − 2ρµxµyσxσy]
+N [µ2xσ2
y + µ2yσ2
x − 2ρµxµyσxσy]}
= −N ln 2π − N
2ln ζ − 1
2ζ{σ2
yT11 − 2ρσxσyT12 + σ2xT22
−N [µ2xσ2
y + µ2yσ2
x − 2ρµxµyσxσy]}
= −N ln 2π − N
2ln ζ − N
2ζ
(σ2
y
[T11
N− µ2
x
]
−2ρσxσy
[T12
N− µxµy
]+ σ2
x
[T22
N− µ2
y
])
94

To simplify these expressions, make the following definitions:
S11 =T11
N− µ2
x
S12 =T12
N− µxµy
S22 =T22
N− µ2
y
This gives the following expression for the likelihood:
Lc(D|µ,Σ) = −N ln 2π − N
2ln ζ − N
2ζ
(σ2
yS11 − 2ρσxσyS12 + σ2xS22
)
Noting that ζ = σ2xσ2
y(1 − ρ2), this likelihood may be expressed directlyin terms of the unknown parameters σx, σy and ρ as:
Lc(D|µ,Σ) = −N ln 2π − N lnσx − N lnσy − N
2ln(1 − ρ2)
−N(σ2
yS11 − 2ρσxσyS12 + σ2xS22)
2σ2xσ2
y(1 − ρ2)
= −N ln 2π − N lnσx − N lnσy − N
2ln(1 − ρ2)
− NS11
2σ2x(1 − ρ2)
+NρS12
σxσy(1 − ρ2)− NS22
2σ2y(1 − ρ2)
4. To obtain equations for σx, σy, and ρ, differentiate the likelihood withrespect to each of these parameters and set the results to zero. For σx, wehave:
∂Lc
∂σx=
∂
∂σx
[−N lnσx − NS11
2σ2x(1 − ρ2)
+NρS12
σxσy(1 − ρ2)
]
= −N
σx+
NS11
σ3x(1 − ρ2)
− NρS12
σ2xσy(1 − ρ2)
= −N
σx
[1 − S11
σ2x(1 − ρ2)
+ρS12
σxσy(1 − ρ2)
]
Setting this derivative to zero yields:
1 =S11
σ2x(1 − ρ2)
− ρS12
σxσy(1 − ρ2)
⇒ σ2xσ2
y(1 − ρ2) = σ2yS11 − ρσxσyS12
By simply reversing the roles of x and y, we obtain the following equationfrom setting ∂Lc/∂σy to zero:
σ2xσ2
y(1 − ρ2) = σ2xS22 − ρσxσyS12
95

5. Taking the derivative of Lc with respect to ρ yields:
∂Lc
∂ρ=
∂
∂ρ
[−N
2ln(1 − ρ2) − NS11
2σ2x(1 − ρ2)
+NρS12
σxσy(1 − ρ2)− NS22
2σ2y(1 − ρ2)
]
=Nρ
1 − ρ2− NρS11
σ2x(1 − ρ2)2
+NS12
σxσy
∂
∂ρ
(ρ
1 − ρ2
)− NρS22
σ2y(1 − ρ2)
Note that:
∂
∂ρ
(ρ
1 − ρ2
)=
(1 − ρ2) · 1 − ρ · (−2ρ)
(1 − ρ2)2
=1 + ρ2
1 − ρ2
Thus, it follows that:
∂Lc
∂ρ=
Nρ
1 − ρ2− NρS11
σ2x(1 − ρ2)
+NS12(1 + ρ2)
σxσy(1 − ρ2)2− NρS22
σ2y(1 − ρ2)
=N
σ2xσ2
y(1 − ρ2)2[ρ(1 − ρ2)σ2
xσ2y − ρσ2
yS11 + S12σxσy(1 + ρ2) − ρσ2xS22]
6. To simplify this result, substitute the previous equations involving σx andσy, re-arranged as:
σ2yS11 = σ2
xσ2y(1 − ρ2) + ρσxσyS12
σ2xS22 = σ2
xσ2y(1 − ρ2) + ρσxσyS12
Substituting these results into the above equation yields:
∂Lc
∂ρ=
N
σ2xσ2
y(1 − ρ2)2[ρ(1 − ρ2)σ2
xσ2y − ρσ2
xσ2y(1 − ρ2) − ρ2σxσyS12
+S12σxσy(1 + ρ2) − ρσ2xσ2
y(1 − ρ2) − ρ2σxσyS12]
=N
σ2xσ2
y(1 − ρ2)2[−2ρ2σxσyS12 + S12σxσy(1 + ρ2) − ρσ2
xσ2y(1 − ρ2)]
=N
σ2xσ2
y(1 − ρ2)2[S12σxσy(1 − ρ2) − ρσxσy(1 − ρ2)]
=N
σxσy(1 − ρ2)[S12 − ρσxσy]
Thus, setting this derivative to zero implies:
S12 = ρσxσy
Substituting this result back into the σx equation yields:
S12 = ρσxσy ⇒ σ2xσ2
y(1 − ρ2) = σ2yS11 − ρ2σ2
xσ2y
⇒ σ2xσ2
y = σ2yS11
⇒ σ2x = S11
96

By exactly the same reasoning, we also have σ2y = S22. Defining σxy as
ρσxσy, it follows that σxy = S12.
Exercise 7:
Show that the conditional expectation of the sums T2, T11, T22, andT12 given the observed data and the parameters µ(j) and Σ(j) forthe bivariate Gaussian example discussed in Sec. 16.7.4 are given byEq. (16.27).
Solution:
1. For T2, the E-step conditional expectation is computed in exactly the samewas as that for T1, i.e.:
T(j)2 = E{T2|Dobs, µ
(j),Σ(j)}=
∑
k∈Ky
yk +∑
k/∈Ky
E{yk|xk, µ(j),Σ(j)}
=∑
k∈Ky
yk + (N − Ny)
(µ(j)
y − σ(j)xy µ
(j)x
σ2(j)x
)+
(σ
(j)xy
σ2(j)x
) ∑
k/∈Ky
xk
2. For T11 the conditional expectation is:
T(j)11 = E{T11|Dobs, µ
(j),Σ(j)}=
∑
k∈Kx
x2k +
∑
k/∈Kx
E{x2k|yk, µ(j),Σ(j)}
=∑
k∈Kx
x2k +
∑
k/∈Kx
[(E{xk|yk, µ(j),Σ(j)})2 + var{xk|yk, µ(j),Σ(j)}
]
=∑
k∈Kx
x2k +
∑
k/∈Kx
(
µ(j)x +
σ(j)xy (yk − µ
(j)y )
σ2(j)y
)2
+ σ2(j)x (1 − ρ2(j))
=∑
k∈Kx
x2k +
∑
k/∈Kx
(µ(j)
x +σ
(j)xy (yk − µ
(j)y )
σ2(j)y
)2
+ (N − Nx)σ2(j)x (1 − ρ2(j))
3. The result for T(j)22 is derived analogously and may be obtained by simply
interchanging x and y in the T(j)11 result.
4. For T12, the conditional expectation is:
T(j)12 = E{T12|Dobs, µ
(j),Σ(j)}=
∑
k∈Kxy
xkyk +∑
k∈Kx\Ky
E{xkyk|xk, µ(j),Σ(j)}
97

+∑
k∈Ky\Kx
E{xkyk|yk, µ(j),Σ(j)}
=∑
k∈Kxy
xkyk +∑
k∈Kx\Ky
xkE{yk|xk, µ(j),Σ(j)}
+∑
k∈Ky\Kx
ykE{xk|yk, µ(j),Σ(j)}
=∑
k∈Kxy
xkyk +∑
k∈Kx\Ky
xk
(µ(j)
y +σ
(j)xy (xk − µ
(j)x )
σ2(j)x
)
+∑
k∈Ky\Kx
yk
(µ(j)
x +σ
(j)xy (yk − µ
(j)y )
σ2(j)y
)
Exercise 8:
Show that the limiting variance for the Healy-Westmacot proceduredescribed in Sec. 16.7.6 is given by:
σ2(∞) =
1
N − m
N−m∑
k=1
(yk − xTk β(∞))
2,
where β(∞) is the limiting vector of regression coefficients obtainedby the procedure.
Solution:
1. Given the limiting parameter estimate vector β(∞), the limiting varianceis obtained by substituting σ2
(j) = σ2(j+1) = σ2
(∞) into Eq. (16.33):
σ2(∞) =
1
N
[N−m∑
k=1
(yk − xTk β(∞))
2 + mσ2(∞)
]
⇒ Nσ2(∞) =
N−m∑
k=1
(yk − xTk β(∞))
2 + mσ2(∞)
⇒ (N − m)σ2(∞) =
N−m∑
k=1
(yk − xTk β(∞))
2
⇒ σ2(∞) =
1
N − m
N−m∑
k=1
(yk − xTk β(∞))
2
98


![College of Medicine, Nursing & Health Sciences [CMNHS] College of Medicine, Nursing & Health Sciences [CMNHS] School of Medicine School of Nursing.](https://static.fdocuments.net/doc/165x107/56649dbe5503460f94ab1b37/college-of-medicine-nursing-health-sciences-cmnhs-college-of-medicine.jpg)