
Exploring Big Data in Social Networks - LITISwic.litislab.fr/2013/slides/virgilio-keynote- Big Data...
44
Exploring Big Data in Social Networks [email protected] ([email protected]) INWEB – National Science and Technology Institute for Web Federal University of Minas Gerais - UFMG May 2013
-
Upload
duongxuyen -
Category
Documents
-
view
216 -
download
0
Transcript of Exploring Big Data in Social Networks - LITISwic.litislab.fr/2013/slides/virgilio-keynote- Big Data...

Exploring Big Data in Social Networks
INWEB – National Science and Technology Institute for Web
Federal University of Minas Gerais - UFMG
May 2013

Some thoughts about computing, future and
innovation…
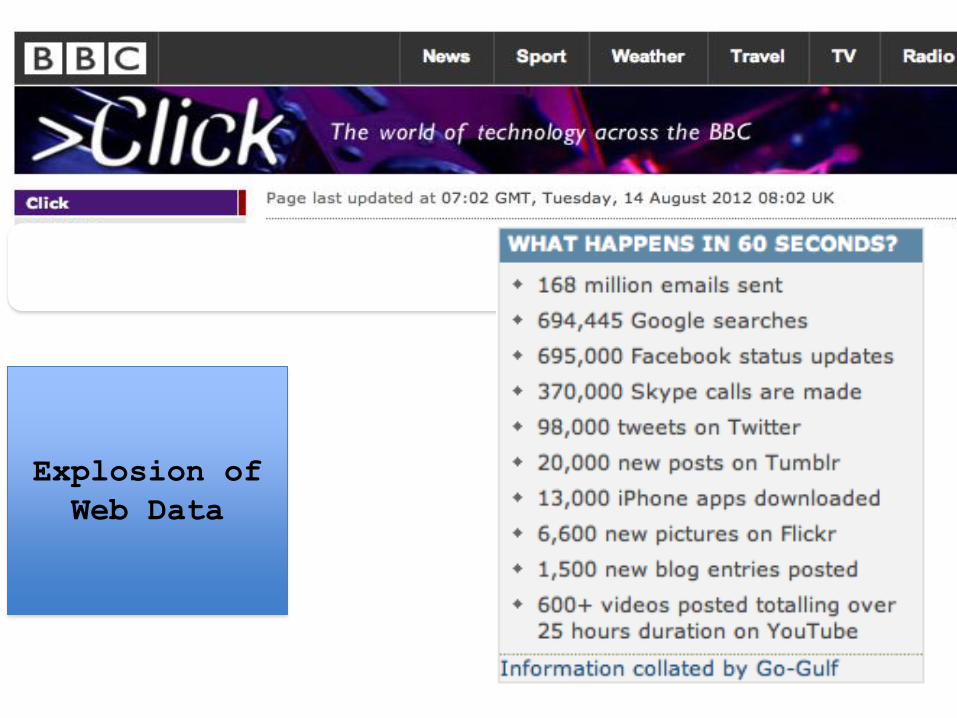
What happens in 60 seconds on the Internet?
4
Explosion of
Web Data
5
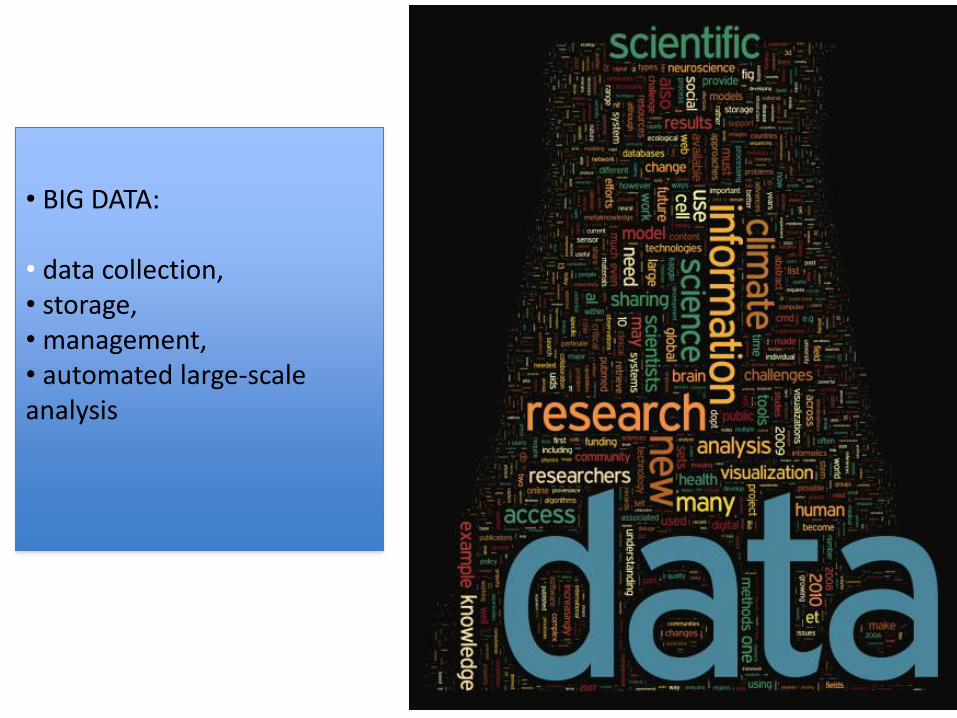
• BIG DATA: • data collection, • storage, • management, • automated large-scale analysis

Research interests
BIG DATA Algorithms and
MACHINE LEARNING
SOCIAL and ECONOMICS
• characterization • models • incentives • privacy • network effects • crowdsourcing • anti-social behavior • spam and malware s
• algorithms around social networks • VERY large graphs • data mining • analytics
• Systems • Infrastructure • cloud • characterization

The fundamental challenge of Big Data
is not collecting data -- it's making
sense of it.
1) What is the starting point?
2) What are the computation paths to discovery?
3) What are the appropriate algorithms?
3) How to visualize the findings?
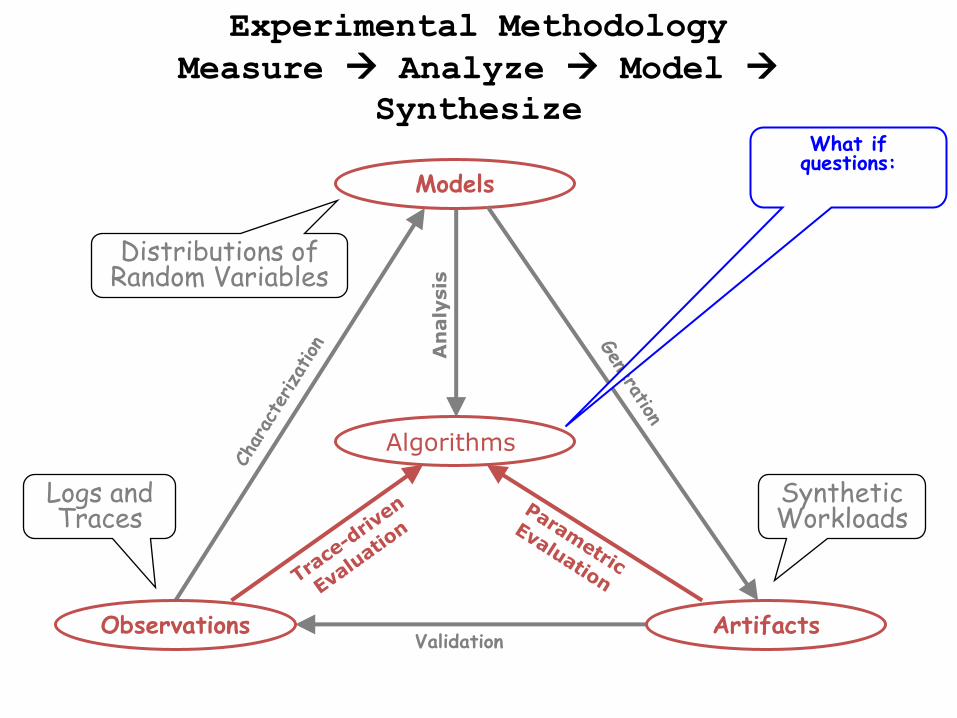
Experimental Methodology
Measure Analyze Model
Synthesize
Models
An
aly
sis
Validation Observations Artifacts
Algorithms
Distributions of Random Variables
Synthetic Workloads
Logs and Traces
What if questions:
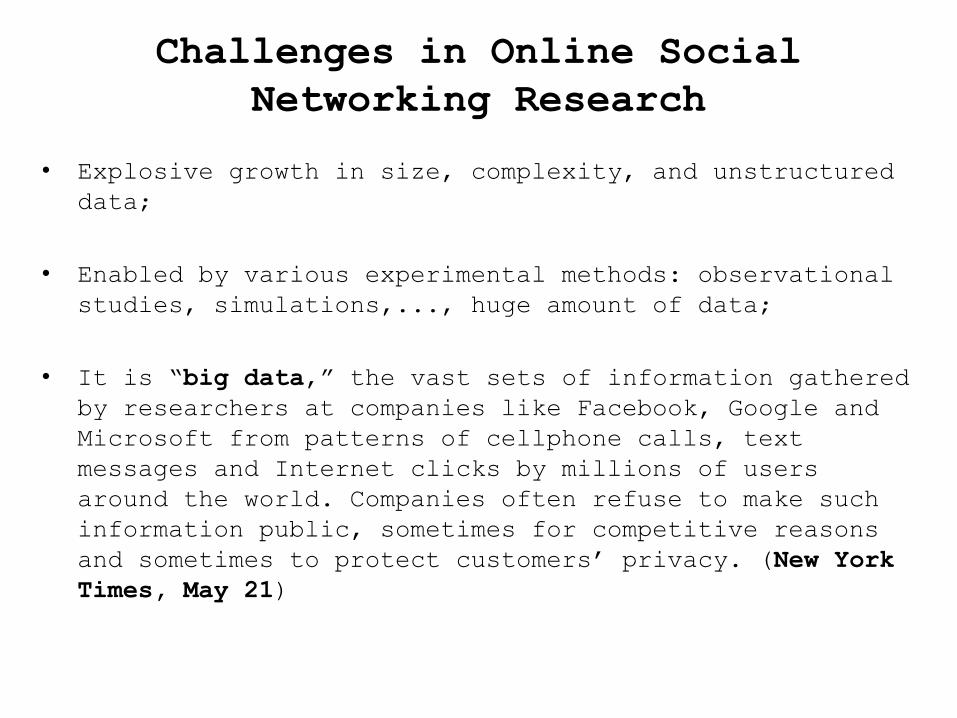
Challenges in Online Social
Networking Research
• Explosive growth in size, complexity, and unstructured
data;
• Enabled by various experimental methods: observational
studies, simulations,..., huge amount of data;
• It is “big data,” the vast sets of information gathered
by researchers at companies like Facebook, Google and
Microsoft from patterns of cellphone calls, text
messages and Internet clicks by millions of users
around the world. Companies often refuse to make such
information public, sometimes for competitive reasons
and sometimes to protect customers’ privacy. (New York
Times, May 21)
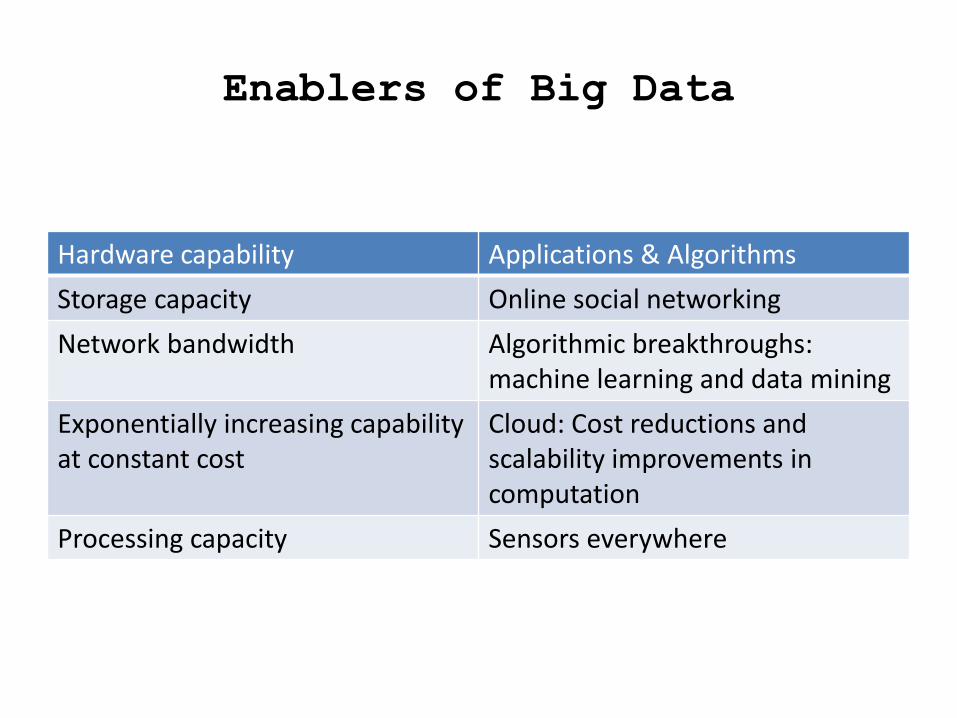
Enablers of Big Data
Hardware capability Applications & Algorithms
Storage capacity Online social networking
Network bandwidth Algorithmic breakthroughs: machine learning and data mining
Exponentially increasing capability at constant cost
Cloud: Cost reductions and scalability improvements in computation
Processing capacity Sensors everywhere

Price of 1 gigabyte of storage over time
11
Year Cost
1981 $300,000
1987 $50,000
1990 $10,000
1994 $1000
1997 $100
2000 $10
2004 $1
2012 $0.10

OSN Research Focus
1.Understand: characteristics of social
graphs of real data;
2.Discover: properties of social graphs;
3.Engineer: social graph built.
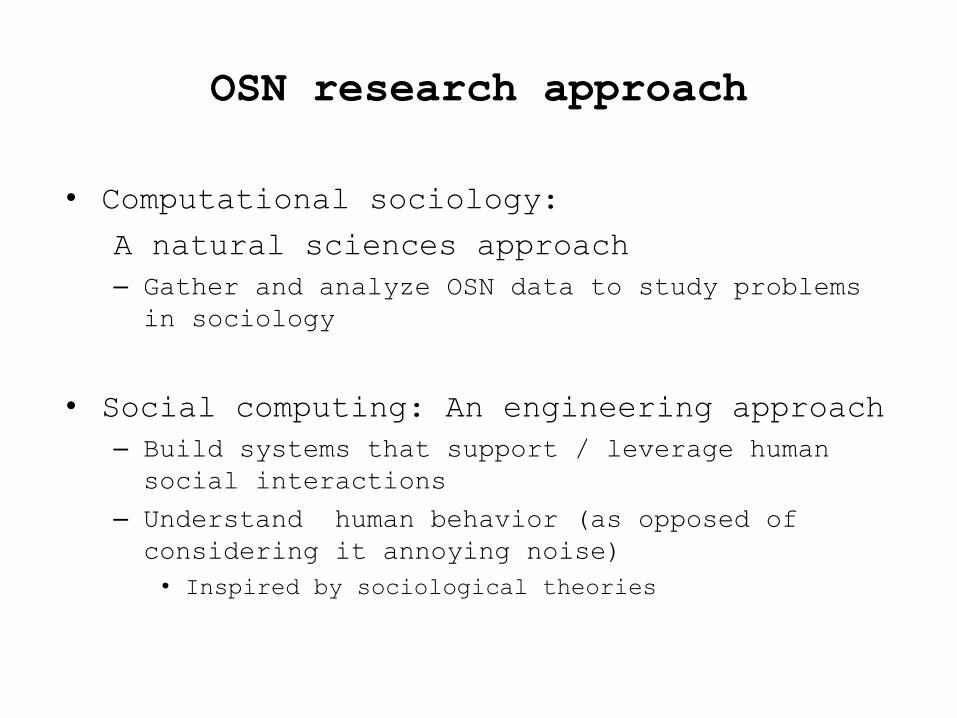
OSN research approach
• Computational sociology:
A natural sciences approach
– Gather and analyze OSN data to study problems
in sociology
• Social computing: An engineering approach
– Build systems that support / leverage human
social interactions
– Understand human behavior (as opposed of
considering it annoying noise)
• Inspired by sociological theories
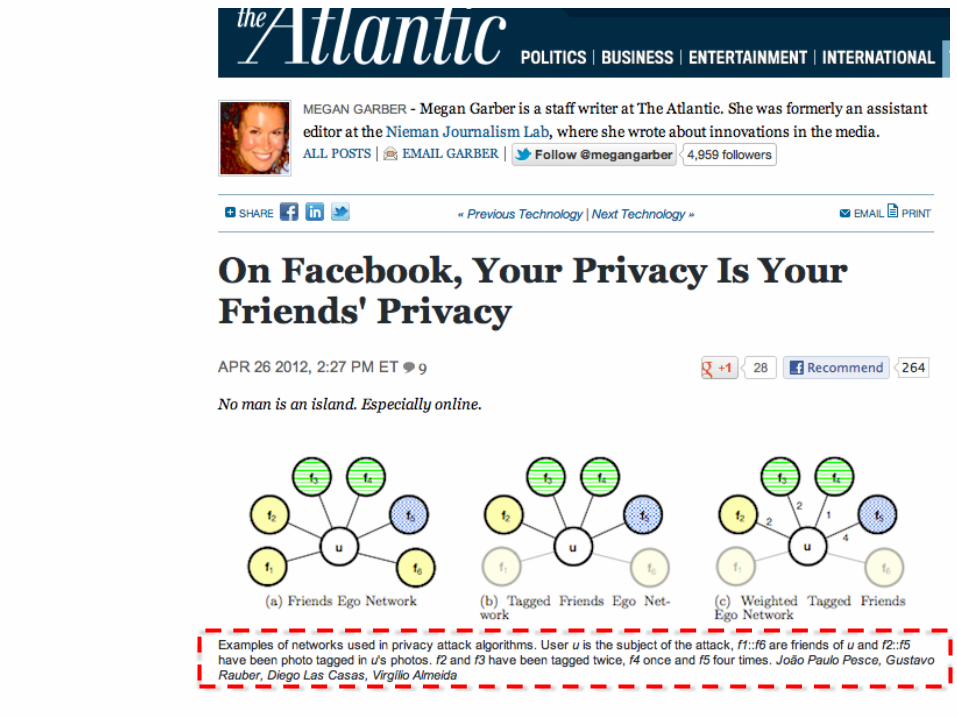
The Atlantic
15
16
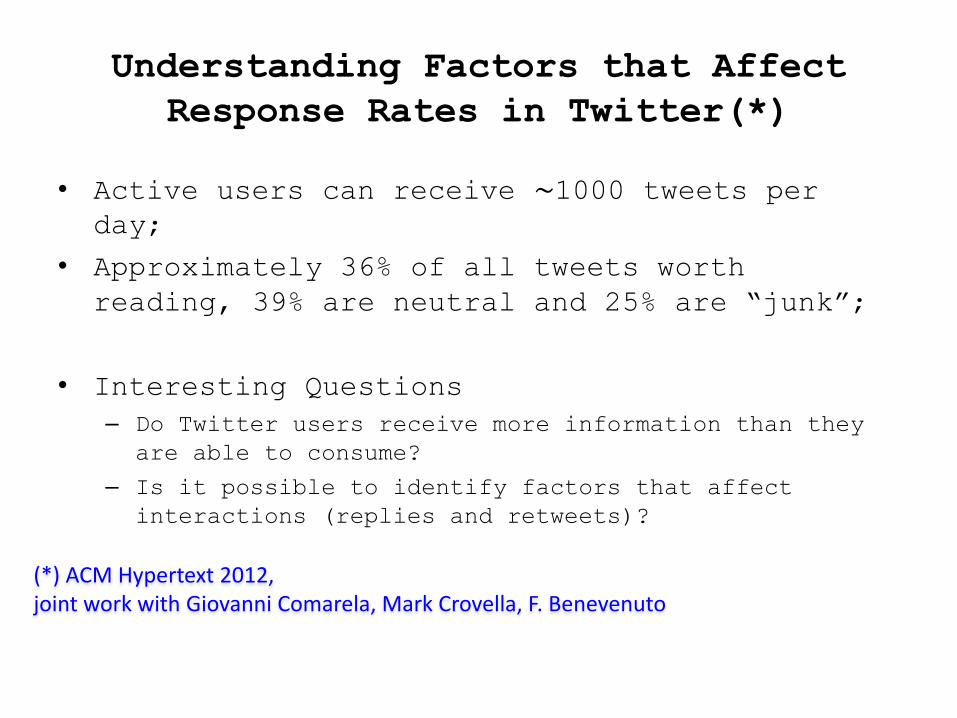
Understanding Factors that Affect
Response Rates in Twitter(*)
• Active users can receive ∼1000 tweets per day;
• Approximately 36% of all tweets worth
reading, 39% are neutral and 25% are “junk”;
• Interesting Questions
– Do Twitter users receive more information than they
are able to consume?
– Is it possible to identify factors that affect
interactions (replies and retweets)?
(*) ACM Hypertext 2012, joint work with Giovanni Comarela, Mark Crovella, F. Benevenuto
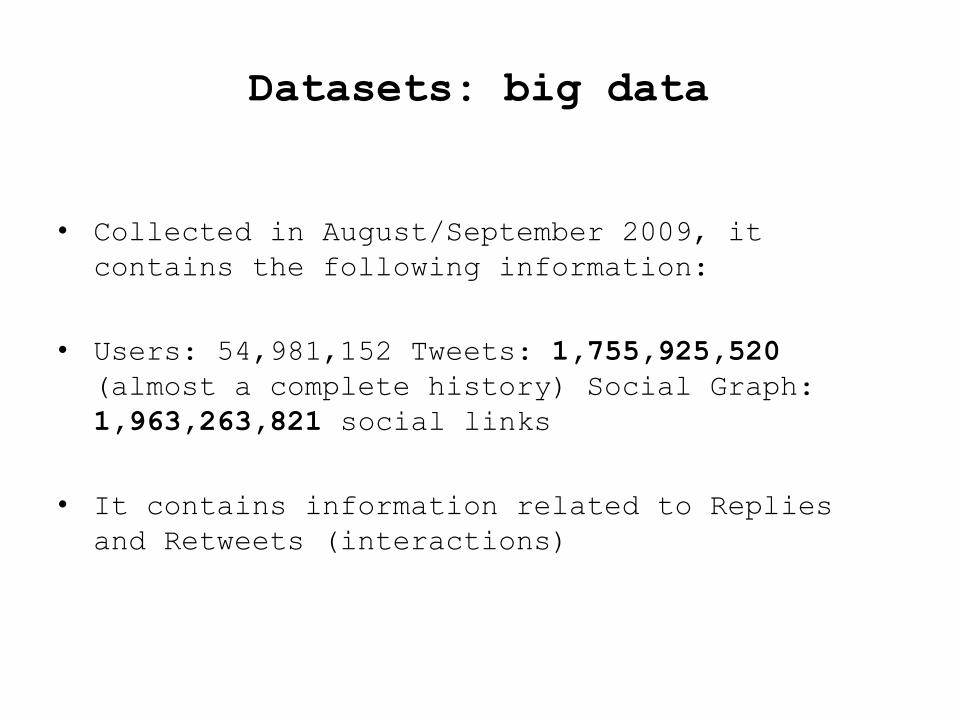
Datasets: big data
• Collected in August/September 2009, it
contains the following information:
• Users: 54,981,152 Tweets: 1,755,925,520
(almost a complete history) Social Graph:
1,963,263,821 social links
• It contains information related to Replies
and Retweets (interactions)
Characterization
• Waiting Times (overload evidence)
– How long does a tweet wait in the timeline to
be replied (retweeted)?
• Factors that affect interactions
– Message Age
– Previous Interactions
– Sending Rate

Waiting Times

Message Age
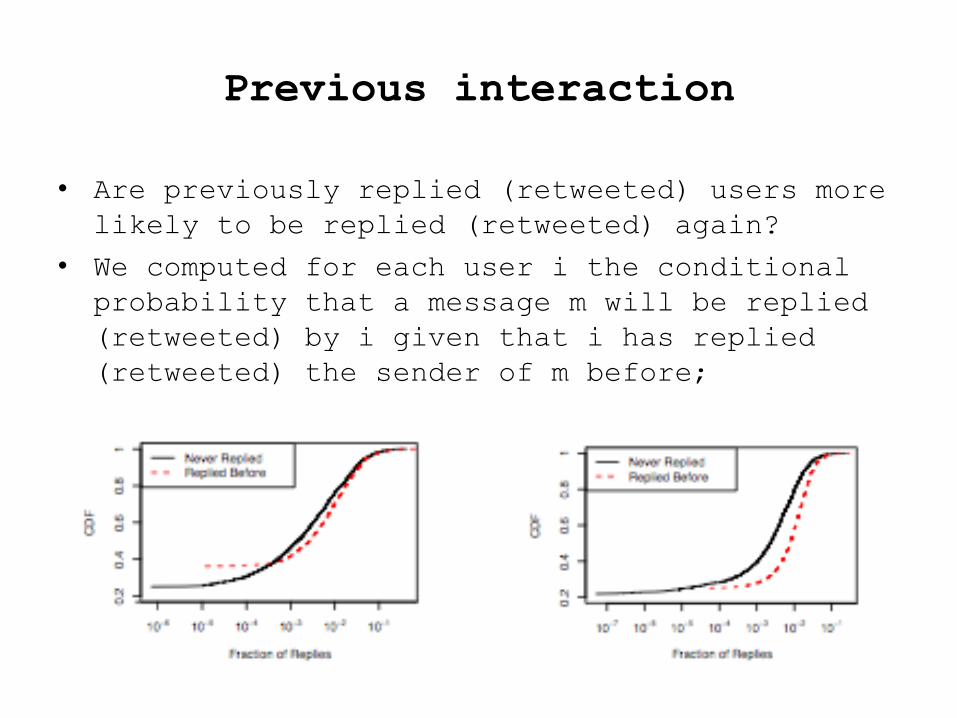
Previous interaction
• Are previously replied (retweeted) users more
likely to be replied (retweeted) again?
• We computed for each user i the conditional
probability that a message m will be replied
(retweeted) by i given that i has replied
(retweeted) the sender of m before;

Sending rate
• Are users with a higher sending rate more
likely to be replied (retweeted)?
• For each user i, for each j ∈ Outi we compared the sending rate of j with the
fraction of her tweets replied (retweeted) by
i.
Reorganizing the Twitter
Timeline
• Use the knowledge presented in order to create a
new way to show tweets for the users
• More interesting tweets (more likely to be replied
or retweeted) in the top of the timeline.
• Two schemes
– Naive Bayes (NB)
– Support Vector Machine (SVM)
– Three attributes
• Age(m): Age of m
• SR(m): Sending rate of the sender of m
• I(m): Binary indicator for previous
interactions with the sender of m
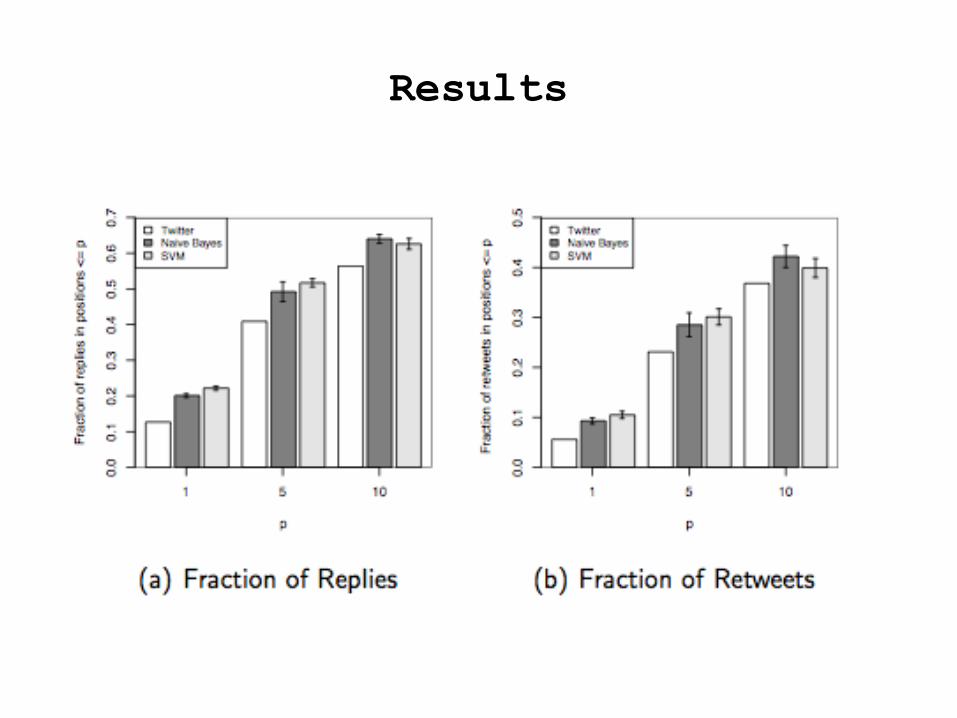
Results
Google+
26
New Kid on the Block: Exploring the Google+ Social Graph, ACM Internet Measurement Conference, Sigcomm, 2012, Boston Joint work with: G. Magno, G. Comarela, D. Saez and Meeyong Cha.

Online Social Networks
• OSNs now reach 82% of the world’s
Internet-using population (1.2
billion)
• Social Networking accounts for 19%
of all time spent online
Social Networking is the most popular online activity worldwide
Source: comScore, December 21, 2011 27
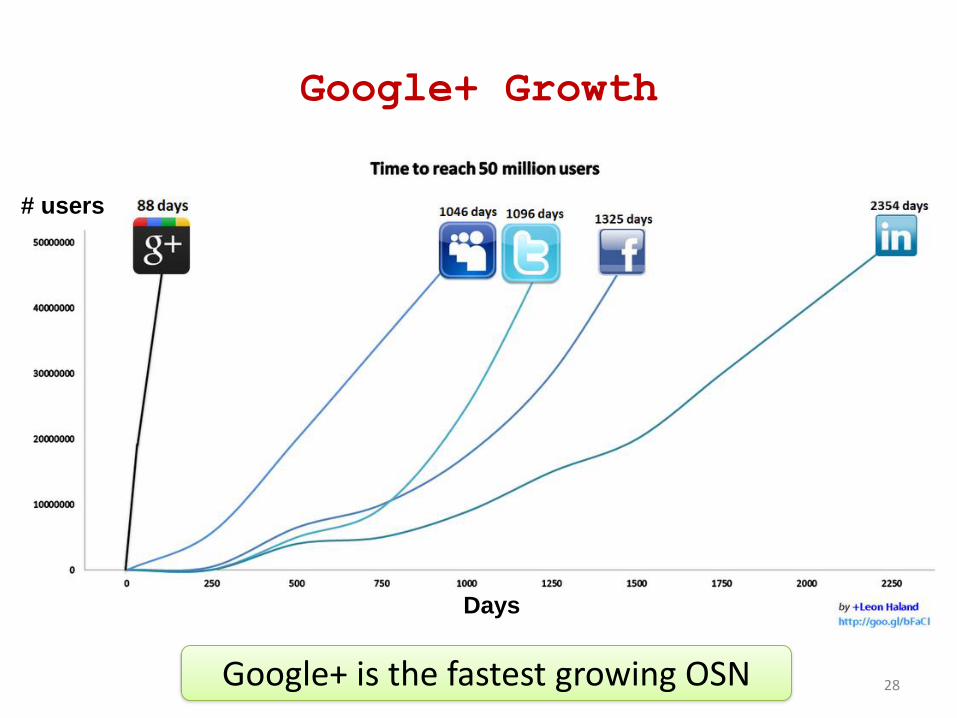
Google+ Growth
28 Google+ is the fastest growing OSN
Days
# users
Goal: characterization
• Analyze how much and what kind of personal
information people share in Google+
• Measure statistics of the Google+ social
graph and compare with other OSNs
• Evaluate the impact of geography on user
behavior in Google+
29

Dataset: big data
• Nov. 11th Dec.
27th (2011)
• 27,556,390 profiles
• 35,114,957 nodes
• 575,141,097 edges
30
What kind of information do
people share more?

Privacy Concerns
• Users revealing more information on their
profiles have greater risk in privacy
• In Facebook (young users, to friends)¹:
– 64.1% share e-mail
– 10.7% share telephone
– 10.7% share home address
32

What kind of information do
people share more?
• In Google+ (public):
– 0.22% share Work contact
– 0.21% share Home contact
– 0.26% share telephone numbers (72,736
users)
• Users that shared telephone: tel-users
33
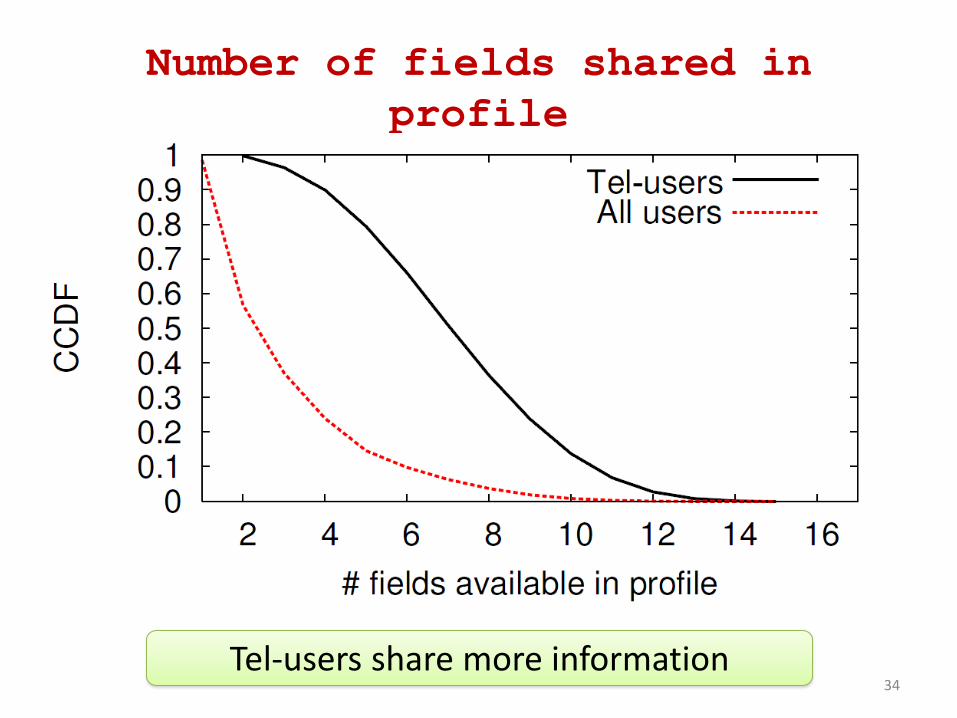
Number of fields shared in
profile
34 Tel-users share more information

Information shared by users
Women are less likely to share
phone number
The majority of tel-users are single; a smaller
fraction of them are in a relationship.
Fraction of Indian users in the tel-users group is twice as big as in other countries
35

How are people connected on
Google+?
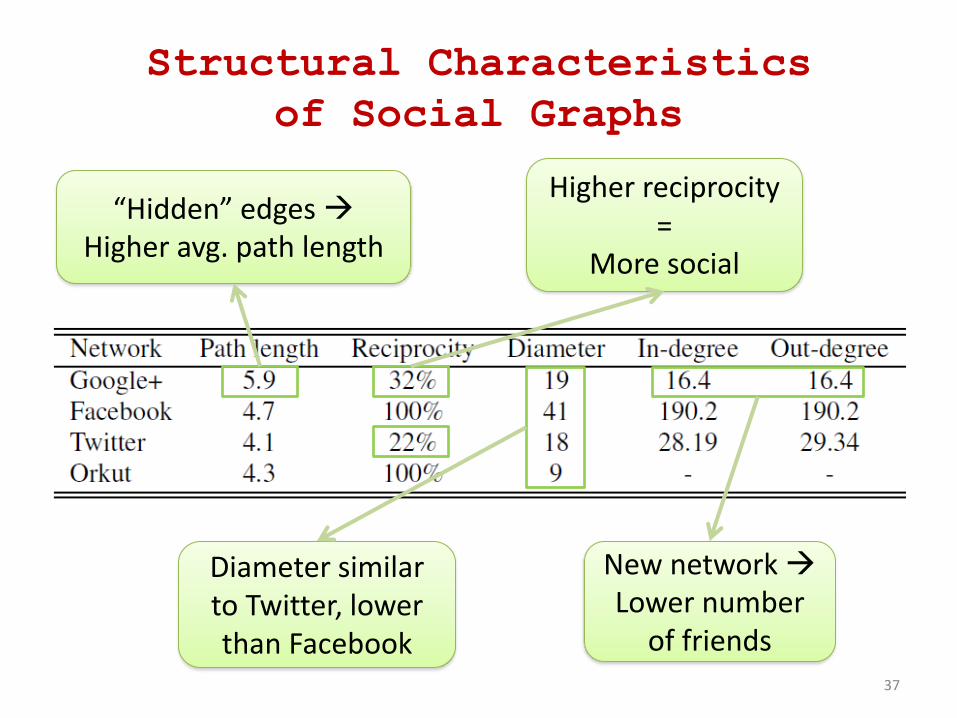
Structural Characteristics
of Social Graphs
37
New network Lower number
of friends
Higher reciprocity =
More social
“Hidden” edges Higher avg. path length
Diameter similar to Twitter, lower than Facebook
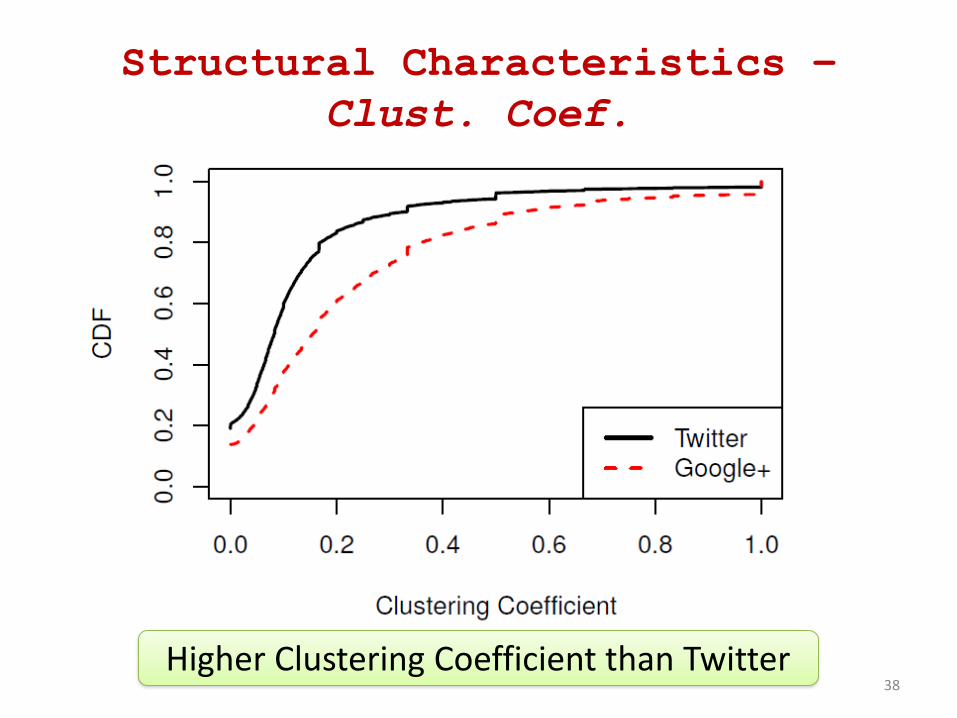
Structural Characteristics –
Clust. Coef.
Higher Clustering Coefficient than Twitter 38
What is the impact of geography
on the social relationships?
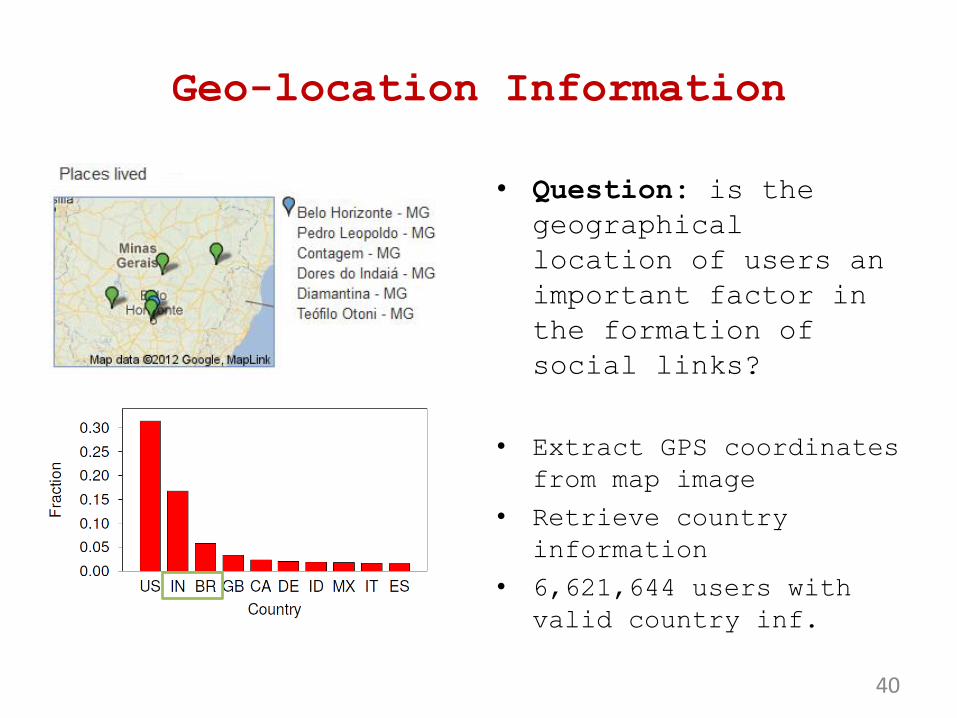
Geo-location Information
• Question: is the
geographical
location of users an
important factor in
the formation of
social links?
• Extract GPS coordinates
from map image
• Retrieve country
information
• 6,621,644 users with
valid country inf.
40
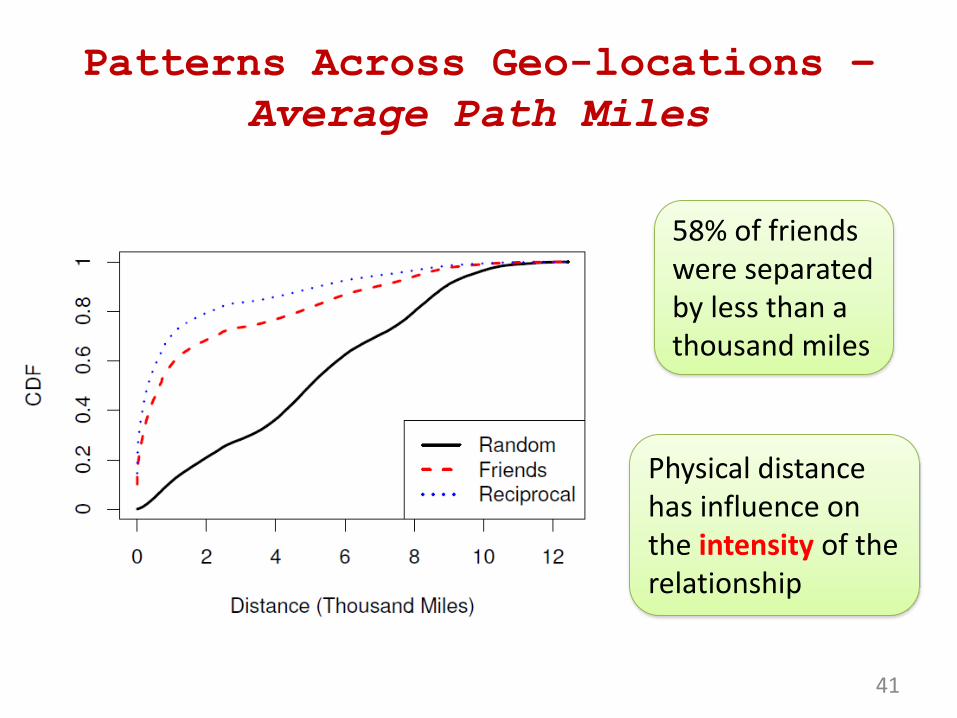
Patterns Across Geo-locations –
Average Path Miles
58% of friends were separated by less than a thousand miles
Physical distance has influence on the intensity of the relationship
41

Social Links Across Geography are users in the same country more likely to be
friends than users in different countries
42
US is dominant on the influx of edges
Populous countries have more self-loops
G+ Observations
• Google+ is more social than Twitter
– Higher reciprocity
– Higher clustering coefficient
– Reflects offline relationship
• Users exhibit different notions and
expectations in Google+, based on
geography
– Privacy
– Content
– Connections
43
Concluding Remarks
• Big data has created new opportunities for
scientific discoveries in the realm of
social computing:
– user preference understanding
– data mining
– summarization and aggregation
– explorative analysis of large data sets
– privacy
– scalable services