Exploratory Data Analysis for Ecological Modelling...
35
1 5th ECEM conference, Pushchino, Russia, 19-23.9.2005 1 Exploratory Data Analysis Exploratory Data Analysis for Ecological Modelling and for Ecological Modelling and Decision Support Decision Support Gennady Andrienko & Natalia Andrienko Fraunhofer Institute AIS Sankt Augustin Germany http://www.ais.fraunhofer.de/and 5th ECEM conference, Pushchino, Russia, 19-23.9.2005 2 Outline Outline 1. Geo-visualisation’s view on ecological modelling: demanding problems and challenging tasks 2. Case study 1: pesticide accumulation 3. Case study 2: forest dynamics 4. A systematic approach to exploratory data analysis (EDA): elements of the general theory 5. Software issues
Transcript of Exploratory Data Analysis for Ecological Modelling...
1
5th ECEM conference, Pushchino, Russia, 19-23.9.2005 1
Exploratory Data Analysis Exploratory Data Analysis for Ecological Modelling and for Ecological Modelling and
Decision SupportDecision Support
Gennady Andrienko & Natalia AndrienkoFraunhofer Institute AISSankt AugustinGermanyhttp://www.ais.fraunhofer.de/and
5th ECEM conference, Pushchino, Russia, 19-23.9.2005 2
OutlineOutline1. Geo-visualisation’s view on ecological
modelling: demanding problems and challenging tasks
2. Case study 1: pesticide accumulation3. Case study 2: forest dynamics4. A systematic approach to exploratory
data analysis (EDA): elements of the general theory
5. Software issues
2
5th ECEM conference, Pushchino, Russia, 19-23.9.2005 3
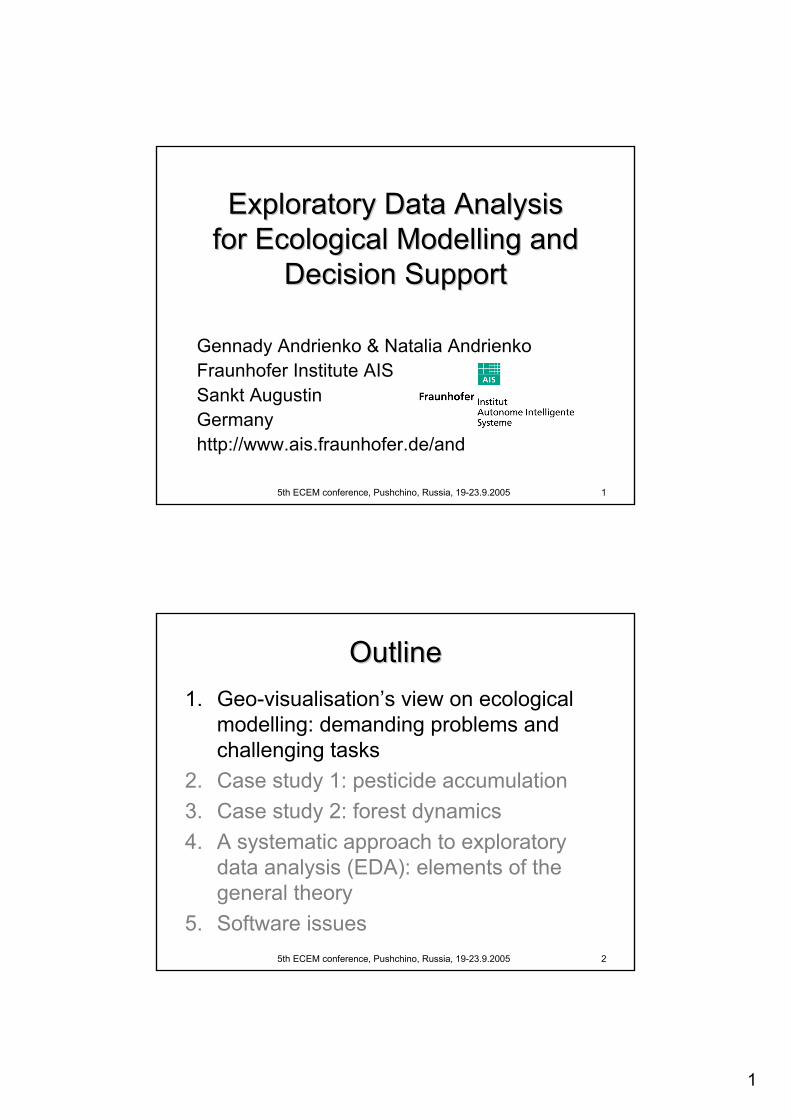
A View on Ecological ModellingA View on Ecological Modelling
Model
Input data
Output data
May have many parameters;May contain errors
Need to be interpreted;To be used for informed decision making
Complex and multidimensional;May contain errors Data
Complexity:
1) Space, 2) Time, 3) Multiple attributes & dimensions, 4) Variability of values, abrupt changes
5th ECEM conference, Pushchino, Russia, 19-23.9.2005 4
Outputs of simulationsOutputs of simulations• Multiple attributes referring to
– Simulation scenarios;– Spatial locations (objects);– Time moments;– … (e.g. species, age groups etc.)

3
5th ECEM conference, Pushchino, Russia, 19-23.9.2005 5
ComplexitiesComplexities• Number of attributes• Length of time series• Number of spatial objects• High dimensionality => huge number of
combinations (normally 105-108)!• Abrupt temporal changes• Great variability of values
5th ECEM conference, Pushchino, Russia, 19-23.9.2005 6
Complexities: example 1Complexities: example 1
4
5th ECEM conference, Pushchino, Russia, 19-23.9.2005 7
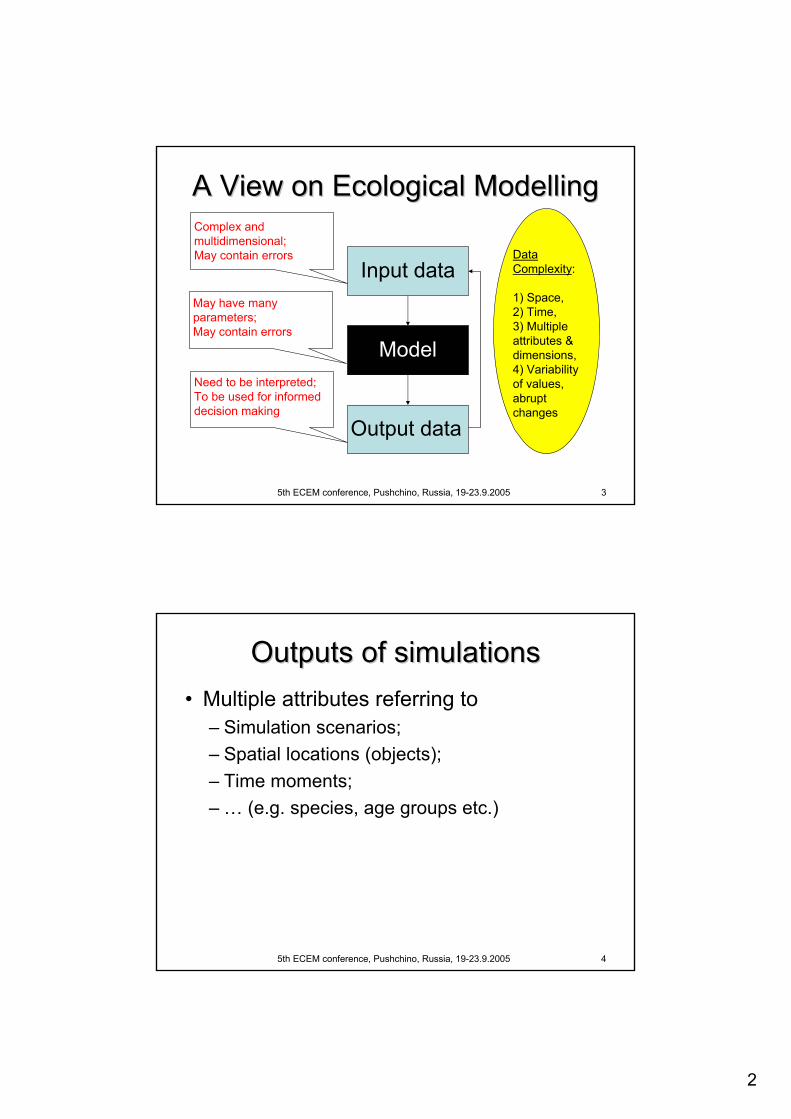
Complexities: example 2Complexities: example 2
5th ECEM conference, Pushchino, Russia, 19-23.9.2005 8
Our goalsOur goalsSupport analysts and decision makers in:
Preparing and harmonizing input data;Tuning models and their parameters;Interpreting outputs of simulation;Exploring alternatives for decision making;Justifying and communicating the resulting decisions.
Instruments: interactive visualisationenhanced by intelligent aggregation toolsand other tools for exploratory data analysis

5
5th ECEM conference, Pushchino, Russia, 19-23.9.2005 9
OutlineOutline1. Geo-visualisation’s view on ecological
modelling: demanding problems and challenging tasks
2. Case study 1: pesticide accumulation3. Case study 2: forest dynamics4. A systematic approach to exploratory
data analysis (EDA): elements of the general theory
5. Software issues
5th ECEM conference, Pushchino, Russia, 19-23.9.2005 10
GIMMI projectGIMMI project
Geographical Information and Mathematic Model Interoperability
IST-2001-34245, 2002 – 2004TXT Italy, EIG Germany, AIS Germany…
Multiple simulation scenarios (different crops and active ingredients)
about 1000 plots
simulation depth: 10+ years
several output variables that characterize various environmental aspects (pesticide accumulation etc.)

6
5th ECEM conference, Pushchino, Russia, 19-23.9.2005 11
Decisions to be madeDecisions to be made
What crop ?What active ingredient ?In what concentration ?
… for individual plots… and for the whole territory
5th ECEM conference, Pushchino, Russia, 19-23.9.2005 12
Pesticide accumulation dynamicsPesticide accumulation dynamics
• In fact, we see the extreme values only!
• Zoom?
7
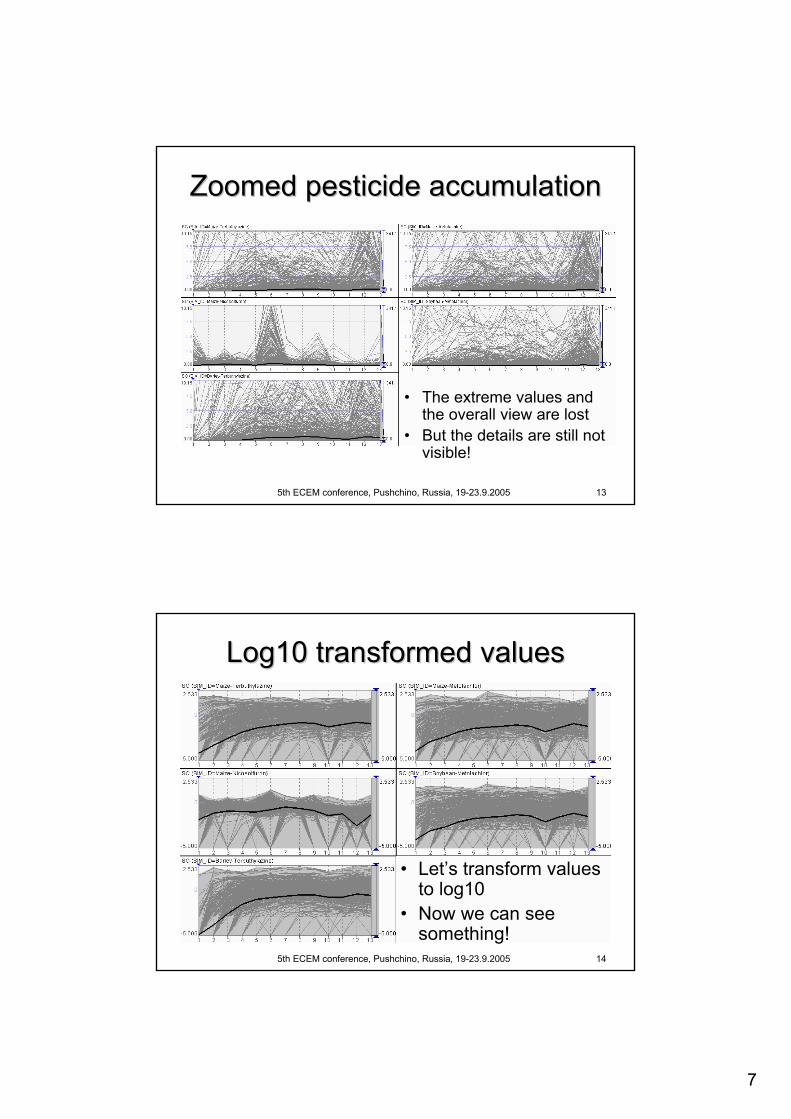
5th ECEM conference, Pushchino, Russia, 19-23.9.2005 13
Zoomed pesticide accumulationZoomed pesticide accumulation
• The extreme values and the overall view are lost
• But the details are still not visible!
5th ECEM conference, Pushchino, Russia, 19-23.9.2005 14
Log10 transformed valuesLog10 transformed values
• Let’s transform values to log10
• Now we can see something!
8
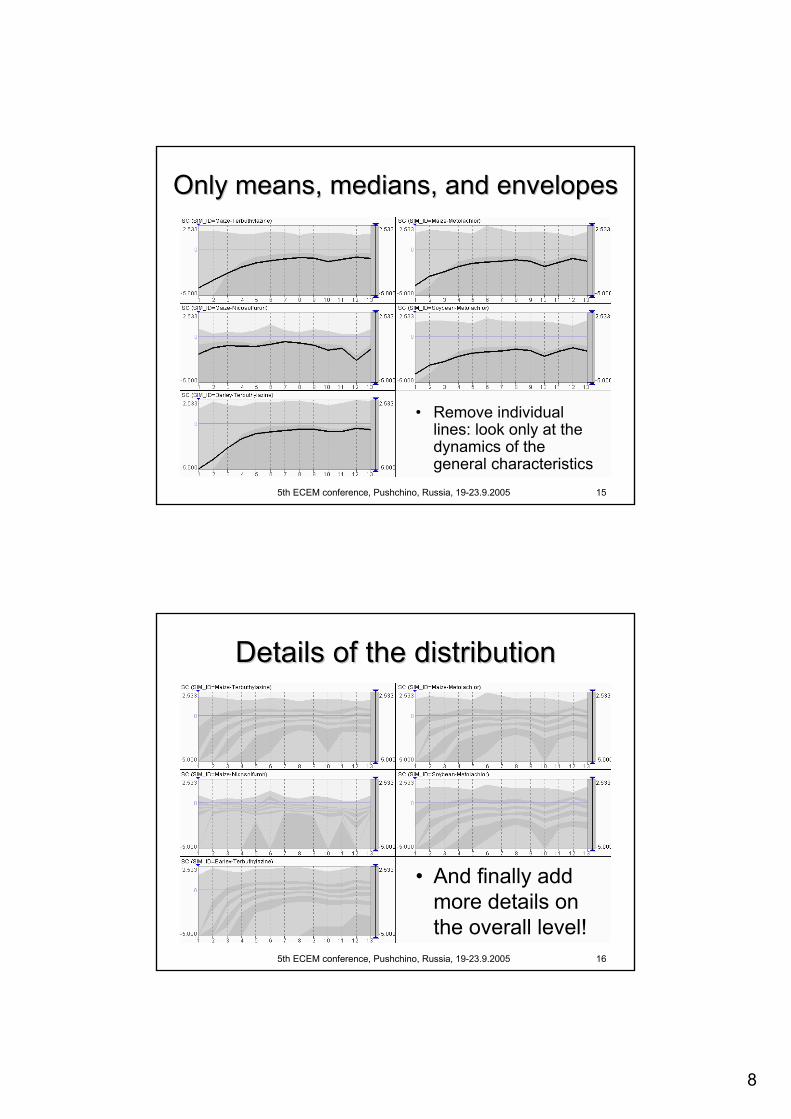
5th ECEM conference, Pushchino, Russia, 19-23.9.2005 15
Only means, medians, and envelopesOnly means, medians, and envelopes
• Remove individual lines: look only at the dynamics of the general characteristics
5th ECEM conference, Pushchino, Russia, 19-23.9.2005 16
Details of the distributionDetails of the distribution
• And finally add more details on the overall level!
9
5th ECEM conference, Pushchino, Russia, 19-23.9.2005 17
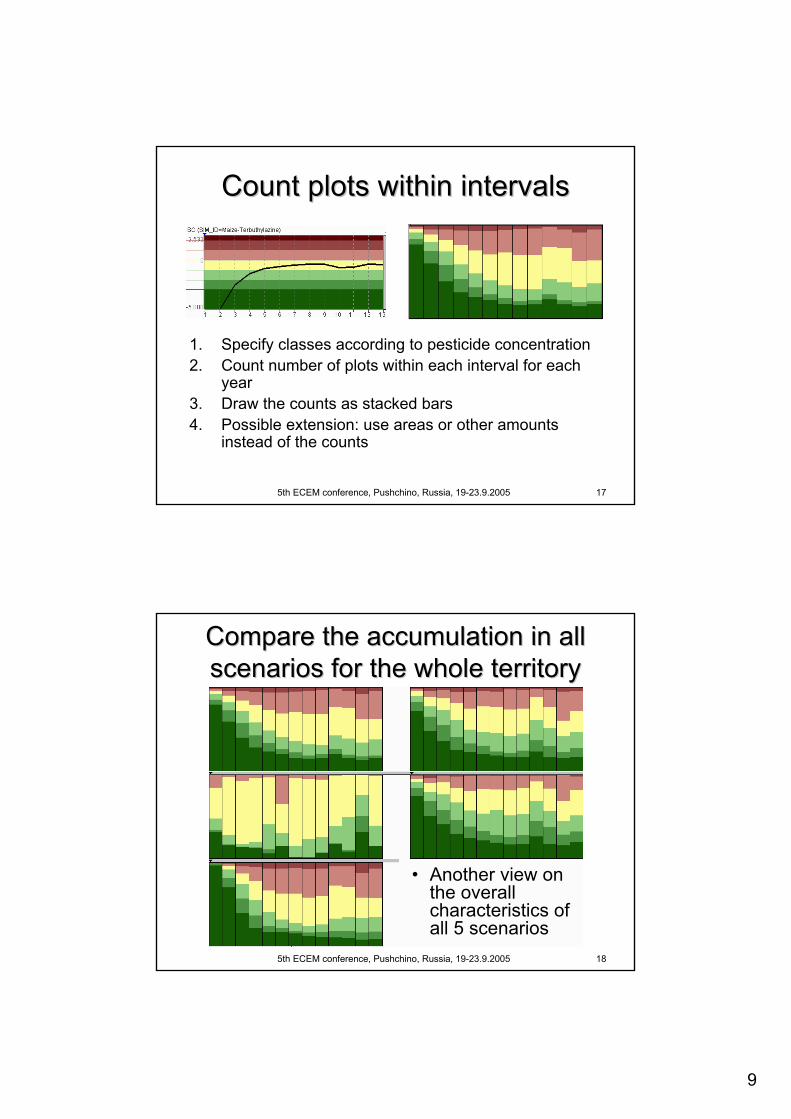
Count plots within intervalsCount plots within intervals
1. Specify classes according to pesticide concentration2. Count number of plots within each interval for each
year3. Draw the counts as stacked bars4. Possible extension: use areas or other amounts
instead of the counts
5th ECEM conference, Pushchino, Russia, 19-23.9.2005 18
Compare the accumulation in all Compare the accumulation in all scenarios for the whole territoryscenarios for the whole territory
• Another view on the overall characteristics of all 5 scenarios
10
5th ECEM conference, Pushchino, Russia, 19-23.9.2005 19
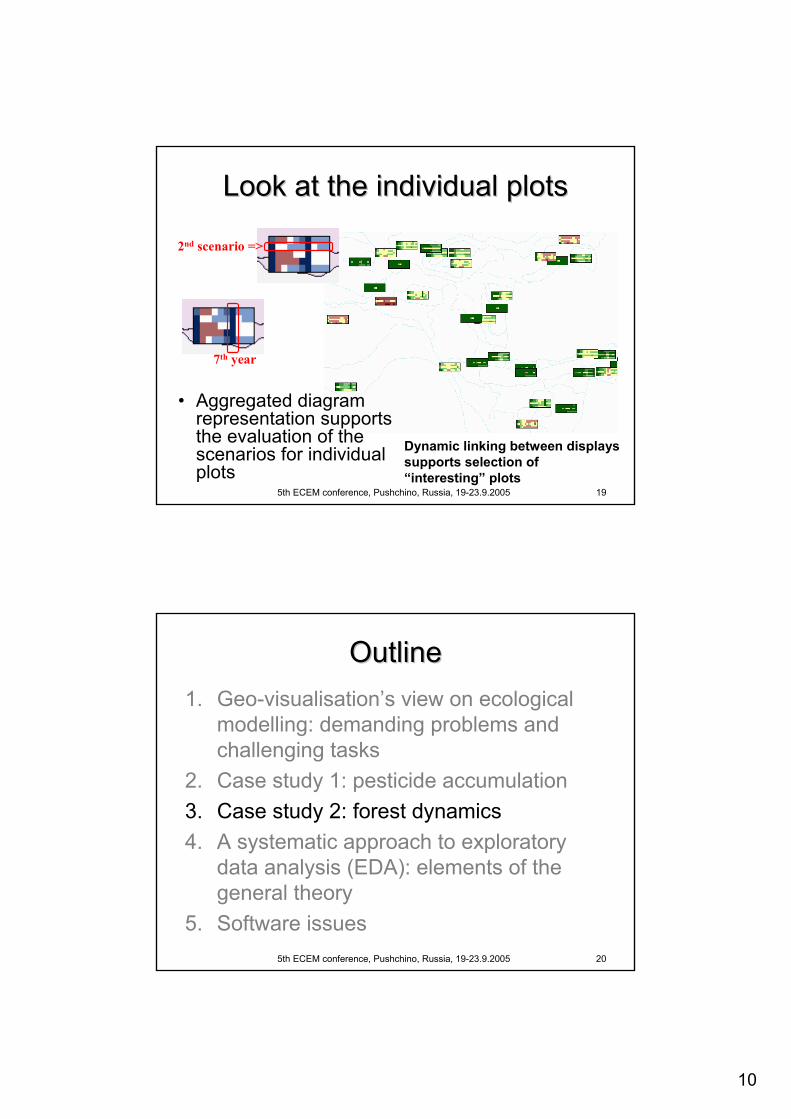
Look at the individual plotsLook at the individual plots
2nd scenario =>
7th year
• Aggregated diagram representation supports the evaluation of the scenarios for individual plots
Dynamic linking between displays supports selection of “interesting” plots
5th ECEM conference, Pushchino, Russia, 19-23.9.2005 20
OutlineOutline1. Geo-visualisation’s view on ecological
modelling: demanding problems and challenging tasks
2. Case study 1: pesticide accumulation3. Case study 2: forest dynamics4. A systematic approach to exploratory
data analysis (EDA): elements of the general theory
5. Software issues

11
5th ECEM conference, Pushchino, Russia, 19-23.9.2005 21
SilvicsSilvics projectproject
SILVICS - Silvicultural Systems for Sustainable Forest Resources Management Univ. Wageningen (NL), EFI (FI), AIS (DE), RAS (RU)INTAS, 2002-2005
104 forest compartments 4 scenarios of development:
NATuralSelective CUttingLegal RUssianILLegal
Simulation results for 200 years (41 time moments)
6 species 13 age groups
104*4*41*6*13=1,000,000 combinationsFor these combinations: 20 attributes!
5th ECEM conference, Pushchino, Russia, 19-23.9.2005 22
Compare biomass in two scenariosCompare biomass in two scenarios
SCU: rather stable number of forest compartments in all classes; LRU: high temporal variability

12
5th ECEM conference, Pushchino, Russia, 19-23.9.2005 23
Look at biodiversity: Look at biodiversity: Dominant Species/Age classificationDominant Species/Age classification
Two interactively specified thresholds1. Presence2. Dominance level
Oak, 7th age group dominates in some compartments
Tilia, 5th age group is present in some compartments
5th ECEM conference, Pushchino, Russia, 19-23.9.2005 24
Dominant Species and Age Class (1)Dominant Species and Age Class (1)
natural selective
Russian illegal
13
5th ECEM conference, Pushchino, Russia, 19-23.9.2005 25
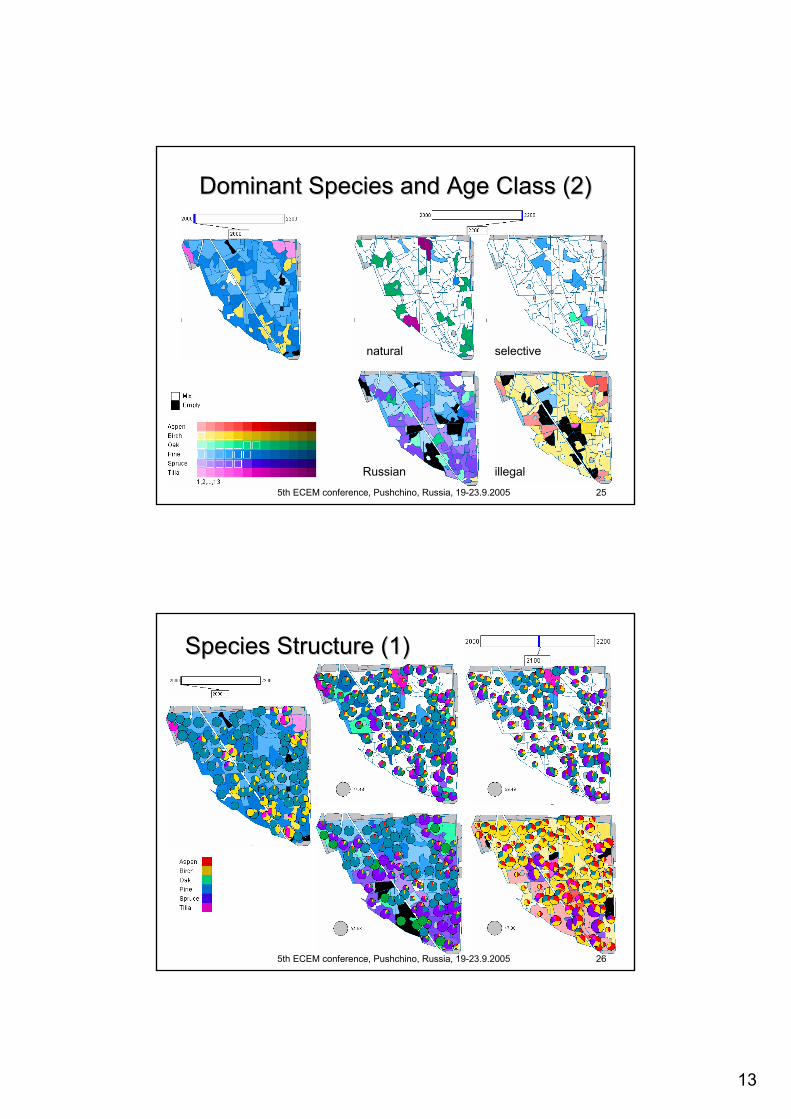
Dominant Species and Age Class (2)Dominant Species and Age Class (2)
natural selective
Russian illegal
5th ECEM conference, Pushchino, Russia, 19-23.9.2005 26
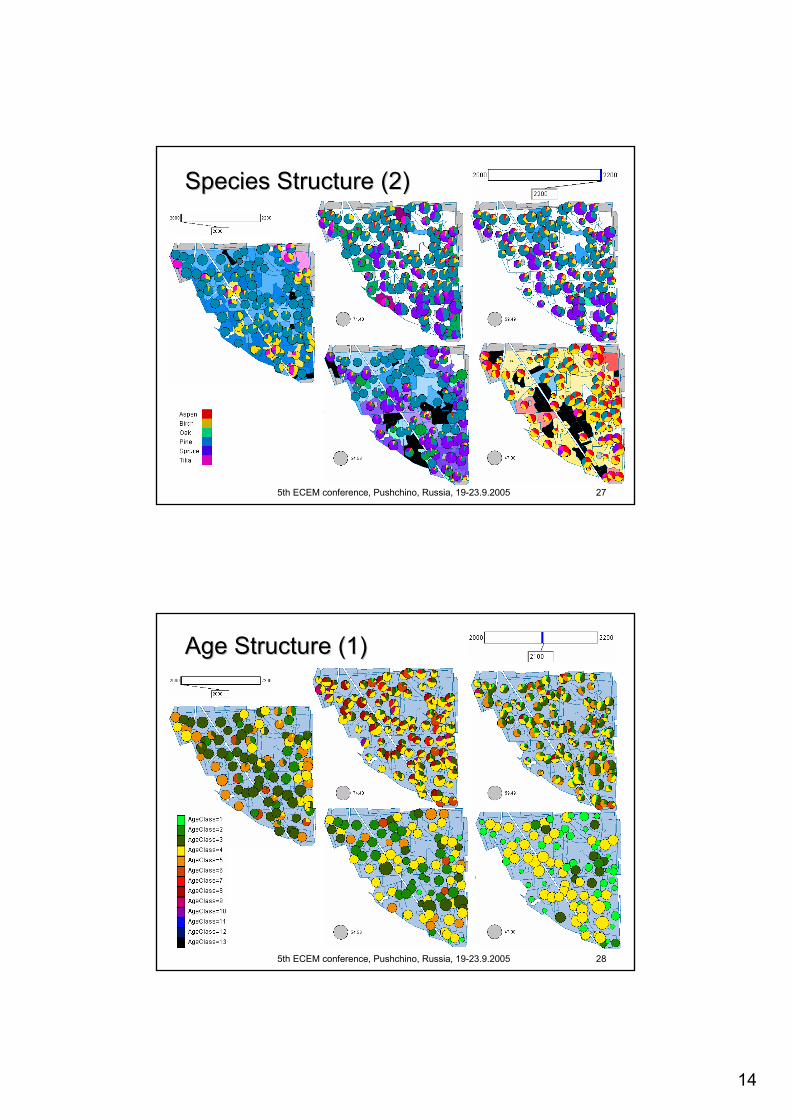
Species Structure (1)Species Structure (1)
14
5th ECEM conference, Pushchino, Russia, 19-23.9.2005 27
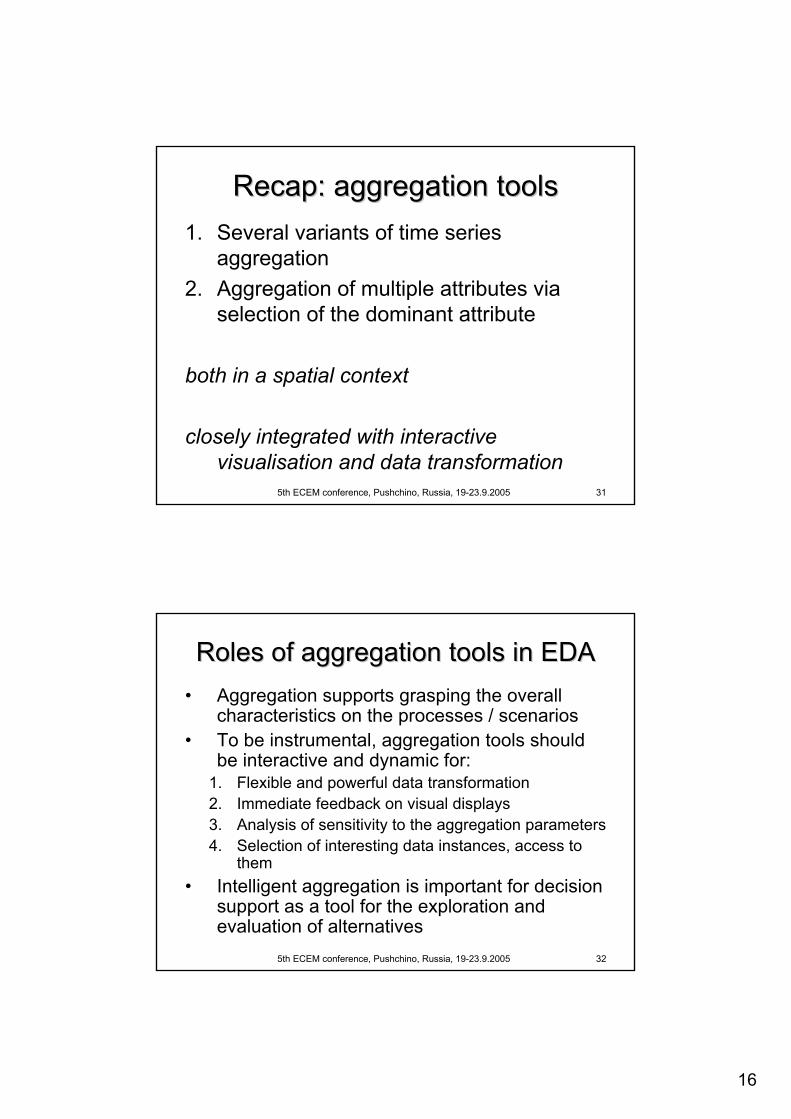
Species Structure (2)Species Structure (2)
5th ECEM conference, Pushchino, Russia, 19-23.9.2005 28
Age Structure (1)Age Structure (1)

15
5th ECEM conference, Pushchino, Russia, 19-23.9.2005 29
Age Structure (2)Age Structure (2)
5th ECEM conference, Pushchino, Russia, 19-23.9.2005 30
OutlineOutline1. Geo-visualisation’s view on ecological
modelling: demanding problems and challenging tasks
2. Case study 1: pesticide accumulation3. Case study 2: forest dynamics4. A systematic approach to exploratory
data analysis (EDA): elements of the general theory
5. Software issues
16
5th ECEM conference, Pushchino, Russia, 19-23.9.2005 31
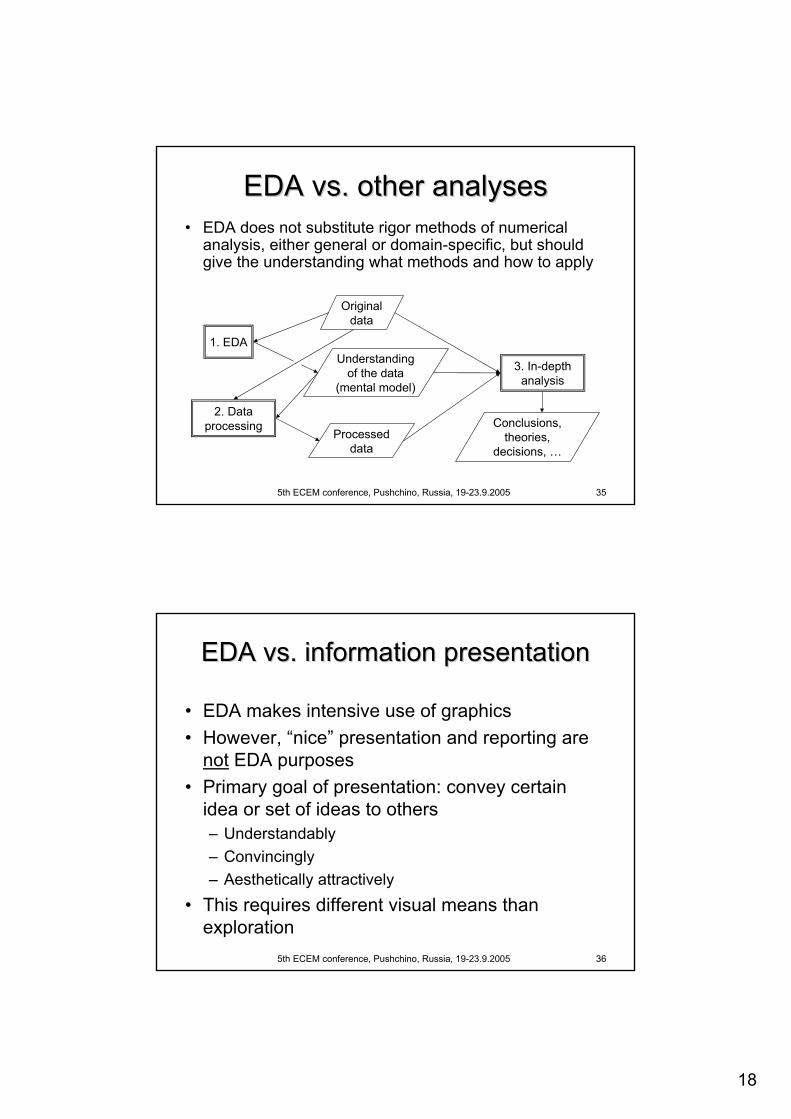
Recap: aggregation toolsRecap: aggregation tools1. Several variants of time series
aggregation2. Aggregation of multiple attributes via
selection of the dominant attribute
both in a spatial context
closely integrated with interactive visualisation and data transformation
5th ECEM conference, Pushchino, Russia, 19-23.9.2005 32
• Aggregation supports grasping the overall characteristics on the processes / scenarios
• To be instrumental, aggregation tools should be interactive and dynamic for:
1. Flexible and powerful data transformation2. Immediate feedback on visual displays3. Analysis of sensitivity to the aggregation parameters4. Selection of interesting data instances, access to
them• Intelligent aggregation is important for decision
support as a tool for the exploration and evaluation of alternatives
Roles of aggregation tools in EDARoles of aggregation tools in EDA

17
5th ECEM conference, Pushchino, Russia, 19-23.9.2005 33
What Is EDA?What Is EDA?• Emerged in statistics in 1970ies; originator: John
Tukey• A philosophy and discipline of unbiased looking
at data: “What can data tell me?” rather than “Do they agree with my expectations?”– Similar to the work of a detective (J.Tukey)
• Need to look at data ⇒ focus on visualisationand user interaction with data displays
5th ECEM conference, Pushchino, Russia, 19-23.9.2005 34
Purposes of EDAPurposes of EDA
• Uncover peculiarities of the data and, on this basis, understand how the data should be further processed (e.g. filtered, transformed, split into parts, fused, …)
• Generate hypotheses for further testing (e.g. using statistical methods)
• Choose proper methods for in-depth analysis (possibly, domain-specific)
18
5th ECEM conference, Pushchino, Russia, 19-23.9.2005 35
EDA vs. other analysesEDA vs. other analyses• EDA does not substitute rigor methods of numerical
analysis, either general or domain-specific, but should give the understanding what methods and how to apply
Original data
1. EDAUnderstanding
of the data (mental model)
2. Data processing
Processed data
3. In-depth analysis
Conclusions, theories,
decisions, …
5th ECEM conference, Pushchino, Russia, 19-23.9.2005 36
EDA vs. information presentationEDA vs. information presentation
• EDA makes intensive use of graphics• However, “nice” presentation and reporting are
not EDA purposes• Primary goal of presentation: convey certain
idea or set of ideas to others– Understandably– Convincingly– Aesthetically attractively
• This requires different visual means than exploration

19
5th ECEM conference, Pushchino, Russia, 19-23.9.2005 37
Case study 3: EDA for the Case study 3: EDA for the exploration of forest defoliationsexploration of forest defoliations
• Large volume: 6169 spatially-referenced time series
• Two dimensions: S&T• Many missing values• No full compatibility
across countries, species, time etc.
Data from NEFIS project
5th ECEM conference, Pushchino, Russia, 19-23.9.2005 38
General procedure of the EDAGeneral procedure of the EDA
1. See the whole– Space + Time → 2 complementary views
1) Evolution of spatial patterns in time2) Distribution of temporal behaviours in space
2. Divide and focus– Data are complex → Have to be explored by slices
and subsets (species, age groups, countries, years, …)
3. Attend to particulars– Detect outliers, strange behaviours, unexpected
patterns, …
20
5th ECEM conference, Pushchino, Russia, 19-23.9.2005 39
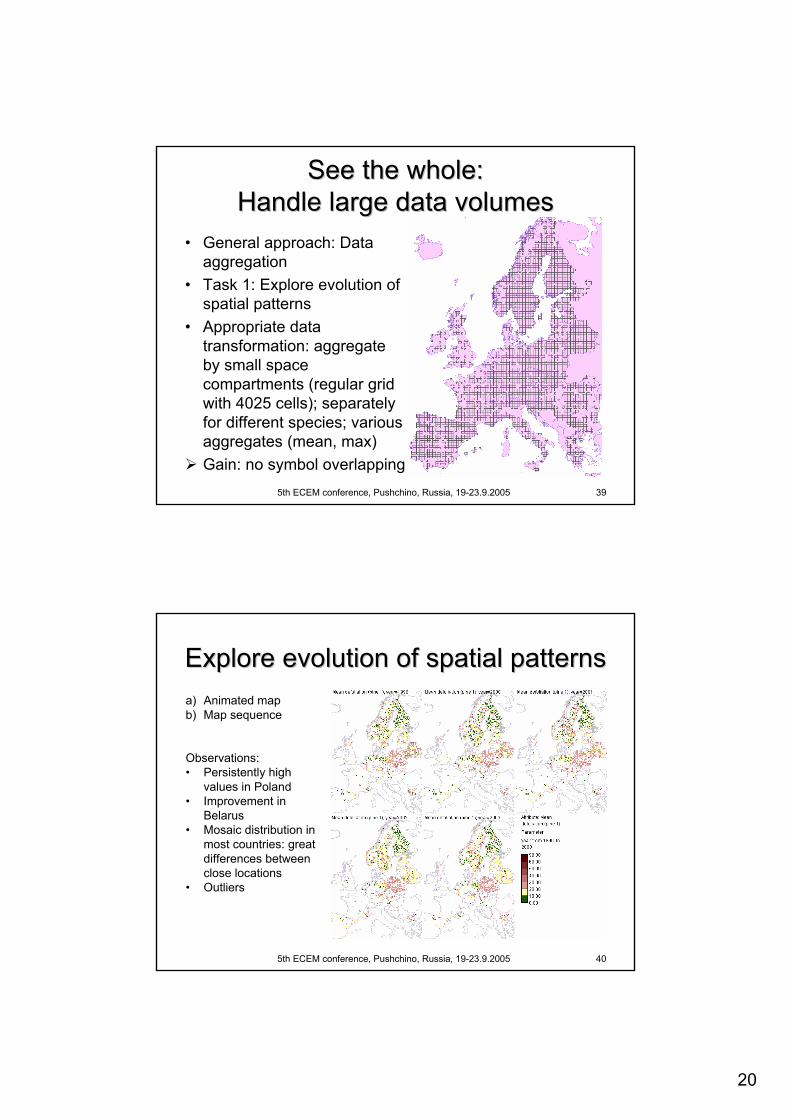
See the whole: See the whole: Handle large data volumesHandle large data volumes
• General approach: Data aggregation
• Task 1: Explore evolution of spatial patterns
• Appropriate data transformation: aggregate by small space compartments (regular grid with 4025 cells); separately for different species; various aggregates (mean, max)Gain: no symbol overlapping
5th ECEM conference, Pushchino, Russia, 19-23.9.2005 40
Explore evolution of spatial patternsExplore evolution of spatial patternsa) Animated mapb) Map sequence
Observations:• Persistently high
values in Poland• Improvement in
Belarus• Mosaic distribution in
most countries: great differences between close locations
• Outliers
21
5th ECEM conference, Pushchino, Russia, 19-23.9.2005 41
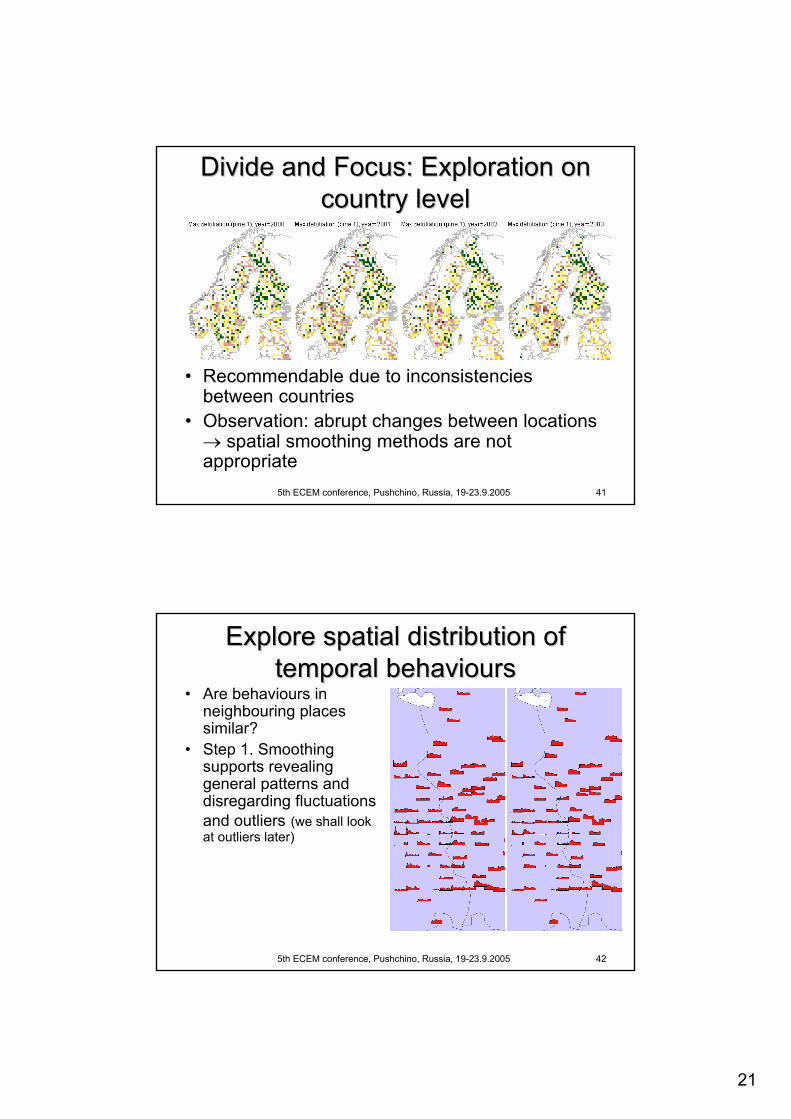
Divide and Focus: Exploration on Divide and Focus: Exploration on country levelcountry level
• Recommendable due to inconsistencies between countries
• Observation: abrupt changes between locations → spatial smoothing methods are not appropriate
5th ECEM conference, Pushchino, Russia, 19-23.9.2005 42
Explore spatial distribution of Explore spatial distribution of temporal behaviourstemporal behaviours
• Are behaviours in neighbouring places similar?
• Step 1. Smoothing supports revealing general patterns and disregarding fluctuations and outliers (we shall look at outliers later)

22
5th ECEM conference, Pushchino, Russia, 19-23.9.2005 43
Explore spatial distribution of Explore spatial distribution of temporal behaviourstemporal behaviours
• Are behaviours in neighbouring places similar?
• Step 2. Temporal comparison (e.g. with particular year, mean for a period) helps to disregard absolute differences in values and thus focus on behaviours
Observation: no strong similarity between neighbouring places
5th ECEM conference, Pushchino, Russia, 19-23.9.2005 44
Compare behaviours in plots with Compare behaviours in plots with different main speciesdifferent main species
• Mosaic signs: – 6 rows for species; – 14 columns for years
1990-2003;– Colours encode
defoliation values
Observation: behaviours differ for different main species
23
5th ECEM conference, Pushchino, Russia, 19-23.9.2005 45
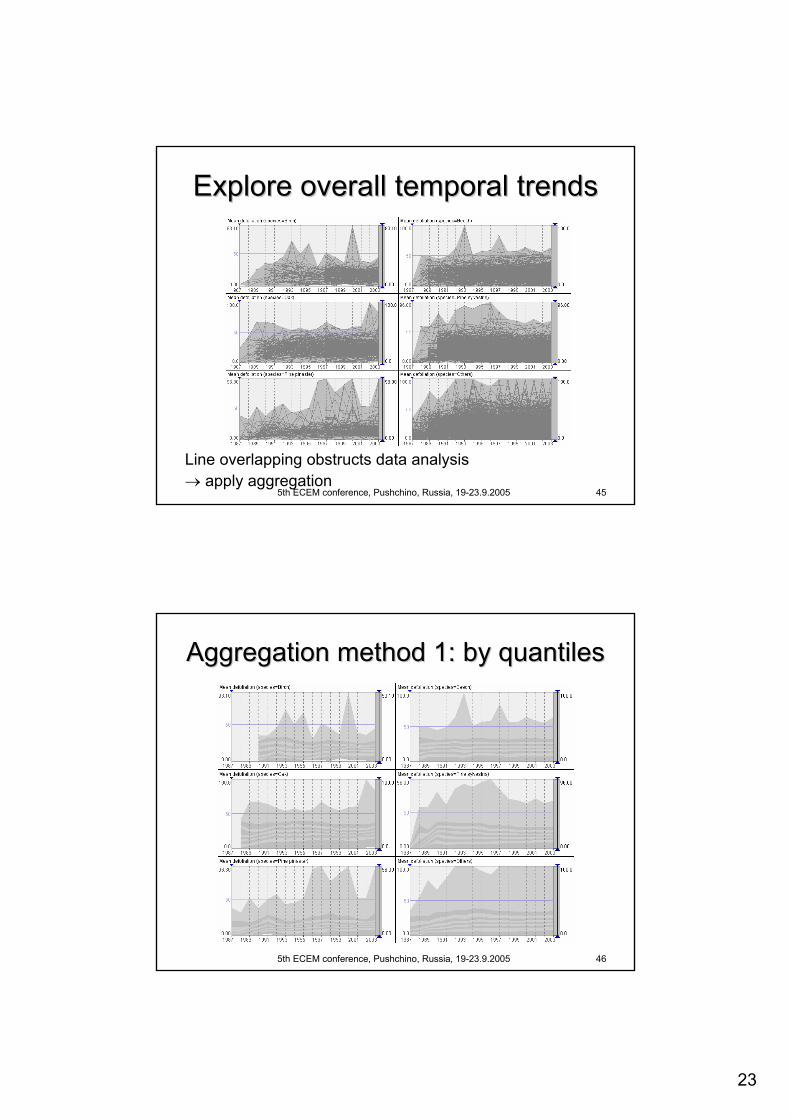
Explore overall temporal trendsExplore overall temporal trends
Line overlapping obstructs data analysis → apply aggregation
5th ECEM conference, Pushchino, Russia, 19-23.9.2005 46
Aggregation method 1: by Aggregation method 1: by quantilesquantiles
24
5th ECEM conference, Pushchino, Russia, 19-23.9.2005 47
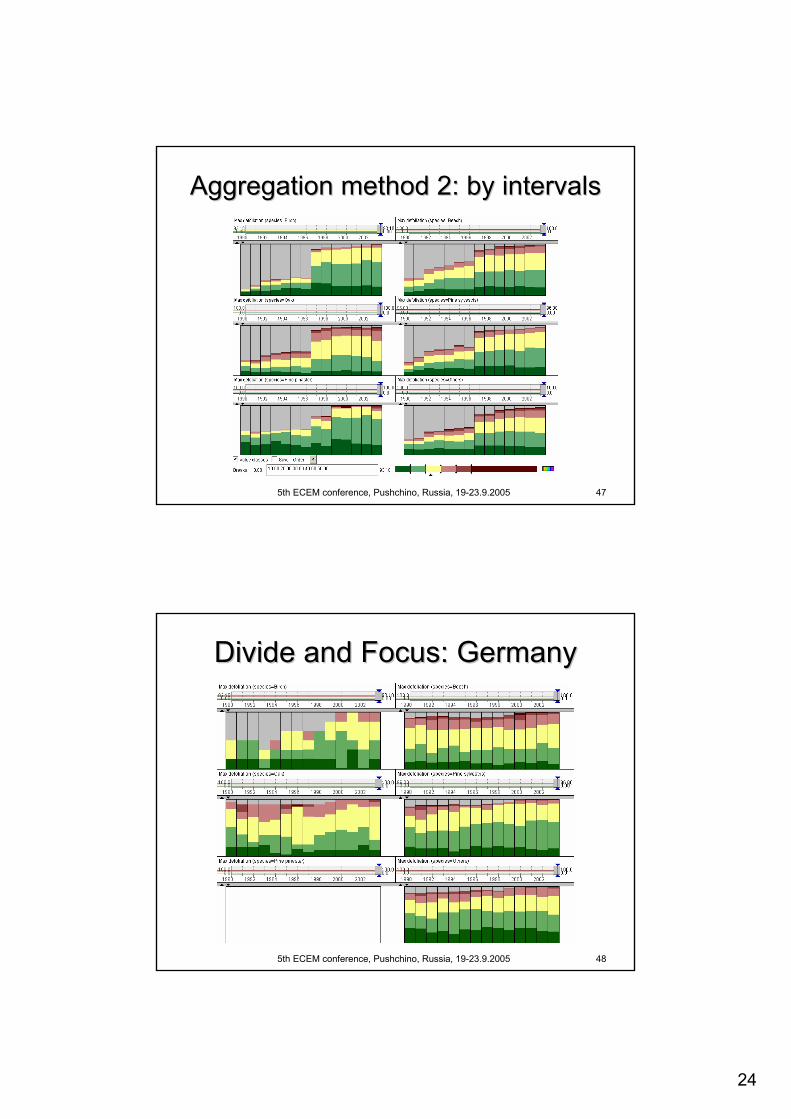
Aggregation method 2: by intervalsAggregation method 2: by intervals
5th ECEM conference, Pushchino, Russia, 19-23.9.2005 48
Divide and Focus: GermanyDivide and Focus: Germany

25
5th ECEM conference, Pushchino, Russia, 19-23.9.2005 49
Divide and Focus: age groups 1,3Divide and Focus: age groups 1,3
5th ECEM conference, Pushchino, Russia, 19-23.9.2005 50
Attend to particularsAttend to particulars
Types of particulars (examples):– Extreme values– Extreme changes– High variability– …
Questions:– When?– Where?– What is around?– Why? (a question for further, in-depth analysis)
Domain knowledge is essential

26
5th ECEM conference, Pushchino, Russia, 19-23.9.2005 51
Attend to particulars: extreme valuesAttend to particulars: extreme values1. Click on a
segment corresponding to extreme values
2. The behaviour(s) is(are) highlighted on the time graph
3. The location(s) is(are) highlighted on the map
5th ECEM conference, Pushchino, Russia, 19-23.9.2005 52
Attend to particulars: what is around?Attend to particulars: what is around?
• In some neighbouring places the behaviours during the period 2000 - 2003 are somewhat similar
27
5th ECEM conference, Pushchino, Russia, 19-23.9.2005 53
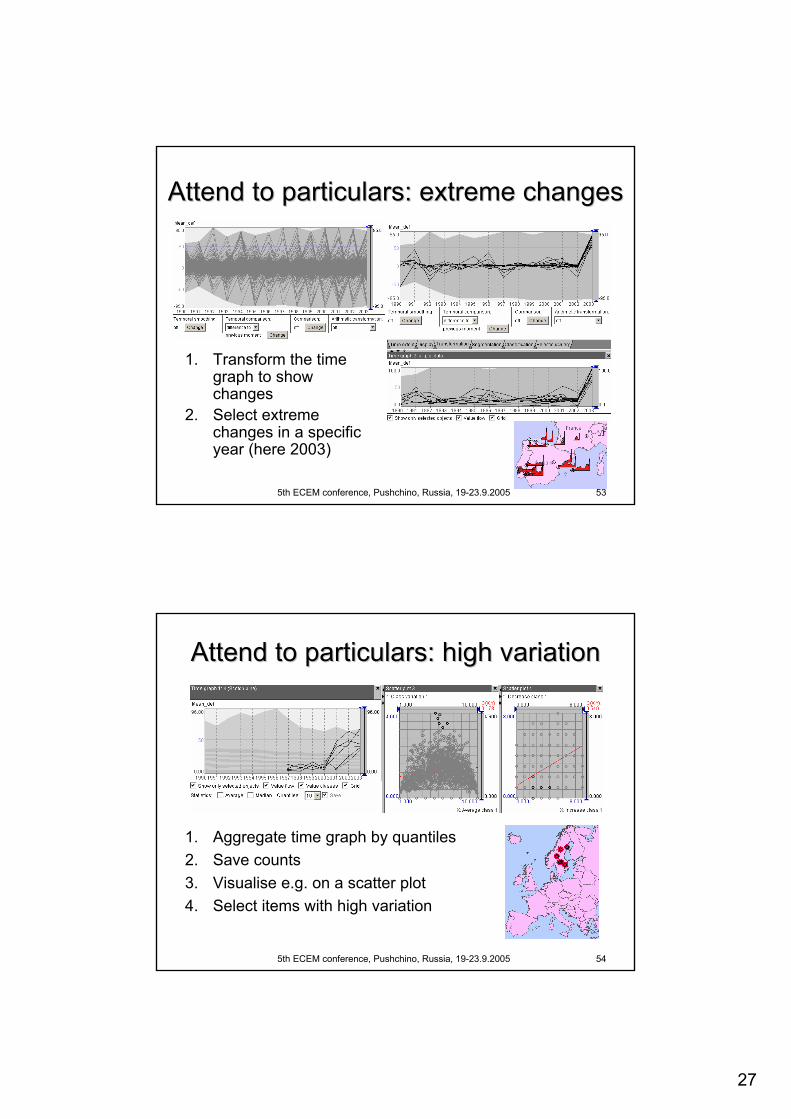
Attend to particulars: extreme changesAttend to particulars: extreme changes
1. Transform the time graph to show changes
2. Select extreme changes in a specific year (here 2003)
5th ECEM conference, Pushchino, Russia, 19-23.9.2005 54
Attend to particulars: high variationAttend to particulars: high variation
1. Aggregate time graph by quantiles2. Save counts3. Visualise e.g. on a scatter plot4. Select items with high variation

28
5th ECEM conference, Pushchino, Russia, 19-23.9.2005 55
Attend to particulars: high fluctuationAttend to particulars: high fluctuation
• Select items with maximal number of jumps between quantiles
5th ECEM conference, Pushchino, Russia, 19-23.9.2005 56
Attend to particulars: stable extremesAttend to particulars: stable extremes
• Select items being always in the topmost 10%
29
5th ECEM conference, Pushchino, Russia, 19-23.9.2005 57
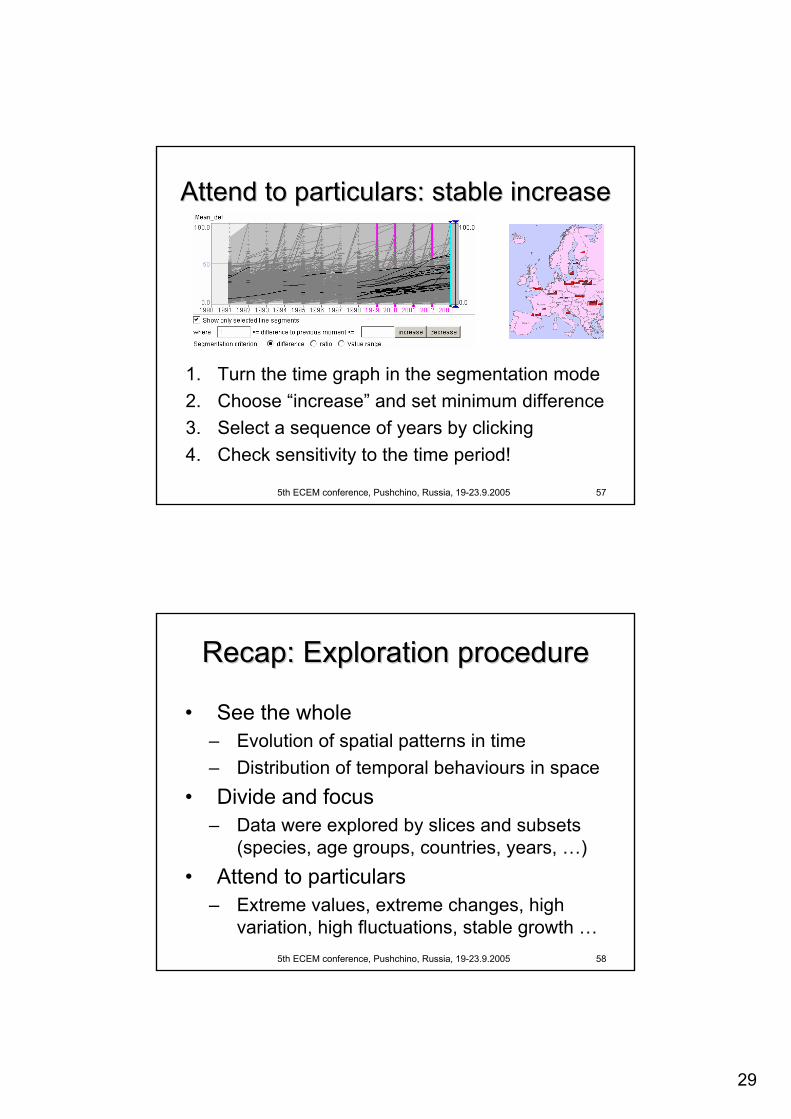
Attend to particulars: stable increaseAttend to particulars: stable increase
1. Turn the time graph in the segmentation mode2. Choose “increase” and set minimum difference3. Select a sequence of years by clicking4. Check sensitivity to the time period!
5th ECEM conference, Pushchino, Russia, 19-23.9.2005 58
Recap: Exploration procedureRecap: Exploration procedure
• See the whole– Evolution of spatial patterns in time– Distribution of temporal behaviours in space
• Divide and focus– Data were explored by slices and subsets
(species, age groups, countries, years, …)• Attend to particulars
– Extreme values, extreme changes, high variation, high fluctuations, stable growth …
30
5th ECEM conference, Pushchino, Russia, 19-23.9.2005 59
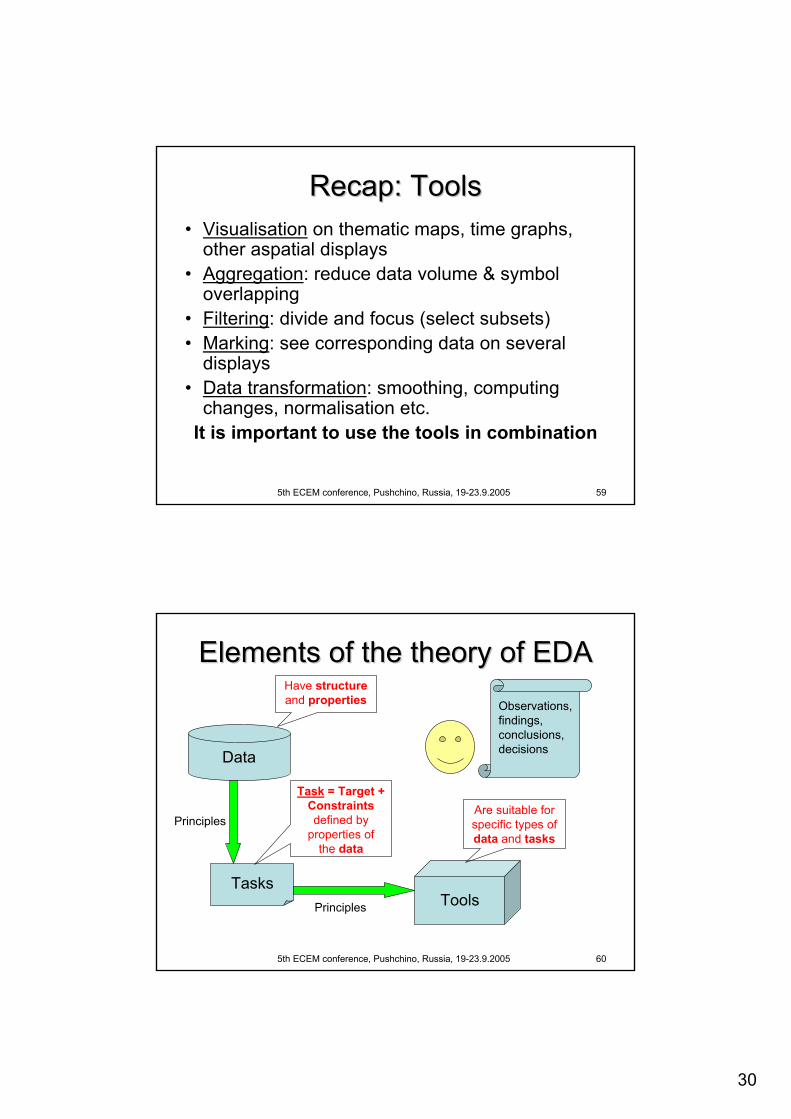
Recap: ToolsRecap: Tools• Visualisation on thematic maps, time graphs,
other aspatial displays• Aggregation: reduce data volume & symbol
overlapping• Filtering: divide and focus (select subsets)• Marking: see corresponding data on several
displays• Data transformation: smoothing, computing
changes, normalisation etc. It is important to use the tools in combination
5th ECEM conference, Pushchino, Russia, 19-23.9.2005 60
Elements of the theory of EDAElements of the theory of EDA
Data
Observations, findings, conclusions, decisions
TasksTools
Have structureand properties
Task = Target +Constraintsdefined by
properties of the data
Are suitable for specific types of data and tasks
Principles
Principles
31
5th ECEM conference, Pushchino, Russia, 19-23.9.2005 61
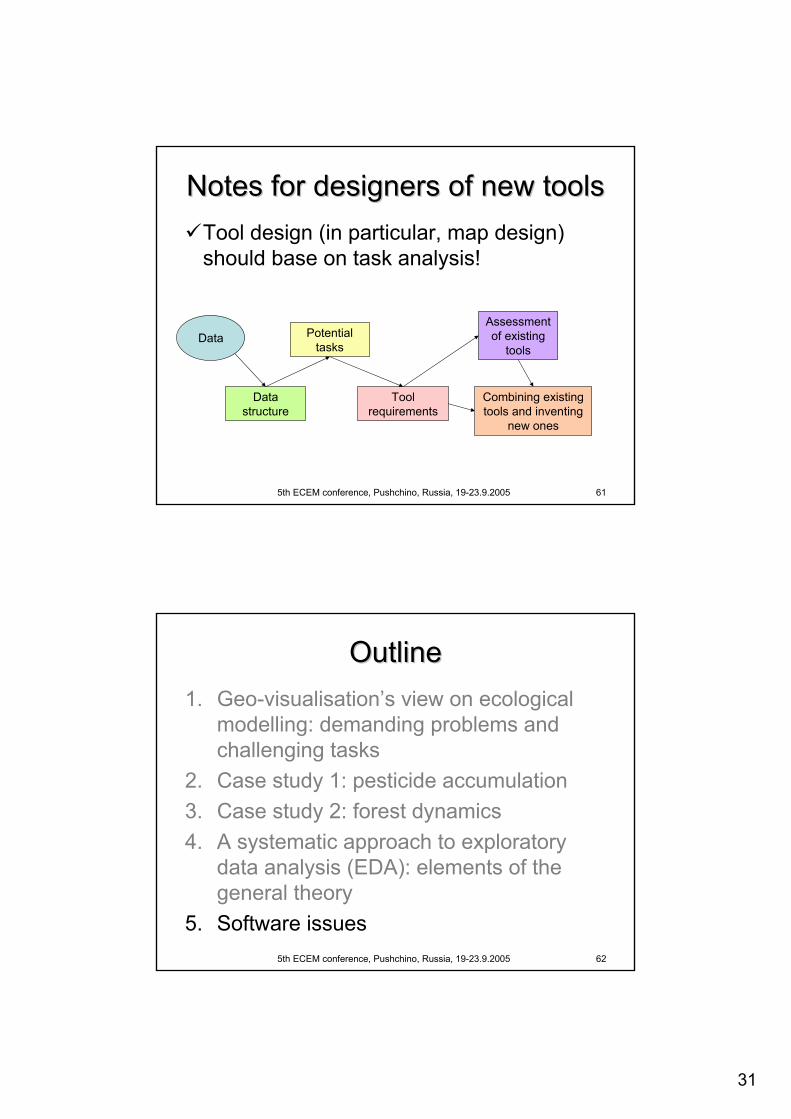
Notes for designers of new toolsNotes for designers of new toolsTool design (in particular, map design) should base on task analysis!
Data
Data structure
Potential tasks
Tool requirements
Assessment of existing
tools
Combining existing tools and inventing
new ones
5th ECEM conference, Pushchino, Russia, 19-23.9.2005 62
OutlineOutline1. Geo-visualisation’s view on ecological
modelling: demanding problems and challenging tasks
2. Case study 1: pesticide accumulation3. Case study 2: forest dynamics4. A systematic approach to exploratory
data analysis (EDA): elements of the general theory
5. Software issues

32
5th ECEM conference, Pushchino, Russia, 19-23.9.2005 63
Requirements to EDA softwareRequirements to EDA software• Space- and Time-awareness• Work with complex multidimensional data• Support for uncertain and missing data• Scalability• Support and encouraging of several
complementary views on the same data• Dynamic linking and coordination of several data
displays• From the overall view to particulars of interest• From idea generation to hypothesis testing using
statistical methods, followed by reporting
5th ECEM conference, Pushchino, Russia, 19-23.9.2005 64
GIS for EDA: major problemsGIS for EDA: major problems• Time-awareness• Work with complex and multidimensional
data• Processing uncertain and missing data• Scalability• Interactivity of visualisations• Dynamic linking of multiple displays• Idea processing
33
5th ECEM conference, Pushchino, Russia, 19-23.9.2005 65
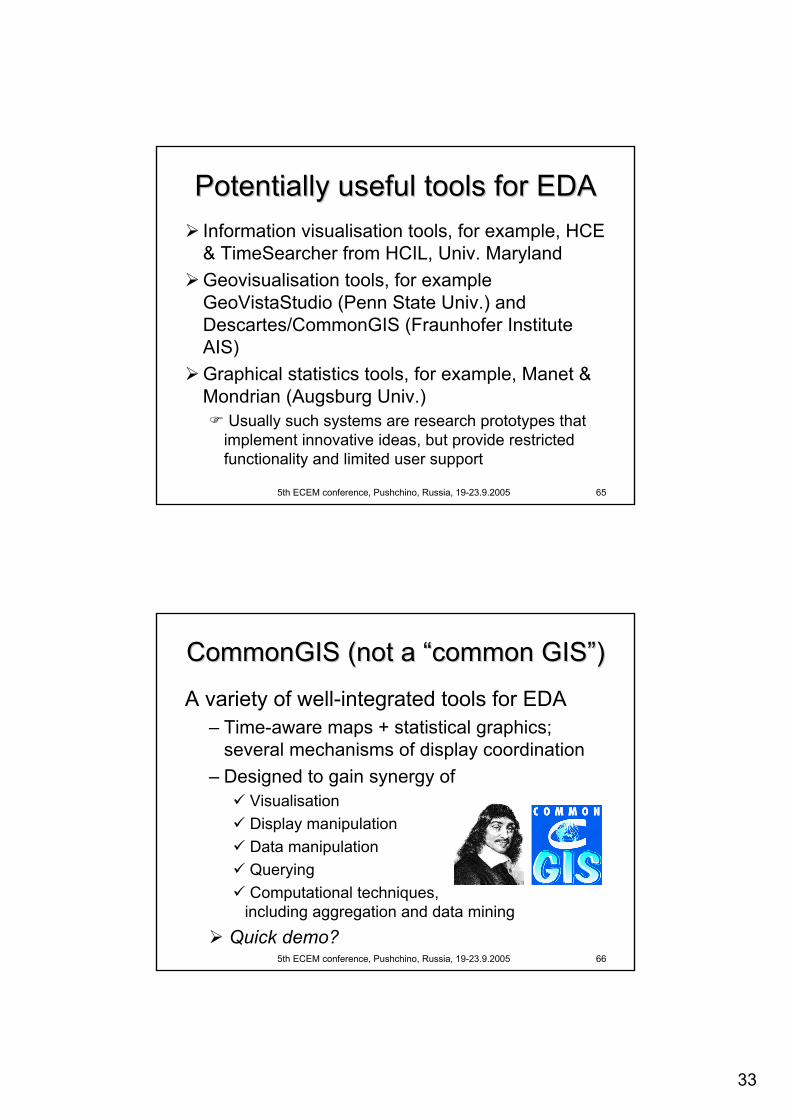
Potentially useful tools for EDAPotentially useful tools for EDAInformation visualisation tools, for example, HCE & TimeSearcher from HCIL, Univ. MarylandGeovisualisation tools, for example GeoVistaStudio (Penn State Univ.) and Descartes/CommonGIS (Fraunhofer Institute AIS)Graphical statistics tools, for example, Manet & Mondrian (Augsburg Univ.)
Usually such systems are research prototypes that implement innovative ideas, but provide restricted functionality and limited user support
5th ECEM conference, Pushchino, Russia, 19-23.9.2005 66
CommonGISCommonGIS (not a “common GIS”)(not a “common GIS”)
A variety of well-integrated tools for EDA– Time-aware maps + statistical graphics;
several mechanisms of display coordination– Designed to gain synergy of
VisualisationDisplay manipulationData manipulationQueryingComputational techniques,
including aggregation and data miningQuick demo?

34
5th ECEM conference, Pushchino, Russia, 19-23.9.2005 67
Still open issues (for all tools!)Still open issues (for all tools!)Work with qualitative (non-numeric) dataWork with fuzzy, uncertain, and missing dataContinue scalability effortsIntelligent guidance through the overall process of data analysis, avoiding cognitive complexityAdaptability to user, data, tasks, and hardwareSupport in processing and management of observations: recording, structuring, browsing, searching, checking, combining, interpreting…Help in visual communication of derived data, constructed knowledge, and recommended decisions
5th ECEM conference, Pushchino, Russia, 19-23.9.2005 68
ConclusionsConclusions1. EDA is essential in ecological modelling for
preparation of data, verification and tuning of models, interpretation of results, and evaluation of decision alternatives
2. Systematic application of EDA requires careful consideration of characteristics of data, relevant analytical tasks, properties of tools
3. EDA tools should combine interactive visualisation with data transformation, dynamic query, and sophisticated computations
4. Still there are many things to do… for scientists and for software developers
35
5th ECEM conference, Pushchino, Russia, 19-23.9.2005 69
To Learn More:To Learn More:
Software: http://www.commongis.comPapers, tutorials, on-line demos: http://www.ais.fraunhofer.de/andBook to appear:
Natalia and Gennady Andrienko “Exploratory Analysis of Spatial and
Temporal data. A Systematic Approach”(Springer-Verlag, ≈ end 2005)
A theoretical framework for linking tasks, tools, and principles of data analysis
5th ECEM conference, Pushchino, Russia, 19-23.9.2005 70In press, to appear ≈ end 2005
http://www.ais.fraunhofer.de/and