Exploration of geothermal systems using hyperspectral ...
12
Exploration of geothermal systems using hyperspectral thermal infrared remote sensing Kevin A. Reath ⁎, Michael S. Ramsey Department of Geology and Planetary Science, University of Pittsburgh, 4107 O'Hara Street, Pittsburgh, PA 15260, United States abstract article info Article history: Received 3 April 2013 Accepted 10 August 2013 Available online 27 August 2013 Keywords: Geothermal Salton Sea Hyperspectral Thermal infrared SEBASS Visible near infrared (VNIR), short-wave infrared (SWIR), and thermal infrared (TIR) remote sensing has long been used for geothermal exploration. Specific focus on the TIR region (8–12 μm) has resulted in major-rock- forming mineral classes being identified and their areal percentages to be more easily mapped due in part to the linear mixing behavior of TIR emission. To understand the mineral compositional and thermal distribution of active geothermal surfaces systems, hyperspectral TIR data from the Spatially Enhanced Broadband Array Spectrograph System (SEBASS) airborne sensor were acquired over the Salton Sea, CA geothermal fields by The Aerospace Corporation on March 26, 2009 and April 6, 2010. SEBASS collects 128 wavelength channels at ~1 m spatial resolution. Such high resolution data are rarely available for this type of scientific analysis and en- abled the identification of rare mineral assemblages associated with the geothermally-active areas. One surface unit with a unique spectrum, believed to be a magnesium sulfate of unknown hydration state, was identified for the first time in the SEBASS data. The abundance and distribution of this mineral varied between 2009 and 2010 likely due to the precipitation conditions. Data obtained by the SEBASS sensor were also regressed to the 32 channel spectral resolution of the Mineral and Gas Identifier (MAGI) airborne sensor in order to test sensitivity limits. At this lower spectral resolution, all surface minerals were still effectively identified and therefore validat- ed data at MAGI resolution are still very effective for accurate surface compositional mapping. A similar approach used at active geothermal areas in other semi-arid regions around the world has the potential to better charac- terize transient mineralogy, identify “indicators minerals”, understand the influence of surface and ground water, and ultimately to locate new geothermal targets for future exploration. Furthermore, new Mineral and Gas Identification (MAGI) data serve as an excellent precursor for future spaceborne TIR data such as the system proposed for the Hyperspectral Infrared Imager (HyspIRI) instrument. © 2013 Elsevier B.V. All rights reserved. 1. Introduction 1.1. Salton Sea geothermal area The Salton Sea geothermal area (SSGA) is approximately 20 km 2 containing high heat flow, gryphons, and mud pots (Fig. 1A). It is bounded along the southeast margin by the Calipatria fault, which is an offshoot of the San Andreas fault (Younker et al, 1982). Currently, ten geothermal plants operate in the region to produce a combined ca- pacity of 340 MW, enough energy to power over 100,000 homes. New geothermal fields have recently been exposed as the level of Salton Sea continues to drop with increasing water demands and less runoff. These new geothermal fields and surrounding regions have been the targets of energy exploration. Furthermore, the newly exposed shore- lines have increased the potential of respiratory health impacts of the local population from the mineralogy of remobilized airborne dust. The research presented here is focused on two locations within the SSGA. The first is the Davis–Schrimpf geothermal field (strip 1, Fig. 1B), which is a large, unvegetated field of mud pots and mud volcano-like gryphons located south of the geothermal plant, which is southeast of Mullet Island. Prior geologic and geothermal research has been conducted at this location (Ives, 1951; Helgeson, 1968; Elders et al., 1972; Van de Kamp, 1973; Elders and Sass, 1988; Herzig et al., 1988; Sturz et al., 1992; Svensen et al., 2007, 2009; Onderdonk et al., 2011; Lynch et al., 2013). The second location is an onshore geothermal field southeast of Mullet Island (strip 2, Fig. 1B) that was recently ex- posed due to lower water levels of the Salton Sea. The latter area is infor- mally called the Sandbar geothermal field or the Morton Bay fumaroles; however for the purposes of this paper we will use the Sandbar nomen- clature. For years, submarine fumaroles at this location were identified by water discoloration and increased water temperatures. Specific vent locations, geologic features, heat flow, and surface mineralogy can now be studied subaerially using airborne and ground-based TIR data. Although the Salton Trough is composed mostly of shale at shallow depths (Herzig et al, 1988), the surface has become filled with quartz- Journal of Volcanology and Geothermal Research 265 (2013) 27–38 ⁎ Corresponding author. Tel.: +1 412 624 8780; fax: +1 412 624 3914. E-mail address: [email protected] (K.A. Reath). 0377-0273/$ – see front matter © 2013 Elsevier B.V. All rights reserved. http://dx.doi.org/10.1016/j.jvolgeores.2013.08.007 Contents lists available at ScienceDirect Journal of Volcanology and Geothermal Research journal homepage: www.elsevier.com/locate/jvolgeores
Transcript of Exploration of geothermal systems using hyperspectral ...

Journal of Volcanology and Geothermal Research 265 (2013) 27–38
Contents lists available at ScienceDirect
Journal of Volcanology and Geothermal Research
j ourna l homepage: www.e lsev ie r .com/ locate / jvo lgeores
Exploration of geothermal systems using hyperspectral thermal infraredremote sensing
Kevin A. Reath ⁎, Michael S. RamseyDepartment of Geology and Planetary Science, University of Pittsburgh, 4107 O'Hara Street, Pittsburgh, PA 15260, United States
⁎ Corresponding author. Tel.: +1 412 624 8780; fax: +E-mail address: [email protected] (K.A. Reath).
0377-0273/$ – see front matter © 2013 Elsevier B.V. All rihttp://dx.doi.org/10.1016/j.jvolgeores.2013.08.007
a b s t r a c t
a r t i c l e i n f oArticle history:Received 3 April 2013Accepted 10 August 2013Available online 27 August 2013
Keywords:GeothermalSalton SeaHyperspectralThermal infraredSEBASS
Visible near infrared (VNIR), short-wave infrared (SWIR), and thermal infrared (TIR) remote sensing has longbeen used for geothermal exploration. Specific focus on the TIR region (8–12 μm) has resulted in major-rock-forming mineral classes being identified and their areal percentages to be more easily mapped due in part tothe linear mixing behavior of TIR emission. To understand the mineral compositional and thermal distributionof active geothermal surfaces systems, hyperspectral TIR data from the Spatially Enhanced Broadband ArraySpectrograph System (SEBASS) airborne sensor were acquired over the Salton Sea, CA geothermal fields byThe Aerospace Corporation on March 26, 2009 and April 6, 2010. SEBASS collects 128 wavelength channels at~1 m spatial resolution. Such high resolution data are rarely available for this type of scientific analysis and en-abled the identification of rare mineral assemblages associated with the geothermally-active areas. One surfaceunit with a unique spectrum, believed to be a magnesium sulfate of unknown hydration state, was identifiedfor the first time in the SEBASS data. The abundance and distribution of this mineral varied between 2009 and2010 likely due to the precipitation conditions. Data obtained by the SEBASS sensor were also regressed to the32 channel spectral resolution of theMineral andGas Identifier (MAGI) airborne sensor in order to test sensitivitylimits. At this lower spectral resolution, all surfaceminerals were still effectively identified and therefore validat-ed data atMAGI resolution are still very effective for accurate surface compositionalmapping. A similar approachused at active geothermal areas in other semi-arid regions around the world has the potential to better charac-terize transient mineralogy, identify “indicators minerals”, understand the influence of surface and groundwater, and ultimately to locate new geothermal targets for future exploration. Furthermore, new Mineral andGas Identification (MAGI) data serve as an excellent precursor for future spaceborne TIR data such as the systemproposed for the Hyperspectral Infrared Imager (HyspIRI) instrument.
© 2013 Elsevier B.V. All rights reserved.
1. Introduction
1.1. Salton Sea geothermal area
The Salton Sea geothermal area (SSGA) is approximately 20 km2
containing high heat flow, gryphons, and mud pots (Fig. 1A). It isbounded along the southeast margin by the Calipatria fault, which isan offshoot of the San Andreas fault (Younker et al, 1982). Currently,ten geothermal plants operate in the region to produce a combined ca-pacity of 340 MW, enough energy to power over 100,000 homes. Newgeothermal fields have recently been exposed as the level of SaltonSea continues to drop with increasing water demands and less runoff.These new geothermal fields and surrounding regions have been thetargets of energy exploration. Furthermore, the newly exposed shore-lines have increased the potential of respiratory health impacts of thelocal population from the mineralogy of remobilized airborne dust.
1 412 624 3914.
ghts reserved.
The research presented here is focused on two locations within theSSGA. The first is the Davis–Schrimpf geothermal field (strip 1,Fig. 1B), which is a large, unvegetated field of mud pots and mudvolcano-like gryphons located south of the geothermal plant, which issoutheast of Mullet Island. Prior geologic and geothermal research hasbeen conducted at this location (Ives, 1951; Helgeson, 1968; Elderset al., 1972; Van de Kamp, 1973; Elders and Sass, 1988; Herzig et al.,1988; Sturz et al., 1992; Svensen et al., 2007, 2009; Onderdonk et al.,2011; Lynch et al., 2013). The second location is an onshore geothermalfield southeast of Mullet Island (strip 2, Fig. 1B) that was recently ex-posed due to lowerwater levels of the Salton Sea. The latter area is infor-mally called the Sandbar geothermal field or theMorton Bay fumaroles;however for the purposes of this paperwewill use the Sandbar nomen-clature. For years, submarine fumaroles at this location were identifiedby water discoloration and increased water temperatures. Specificvent locations, geologic features, heat flow, and surface mineralogycan now be studied subaerially using airborne and ground-based TIRdata.
Although the Salton Trough is composed mostly of shale at shallowdepths (Herzig et al, 1988), the surface has become filled with quartz-
Fig. 1.ASTERVNIR (15 mpixel) image of the Salton Sea acquiredon9October 2011 (A)Overviewof the regionwith thewhite box indicating the area shown inB. (B)Detail of thefield areawith the location of the Davis–Schrimpf Geothermal Field (1) and the Sandbar Geothermal Field (2) shown by the black boxes.
28 K.A. Reath, M.S. Ramsey / Journal of Volcanology and Geothermal Research 265 (2013) 27–38
rich sands and gravels derived from sandstone facies in the surroundingmountains. Local sources such as salt-based crusts near the retreatingshore-line, silt/clay crusted sites, as well as regional ephemeral washesand distal alluvial fans (Buck et al., 2011; King et al., 2011; Sweeneyet al., 2011) contribute to the geology as aeolian dust sources found intopographic depressions and to the salinity of the lake. In some areasevaporite minerals are also present. The mineralogy becomes morecomplex in areas surrounding active and formerly-active geothermalsites due to the brines that can contain up to ~25% Total Dissolved Solids(TDS) (Thompson and Fournier, 1988). In past analyses these brineswere found to be of a unique composition, consisting heavily of sodium,potassium, calcium, and chlorine, with large amounts of iron, manga-nese, silica, strontium, boron, lithium, barium, lead, zinc, and copper(Helgeson, 1968).
Minerals containing these elements can easily be identified with TIRremote sensing and laboratory spectroscopy as long as the data have ad-equate spectral and spatial resolution and high signal-to-noise values.Therefore, geothermally active areas that produce enough energy toalter the local surfacemineralogy should be easily identifiable remotely.We focus here on the accuracy, percentage, and distribution of such geo-thermally derived minerals at the SSGA.
1.2. Remote geothermal exploration
Over the last 40 years, remote sensing has been used for mineral de-tection and mapping (Short and Stuart, 1983; Gillespie et al., 1986;Hook et al., 2001). In that time, image processing techniques have alsobeen developed to better identify and interpret rock andmineral signa-tures using TIR emissivity data (Kahle and Rowan, 1980; Gillespie et al.,1986; Ramsey and Christensen, 1998;Hook et al., 1999). However, ther-mal infrared remote sensing has been limited by past data quality, com-monly with poor spatial and/or spectral resolution, and to a lesserextent, sensors with low signal to noise. Over time, the number of spec-tral channels has varied whereas the spatial resolution has continued toincrease. For example, the Landsat Enhanced Thematic Mapper Plus(ETM+) instrument contained only one TIR channel at 60 m/pixel spa-tial resolution; the Advanced Spaceborne Thermal Emission and Reflec-tion Radiometer (ASTER) has five TIR channels but at 90 m/pixel spatialresolution,whereas the new Thermal Infrared Sensor (TIRS) instrumenton Landsat 8 contains only two channels at an even lower 100 m/pixelspatial resolution. Other sensors such as theModerate Resolution Imag-ing Spectroradiometer (MODIS), the Advanced Very High ResolutionRadiometer (AVHRR), and the Spinning Enhanced Visible and InfraRed
Imager (SEVIRI) each have between two and seven TIR channels, butat spatial resolutions of between 1.0 and 3.0 km/pixel. Multispectral in-struments of ASTER/Landsat class have been most effective at broadlycategorizing surface units (e.g., sulfates, carbonates, clays) than identi-fying specific minerals and their mixing components (Gillespie et al.,1984; Taranik, 1988; Sabine et al., 1994; Rowan et al., 2005; Zhanget al., 2007); whereas instruments of the MODIS class have been mosteffective at large-scale surface temperature mapping (Prata and Grant,2001; Wright et al., 2002; Dean et al, 2004). By increasing the spectralresolution to 32 or 128 channels available with the MAGI and SEBASSsensors, respectively, distinctmineral types and suites can now be iden-tified more accurately.
Much of this research presented here was performed in preparationfor the first MAGI flight, which occurred in December 2011. This workserved both as calibration/validation for the MAGI sensor, as well as ageologic study of the dynamic surface processes observed at the SaltonSea geothermal area. Results using data from MAGI are currently beinganalyzed and the manuscripts are in preparation.
1.3. Airborne TIR instruments
SEBASS is a hyperspectral airborne TIR pushbroom sensor designedand operated by The Aerospace Corporation (Hackwell et al, 1996). Ithas 128 channels in both the 2.5–5.2 μm and 7.5–13.5 μm spectral re-gions resulting in a spectral resolution of 0.088 μm (7 cm−1) at11.25 μm (890 cm−1). The instantaneous field of view (IFOV) is1.1 mrad and the total field of view (FOV) is approximately 7.3°(Vaughan et al., 2003). The instrument is commonly flown on a TwinOtter aircraft at an altitude of 915 mAGL resulting in ~1 m/pixel spatialresolution datawith a swathwidth of 128 m in the cross-track directionand a signal-to-noise value of approximately 1000. Compared to thespaceborne ASTER TIR data, SEBASS data has sufficient spatial and spec-tral resolution to resolve all ground features and mineralogy found atthe Davis–Schrimpf field. However, the total area covered by a singleflight line of SEBASS is extremely narrow in comparison to other remotesensing instruments. For this study, SEBASS was flown over the SSGAand surrounding areas on 26 March 2009 and again on 6 April 2010.No coincident ground campaigns were conducted during these over-flights, however ground data were later collected on March 2010 andJune/July 2010 using the SEBASS data as a guide for specific mappingand sampling strategies.
The MAGI sensor has also been developed by The Aerospace Corpo-ration to address technology development for the next generation of
29K.A. Reath, M.S. Ramsey / Journal of Volcanology and Geothermal Research 265 (2013) 27–38
spaceborne TIR sensors (Hall et al., 2008). It is a new 32 channel air-borne TIR sensor with a spectral resolution 0.2 μm resulting in 32 spec-tral channels between 7.8 and 12.0 μm, a spatial resolution of 2 m/pixelat an altitude of 3657 m AGL, and a signal-to-noise value of approxi-mately 500. It consists of a whiskbroom design that can acquire up to2800 pixels in the cross track direction by compiling 128 pixel “whisks”in the downtrack direction (Hall et al., 2008). The number of whisks ac-quired is a function of the desired flight line length. This approach al-lows for a much wider crosstrack scan over multiple channels, whichis a significant improvement over SEBASS. The sensor relies on a noveloptical design, which incorporates a Dyson spectrometer that hassmall optical distortion at low f-numbers (dimensionless quantitativemeasurements of lens speed, Wolf and Born, 1965). This spectrometeris mated to a HgCdTe focal plane array that allows high frame ratedata with very high signal to noise. The high spatial resolution and ra-diometric accuracy enables subtle spectral features, weak thermalanomalies, and weak gas-emission sources to all be detected (Hallet al, 2008). MAGI should allow more information to be obtained thanearlier instruments while still collecting a majority of the data typicalof more complex and costly hyperspectral sensors. The choice of 32channelswasmade based on tests using SEBASS datawith progressivelydegraded spectral resolution in order to determine the minimum num-ber of channels that would still allow accurate mineral and gas discrim-ination. Because a majority of this work was completed prior to the firstflight of the MAGI sensor, the SEBASS data were also degraded in spec-tral resolution to 32 channels (MAGI) and five channels (ASTER) forcomparison and hypothesis validation.
2. Methods
2.1. ASTER data processing
In order to understand the long-term (seasonal to yearly) tempera-ture variability of the SSGA, the ASTER TIR nighttime radiance datawereexamined. Nine cloud-free data scenes over seven years were chosenand the data ordered as atmospherically corrected surface radiance(Level 2, AST_09T product) (Abrams, 2000). These data were then sep-arated into temperature and emissivity using the emissivity normaliza-tion approach (Gillespie, 1985; Realmuto, 1990). This process producesfive emissivity images (one for each TIR channel) and one brightnesstemperature image for the 60 km2 area covered within an ASTERscene. The thermal/temporal variations within the SSGA were deter-mined by examining the nine temperature scenes. The emissivity datawere also examined in order to assess any spatial or temporal differ-ences in the surface compositional units.
2.2. SEBASS data processing
SEBASS TIR data are commonly delivered as radiance-at-sensor in“micro-flicks” units (μW/cm2 ∗ sr ∗ μm). These data are first convertedto W/m2 ∗ sr ∗ μm units to allow for easy comparison to the ASTERtemperature and emissivity products. The ENVI thermal atmosphericcorrection algorithm is amodified version of the in-scene atmosphericcorrection (ISAC) model developed by The Aerospace Corporation(Johnson and Young, 1998). This algorithm is necessary to removethe effects of atmospheric scattering and emission (Thome et al.,1998) and produce the radiance-at-ground data. Once the data wereatmospherically-corrected, the emissivity normalization functionwas applied producing pixel-integrated brightness temperature and128 channels of emissivity data.
2.3. Image deconvolution
The SEBASS data were explored for mineral/spectral variability inthe Davis–Schrimpf geothermal field. A decorrelation stretch (DCS)was first applied to the 2009 radiance data, using channel 10
(8.20 μm), 25 (9.06 μm), and 69 (11.41 μm). This stretch displays vari-ations in emissivity (i.e., composition) as color differences with temper-ature differences being displayed as variations in the color intensity(Gillespie, 1992a). The DCS is a quick and powerful visualization ap-proach that is particularly effective for TIR data. Spectral variability be-tween the color differences were compared to the actual SEBASSspectra and to laboratory emissivity spectra found both in the ArizonaState University Thermal Emission Spectrometer (TES) spectral library(Christensen et al., 2000) and the ASTER spectral library (Baldridgeet al., 2009). A common mineral suite/end member library was formedof the representative minerals found in the area by comparing spectralfeatures found in the SEBASS data as well as incorporating mineralsfound in analogous regions located within or around the Salton Sea(Crowley and Hook, 1996; Onderdonk et al., 2011; Lynch et al, 2013).The endmember suite consisted of quartz, gypsum, microcline, and an-hydrite from the Arizona State University spectral library, as well assmectite and epsomite from the ASTER spectral library. Finally, usingthe using the pixel purity index (PPI) function in ENVI, a spectrumrepresenting the unidentified hydrated Mg-sulfate mineral was identi-fied in each SEBASS scene and incorporated into the end member suite.
The PPI function allows the pixelswith themost unique spectra to beidentified. These pixels will therefore contain the highest amount of asingle spectral end member compared to any other pixel found in thescene. This process was only used to find the best Mg-sulfate mineralspectrum in both SEBASS scenes because of the instrument's high spec-tral resolution and the lack of a suitable example in any spectral library.Furthermore, the ease bywhich this mineral class can change hydrationstates, made it extremely difficult to locate in the field and transport tothe laboratory spectrometer without altering its spectrum. The obviousweakness in the PPI approach to spectral extraction is that this spectrumstill represents some amount of mixing within the pixel, which resultsin the PPI-based end member being overrepresented in the finaldeconvolution result. However, this error is greatly reduced with thehigh spatial and spectral resolution of the SEBASS data.
The final spectral endmember suite was then applied to the SEBASSemissivity data using the linear deconvolution modeling approach ofRamsey and Christensen (1998). This approach produces a goodness-of-fit for the model and mineral maps of the surface that show theboth the mineral constituents and percentages found in each pixel.The principle behind this approach is that emitted energy from a surfacecontaining multiple end members combines linearly in the TIR andtherefore can be deconvolved using a least-squares fit to a known setof mineral end members (Adams et al., 1986, 1989; Gillespie, 1992b;Ramsey and Christensen, 1998). In other words, the emitted energyfrom the different minerals is proportional to their aerial percentageswithin an image pixel.
Mineral maps using the selected end member suite were producedfor the SEBASS, ASTER, and MAGI-simulated data. The end memberswere spectrally resampled prior to the deconvolution of each sensor'semissivity data. By definition, the deconvolution model is limited to anumber of end members less than or equal to the spectral resolution ofthe data to be analyzed. Therefore, modeling of the ASTER emissivitydata (five channels) was performed by running the deconvolutionthree times, each with different end member subsets. Both the 2009and 2010 SEBASS scenes of the Davis–Schrimpf field were also analyzedusing this approach. Three regions of interest were created for each yearbased on photogeologic interpretation of surface features and the lineardeconvolution results.
2.4. Field methods
The SSGA was visited twice in 2010 (March and June/July). On eachof these occasions verification and validation of the SEBASS data wereperformed. The area was thoroughly photographed and observed. Dur-ing the March visit, which followed 1.3″ of rainfall (National WeatherService, 2011), the mudpots were observed to have formed large
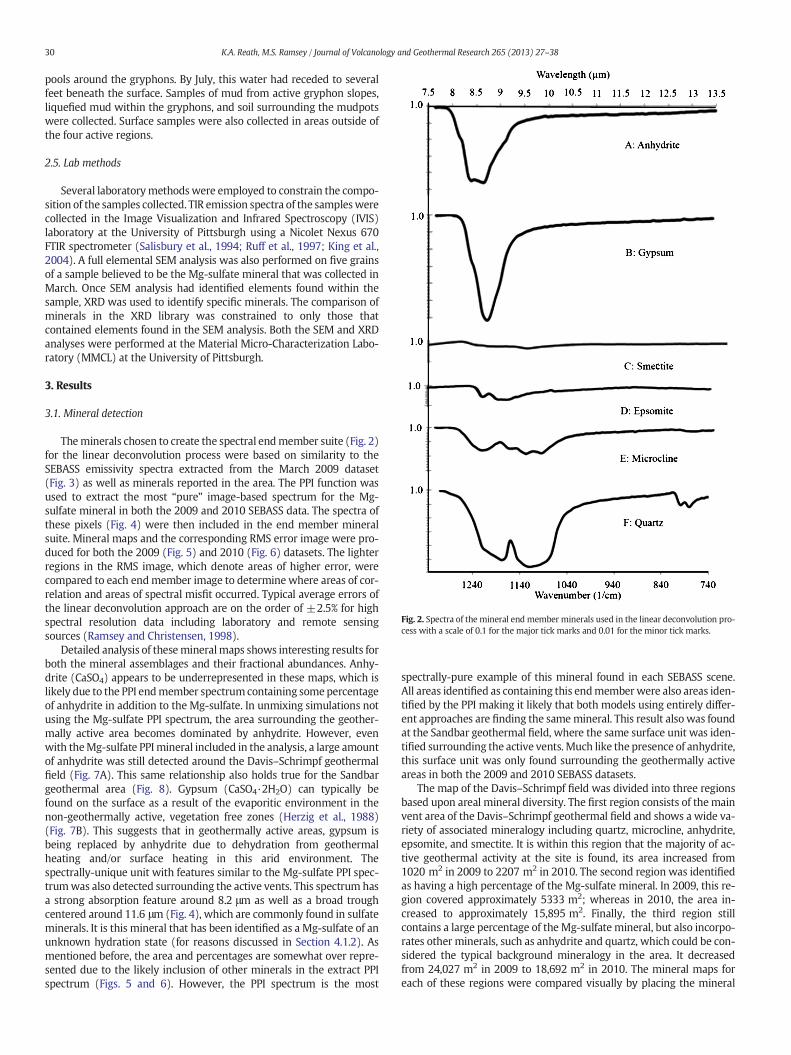
Fig. 2. Spectra of the mineral end member minerals used in the linear deconvolution pro-cess with a scale of 0.1 for the major tick marks and 0.01 for the minor tick marks.
30 K.A. Reath, M.S. Ramsey / Journal of Volcanology and Geothermal Research 265 (2013) 27–38
pools around the gryphons. By July, this water had receded to severalfeet beneath the surface. Samples of mud from active gryphon slopes,liquefied mud within the gryphons, and soil surrounding the mudpotswere collected. Surface samples were also collected in areas outside ofthe four active regions.
2.5. Lab methods
Several laboratorymethodswere employed to constrain the compo-sition of the samples collected. TIR emission spectra of the sampleswerecollected in the Image Visualization and Infrared Spectroscopy (IVIS)laboratory at the University of Pittsburgh using a Nicolet Nexus 670FTIR spectrometer (Salisbury et al., 1994; Ruff et al., 1997; King et al.,2004). A full elemental SEM analysis was also performed on five grainsof a sample believed to be the Mg-sulfate mineral that was collected inMarch. Once SEM analysis had identified elements found within thesample, XRD was used to identify specific minerals. The comparison ofminerals in the XRD library was constrained to only those thatcontained elements found in the SEM analysis. Both the SEM and XRDanalyses were performed at the Material Micro-Characterization Labo-ratory (MMCL) at the University of Pittsburgh.
3. Results
3.1. Mineral detection
Theminerals chosen to create the spectral endmember suite (Fig. 2)for the linear deconvolution process were based on similarity to theSEBASS emissivity spectra extracted from the March 2009 dataset(Fig. 3) as well as minerals reported in the area. The PPI function wasused to extract the most “pure” image-based spectrum for the Mg-sulfate mineral in both the 2009 and 2010 SEBASS data. The spectra ofthese pixels (Fig. 4) were then included in the end member mineralsuite. Mineral maps and the corresponding RMS error image were pro-duced for both the 2009 (Fig. 5) and 2010 (Fig. 6) datasets. The lighterregions in the RMS image, which denote areas of higher error, werecompared to each endmember image to determine where areas of cor-relation and areas of spectral misfit occurred. Typical average errors ofthe linear deconvolution approach are on the order of ±2.5% for highspectral resolution data including laboratory and remote sensingsources (Ramsey and Christensen, 1998).
Detailed analysis of thesemineralmaps shows interesting results forboth the mineral assemblages and their fractional abundances. Anhy-drite (CaSO4) appears to be underrepresented in these maps, which islikely due to the PPI endmember spectrum containing somepercentageof anhydrite in addition to the Mg-sulfate. In unmixing simulations notusing the Mg-sulfate PPI spectrum, the area surrounding the geother-mally active area becomes dominated by anhydrite. However, evenwith theMg-sulfate PPI mineral included in the analysis, a large amountof anhydrite was still detected around the Davis–Schrimpf geothermalfield (Fig. 7A). This same relationship also holds true for the Sandbargeothermal area (Fig. 8). Gypsum (CaSO4·2H2O) can typically befound on the surface as a result of the evaporitic environment in thenon-geothermally active, vegetation free zones (Herzig et al., 1988)(Fig. 7B). This suggests that in geothermally active areas, gypsum isbeing replaced by anhydrite due to dehydration from geothermalheating and/or surface heating in this arid environment. Thespectrally-unique unit with features similar to the Mg-sulfate PPI spec-trumwas also detected surrounding the active vents. This spectrum hasa strong absorption feature around 8.2 μm as well as a broad troughcentered around 11.6 μm (Fig. 4), which are commonly found in sulfateminerals. It is this mineral that has been identified as a Mg-sulfate of anunknown hydration state (for reasons discussed in Section 4.1.2). Asmentioned before, the area and percentages are somewhat over repre-sented due to the likely inclusion of other minerals in the extract PPIspectrum (Figs. 5 and 6). However, the PPI spectrum is the most
spectrally-pure example of this mineral found in each SEBASS scene.All areas identified as containing this endmemberwere also areas iden-tified by the PPI making it likely that both models using entirely differ-ent approaches are finding the samemineral. This result also was foundat the Sandbar geothermal field, where the same surface unit was iden-tified surrounding the active vents. Much like the presence of anhydrite,this surface unit was only found surrounding the geothermally activeareas in both the 2009 and 2010 SEBASS datasets.
The map of the Davis–Schrimpf field was divided into three regionsbased upon areal mineral diversity. The first region consists of themainvent area of the Davis–Schrimpf geothermal field and shows a wide va-riety of associated mineralogy including quartz, microcline, anhydrite,epsomite, and smectite. It is within this region that the majority of ac-tive geothermal activity at the site is found, its area increased from1020 m2 in 2009 to 2207 m2 in 2010. The second region was identifiedas having a high percentage of the Mg-sulfate mineral. In 2009, this re-gion covered approximately 5333 m2; whereas in 2010, the area in-creased to approximately 15,895 m2. Finally, the third region stillcontains a large percentage of the Mg-sulfate mineral, but also incorpo-rates other minerals, such as anhydrite and quartz, which could be con-sidered the typical background mineralogy in the area. It decreasedfrom 24,027 m2 in 2009 to 18,692 m2 in 2010. The mineral maps foreach of these regions were compared visually by placing the mineral

Fig. 3. Examples of SEBASS derived spectra found in the 26 March 2009 dataset with ascale of 0.1 for the major tick marks and 0.01 for the minor tick marks. Scemtite andepsomite spectra have been derived from the ASTER Spectral Library, quartz, microcline,anhydrite, and gypsum have been derived from the ASU TES spectral library.
Fig. 4. TIR spectra of the hydrated Mg sulfate mineral. The image-derived PPI spectra areshown for the 26 March 2009 and 6 April 6 2010 data, which were used in thedeconvolution modeling. Note the TIR wavelength absorption feature at approximately8.2 μm and the broader feature at longer wavelengths. The laboratory-derived spectrumof a sample collected in March 2010 is included for comparison.
31K.A. Reath, M.S. Ramsey / Journal of Volcanology and Geothermal Research 265 (2013) 27–38
end members in R, G, B, color composites as well as analytically by cal-culating end-member percentages of each region.
Identical regions of interest (ROIs) were chosen in the 2009 and2010 scenes (Fig. 9). Changes in both the areal distribution of the min-eral end members as well as the percentage of each end member werenoted (Table 1). The most substantial difference was that of the areadominated by the spectrally-unique Mg-sulfate mineral. The areal cov-erage increased by almost 300% in less than a year. A slight increase insurface percentages was also noted where examining other end mem-ber difference between 2009 and 2010. This demonstrates that the de-posits from 2009 have not merely been mechanically distributed overthe surface through weathering, but rather, new deposits had formedon the surface between the 2009 and 2010 SEBASS overflights.
3.2. Spectral resolution effects
Emissivity data from ASTER and SEBASS (degraded to simulatedMAGI) give an accurate representation of how the spectral resolution
of these two sensors would affect the end member modeling and geo-logic interpretation. In order to study how spectral resolution alonewould impact these interpretations, the spatial resolution and thesignal-to-noise ratiowere held constant at SEBASS valueswhereas spec-tral resolution was varied. As expected, a spectral resolution of fivechannels (ASTER) makes the accurate end member identification be-came extremely difficult. Furthermore, an increase in error was ob-served where comparing the full spectral resolution SEBASS to that ofthe emulated 32-channel MAGI (eMAGI), and the emulated 5-channelASTER (eASTER) data. Only SEBASS and eMAGI data can be directlycompared because the eASTER data does not have a sufficient numberof TIR channels to support the analysis using the full seven end-member suite. However, four minerals at a time were used for the eAS-TER deconvolutions. This allowed for a basic understanding of howwellthesemineral can be identifiedwith the TIR spectral resolution of ASTER(Fig. 9, Tables 2 and 3).
Both the SEBASS and eMAGI mineral maps are visually similar(Fig. 10). Areas identified as being rich in anhydrite and the Mg-sulfate mineral in SEBASS data were also found comparable to thesame areas in eMAGI data (Tables 2 and 3). There were, however,some slight variations. For example, the eMAGI data assigned the Mg-sulfatemineral endmember to slightlymore areas and reduced the con-trast between mineral rich areas. The percentage difference rangedfrom 0% to 12%, with the majority of that difference being below 2.5%.
In contrast, deconvolution of the eASTER scene produced very differ-ent results due to the significant loss of spectral resolution (Fig. 10). An-hydrite was positively identified in the eASTER data surrounding thegeothermal field. However, anhydrite was also identified in everyother surveyed area of the Salton Sea as well. The Mg-sulfate surfaceunit surrounding the geothermal vents was not detected at all and theRMS error was higher in all regions. The difference in percentage be-tween the SEBASS and eASTER data range from 0 to 35% with severalminerals having differences above 10% (Tables 2 and 3). In the eASTERdata, pixels were also found to be generally more homogenous with asingle end member dominating most pixels with percentages greaterthan 70%.
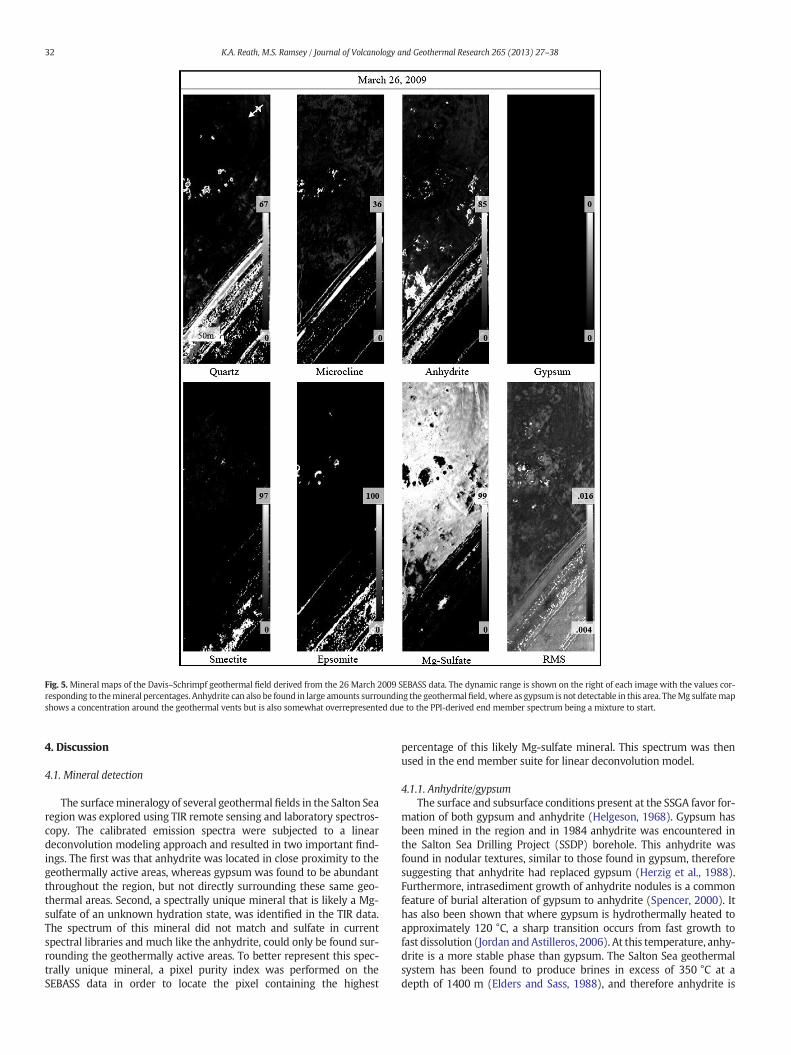
Fig. 5. Mineral maps of the Davis–Schrimpf geothermal field derived from the 26 March 2009 SEBASS data. The dynamic range is shown on the right of each image with the values cor-responding to themineral percentages. Anhydrite can also be found in large amounts surrounding the geothermalfield, where as gypsum is not detectable in this area. TheMg sulfatemapshows a concentration around the geothermal vents but is also somewhat overrepresented due to the PPI-derived end member spectrum being a mixture to start.
32 K.A. Reath, M.S. Ramsey / Journal of Volcanology and Geothermal Research 265 (2013) 27–38
4. Discussion
4.1. Mineral detection
The surfacemineralogy of several geothermal fields in the Salton Searegion was explored using TIR remote sensing and laboratory spectros-copy. The calibrated emission spectra were subjected to a lineardeconvolution modeling approach and resulted in two important find-ings. The first was that anhydrite was located in close proximity to thegeothermally active areas, whereas gypsum was found to be abundantthroughout the region, but not directly surrounding these same geo-thermal areas. Second, a spectrally unique mineral that is likely a Mg-sulfate of an unknown hydration state, was identified in the TIR data.The spectrum of this mineral did not match and sulfate in currentspectral libraries and much like the anhydrite, could only be found sur-rounding the geothermally active areas. To better represent this spec-trally unique mineral, a pixel purity index was performed on theSEBASS data in order to locate the pixel containing the highest
percentage of this likely Mg-sulfate mineral. This spectrum was thenused in the end member suite for linear deconvolution model.
4.1.1. Anhydrite/gypsumThe surface and subsurface conditions present at the SSGA favor for-
mation of both gypsum and anhydrite (Helgeson, 1968). Gypsum hasbeen mined in the region and in 1984 anhydrite was encountered inthe Salton Sea Drilling Project (SSDP) borehole. This anhydrite wasfound in nodular textures, similar to those found in gypsum, thereforesuggesting that anhydrite had replaced gypsum (Herzig et al., 1988).Furthermore, intrasediment growth of anhydrite nodules is a commonfeature of burial alteration of gypsum to anhydrite (Spencer, 2000). Ithas also been shown that where gypsum is hydrothermally heated toapproximately 120 °C, a sharp transition occurs from fast growth tofast dissolution (Jordan andAstilleros, 2006). At this temperature, anhy-drite is a more stable phase than gypsum. The Salton Sea geothermalsystem has been found to produce brines in excess of 350 °C at adepth of 1400 m (Elders and Sass, 1988), and therefore anhydrite is

Fig. 6.Mineral maps of the Davis–Schrimpf geothermal field derived from the 6 April 2010 SEBASS data. As seen in the 2009 data, anhydrite can also be found in abundance, gypsum is notdetectable, and the Mg sulfate could be somewhat overrepresented.
33K.A. Reath, M.S. Ramsey / Journal of Volcanology and Geothermal Research 265 (2013) 27–38
likely to be forming at depth in dry regions depending on the associategeochemical system. Because of the temperatures needed to create sub-surface anhydrite as well as the transport process needed to move themineral to the surface, anhydrite appears to only be associated withthe most geothermally active areas of the Salton Sea. Although insome areas, remnants of anhydrite were found in regions that couldhave potentially been active in recent history or are starting to developenough geothermal heat to create anhydrite (Fig. 7C). Similarly, theMg-sulfate mineral unit was found in the highest concentrations surround-ing geothermally active areas, although it is was well-distributedthroughout the SEBASS scene.We therefore postulate that the increasedheat at these vents help accelerate the transition of gypsum to anhydriteand accelerate the formation of the Mg-sulfate. Therefore, it is possiblethat the geothermal brines and liquefied mud transported anhydriteand the Mg-sulfate formed at depth to the surface and deposits themproximal to the vents.
Alternatively, anhydrite could also be leached out onto the surfacefollowing mixing with meteoric ground and surface waters (Azimi andPapangelakis, 2010). In the presence of pure water, at the typical surface
pressure of 1 atm, gypsum is the stable phase for calcium sulfate for tem-peratures below 40 °C, anhydrite is the stable phase for higher tempera-tures (MacDonald, 1953). Both the seven year ASTER thermal profile ofthe region and field measurements taken in 2010 found maximum sur-face temperatures of 38 °C. Although these temperatures were not hotenough for anhydrite to form on the surface, the proximity of these tem-peratures to the gypsum–anhydrite transition and air temperatures thatcommonly exceed 40 °C in the summer months mean that anhydrite islikely to form on the surface in sabhka-style syndepositional surface al-teration. However, climate conditions throughout most of the year atthe Salton Seawould favor gypsum rather than anhydrite andboth over-flights took place in early springwhen air temperatureswere too cool foranhydrite formation. Therefore, any anhydrite found on the surfacewould likely have been deposited relatively recently before the over-flights or formed solely due to subsurface heat flow. If this process rely-ing only on air temperatures were the dominant formation mechanismhowever, we would expect to find widespread anhydrite throughoutthe region,which is not the case. Therefore, subsurface heatflow is clear-ly critical in the mineral's formation and stability on the surface.

Fig. 7. End member mineral maps of three subscenes from the same SEBASS overpass collected on 6 April 2010 showing anhydrite in red, gypsum in blue, and quartz in green. A) Geo-thermal vents showing a larger concentration of anhydrite. B) Large amounts of gypsum identified on the surface of typical agriculturalfields. C) Inactive geothermal vents can be identifiedby sparse amounts of anhydrite at the surface.
Fig. 8. SEBASS data of the Sandbar Geothermal field acquired on 6 April 2010. (A) Mg sul-fatemineral in red, anhydrite in green, and gypsum inblue. Note the large amounts of bothanhydrite and the Mg sulfate mineral found surrounding this geothermal field in this re-gion. (B) Temperature image of the sandbar geothermal field, values are in °C.
Fig. 9.Mineralmaps created from the SEBASSdata of theDavis–SchrimpfGeothermalfieldwith anhydrite in red, the Mg sulfate mineral in green, and quartz in blue. The black boxdenotes the region of interest from which mineral percentages were extracted (Table 1).A) 26 March 2009. B) 6 April 2010.
34 K.A. Reath, M.S. Ramsey / Journal of Volcanology and Geothermal Research 265 (2013) 27–38
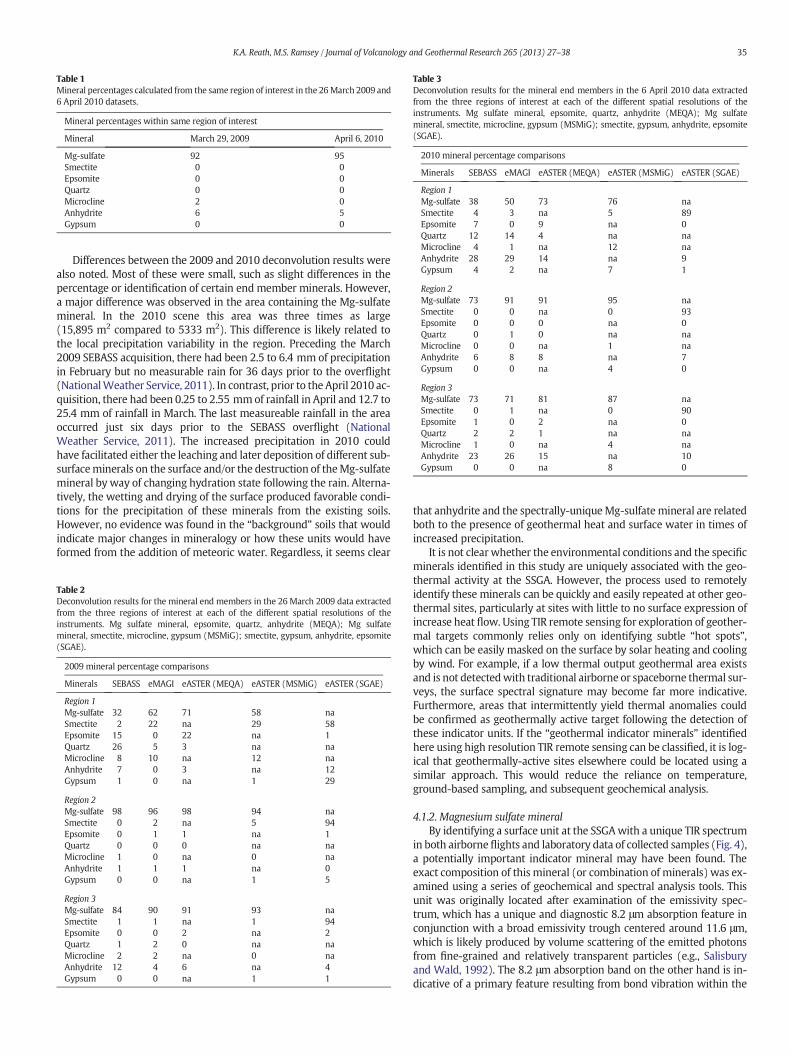
Table 1Mineral percentages calculated from the same region of interest in the 26March 2009 and6 April 2010 datasets.
Mineral percentages within same region of interest
Mineral March 29, 2009 April 6, 2010
Mg-sulfate 92 95Smectite 0 0Epsomite 0 0Quartz 0 0Microcline 2 0Anhydrite 6 5Gypsum 0 0
Table 3Deconvolution results for the mineral end members in the 6 April 2010 data extractedfrom the three regions of interest at each of the different spatial resolutions of theinstruments. Mg sulfate mineral, epsomite, quartz, anhydrite (MEQA); Mg sulfatemineral, smectite, microcline, gypsum (MSMiG); smectite, gypsum, anhydrite, epsomite(SGAE).
2010 mineral percentage comparisons
Minerals SEBASS eMAGI eASTER (MEQA) eASTER (MSMiG) eASTER (SGAE)
Region 1Mg-sulfate 38 50 73 76 naSmectite 4 3 na 5 89Epsomite 7 0 9 na 0Quartz 12 14 4 na naMicrocline 4 1 na 12 naAnhydrite 28 29 14 na 9Gypsum 4 2 na 7 1
Region 2Mg-sulfate 73 91 91 95 naSmectite 0 0 na 0 93Epsomite 0 0 0 na 0Quartz 0 1 0 na naMicrocline 0 0 na 1 naAnhydrite 6 8 8 na 7Gypsum 0 0 na 4 0
Region 3Mg-sulfate 73 71 81 87 naSmectite 0 1 na 0 90Epsomite 1 0 2 na 0Quartz 2 2 1 na naMicrocline 1 0 na 4 naAnhydrite 23 26 15 na 10Gypsum 0 0 na 8 0
35K.A. Reath, M.S. Ramsey / Journal of Volcanology and Geothermal Research 265 (2013) 27–38
Differences between the 2009 and 2010 deconvolution results werealso noted. Most of these were small, such as slight differences in thepercentage or identification of certain end member minerals. However,a major difference was observed in the area containing the Mg-sulfatemineral. In the 2010 scene this area was three times as large(15,895 m2 compared to 5333 m2). This difference is likely related tothe local precipitation variability in the region. Preceding the March2009 SEBASS acquisition, there had been 2.5 to 6.4 mm of precipitationin February but no measurable rain for 36 days prior to the overflight(NationalWeather Service, 2011). In contrast, prior to the April 2010 ac-quisition, there had been 0.25 to 2.55 mmof rainfall in April and 12.7 to25.4 mm of rainfall in March. The last measureable rainfall in the areaoccurred just six days prior to the SEBASS overflight (NationalWeather Service, 2011). The increased precipitation in 2010 couldhave facilitated either the leaching and later deposition of different sub-surfaceminerals on the surface and/or the destruction of theMg-sulfatemineral by way of changing hydration state following the rain. Alterna-tively, the wetting and drying of the surface produced favorable condi-tions for the precipitation of these minerals from the existing soils.However, no evidence was found in the “background” soils that wouldindicate major changes in mineralogy or how these units would haveformed from the addition of meteoric water. Regardless, it seems clear
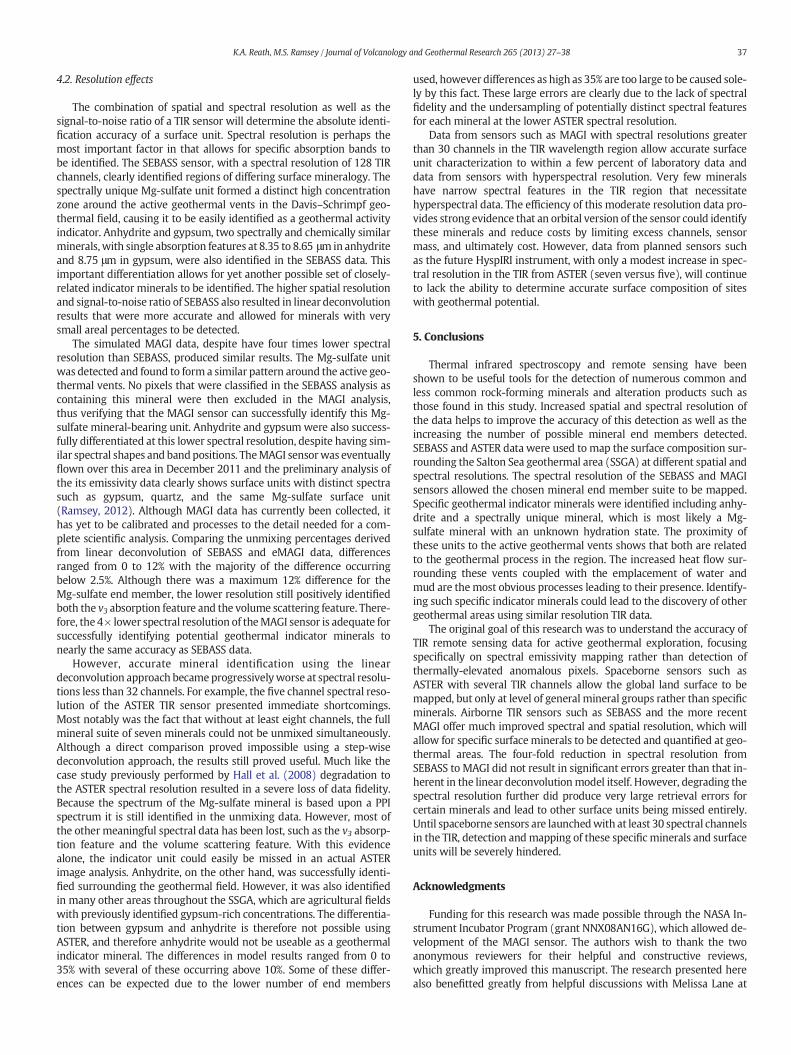
Table 2Deconvolution results for the mineral end members in the 26 March 2009 data extractedfrom the three regions of interest at each of the different spatial resolutions of theinstruments. Mg sulfate mineral, epsomite, quartz, anhydrite (MEQA); Mg sulfatemineral, smectite, microcline, gypsum (MSMiG); smectite, gypsum, anhydrite, epsomite(SGAE).
2009 mineral percentage comparisons
Minerals SEBASS eMAGI eASTER (MEQA) eASTER (MSMiG) eASTER (SGAE)
Region 1Mg-sulfate 32 62 71 58 naSmectite 2 22 na 29 58Epsomite 15 0 22 na 1Quartz 26 5 3 na naMicrocline 8 10 na 12 naAnhydrite 7 0 3 na 12Gypsum 1 0 na 1 29
Region 2Mg-sulfate 98 96 98 94 naSmectite 0 2 na 5 94Epsomite 0 1 1 na 1Quartz 0 0 0 na naMicrocline 1 0 na 0 naAnhydrite 1 1 1 na 0Gypsum 0 0 na 1 5
Region 3Mg-sulfate 84 90 91 93 naSmectite 1 1 na 1 94Epsomite 0 0 2 na 2Quartz 1 2 0 na naMicrocline 2 2 na 0 naAnhydrite 12 4 6 na 4Gypsum 0 0 na 1 1
that anhydrite and the spectrally-uniqueMg-sulfatemineral are relatedboth to the presence of geothermal heat and surface water in times ofincreased precipitation.
It is not clearwhether the environmental conditions and the specificminerals identified in this study are uniquely associated with the geo-thermal activity at the SSGA. However, the process used to remotelyidentify these minerals can be quickly and easily repeated at other geo-thermal sites, particularly at sites with little to no surface expression ofincrease heat flow. Using TIR remote sensing for exploration of geother-mal targets commonly relies only on identifying subtle “hot spots”,which can be easily masked on the surface by solar heating and coolingby wind. For example, if a low thermal output geothermal area existsand is not detectedwith traditional airborne or spaceborne thermal sur-veys, the surface spectral signature may become far more indicative.Furthermore, areas that intermittently yield thermal anomalies couldbe confirmed as geothermally active target following the detection ofthese indicator units. If the “geothermal indicator minerals” identifiedhere using high resolution TIR remote sensing can be classified, it is log-ical that geothermally-active sites elsewhere could be located using asimilar approach. This would reduce the reliance on temperature,ground-based sampling, and subsequent geochemical analysis.
4.1.2. Magnesium sulfate mineralBy identifying a surface unit at the SSGAwith a unique TIR spectrum
in both airborneflights and laboratory data of collected samples (Fig. 4),a potentially important indicator mineral may have been found. Theexact composition of this mineral (or combination of minerals) was ex-amined using a series of geochemical and spectral analysis tools. Thisunit was originally located after examination of the emissivity spec-trum, which has a unique and diagnostic 8.2 μm absorption feature inconjunction with a broad emissivity trough centered around 11.6 μm,which is likely produced by volume scattering of the emitted photonsfrom fine-grained and relatively transparent particles (e.g., Salisburyand Wald, 1992). The 8.2 μm absorption band on the other hand is in-dicative of a primary feature resulting from bond vibration within the

Fig. 10.Mineral maps created from the SEBASS data of the Davis–Schrimpf Geothermal field with anhydrite in red, the Mg sulfate mineral in green, and quartz in blue. These images arefrom the same area, at the same time, and map the same minerals. A) SEBASS, B) eMAGI, and C) eASTER.
36 K.A. Reath, M.S. Ramsey / Journal of Volcanology and Geothermal Research 265 (2013) 27–38
mineral structure. Its presence was confirmed by analyzing the labora-tory spectrum of a soil sample collected during the field campaign.However, some differences were noted, including a slight shift in wave-length position and the presence of a single band rather than the dou-blet seen in the SEBASS spectra (Fig. 4). This absorption features issimilar to the ν3 found in sulfates that range from 8.0 to 9.5 μm (Lane,2007). However, the position of the band differs from that of other pub-lished sulfateminerals. Such a change could be attributed to a change inthe hydration state of themineral either with transport from the field orduring preparation for the laboratory analysis, which requires heatingfor 24 hours at a temperature of 80 °C. Sulfates have a notoriously var-iable ν3 which can be affected by hydration states. For example, meta-stable secondary sulfates like those mentioned in Hammarstrom et al.(2005) can be present in the field and later break-down during trans-port and changing temperature and humidity conditions. Regardlessof these spectral changes, this absorption feature was identified in sam-ples collected in March and July, although it was much more shallow inthe July spectrum indicating a change in particle size as a result of trans-port and/or a reduction in the amount of the mineral over time (similarto the SEBASS results).
Further tests were then conducted in hopes of isolating and identify-ing the mineral in this sample. SEM was performed on 5 grains of thesample and a full elemental analysis of each of these grains was collect-ed. An XRD analysis was also performed that unfortunately provided in-conclusive results, finding only minerals that do not match the TIRspectra of this unit. However, during the XRD analysis two peaks at ap-proximately 20 and 73° 2θwere found and sulfur and iron found in SEManalysis, were unaccounted. Of the grains analyzed only one containedthe elements sulfur and iron; it also contained carbon, oxygen, sodium,
magnesium, aluminum, silicon, chlorine, potassium, calcium, and titani-um. These elements are the same as those found in sulfate salts.
The TIR emission spectra of numerous sulfate salts were examinedand some were found to have a strong TIR absorption closely resem-bling the unknown mineral, but at higher wavelengths. However, intheory a Mg–S pairing as well as dehydration would cause the absorp-tion feature to move to lower wavelengths. In experiments done inLane, 2007 the center of the ν3 feature in MgSO4 was found to vary byas much as 0.7 μm depending on hydration states. Therefore, it is be-lieved that in order for such a low wavelength absorption feature tobe present, themineral must be some form of very to highly dehydratedmagnesium sulfate. Whereas the spectrum found in the lab and remotedata does not match that of a pure Mg-sulfate, the variable naturelends to addition cations (Bloedite [Na2Mg(SO4)2·4H2O], Polyhalite[K2Ca2Mg(SO4)4·2H2O)], Pickeringite [MgAl2 (SO4)4·22H2O]) and wellas addition anions (Kainite [KMgSO4Cl·H2O]) becoming incorporatedinto the structure. It is believed that this is the case for this mineral, how-ever the Mg–SO4 pairing in believed to dominate the structure, thereforeit is referred to as the Mg-sulfate mineral. This conclusion is further sup-ported based on the image compositional analysis and comparisons tothe local meteorological data, the Mg-sulfate unit was determined to bewater soluble enough to leach out during heavy rains and become crys-talline in as few as six days of dry weather. It was found to be friableenough to erode away rather quickly, causing the reduced amounts onthe surface as seen in the 2009 dataset that followed prolonged dry con-ditions. These facts combinedwith the geochemical and spectral analysestogether lead to the conclusion that the unidentified mineral is likely aMg-sulfate salt with an unknown hydration state that has yet to befully identified using TIR spectroscopy or other geochemical techniques.
37K.A. Reath, M.S. Ramsey / Journal of Volcanology and Geothermal Research 265 (2013) 27–38
4.2. Resolution effects
The combination of spatial and spectral resolution as well as thesignal-to-noise ratio of a TIR sensor will determine the absolute identi-fication accuracy of a surface unit. Spectral resolution is perhaps themost important factor in that allows for specific absorption bands tobe identified. The SEBASS sensor, with a spectral resolution of 128 TIRchannels, clearly identified regions of differing surface mineralogy. Thespectrally unique Mg-sulfate unit formed a distinct high concentrationzone around the active geothermal vents in the Davis–Schrimpf geo-thermal field, causing it to be easily identified as a geothermal activityindicator. Anhydrite and gypsum, two spectrally and chemically similarminerals,with single absorption features at 8.35 to 8.65 μmin anhydriteand 8.75 μm in gypsum, were also identified in the SEBASS data. Thisimportant differentiation allows for yet another possible set of closely-related indicator minerals to be identified. The higher spatial resolutionand signal-to-noise ratio of SEBASS also resulted in linear deconvolutionresults that were more accurate and allowed for minerals with verysmall areal percentages to be detected.
The simulated MAGI data, despite have four times lower spectralresolution than SEBASS, produced similar results. The Mg-sulfate unitwas detected and found to form a similar pattern around the active geo-thermal vents. No pixels that were classified in the SEBASS analysis ascontaining this mineral were then excluded in the MAGI analysis,thus verifying that the MAGI sensor can successfully identify this Mg-sulfate mineral-bearing unit. Anhydrite and gypsumwere also success-fully differentiated at this lower spectral resolution, despite having sim-ilar spectral shapes and bandpositions. TheMAGI sensorwas eventuallyflown over this area in December 2011 and the preliminary analysis ofthe its emissivity data clearly shows surface units with distinct spectrasuch as gypsum, quartz, and the same Mg-sulfate surface unit(Ramsey, 2012). Although MAGI data has currently been collected, ithas yet to be calibrated and processes to the detail needed for a com-plete scientific analysis. Comparing the unmixing percentages derivedfrom linear deconvolution of SEBASS and eMAGI data, differencesranged from 0 to 12% with the majority of the difference occurringbelow 2.5%. Although there was a maximum 12% difference for theMg-sulfate end member, the lower resolution still positively identifiedboth the v3 absorption feature and the volume scattering feature. There-fore, the 4× lower spectral resolution of theMAGI sensor is adequate forsuccessfully identifying potential geothermal indicator minerals tonearly the same accuracy as SEBASS data.
However, accurate mineral identification using the lineardeconvolution approach becameprogressivelyworse at spectral resolu-tions less than 32 channels. For example, the five channel spectral reso-lution of the ASTER TIR sensor presented immediate shortcomings.Most notably was the fact that without at least eight channels, the fullmineral suite of seven minerals could not be unmixed simultaneously.Although a direct comparison proved impossible using a step-wisedeconvolution approach, the results still proved useful. Much like thecase study previously performed by Hall et al. (2008) degradation tothe ASTER spectral resolution resulted in a severe loss of data fidelity.Because the spectrum of the Mg-sulfate mineral is based upon a PPIspectrum it is still identified in the unmixing data. However, most ofthe other meaningful spectral data has been lost, such as the v3 absorp-tion feature and the volume scattering feature. With this evidencealone, the indicator unit could easily be missed in an actual ASTERimage analysis. Anhydrite, on the other hand, was successfully identi-fied surrounding the geothermal field. However, it was also identifiedin many other areas throughout the SSGA, which are agricultural fieldswith previously identified gypsum-rich concentrations. The differentia-tion between gypsum and anhydrite is therefore not possible usingASTER, and therefore anhydrite would not be useable as a geothermalindicator mineral. The differences in model results ranged from 0 to35% with several of these occurring above 10%. Some of these differ-ences can be expected due to the lower number of end members
used, however differences as high as 35% are too large to be caused sole-ly by this fact. These large errors are clearly due to the lack of spectralfidelity and the undersampling of potentially distinct spectral featuresfor each mineral at the lower ASTER spectral resolution.
Data from sensors such as MAGI with spectral resolutions greaterthan 30 channels in the TIR wavelength region allow accurate surfaceunit characterization to within a few percent of laboratory data anddata from sensors with hyperspectral resolution. Very few mineralshave narrow spectral features in the TIR region that necessitatehyperspectral data. The efficiency of this moderate resolution data pro-vides strong evidence that an orbital version of the sensor could identifythese minerals and reduce costs by limiting excess channels, sensormass, and ultimately cost. However, data from planned sensors suchas the future HyspIRI instrument, with only a modest increase in spec-tral resolution in the TIR from ASTER (seven versus five), will continueto lack the ability to determine accurate surface composition of siteswith geothermal potential.
5. Conclusions
Thermal infrared spectroscopy and remote sensing have beenshown to be useful tools for the detection of numerous common andless common rock-forming minerals and alteration products such asthose found in this study. Increased spatial and spectral resolution ofthe data helps to improve the accuracy of this detection as well as theincreasing the number of possible mineral end members detected.SEBASS and ASTER data were used to map the surface composition sur-rounding the Salton Sea geothermal area (SSGA) at different spatial andspectral resolutions. The spectral resolution of the SEBASS and MAGIsensors allowed the chosen mineral end member suite to be mapped.Specific geothermal indicator minerals were identified including anhy-drite and a spectrally unique mineral, which is most likely a Mg-sulfate mineral with an unknown hydration state. The proximity ofthese units to the active geothermal vents shows that both are relatedto the geothermal process in the region. The increased heat flow sur-rounding these vents coupled with the emplacement of water andmud are themost obvious processes leading to their presence. Identify-ing such specific indicator minerals could lead to the discovery of othergeothermal areas using similar resolution TIR data.
The original goal of this research was to understand the accuracy ofTIR remote sensing data for active geothermal exploration, focusingspecifically on spectral emissivity mapping rather than detection ofthermally-elevated anomalous pixels. Spaceborne sensors such asASTER with several TIR channels allow the global land surface to bemapped, but only at level of general mineral groups rather than specificminerals. Airborne TIR sensors such as SEBASS and the more recentMAGI offer much improved spectral and spatial resolution, which willallow for specific surfaceminerals to be detected and quantified at geo-thermal areas. The four-fold reduction in spectral resolution fromSEBASS to MAGI did not result in significant errors greater than that in-herent in the linear deconvolutionmodel itself. However, degrading thespectral resolution further did produce very large retrieval errors forcertain minerals and lead to other surface units being missed entirely.Until spaceborne sensors are launchedwith at least 30 spectral channelsin the TIR, detection andmapping of these specific minerals and surfaceunits will be severely hindered.
Acknowledgments
Funding for this research was made possible through the NASA In-strument Incubator Program (grant NNX08AN16G), which allowed de-velopment of the MAGI sensor. The authors wish to thank the twoanonymous reviewers for their helpful and constructive reviews,which greatly improved this manuscript. The research presented herealso benefitted greatly from helpful discussions with Melissa Lane at

38 K.A. Reath, M.S. Ramsey / Journal of Volcanology and Geothermal Research 265 (2013) 27–38
the Planetary Science Institute about the spectral features seen in raresulfate minerals.
References
Abrams, M., 2000. The Advanced Spaceborne Thermal Emission and Reflection Radiome-ter (ASTER): data products for the high spatial resolution imager on NASA's Terraplatform. Int. J. Remote Sens. 21 (5), 847–859.
Adams, J.B., Smith, M.O., Johnson, P.E., 1986. Spectral mixture modeling: a new analysis ofrock and soil types at the Viking Lander 1 site. J. Geophys. Res. 91 (B8), 8098–8112.
Adams, J.B., Smith, M.O., Gillespie, A.R., 1989. Simple models for complex natural surfaces:a strategy for the hyperspectral era of remote sensing. Proc. IGARSS Can. Symp. Re-mote Sens., 12th, pp. 16–21.
Azimi, G., Papangelakis, V.G., 2010. The solubility of gypsum and anhydrite in simulatedlaterite pressure acid leach solutions up to 250 ° C. Hydrometallurgy 102 (1), 1–13.
Baldridge, A.M., Hook, S.J., Grove, C.I., Rivera, G., 2009. The ASTER spectral library version2.0. Remote Sens. Environ. 113, 711–715.
Buck, B.J., King, J., Etyemezian, V., 2011. Effects of salt mineralogy on dust emissions,Salton Sea, California. Soil Sci. Soc. Am. J. 75 (5), 1971–1985.
Christensen, P.R., Bandfield, J.L., Hamilton, V.E., Howard, D.A., Lane, M.D., Piatek, J.L., Ruff,S.W., Stefanov, W.L., 2000. A thermal emission spectral library of rock-forming min-erals. J. Geophys. 9735–9739.
Crowley, J.K., Hook, S.J., 1996. Mapping playa evaporite minerals and associated sedi-ments in Death Valley, California, with multispectral thermal infrared images.J. Geophys. Res. Solid Earth (1978–2012) 101 (B1), 643–660.
Dean, K.G., Dehn, J., Papp, K.R., Smith, S., Izbekov, P., Peterson, R., Steffke, A., 2004. Inte-grated satellite observations of the 2001 eruption of Mt. Cleveland, Alaska.J. Volcanol. Geotherm. Res. 135 (1), 51–73.
Elders,W.A., Sass, J.H., 1988. AnOverview of the Salton Sea Drilling Project, JGR November10.
Elders, W.A., Biehler, S., Rex, R.W., Robinson, P.T., Meidav, T., 1972. Crustal spreading inSouthern California: the Imperial Valley and the Gulf of California formed by therifting apart of a continental plate. Science 178, 15–24. http://dx.doi.org/10.1126/science.178.4056.15.
Gillespie, A.R., 1985. Lithologic mapping of silicate rocks using TIMS. The TlMSData User'sWorkshop, June 18–19, 1985, JPL Pub. 86-38, pp. 29–44.
Gillespie, A.R., 1992a. Enhancement of multispectral thermal infrared images:decorrelation contrast stretching. Remote Sens. Environ. 42, 147–155.
Gillespie, A.R., 1992b. Spectral mixture analysis of multispectral thermal infrared images.Remote Sens. Environ. 42 (2), 137–145.
Gillespie, A.R., Kahle, A.B.., Palluconi, F.D., 1984. Mapping alluvial fans in Death Valley, CA,using multispectral thermal infrared images. Geophys. Res. Lett. 11 (11), 1153–1156.
Gillespie, A.R., Kahle, A.B.., Walker, R.E., 1986. Color enhancement of highly correlated im-ages: I. Decorrelation and HIS contrast stretches. Remote Sens. Environ. 20, 209–235.
Hackwell, J.A., Warren, D.W., Bongiovi, R.P., Hansel, S.J., Hayhurst, T.L., Mabry, D.J., Sivjee,M.G., Skinner, J.W., 1996. LWIR/MWIR imaging hyperspectral sensor for airborne andground-based remote sensing. Proc. SPIE 2819, 102–107.
Hall, J.L., Hackwell, J.A., Tratt, D.M., Warren, D.W., Young, S.J., 2008. Space-based mineraland gas identification using a high-performance thermal infrared imaging spectrom-eter. Proc. SPIE 7082, 70820M.
Hammarstrom, J.M., Seal II, R.R., Meier, A.L., Kornfeld, J.M., 2005. Secondary sulfate min-erals associated with acid drainage in the eastern US: recycling of metals and acidityin surficial environments. Chem. Geol. 215 (1), 407–431.
Helgeson, H.C., 1968. Geologic and thermodynamic characteristics and the Salton Sea geo-thermal system. Am. J. Sci. 266, 129–166 (March).
Herzig, C.T., Mehegan, J.M., Stelting, C.E., 1988. Lithostratigraphy of the State 2–14 bore-hole: Salton Sea scientific drilling project. Journal of Geophysical Research 93 (B11)12969-12912.
Hook, S.J., Abbott, E.A., Grove, C., Kahle, A.B.., Palluconi, F.D., 1999. Use of multispectralthermal infrared data in geological studies, In: Rencz, A.N. (Ed.), 3rd ed. Remote Sens-ing for the Earth Sciences: Manual of Remote Sensing, vol. 3. Wiley, New York,pp. 59–110.
Hook, S.J., Myers, J., Thome, K.J., Fitzgerald, M., Kahle, A.B.., 2001. The MODIS/ASTER air-borne simulator (MASTER) — a new instrument for earth science studies. RemoteSens. Environ. 76, 93–102.
Ives, R.L., 1951. Mud volcanoes of the Salton depression. Rocks Miner 26, 227–235.Johnson, B.R., Young, S.J., 1998. In-Scene Atmospheric Compensation: Application to
SEBASS Data Collected at the ARM Site. Technical Report, Space and EnvironmentTechnology Center, The Aerospace Corporation, May.
Jordan, G., Astilleros, J.M., 2006. In situ HAFM study of the thermal dehydration ongypsum (010) surfaces. Am. Mineral. 91 (4), 619–627.
Kahle, A.B.., Rowan, L.C., 1980. Evaluation of multispectral middle infrared aircraft imagesfor lithologic mapping in the East Tintic Mountains, Utah. Geology 8, 234–239.
King, P.L., Ramsey, M.S., McMillan, P.F., Swayze, G., 2004. Laboratory Fourier transform in-frared spectroscopy methods for geologic samples. In: King, P.L., Ramsey, M.S.,Swayze, G.A. (Eds.), Infrared Spectroscopy in Geochemistry, Exploration Geochemistry,
and Remote Sensing, 33. Mineralogical Association of Canada, London, Ontario,pp. 57–91.
King, J., Etyemezian, V., Sweeney, M., Buck, B.J., Nikolich, G., 2011. Dust emission variabil-ity at the Salton Sea, California, USA. Aeolian Res. 3 (1), 67–79.
Lane, M.D., 2007. Mid-infrared emission spectroscopy of sulfate and sulfate-bearing min-erals. Am. Mineral. 92 (1), 1–18.
Lynch, D.K., Hudnut, K.W., Adams, P.M., 2013. Development and growth ofrecently-exposed fumarole fields near Mullet Island, Imperial County, California.Geomorphology 193, 27–44.
MacDonald, G.J.F., 1953. Anhydrite–gypsum equilibrium relations. Am. J. Sci. 251,884–898.
National Weather Service, 2011. Advanced Hydrologic Prediction Service, Precipitation.water.weather.gov/precip/ (May 12, 2001).
Onderdonk, N., Mazzini, A., Shafer, L., Svensen, H., 2011. Controls on the geomorphic ex-pression and evolution of gryphons, pools, and caldera features at hydrothermalseeps in the Salton Sea Geothermal Field, southern California. Geomorphology 130(3), 327–342.
Prata, A.J., Grant, I.F., 2001. Determination of mass loadings and plume heights of volcanicash clouds from satellite data. CSIRO Atmospheric Research Technical Paper, 48 (41 pp.).
Ramsey, M.S., 2012. Implications of temporal and spectral resolution changes for HyspIRITIR data of volcanoes, 2012 HyspIRI Science Workshop, Washington, DC.
Ramsey, M.S., Christensen, P.R., 1998. Mineral abundance determination: quantitativedeconvolution of thermal emission spectra. JGR 103 (B1), 577–596.
Realmuto, V.J., 1990. Separating the effects of temperature and emissivity: emissivityspectrum normalization. Proceedings of the 2nd TIMS Workshop, 2, pp. 31–35.
Rowan, L.C., Mars, J.C., Simpson, C.J., 2005. Lithologic mapping of theMordor, NT, Australiaultramafic complex by using the Advanced Spaceborne Thermal Emission and Reflec-tion Radiometer (ASTER). Remote Sens. Environ. 99 (1), 105–126.
Ruff, S.W., Christensen, P.R., Barbera, P.W., Anderson, D.L., 1997. Quantitative thermalemission spectroscopy of minerals: a laboratory technique for measurement andcalibration. J. Geophys. Res. All Ser. 102, 14.
Sabine, C., Realmuto, V.J., Taranik, J.V., 1994. Quantitative estimation of granitoidcomposition from thermal infrared multispectral scanner (TIMS) data, desola-tion wilderness, Northern Sierra Nevada, California. J. Geophys. Res. 99 (B3),4261–4271.
Salisbury, J.W., Wald, A., 1992. The role of volume scattering in reducing spectral contrastof reststrahlen bands in spectra of powdered minerals. Icarus 96, 121–128.
Salisbury, J.W.,Wald, A., D'Aria, D.M., 1994. Thermal‐infrared remote sensing and Kirchhoff'slaw: 1. Laboratory measurements. J. Geophys. Res. Solid Earth (1978–2012) 99 (B6),11897–11911.
Short, N.M., Stuart, L.M., 1983. The heat capacity mapping mission (HCMM) anthology.NASA SP, vol. 465. US Government Printing Office, Washington, DC.
Spencer, R.J., 2000. Sulfate minerals in evaporite deposits, in sulfate minerals: crystallog-raphy, geochemistry, and environmental significance. Rev. Mineral. Geochem. 40.
Sturz, A.A., Kamps, R.L., Earley, P.J., 1992. Temporal changes in mud volcanos, Salton Seageothermal area. Water-Rock Interact. 2, 1363–1366.
Svensen, H., Karlsen, D.A., Sturz, A., Backer-Owe, K., Banks, D.A., Planke, S., 2007. Processescontrolling water and hydrocarbon composition in seeps from the Salton Sea geo-thermal system, California, USA. Geology 35 (1), 85–88.
Svensen, H., Hammer, Ø., Mazzini, A., Onderdonk, N., Polteau, S., Planke, S., Podladchikov,Y., 2009. Dynamics of hydrothermal seeps from the Salton Sea Geothermal System(California, USA) constrained by temperature monitoring and time series analysis.J. Geophys. Res. B09201. http://dx.doi.org/10.1029/2008JB00624.
Sweeney,M.R., McDonald, E.V., Etyemezian, V., 2011. Quantifying dust emissions from de-sert landforms, eastern Mojave Desert, USA. Geomorphology 135 (1), 21–34.
Taranik, J.V., 1988. Application of aerospace remote sensing technology to exploration forprecious metal deposits in the western United States. In: Schafer, R.W. (Ed.), BulkMineable Precious Metal Deposits of the Western United States, GSN SymposiumProceedings. Geological Society of Nevada, Reno, NV, pp. 551–575.
Thome, K., Palluconi, F., Takashima, T., Masuda, K., 1998. Atmospheric correction of ASTER.IEEE Trans. Geosci. Remote Sens. 36 (4), 1199–1211.
Thompson, J.M., Fournier, R.O., 1988. Chemistry and geothermometry of brine producedfrom the Salton Sea scientific drill hole, Imperial Valley, California. J. Geophys. Res.93, 13,165–13,173.
Van de Kamp, P.C., 1973. Holocene continental sedimentation in the Salton Basin,California: a reconnaissance. Geol. Soc. Am. Bull. 84, 827–848.
Vaughan, R.G., Calvin, W.M., Taranik, J.V., 2003. SEBASS hyperspectral thermal infrareddata: surface emissivity measurement and mineral mapping. Remote Sens. Environ.85, 48–63.
Wolf, E., Born, M., 1965. Principles of Optics. Pergamon Press.Wright, R., Flynn, L., Garbeil, H., Harris, A., Pilger, E., 2002. Automated volcanic eruption
detection using MODIS. Remote Sens. Environ. 82 (1), 135–155.Younker, L.W., Kasameyer, P.W., Tewhey, J.D., 1982. Geological, geophysical, and thermal
characteristics of the Salton Sea Geothermal Field, California. J. Volcanol. Geoth. Res.12 (3–4), 221–258.
Zhang, X., Pazner, M., Duke, N., 2007. Lithologic and mineral information extraction forgold exploration using ASTER data in the south Chocolate Mountains (California).ISPRS J. Photogramm. Remote Sens. 62 (4), 271–282.