Section 12.1: EXPONENTIAL FUNCTIONS Evaluate exponential ...
Exploration of
Exponential Functions

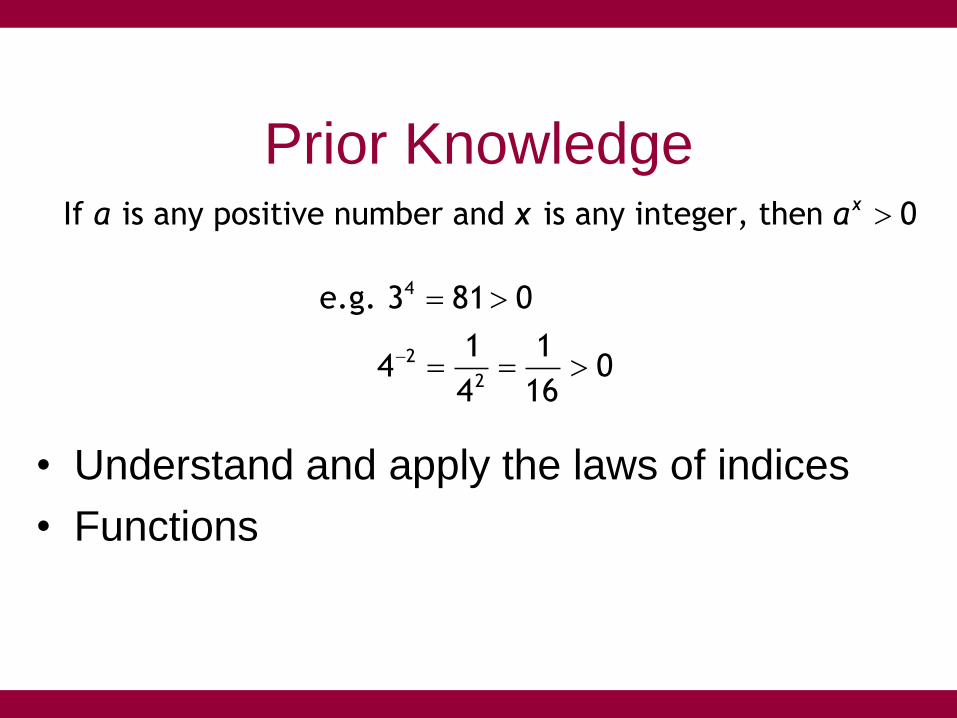
Prior Knowledge
• Understand and apply the laws of indices
• Functions
4
2
2
If is any positive number and is any integer, then 0
e.g. 3 81 0
1 14 0
164
xa x a
4
2
2
If is any positive number and is any integer, then 0
e.g. 3 81 0
1 14 0
164
xa x a
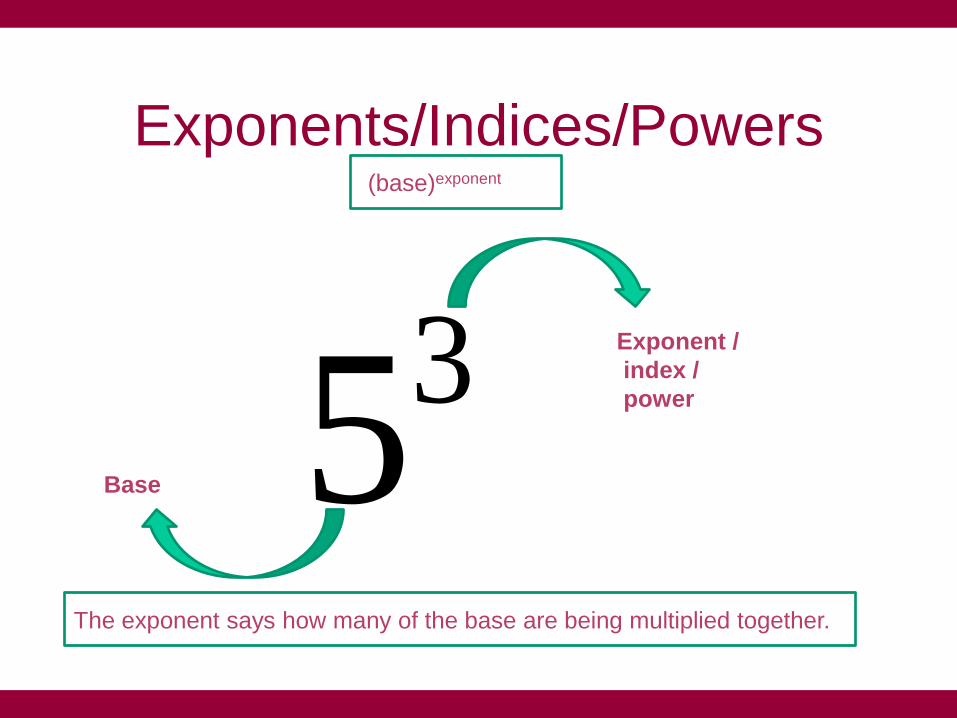
Exponents/Indices/Powers
35Exponent /
index /
power
Base
(base)exponent
The exponent says how many of the base are being multiplied together.
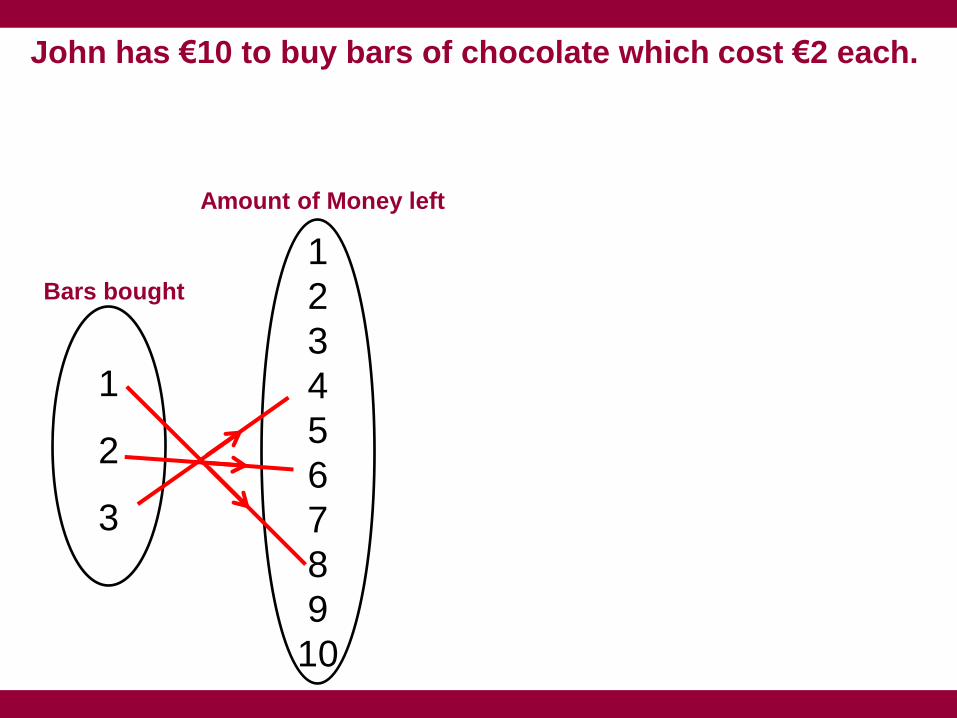
John has €10 to buy bars of chocolate which cost €2 each.
1
2
3
1
2
3
4
5
6
7
8
9
10
Bars bought
Amount of Money left
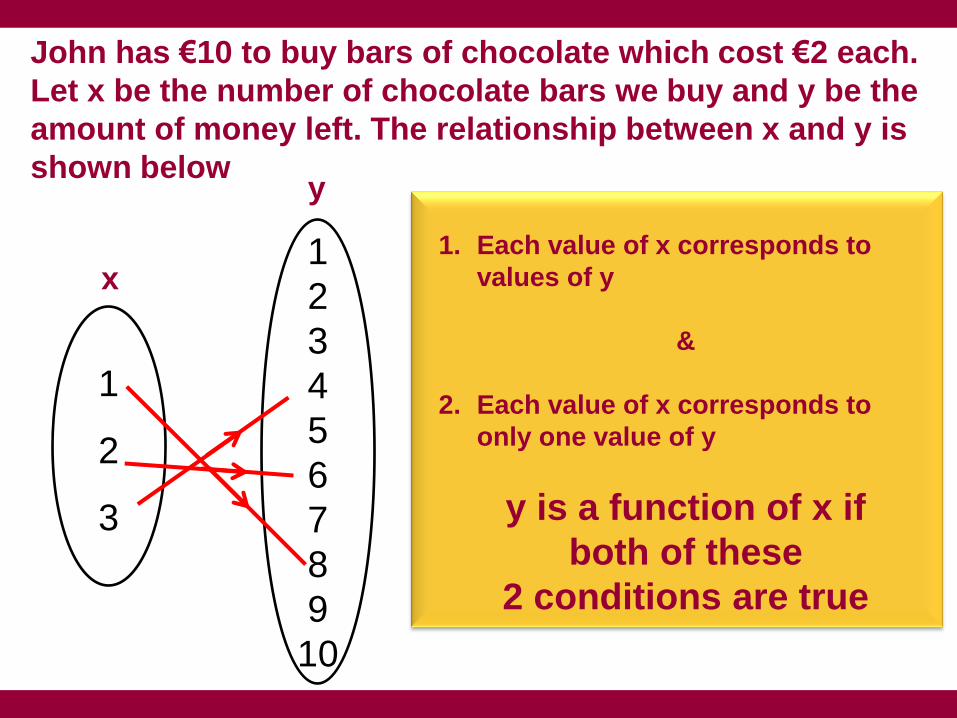
John has €10 to buy bars of chocolate which cost €2 each.
Let x be the number of chocolate bars we buy and y be the
amount of money left. The relationship between x and y is
shown below
1
2
3
1
2
3
4
5
6
7
8
9
10
x
y
1. Each value of x corresponds to
values of y
&
2. Each value of x corresponds to
only one value of y
y is a function of x if
both of these
2 conditions are true
1
2
3
4
1
2
3
1
2
3
4
1
2
3
4
1
3
4
1
2
3
4
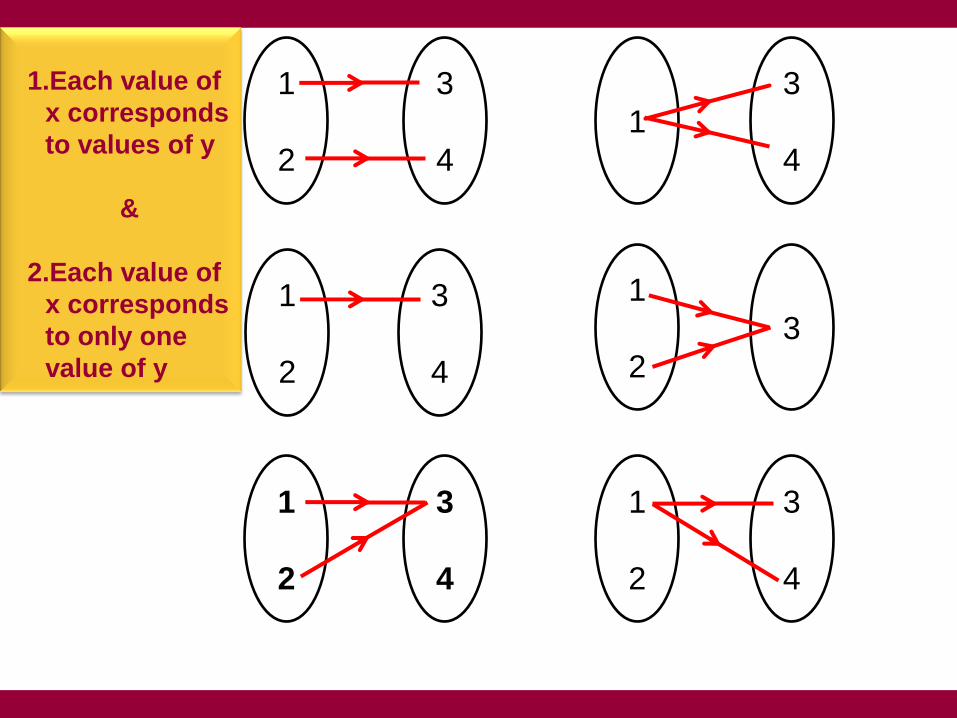
1.Each value of
x corresponds
to values of y
&
2.Each value of
x corresponds
to only one
value of y
1
2
3
4
1
2
3
1
2
3
4
1
2
3
4
1
3
4
1
2
3
4
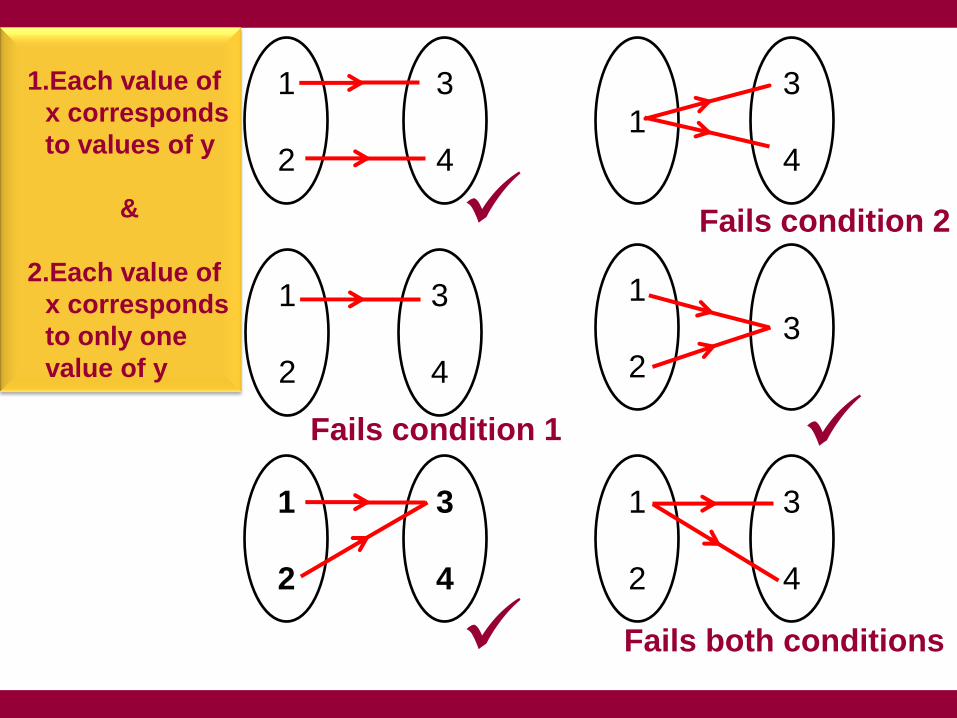
Fails condition 2
Fails condition 1
Fails both conditions
1.Each value of
x corresponds
to values of y
&
2.Each value of
x corresponds
to only one
value of y
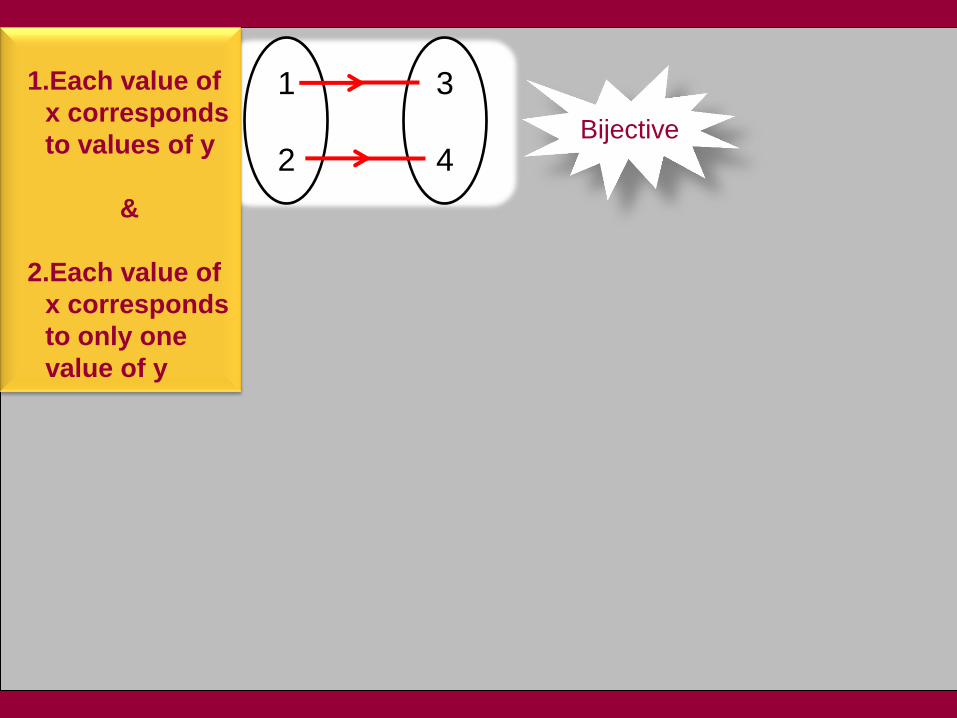
Bijective
1
2
3
4
1.Each value of
x corresponds
to values of y
&
2.Each value of
x corresponds
to only one
value of y
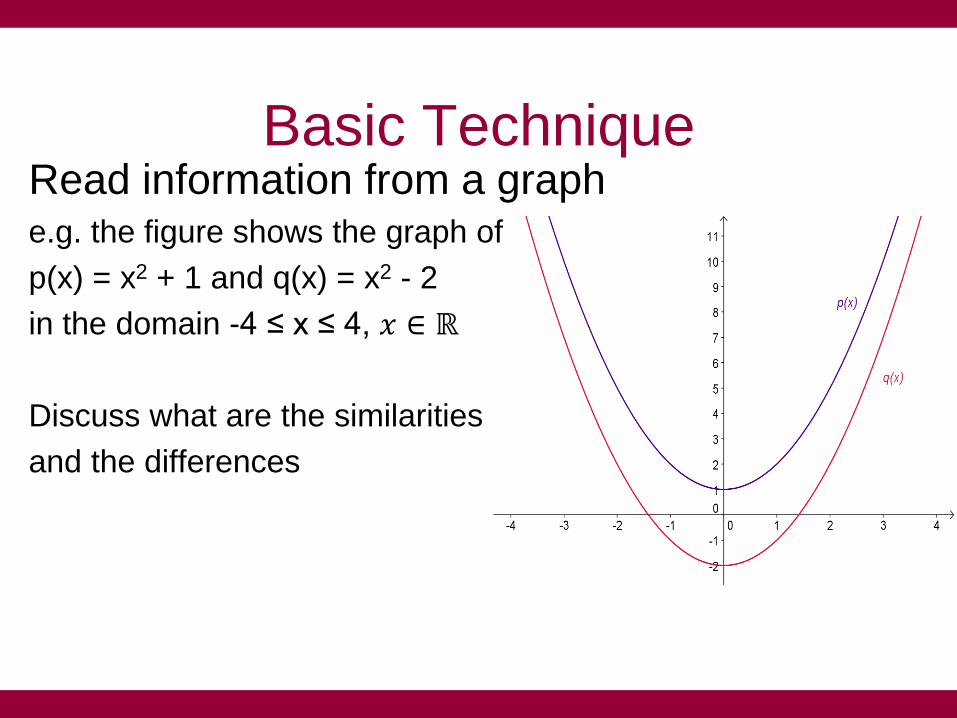
Basic Technique Read information from a graph e.g. the figure shows the graph of
p(x) = x2 + 1 and q(x) = x2 - 2
in the domain -4 ≤ x ≤ 4, 𝑥 ∈ ℝ
Discuss what are the similarities
and the differences

Basic Technique Read information from a graph e.g. the figure shows the graph of
P(x) = x2 + 1
in the domain -4 ≤ x ≤ 4, 𝑥 ∈ ℝ
• The graph has no x- intercepts
• Its y intercept is 1
• For x ≥ 0, x2 + 1 increases as x increases
• For x ≤ 0, x2 + 1 increases as x decreases
Exponential Functions Learning Outcomes
After completing this session you will be able to:
1. Understand the properties of exponential
functions
2. Learn the features of their graphs
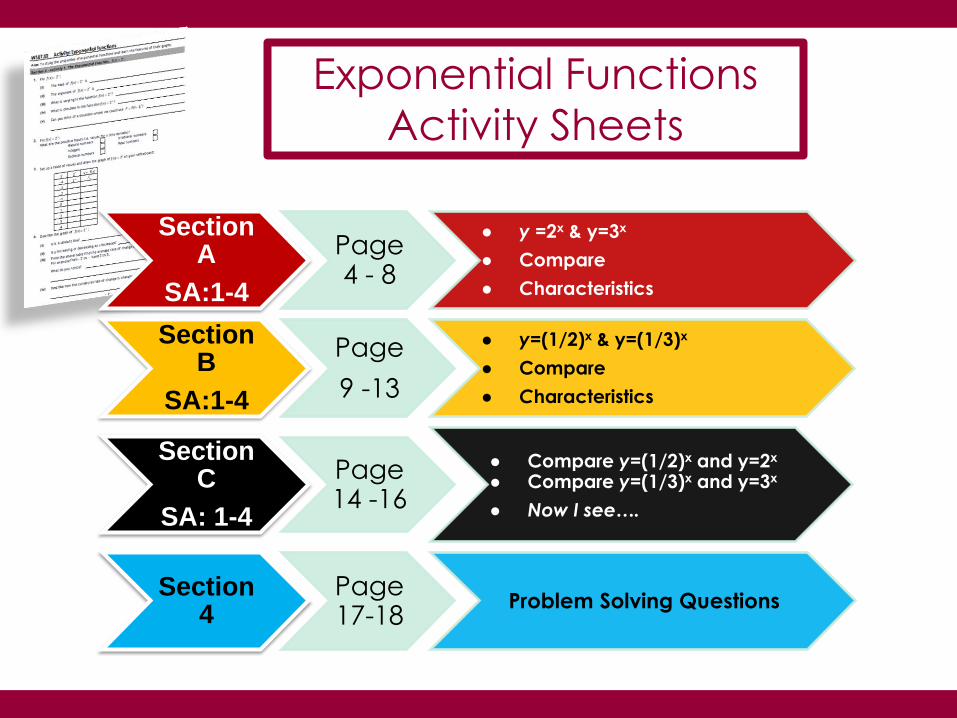
Section A
SA:1-4
Page 4 - 8
● y =2x & y=3x
● Compare
● Characteristics
Section B
SA:1-4
Page
9 -13
● y=(1/2)x & y=(1/3)x
● Compare
● Characteristics
Section C
SA: 1-4
Page 14 -16
● Compare y=(1/2)x and y=2x
● Compare y=(1/3)x and y=3x
● Now I see….
Section 4
Page 17-18
Problem Solving Questions
Exponential Functions
Activity Sheets
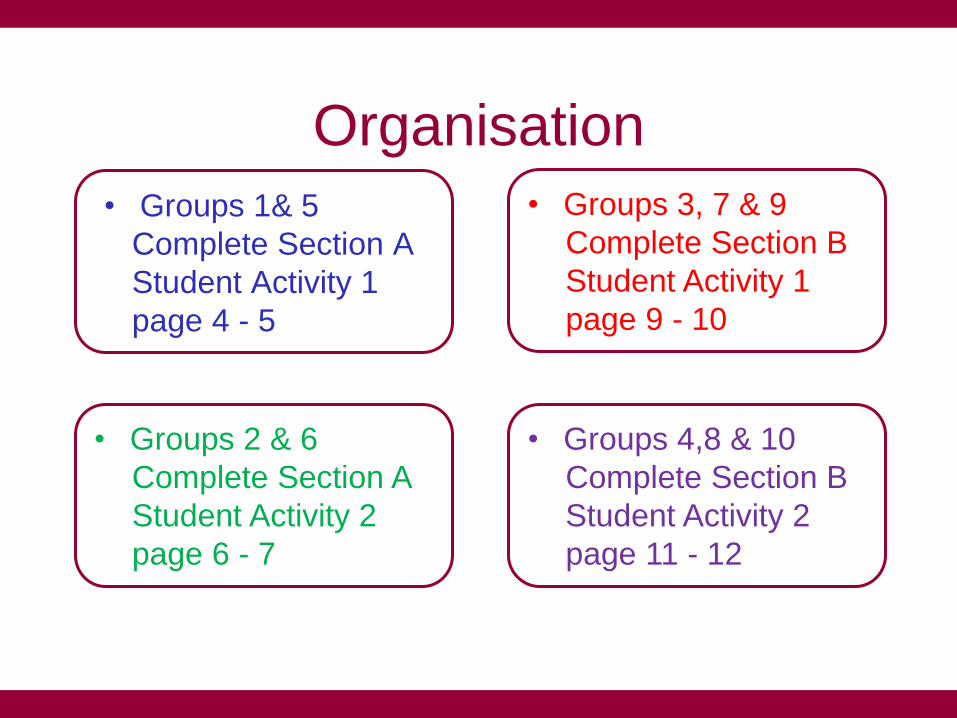
Organisation
• Groups 1& 5
Complete Section A
Student Activity 1
page 4 - 5
• 2
• Groups 2 & 6
Complete Section A
Student Activity 2
page 6 - 7
• Groups 3, 7 & 9
Complete Section B
Student Activity 1
page 9 - 10
• Groups 4,8 & 10
Complete Section B
Student Activity 2
page 11 - 12
• Groups 1& 5
Section A
Student Activity 1
page 4 - 5
• Groups 2 & 6
Section A
Student Activity 2
page 6 - 7
Feedback
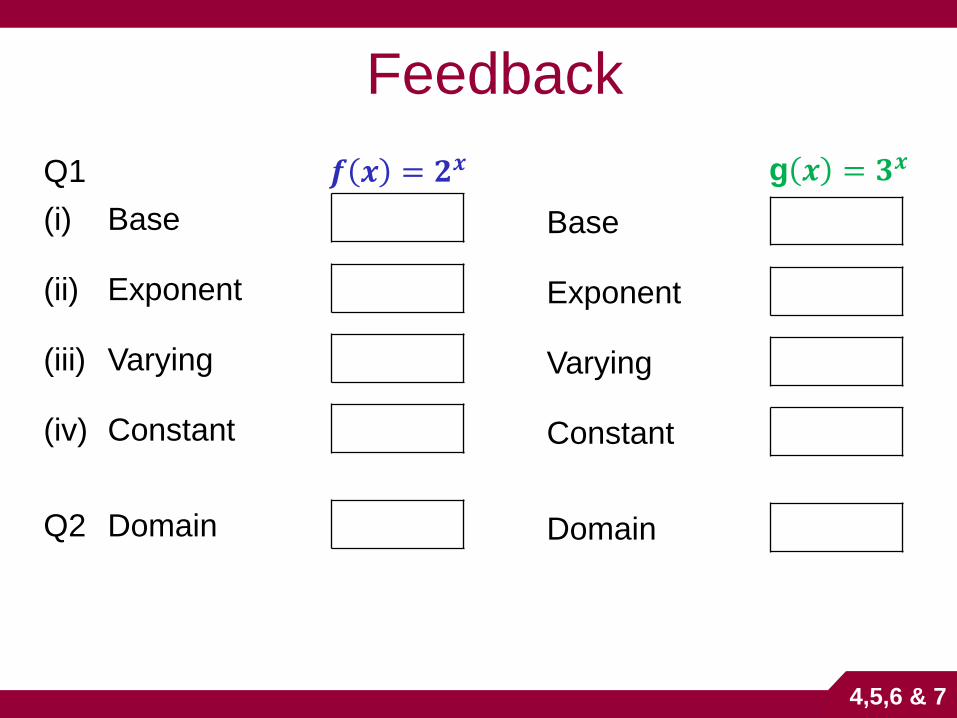
Q1
(i) Base
(ii) Exponent
(iii) Varying
(iv) Constant
Q2 Domain
Base
Exponent
Varying
Constant
Domain
𝒇 𝒙 = 𝟐𝒙 g 𝒙 = 𝟑𝒙
Feedback
4,5,6 & 7
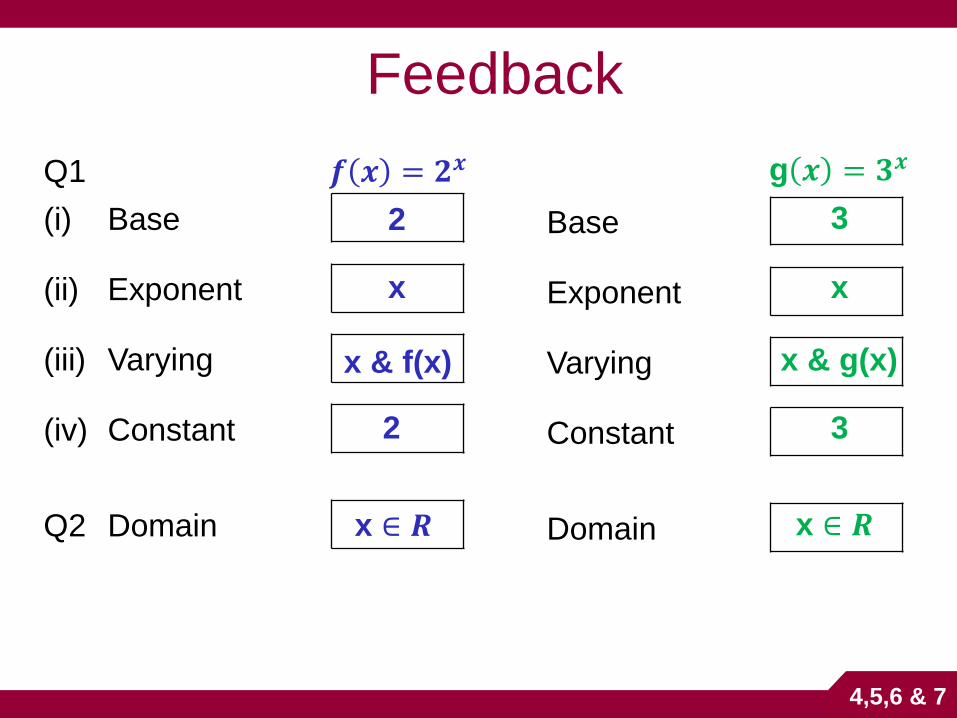
Q1
(i) Base
(ii) Exponent
(iii) Varying
(iv) Constant
Q2 Domain
2
x
x & f(x)
2
Base
Exponent
Varying
Constant
Domain
3
x
x & g(x)
3
x ∈ 𝑹 x ∈ 𝑹
𝒇 𝒙 = 𝟐𝒙 g 𝒙 = 𝟑𝒙
Feedback
4,5,6 & 7
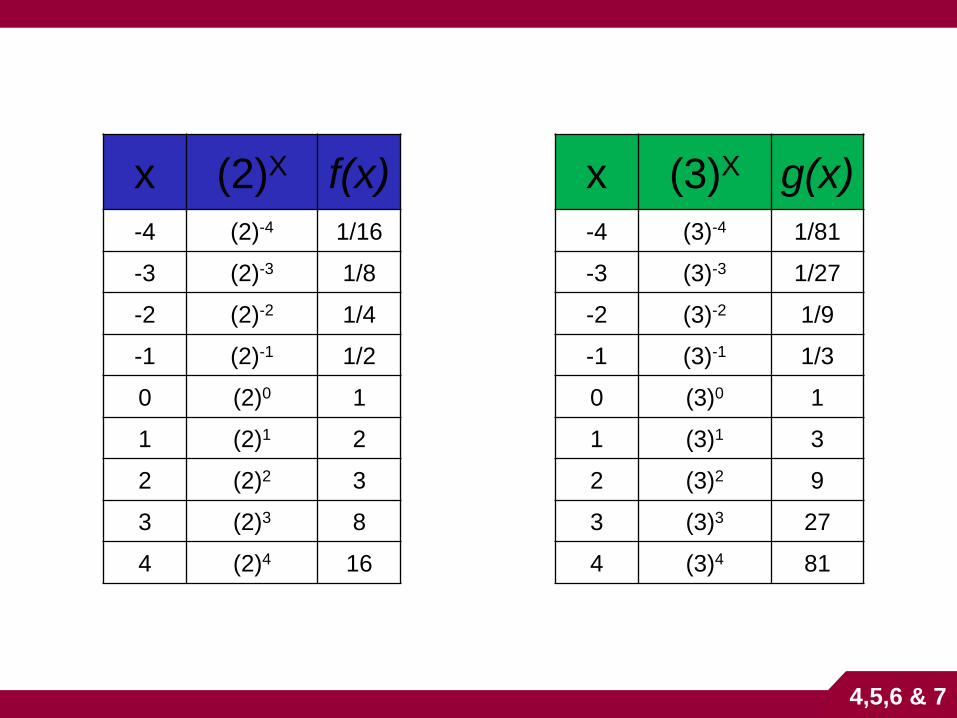
x (2)X f(x)
-4 (2)-4 1/16
-3 (2)-3 1/8
-2 (2)-2 1/4
-1 (2)-1 1/2
0 (2)0 1
1 (2)1 2
2 (2)2 3
3 (2)3 8
4 (2)4 16
x (3)X g(x)
-4 (3)-4 1/81
-3 (3)-3 1/27
-2 (3)-2 1/9
-1 (3)-1 1/3
0 (3)0 1
1 (3)1 3
2 (3)2 9
3 (3)3 27
4 (3)4 81
4,5,6 & 7
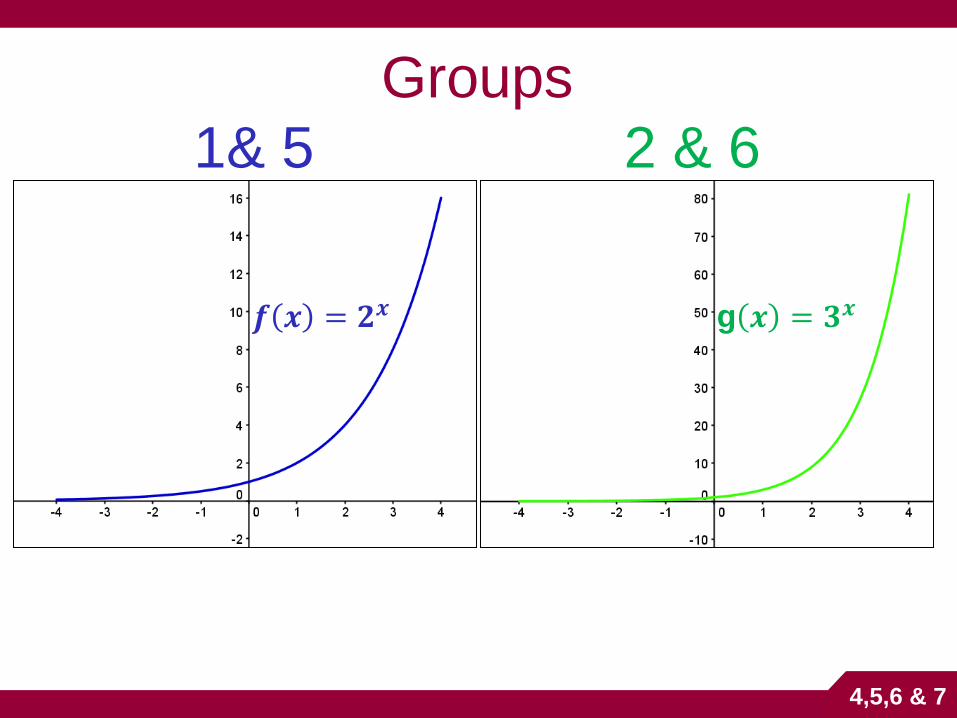
Groups
1& 5 2 & 6
3x 𝒇 𝒙 = 𝟐𝒙 g 𝒙 = 𝟑𝒙
4,5,6 & 7
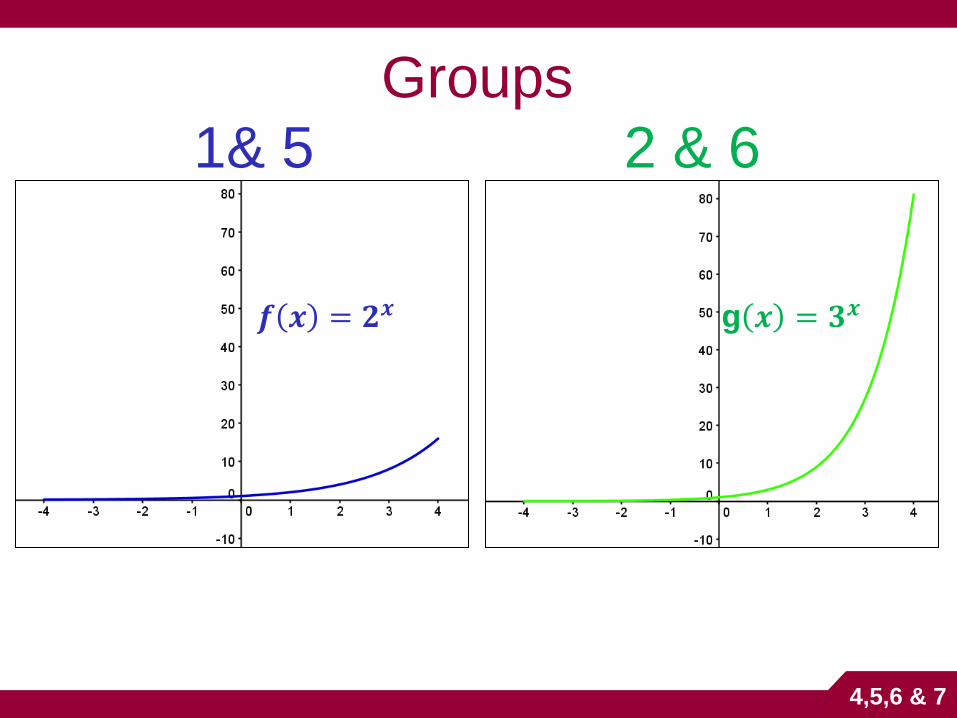
3x 𝒇 𝒙 = 𝟐𝒙 g 𝒙 = 𝟑𝒙
Groups
1& 5 2 & 6
4,5,6 & 7
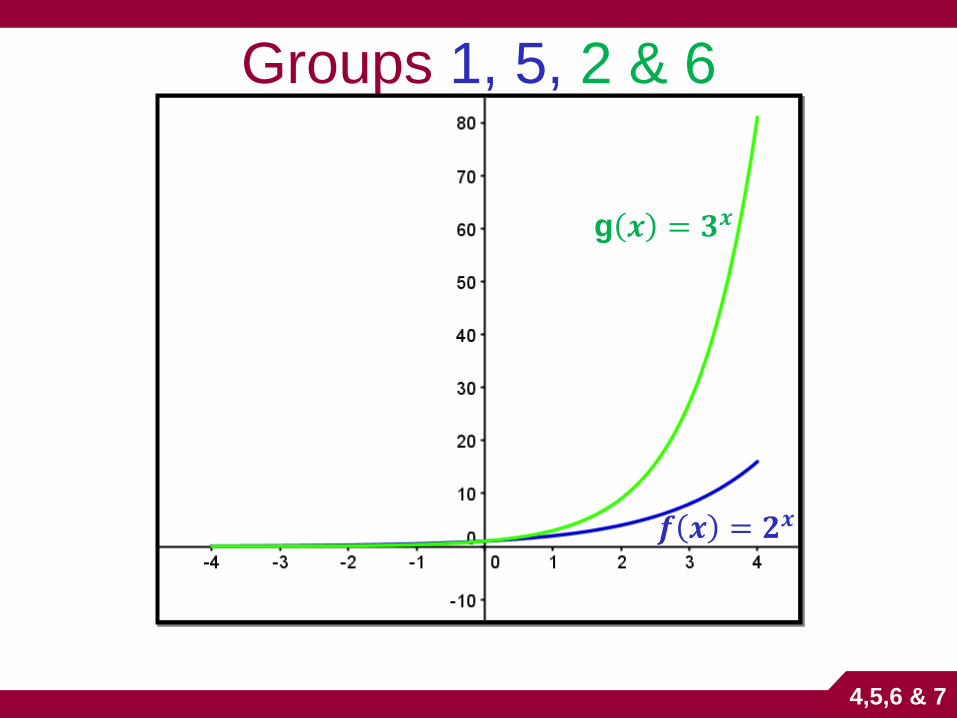
Groups 1, 5, 2 & 6
2x
3x g 𝒙 = 𝟑𝒙
𝒇 𝒙 = 𝟐𝒙
4,5,6 & 7
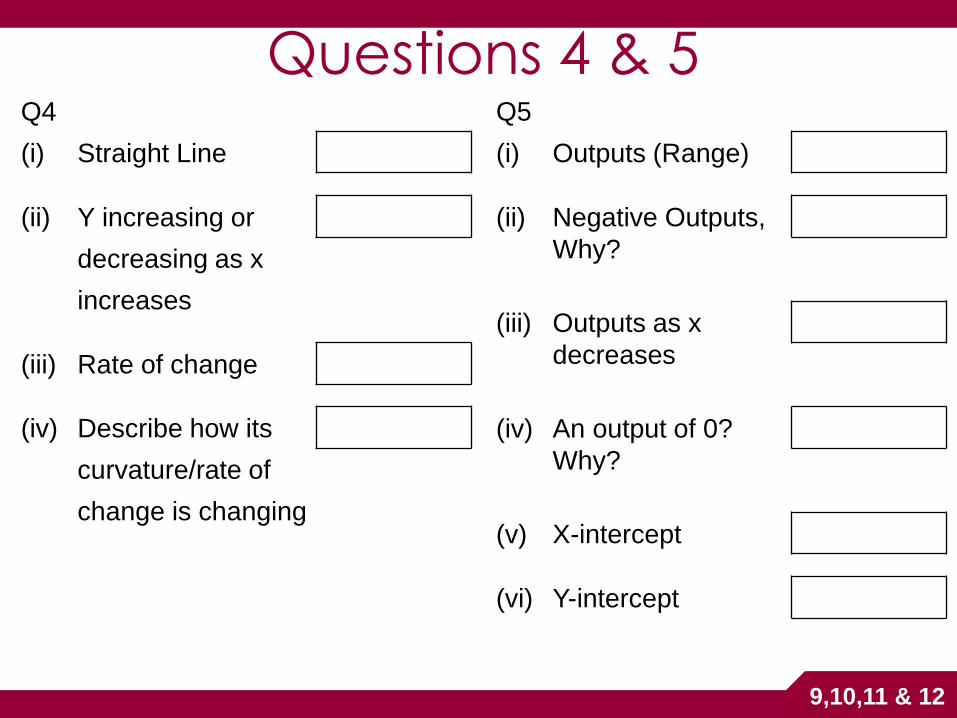
Q4
(i) Straight Line
(ii) Y increasing or
decreasing as x
increases
(iii) Rate of change
(iv) Describe how its
curvature/rate of
change is changing
Q5
(i) Outputs (Range)
(ii)
Negative Outputs,
Why?
(iii)
Outputs as x
decreases
(iv)
An output of 0?
Why?
(v) X-intercept
(vi) Y-intercept
No
Increasing
R+
No
Decreases
No
None
1
Not constant
Questions 4 & 5
4,5,6 & 7
Increasing
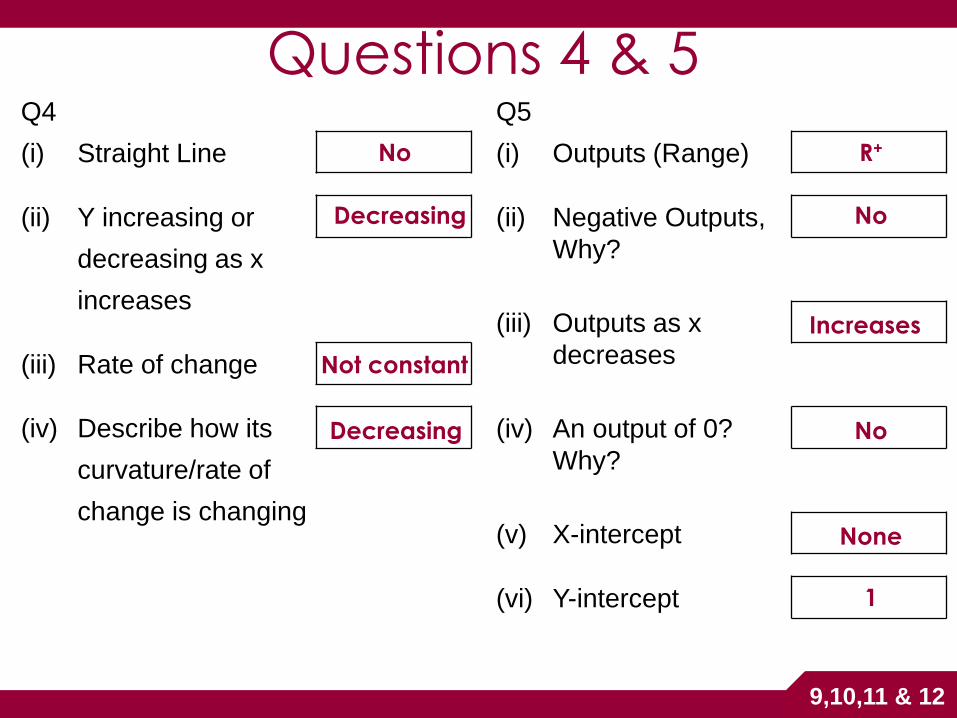
Q4
(i) Straight Line
(ii) Y increasing or
decreasing as x
increases
(iii) Rate of change
(iv) Describe how its
curvature/rate of
change is changing
Q5
(i) Outputs (Range)
(ii)
Negative Outputs,
Why?
(iii)
Outputs as x
decreases
(iv)
An output of 0?
Why?
(v) X-intercept
(vi) Y-intercept
Questions 4 & 5
4,5,6 & 7
Feedback
• Groups 3, 7 & 9
Section B
Student Activity 1
page 9 - 10
• Groups 4,8 & 10
Section B
Student Activity 2
page 11 - 12
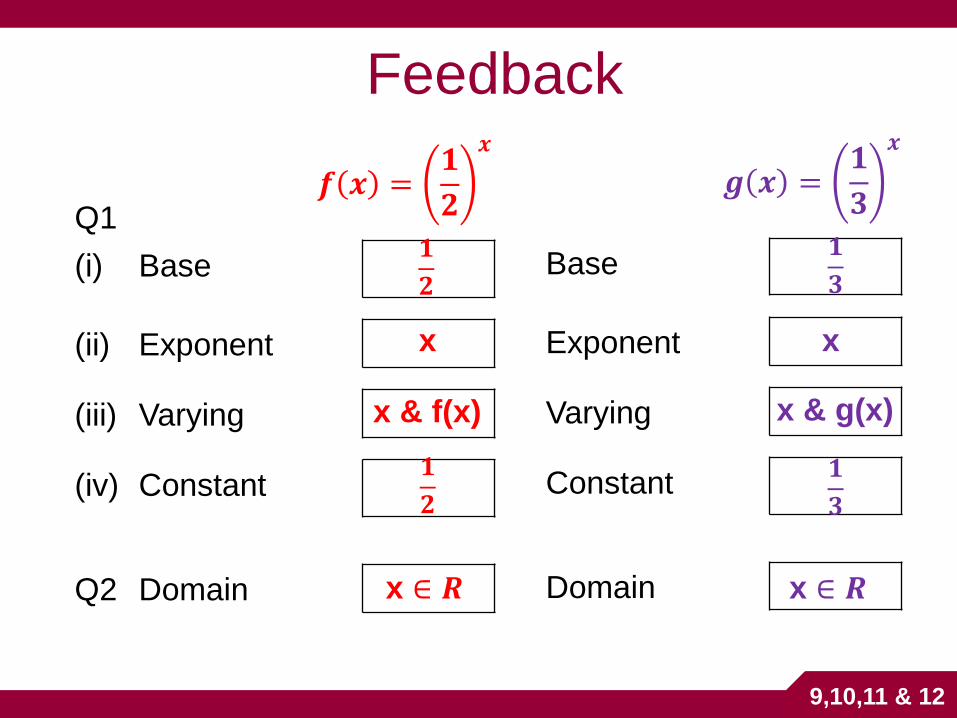
Q1
(i) Base
(ii) Exponent
(iii) Varying
(iv) Constant
Q2 Domain
Base
Exponent
Varying
Constant
Domain
x
x & f(x)
𝒈 𝒙 =𝟏
𝟑
𝒙
𝟏
𝟐
𝟏
𝟐
𝒇 𝒙 =𝟏
𝟐
𝒙
x
x & g(x)
𝟏
𝟑
𝟏
𝟑
x ∈ 𝑹 x ∈ 𝑹
Feedback
9,10,11 & 12
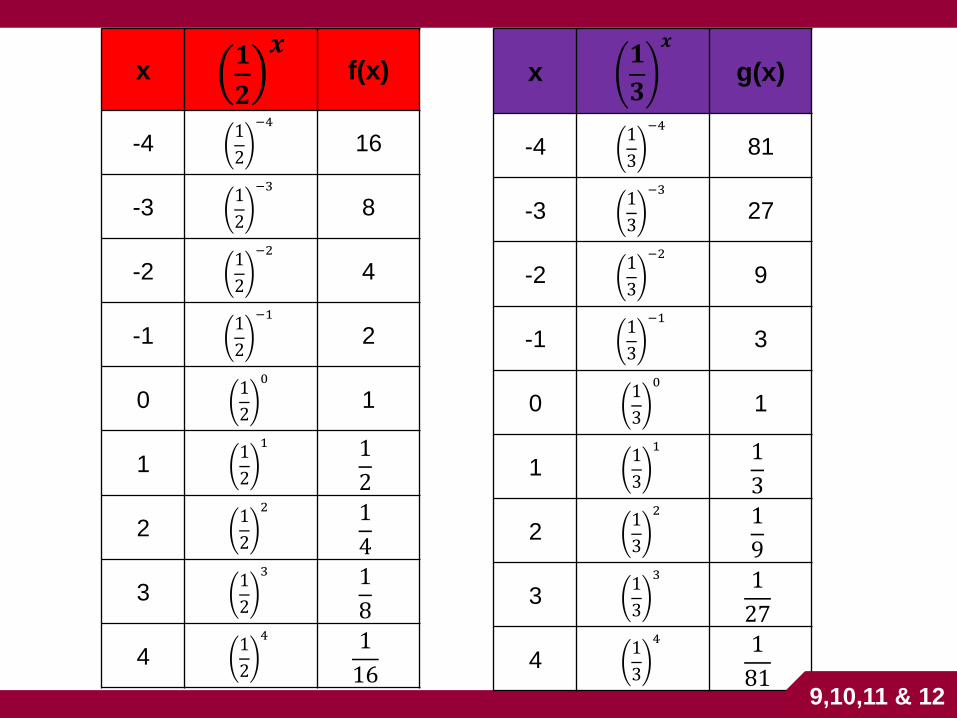
x 𝟏
𝟐
𝒙 f(x)
-4 1
2
−4
16
-3 1
2
−3
8
-2 1
2
−2
4
-1 1
2
−1
2
0 1
2
0
1
1 1
2
1
1
2
2 1
2
2
1
4
3 1
2
3
1
8
4 1
2
4
1
16
x 𝟏
𝟑
𝒙
g(x)
-4 1
3
−4
81
-3 1
3
−3
27
-2 1
3
−2
9
-1 1
3
−1
3
0 1
3
0
1
1 1
3
1
1
3
2 1
3
2
1
9
3 1
3
3
1
27
4 1
3
4
1
81
9,10,11 & 12
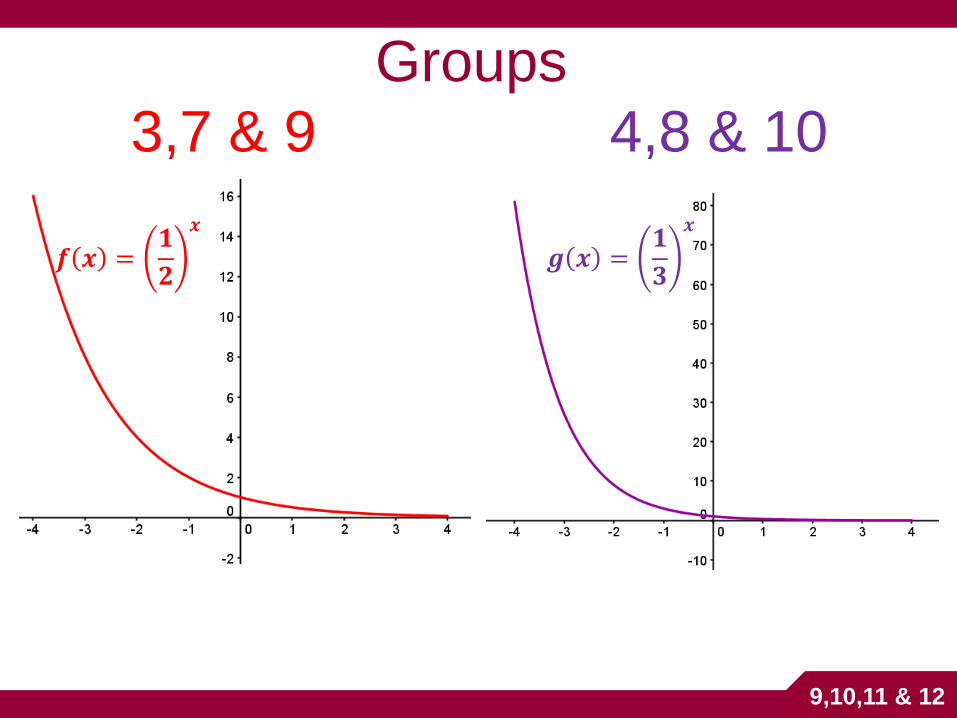
Groups
3,7 & 9 4,8 & 10
𝒇 𝒙 =
𝟏
𝟐
𝒙
𝒈 𝒙 =𝟏
𝟑
𝒙
9,10,11 & 12
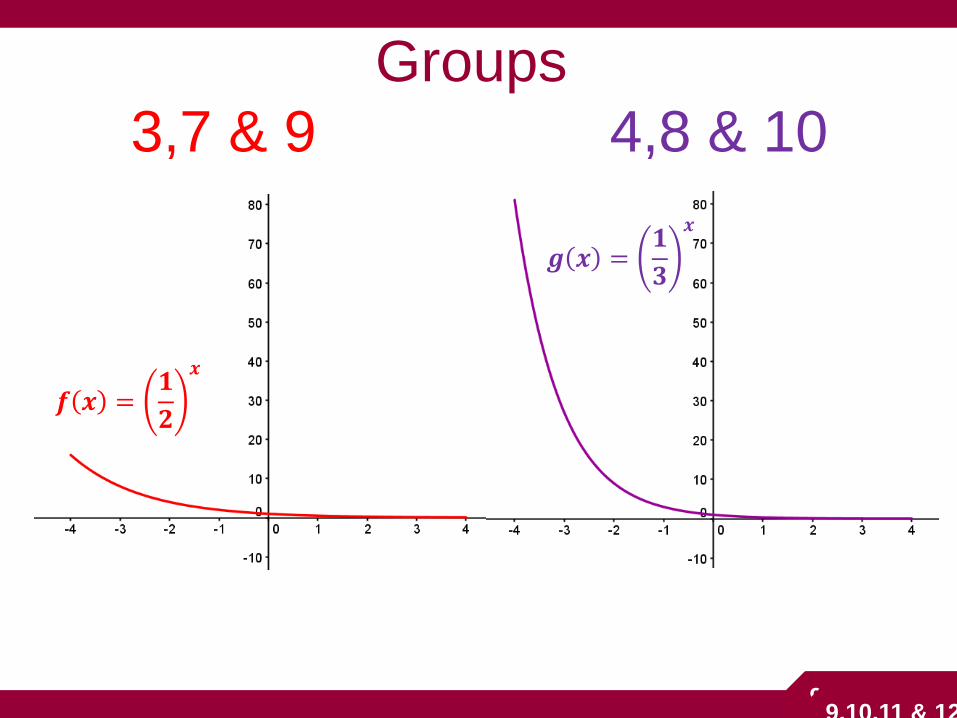
𝒇 𝒙 =𝟏
𝟐
𝒙
𝒈 𝒙 =𝟏
𝟑
𝒙
Groups
3,7 & 9 4,8 & 10
9,10,11 & 12 9,10,11 & 12
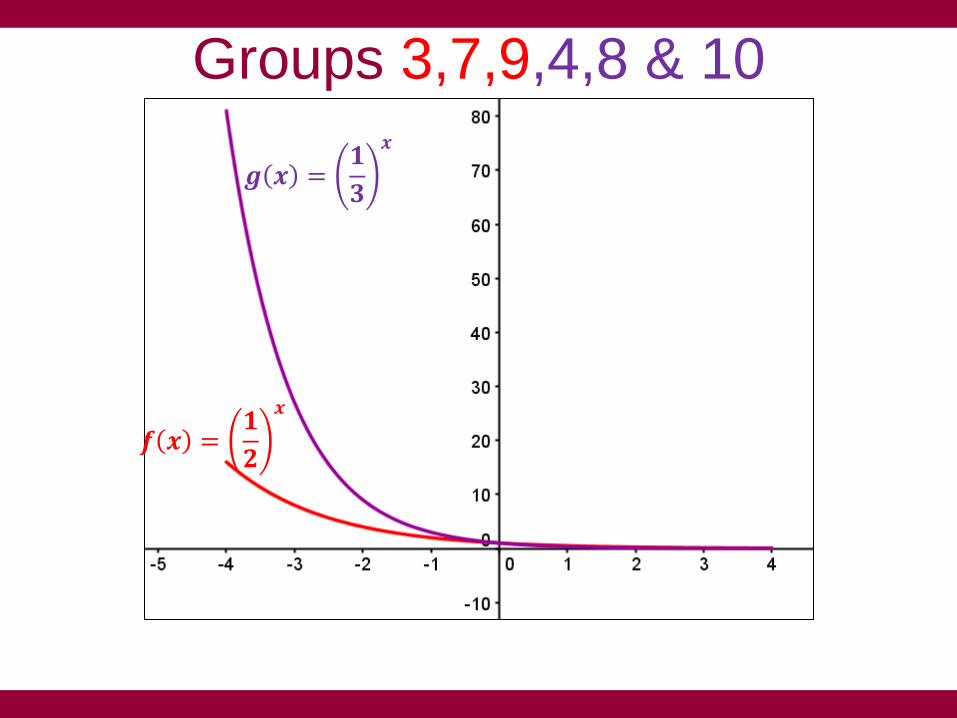
Groups 3,7,9,4,8 & 10
𝒈 𝒙 =𝟏
𝟑
𝒙
𝒇 𝒙 =𝟏
𝟐
𝒙
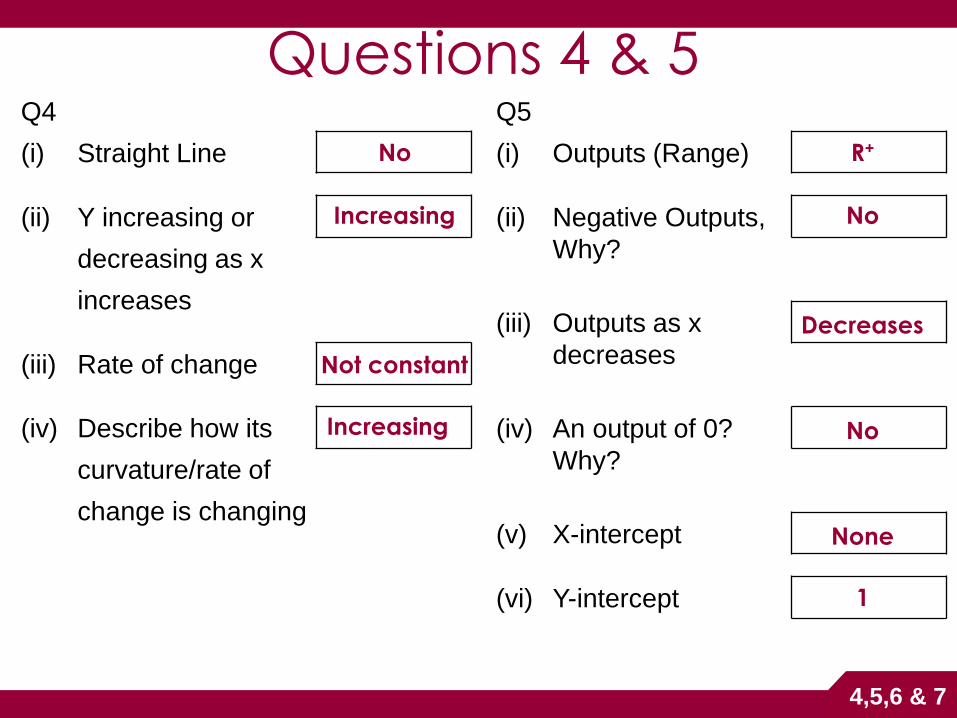
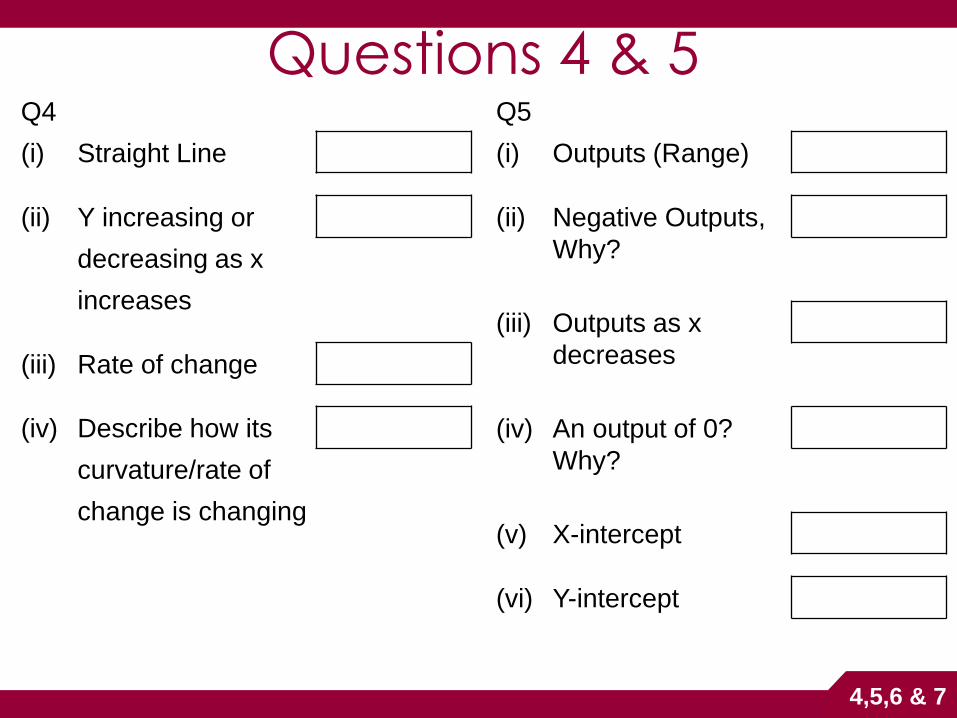
Q4
(i) Straight Line
(ii) Y increasing or
decreasing as x
increases
(iii) Rate of change
(iv) Describe how its
curvature/rate of
change is changing
Q5
(i) Outputs (Range)
(ii)
Negative Outputs,
Why?
(iii)
Outputs as x
decreases
(iv)
An output of 0?
Why?
(v) X-intercept
(vi) Y-intercept
Questions 4 & 5
9,10,11 & 12
Q4
(i) Straight Line
(ii) Y increasing or
decreasing as x
increases
(iii) Rate of change
(iv) Describe how its
curvature/rate of
change is changing
Q5
(i) Outputs (Range)
(ii)
Negative Outputs,
Why?
(iii)
Outputs as x
decreases
(iv)
An output of 0?
Why?
(v) X-intercept
(vi) Y-intercept
No
Decreasing
R+
No
Increases
No
None
1
Not constant
Questions 4 & 5
9,10,11 & 12
Decreasing
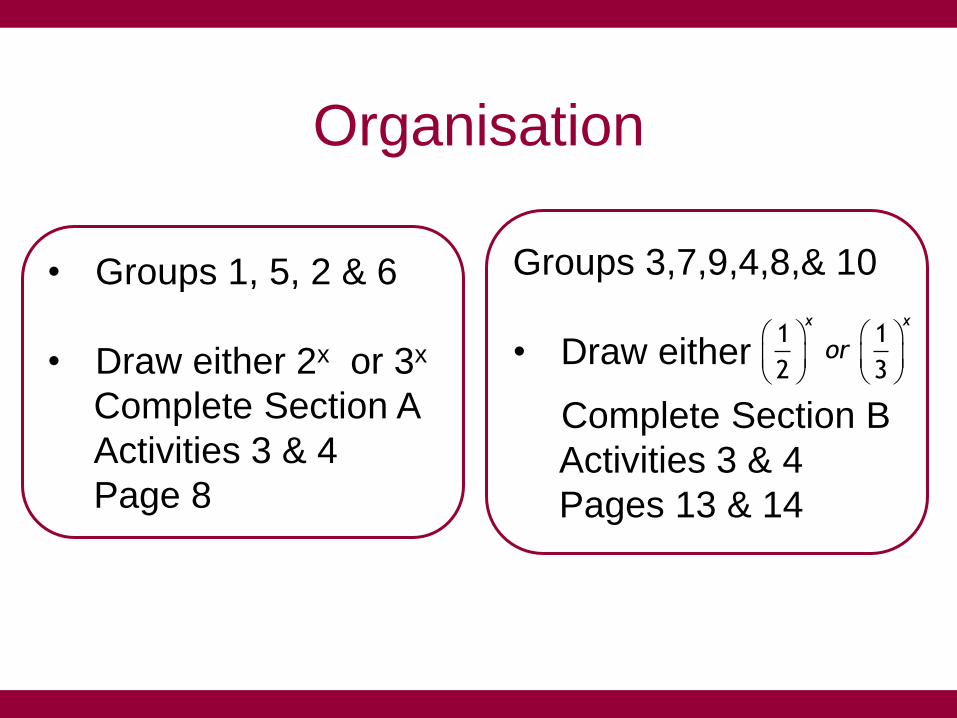
Groups 3,7,9,4,8,& 10
• Draw either
Complete Section B
Activities 3 & 4
Pages 13 & 14
Organisation
1 1
2 3
x x
or
• Groups 1, 5, 2 & 6
• Draw either 2x or 3x
Complete Section A
Activities 3 & 4
Page 8
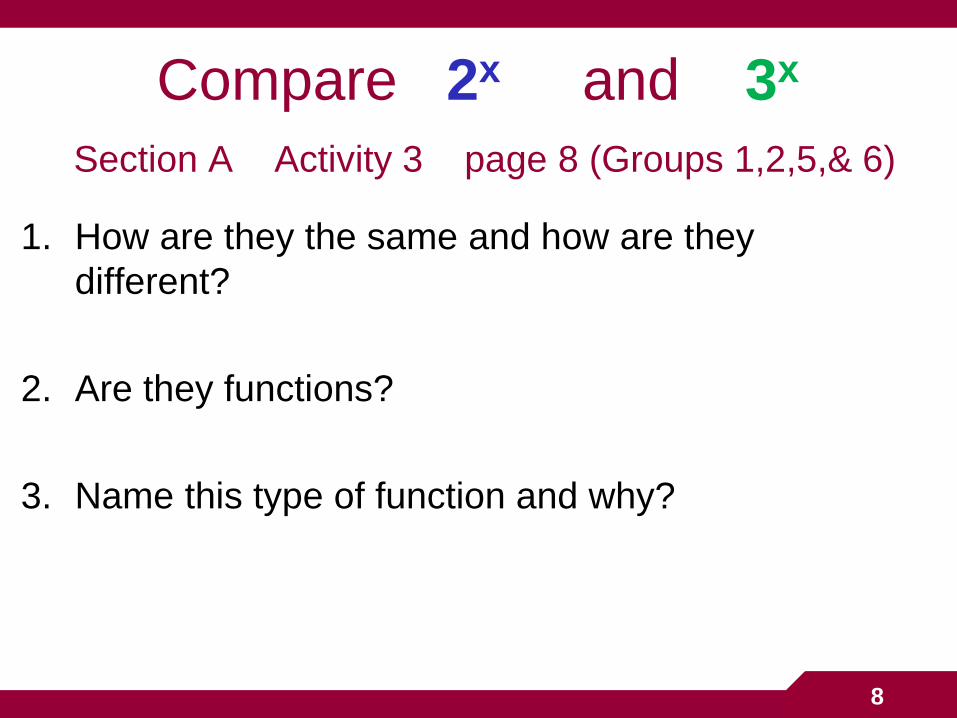
Compare 2x and 3x
1. How are they the same and how are they
different?
2. Are they functions?
3. Name this type of function and why?
Section A Activity 3 page 8 (Groups 1,2,5,& 6)
8
• Domain
• Straight Line
• Is y increasing or
decreasing as x
increases
• Maximum/
Minimum value
• Curvature
• Range
• X-intercept
• Y-intercept
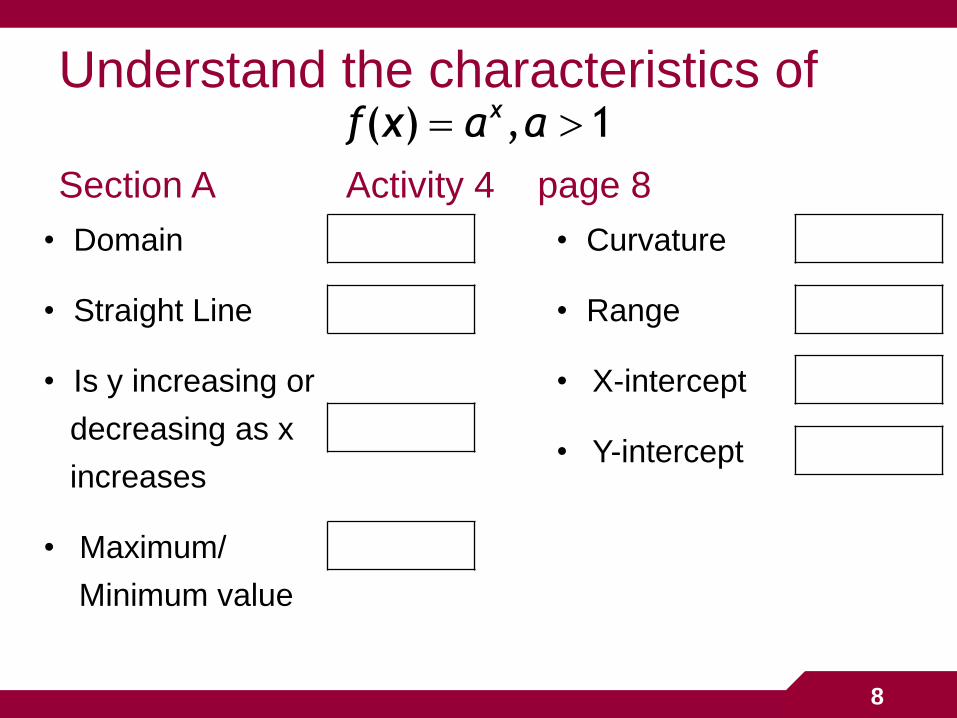
Understand the characteristics of
Section A Activity 4 page 8
( ) , 1xf x a a
8
• Domain
• Straight Line
• Is y increasing or
decreasing as x
increases
• Maximum/
Minimum value
• Curvature
• Range
• X-intercept
• Y-intercept
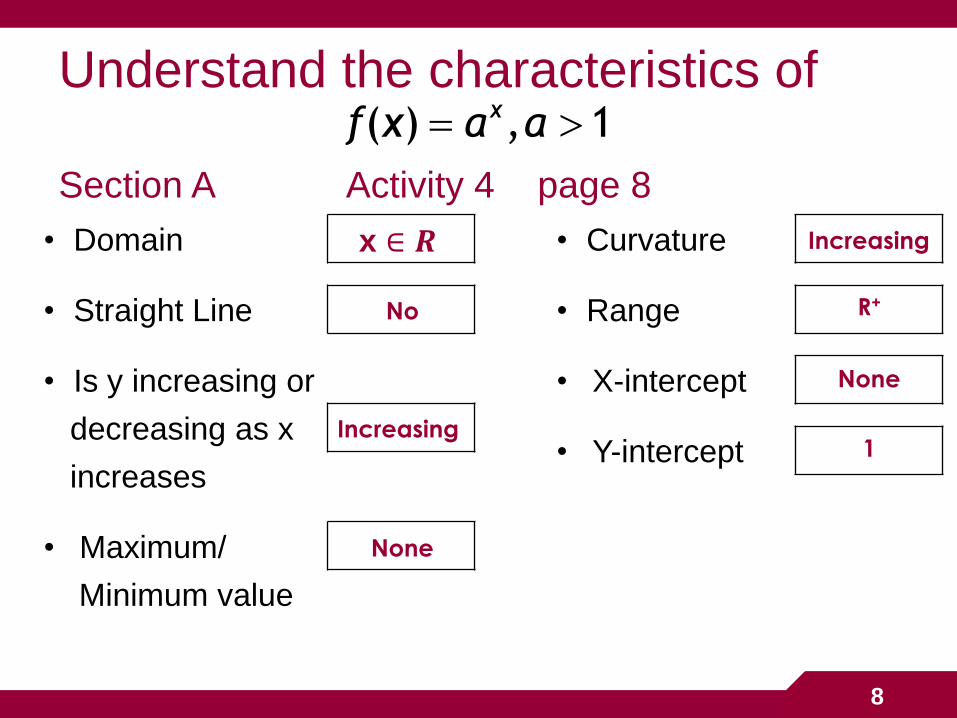
Understand the characteristics of
Section A Activity 4 page 8
( ) , 1xf x a a
8
No
Increasing
R+
None
Increasing
None
1
x ∈ 𝑹
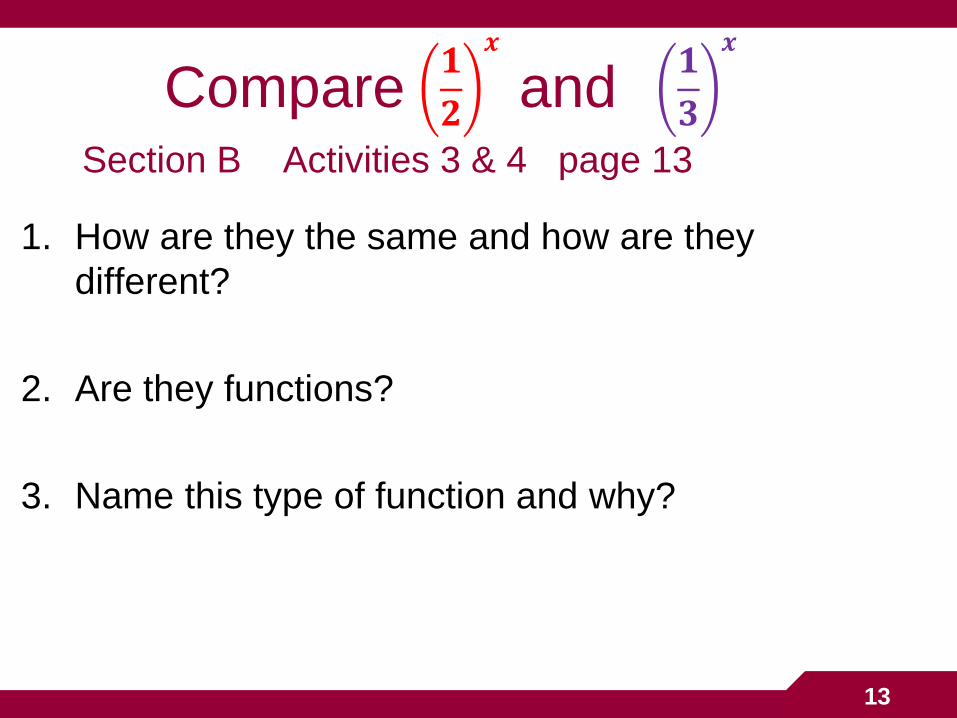
Compare and
Section B Activities 3 & 4 page 13
𝟏
𝟐
𝒙
𝟏
𝟑
𝒙
1. How are they the same and how are they
different?
2. Are they functions?
3. Name this type of function and why?
13
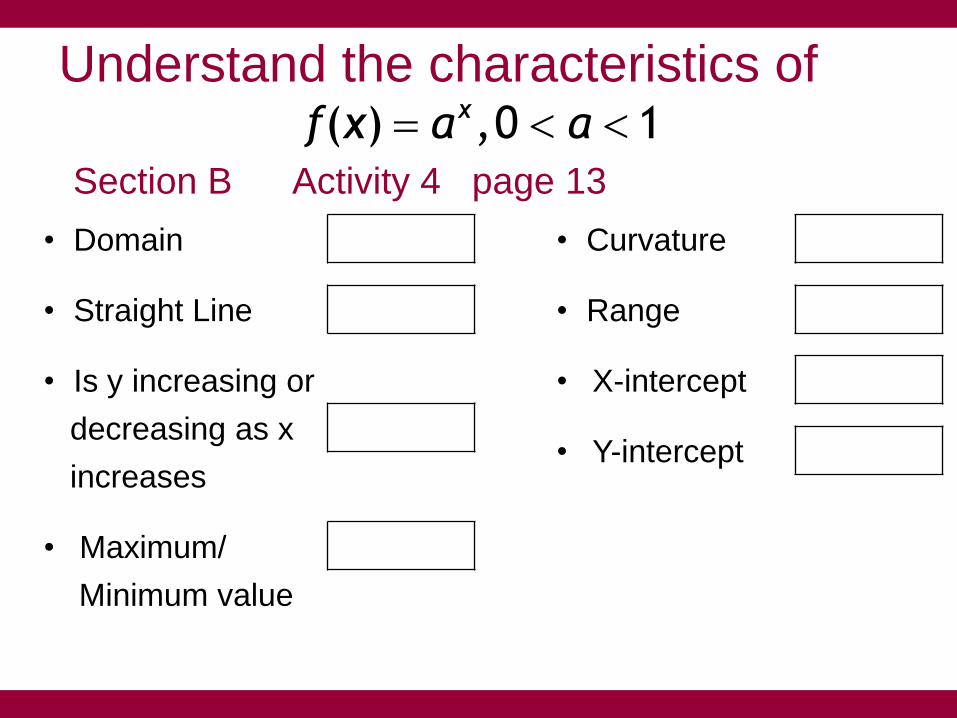
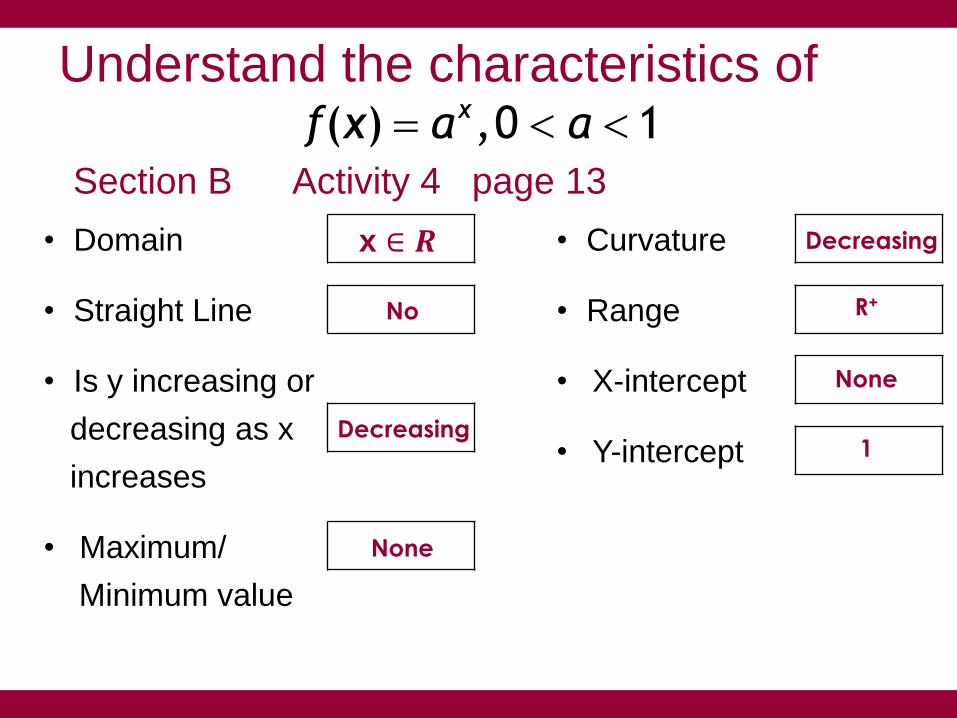
Understand the characteristics of Section B Activity 4 page 13
( ) ,0 1xf x a a
• Domain
• Straight Line
• Is y increasing or
decreasing as x
increases
• Maximum/
Minimum value
• Curvature
• Range
• X-intercept
• Y-intercept
Understand the characteristics of Section B Activity 4 page 13
( ) ,0 1xf x a a
• Domain
• Straight Line
• Is y increasing or
decreasing as x
increases
• Maximum/
Minimum value
• Curvature
• Range
• X-intercept
• Y-intercept
No
Decreasing
R+
None
Decreasing
None
1
x ∈ 𝑹
Organisation
• Groups 1,3,5,7,& 9
• Section C Activity 1
• Page 14
• Groups 2,4,6,8 & 10
• Section C Activity 2
• Page 14
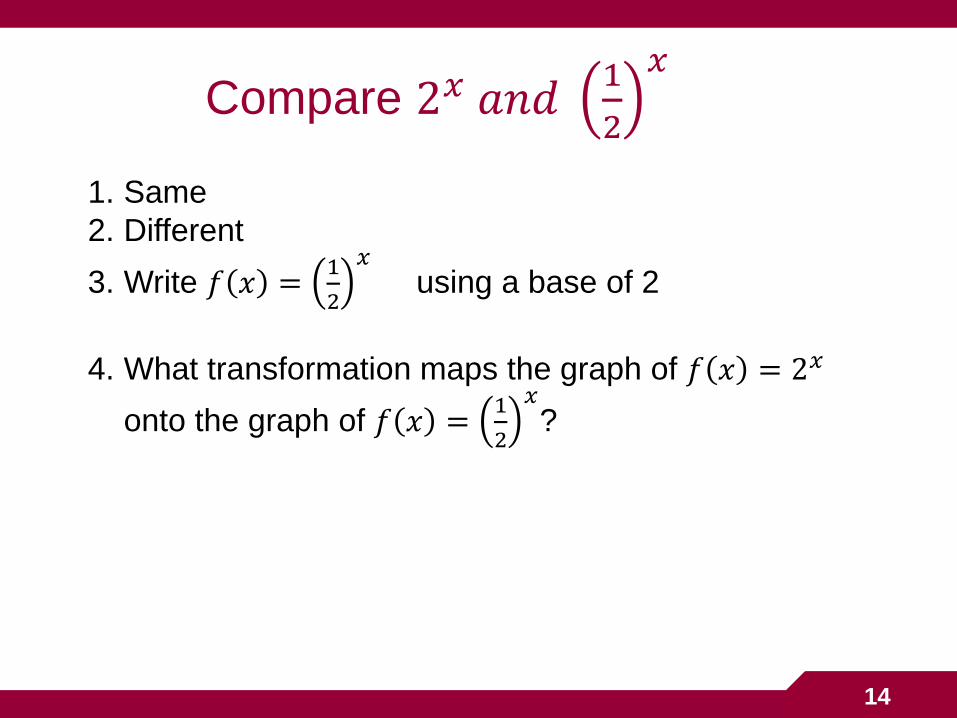
Compare 2𝑥 𝑎𝑛𝑑 1
2
𝑥
1. Same
2. Different
3. Write 𝑓 𝑥 =1
2
𝑥 using a base of 2
4. What transformation maps the graph of 𝑓 𝑥 = 2𝑥
onto the graph of 𝑓 𝑥 =1
2
𝑥?
14
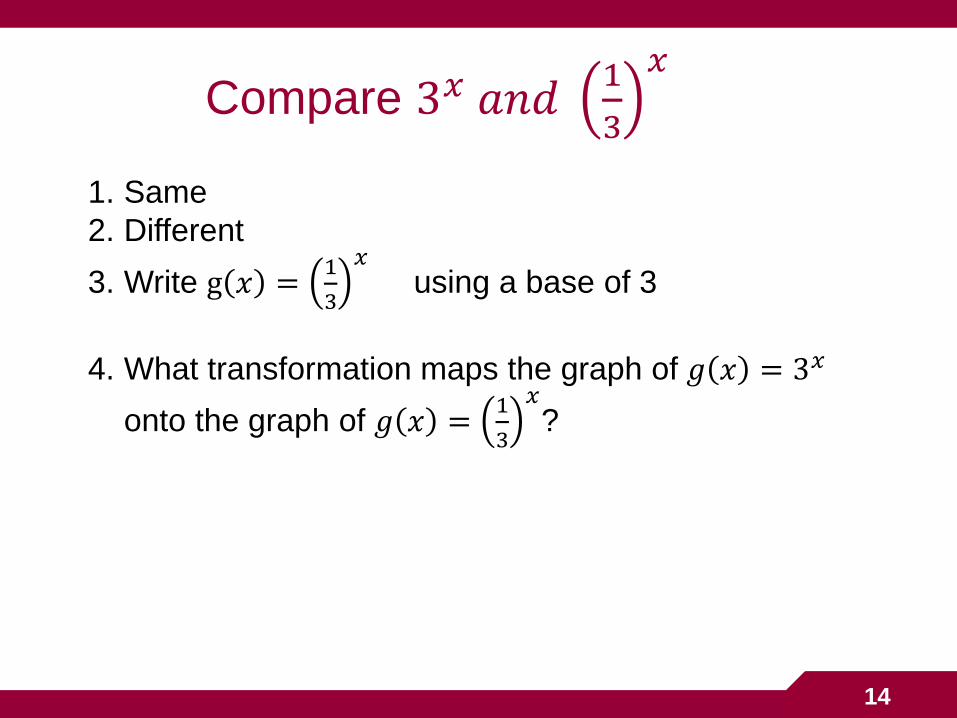
Compare 3𝑥 𝑎𝑛𝑑 1
3
𝑥
1. Same
2. Different
3. Write g 𝑥 =1
3
𝑥 using a base of 3
4. What transformation maps the graph of 𝑔 𝑥 = 3𝑥
onto the graph of 𝑔 𝑥 =1
3
𝑥?
14
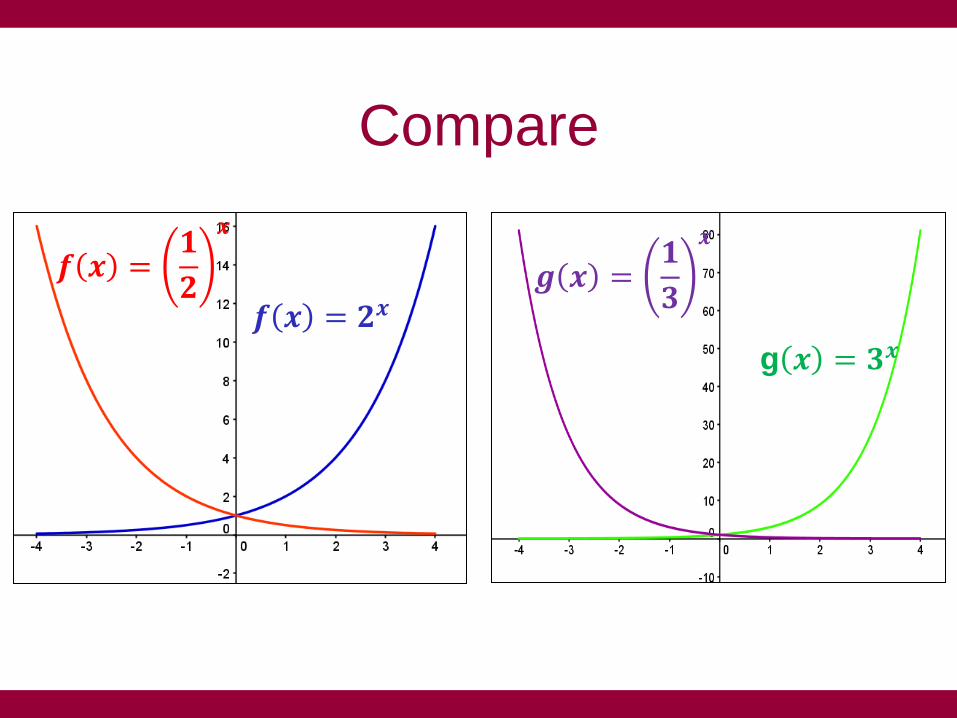
2x 1
2
x
Compare
𝒇 𝒙 = 𝟐𝒙
𝒇 𝒙 =𝟏
𝟐
𝒙
𝒈 𝒙 =𝟏
𝟑
𝒙
g 𝒙 = 𝟑𝒙

All Groups
Complete Section C
Activity 3
page 15
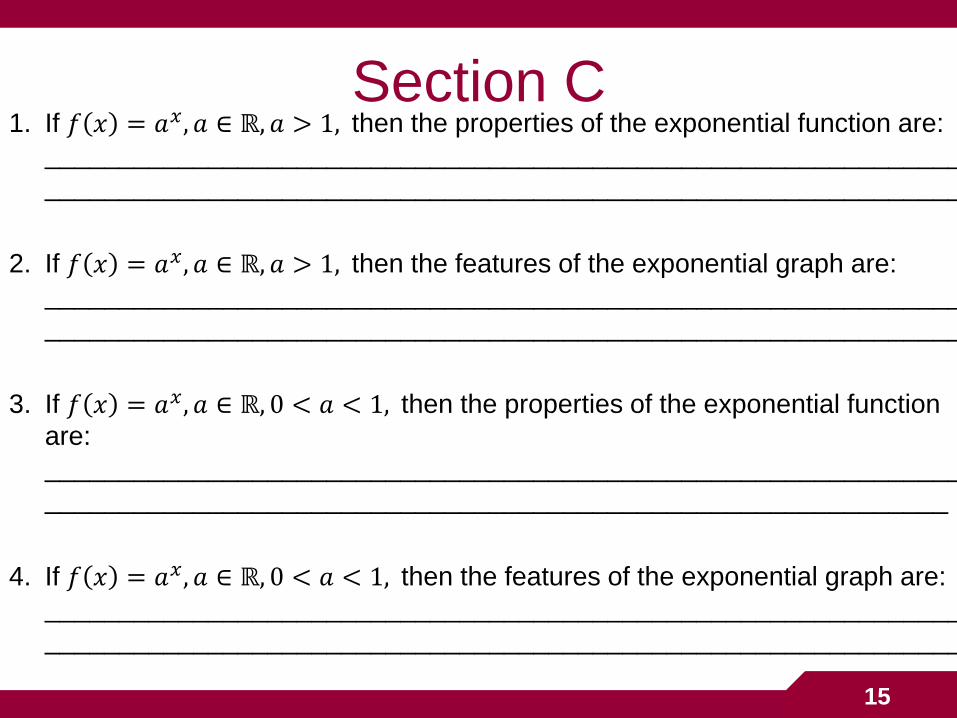
1. If 𝑓 𝑥 = 𝑎𝑥, 𝑎 ∈ ℝ, 𝑎 > 1, then the properties of the exponential function are:
______________________________________________________________
______________________________________________________________
2. If 𝑓 𝑥 = 𝑎𝑥, 𝑎 ∈ ℝ, 𝑎 > 1, then the features of the exponential graph are:
______________________________________________________________
______________________________________________________________
3. If 𝑓 𝑥 = 𝑎𝑥, 𝑎 ∈ ℝ, 0 < 𝑎 < 1, then the properties of the exponential function
are:
______________________________________________________________
_____________________________________________________________
4. If 𝑓 𝑥 = 𝑎𝑥, 𝑎 ∈ ℝ, 0 < 𝑎 < 1, then the features of the exponential graph are:
______________________________________________________________
______________________________________________________________
Section C
15
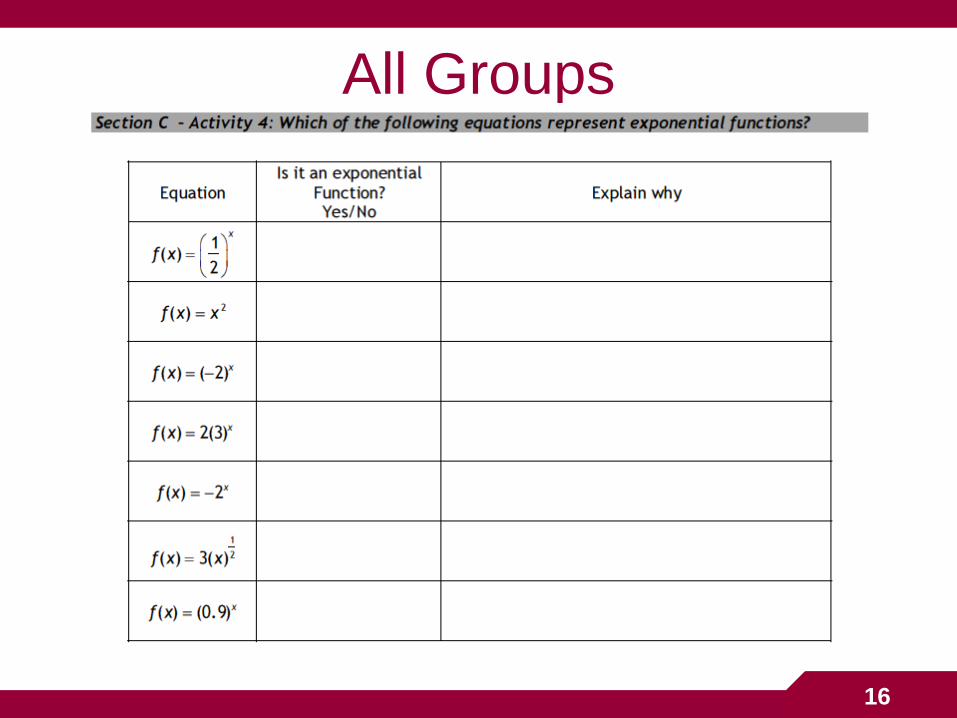
All Groups
16
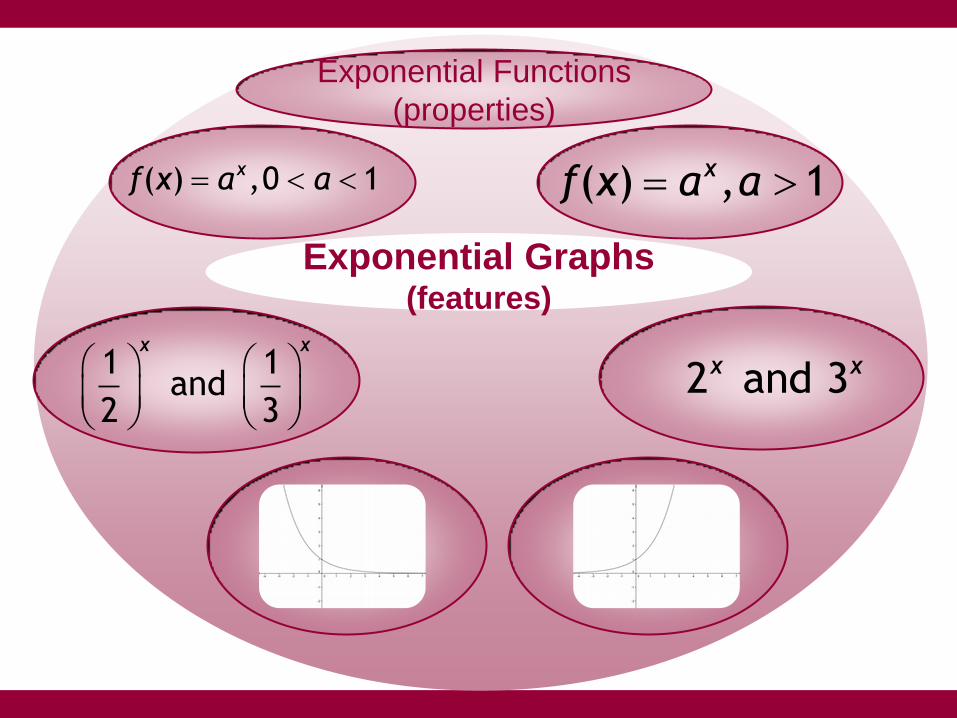
Exponential Functions
(properties)
Exponential Graphs (features)
2 and 3x x1 1 and
2 3
x x
( ) ,0 1xf x a a ( ) , 1xf x a a

Connections
Prior Knowledge
Misconceptions
Methods rather
than answers Rich tasks
Discussion &
Communication
Underlying Principles
Group work What if
questions
Effective
questioning
![Anno Accademico 2016 2017 - Politecnico di Milano€¦ · exchangers related to the net electric power output [2]. 𝛾= ̇ ß, ç K P𝑎 H 𝑎 N 𝑎 ℎ 𝑎 P ℎ𝑎 J O (0.2)](https://static.fdocuments.net/doc/165x107/605a4808b954ff556d1614a0/anno-accademico-2016-2017-politecnico-di-milano-exchangers-related-to-the-net.jpg)


![ЛЕКЦИЯ № 16....3 Пример 1. Рассмотрим в 3 линейный оператор =[𝑎, ] для некоторого вектора 𝑎∈ 3,𝑎≠0.Оператор](https://static.fdocuments.net/doc/165x107/5f0e80cc7e708231d43f8f7a/-a-16-3-1-3-.jpg)


