
Experts’ report on European Neighbourhood Instrument ... · European Neighbourhood Instrument...
126
1 Experts’ report on European Neighbourhood Instrument programme Poland- Belarus-Ukraine in the period 2014-2020 Final version 22.10.2013 Commissioned by: Ministry of Regional Development Prepared by: Centre for European Regional and Local Studies EUROREG Authors: Marek Kozak, Adam Płoszaj, Jakub Rok, Maciej Smętkowski Address: Centre for European Regional and Local Studies EUROREG University of Warsaw ul. Krakowskie Przedmieście 30 00-927 Warszawa, Poland Tel.: (48) 22 826 16 54 Tel.: (48) 22 55 20 643 Fax: (48) 22 826 21 68 e-mail: [email protected]
Transcript of Experts’ report on European Neighbourhood Instrument ... · European Neighbourhood Instrument...

1
Experts’ report on
European Neighbourhood Instrument programme Poland-
Belarus-Ukraine in the period 2014-2020
Final version 22.10.2013
Commissioned by: Ministry of Regional Development
Prepared by: Centre for European Regional and Local Studies EUROREG
Authors: Marek Kozak, Adam Płoszaj, Jakub Rok, Maciej Smętkowski
Address: Centre for European Regional and Local Studies EUROREG University of Warsaw ul. Krakowskie Przedmieście 30 00-927 Warszawa, Poland Tel.: (48) 22 826 16 54 Tel.: (48) 22 55 20 643 Fax: (48) 22 826 21 68 e-mail: [email protected]

2
Table of contents 1 Summary ................................................................................................................................................. 3 2 Introduction ............................................................................................................................................. 8 3 The eligible area ...................................................................................................................................... 9
3.1 Introduction ......................................................................................................................................... 9 3.2 The eligible area in the Poland-Belarus-Ukraine Programme ............................................................ 11
4 Diagnosis of cross-border cooperation ................................................................................................... 17
4.1 Introduction ....................................................................................................................................... 17 4.2 Diagnosis of cross-border cooperation in Polish-Belarus-Ukrainian eligible area ............................. 20
4.2.1 Determinants of the development of cross-border cooperation ..................................................... 20 4.2.2 Barriers to cross-border cooperation ................................................................................................ 27 4.2.3 SWOT analysis .................................................................................................................................... 30 4.2.4 TOWS analysis .................................................................................................................................... 32
5 Strategic objectives and thematic scope ................................................................................................ 33
5.1 Introduction ....................................................................................................................................... 33 5.2 Strategic objectives and thematic scope of the Poland-Belarus-Ukraine Programme ...................... 35
5.2.1 Objectives of the Poland-Belarus-Ukraine CBC Programme ............................................................. 35 5.2.2 Indicative allocation for the Poland-Belarus-Ukraine CBC Programme ........................................... 42 5.2.3 Monitoring indicators for the Poland-Belarus-Ukraine CBC Programme ......................................... 44 5.2.4 Compliance of the Programme with other programmes and strategies ......................................... 47 5.2.5 Programme and thematic objectives of the cohesion policy ........................................................... 49 5.2.6 Programme and thematic objectives of the European Neighborhood Policy ................................. 50 5.2.7 Thematic concentration in the Programmes ..................................................................................... 50 5.2.8 Issues requiring institutional cooperation on both sides of the border ........................................... 51 5.2.9 The role of the Microprojects Fund ................................................................................................... 51 5.2.10 Strategic projects in the Programmes ............................................................................................... 52 5.2.11 Examples of best practices in cross-border projects ......................................................................... 54 5.2.12 Programme beneficiaries ................................................................................................................... 68 5.2.13 Project Evaluation and Selection criteria ........................................................................................... 69 5.2.14 Measures aimed to foster the establishment of project partnerships ............................................ 70
6 institutional and systemic solutions ....................................................................................................... 71
6.1 Introduction ....................................................................................................................................... 71 6.2 Optimal solutions within the new programme’s implementation system ........................................ 72
6.2.1 Administration potential of the partnership countries in relation to the ENI implementation ...... 74 6.2.2 Assessment of the efficiency of the microproject selection system in the period of 2007-2013 ... 75 6.2.3 Analysis of the possibility of an electronic submission of applications ............................................ 76 6.2.4 Conclusions ......................................................................................................................................... 77
7 References ............................................................................................................................................. 79 8 Appendices ............................................................................................................................................ 82
Appendix 1. Analysis of foreign trade .................................................................................................................. 82 Appendix 2. Analysis of tourist traffic .................................................................................................................. 92 Appendix 3. Analysis of border traffic ................................................................................................................ 101 Appendix 4. Analysis of cross-border ecosystems ............................................................................................. 104 Appendix 5. Analysis of twinning cities co-operation ........................................................................................ 107 Appendix 6. Analysis of Programme beneficiaries ............................................................................................ 111 Appendix 7. Analysis of survey results ............................................................................................................... 116 Appendix 8. Analysis of interviews ..................................................................................................................... 120 Appendix 9. Socio-economic indicators ............................................................................................................. 122 Appendix 10. Barriers to cross-border cooperation based on survey results .................................................. 123 Appendix 11. SWOT analysis .............................................................................................................................. 125 Appendix 12. TOWS analysis .............................................................................................................................. 126

3
1 Summary
The main objective of experts’ report was an identification of the main elements of CBC
Program PL-BY-UA that should promote integrated and sustainable development of
neighbouring border regions and territorial integration between the EU and partnership
countries. In the framework of the report four main research questions were addressed that
constituted the following blocks of research:
1. What should be the eligible area of the ENI PL-BY-UA Programme?
2. What are the barriers and opportunities of cross-border cooperation in the eligible
area?
3. What should be the programme’s strategic objectives and thematic scope?
4. What institutional and systemic solutions should be adopted for the organisations
implementing the Programme?
BLOK 1. DELIMITATION OF ELIGIBLE AREA
The delimitation of the eligible area of public intervention supporting cross-border co-
operation took into account the following criteria:
• Enabling a concentration of funds that leads to supra-local and cross-border results
as well as complementarity and synergy effects.
• Considering the existing administrative/planning units and governments, including
territorial governments.
• Using statistical units which allow to use the existing databases to monitor changes
and evaluate the impact of the public intervention.
The project of the REGULATION (EC) No 2011/839 OF THE EUROPEAN PARLIAMENT AND OF
THE COUNCIL establishing a European Neighbourhood Instrument that provide guidance of
Cross-Border Cooperation Programmes geographical eligibility was also considered.
Based on conducted research of cross-border interactions: foreign trade, tourism, border
traffic, cross-border ecosystems, twinning city cooperation, projects implemented under the
2004-2006 and 2007-2013 programme perspectives and euroregional cooperation taking
into account context related to the proposal of Regulation 2011/839 the following changes
have been proposed:
• on the Polish side the eligible area should cover subregion łomżyński (changes of
delimitation of statistical territorial units at NUTS3 level) and subregions lubelski and
rzeszowski, that are very important centres of cross-border cooperation in majority
of analysed aspects,
• on the Belarusian side: the western part of Mińsk oblast should be excluded as result
of lack of any significant cross-border cooperation.
It is justifiable to establish adjacent areas to be covered by the Programme intervention as
result of well-established traditions of cooperation, supported by number of CBC examples
as well as potential to further CBC development including euroregional cooperation:

4
• on the Polish side, subregions: puławski, tarnobrzeski;
• on the Belarusian side: Minsk oblast (plus the city of Minsk);
• on the Ukrainian side, oblasts: Ivano-Frankivsk, Rivne, Ternopil.
As regards the present delimitation of the adjacent areas, there seem to be justifiable
grounds to exclude the Gomel oblast in Belarus due to the lack of any important
manifestations of its cross-border interactions with Poland.
The proposed delimitation of the eligible area together with the adjacent areas should not
limit the possibilities for introducing spatial variations in the availability of different types of
intervention, depending on the adopted priorities, kinds of investments or beneficiary
categories. For instance, it is reasonable to concentrate infrastructure investments in the
close proximity of the border, whereas ‘soft’ projects can be successfully implemented e.g.
in major cities located further from the border.
BLOCK 2. DIAGNOSIS OF CROSS-BORDER COOPERATION OF ELIGIBLE AREA
The socio-economic diagnosis of eligible area was conducted with focus on determinants of
cross-border cooperation based on resources available in analysed region. Such
preconditions could lead to cross-border interactions between border regions. However,
different barriers need to be overcome beforehand, including those related to state border
that have been identified within the research framework of the project.
Territorial capitals
The analysis of economic capital proved that eligible area consists of regions at low
development level in comparison to main economic centres in respective countries.
Furthermore, the economic gap between Polish side on the one hand, and Belarusian and
Ukrainian side on the other hand is quite substantial. The main determinants was
unfavourable economic structure with high share of agriculture and traditional industries.
This leads to ineffective use of labour resources that discourage inflow of external capital.
Also tourist potential was relatively small (with exception of some local systems). Meanwhile
endogenous potential manifested by entrepreneurship activity development and R&D sector
performance was highly differentiated within eligible area (relatively high in Poland and low
in case of Belarus). Nevertheless, the region was significant for transit activity, but existing
bottlenecks in transport and border-crossings infrastructure was a barrier for further
development in this field.
In respect of human and social capital the condition of cross-border area is not better than
that of the rest of the countries. In the Ukrainian and Belarusian part the population is
declining (as a result of migration and small natural increase). In the Polish part of the area
population in the last couple of years have been stable. Age structure in this support area
indicates gradual aging of population. The quality of human capital is not a particularly
strong asset of the analysed area (relatively small percentage of people with higher
education). In terms of social capital the situation in the cross-border area is significantly
diversified. Social activity measured by the number of non-governmental organizations is

5
highest on the Polish side, lower in Ukraine, and in the case of Belarus there are no reliable
statistics on that topic.
Analysis of natural capital of the support area indicates valuable natural assets connected
with well-preserved mountain, forest, river and marsh ecosystems. Many of these
ecosystems have cross-border character and require special international protection
programmes, responding to challenges connected with human impact on environment,
water pollution, or different protection status of particular animal species. Important threats
to environment on the area are connected mostly with water pollution, to a lesser extent
also with emission of air pollutants, and pollution in post-industrial areas. Energy sector in
the Polish and Ukrainian part of the area is based on coal, and in the Belarusian - on gas.
Renewable energy sources are best developed on the Polish side of the border, but
simultaneously the regions have low energy self-sufficiency indicators.
Potential to develop cross-border cooperation
It should be noted that currently cross-border cooperation at the Polish-Ukrainian border,
and even more perceptibly at the Polish-Belarusian border, was far from fully tapping the
potential in all the three spheres under analysis, i.e. economic, socio-cultural and
institutional. This was particularly well visible in relation to the potential for the
development of economic interactions in both trade exchange and foreign investments. Lack
of satisfaction from institutional cooperation was expressed particularly strongly at the
Polish-Belarusian border. Nonetheless, also at the Polish-Ukrainian border some potential
for expanding the cooperation between public authorities and NGOs could be observed.
Socio-cultural cooperation received the most praise, although also in this case, particularly at
the Polish-Belarusian border, a relatively low level of satisfaction was expressed.
Barriers to cross-border cooperation
The border and the border regime represented the most important barriers to cross-border
interactions at the Polish-Belarusian-Ukrainian border. It should be noted that this applies
not only to the border infrastructure but also to the operation of the border crossings and
legislation governing the crossing of state borders. Secondly, the respondents pointed to
legislative and institutional barriers created by dissimilar regulations and differences in the
administrative structures, which nonetheless can only be resolved at national level. Physical
infrastructure was also listed as a problem, but of a secondary nature in comparison to those
discussed above. In other words, the respondents were aware that even an outstanding
degree of infrastructure provision cannot compensate for the negative impact of the border
regime and legislative and institutional environment on the development of cross-border
cooperation. This also pertained to the economic barrier, understood as lack of proportion in
the level of development, which also affects the provision of sufficient funds for making the
cooperation a reality. At the same time, it should be emphasised that broadly understood
cultural differences still posed a significant barrier in the respondents’ opinion, although not
regarded as causing a great deal of distress.

6
SWOT/TOWS analysis
The results of the TOWS/SWOT analysis can be interpreted in favour of the adoption of the
aggressive strategy. However, the results of the analysis are not quite unequivocal, so it
could be argued that some elements of the defensive strategy should also be adopted in
order to minimise the weaknesses, so that they do not reinforce the threats. To sum up, it
can be said that the strengths of the macroregion should be supported in the first place, and
only then should the constraints for growth be removed.
BLOCK 3. OBJECTIVES AND THEMATIC SCOPE OF THE PROGRAMME
The main objective of the Programme is the development of cross-border cooperation in
the economic, social, environmental and institutional sphere. These dimensions of
cooperation should be complementary, which should allow to achieve the overriding
objective of the Programme, that could be defined as an attempt to create a functional,
cross-border region. In such a region, the role of barriers posed by the existence of state
borders should be limited to a minimum.
The strategic objective should be pursued under the following three priorities:
1. Supporting socio-economic integration of the border areas
2. Improving innovativeness of the economy in the border region
3. Improving the quality of life in the border areas
Priority 1
On the basis of the diagnosis, it was concluded that the main barrier to cross-border
cooperation in all the investigated areas is the existence of the state border and the
accompanying border regime. This barrier can be further aggravated by problems of
infrastructural nature, including the poor condition of the road infrastructure and a minor
role of railway transport in cross-border interactions. It should also be noted that in order to
ensure continued development of cooperation parallel measures should be put in place,
aimed to alleviate the disparities existing in the cultural sphere and associated with the
persisting negative stereotypes, resentments from the past and dissimilar types of mentality
that evolved under the different administrative and legislative systems, which can obstruct
not only social but also economic interactions.
First and foremost, measures intended to support the interactions between the border areas
should be pursued as a priority. They involve, firstly, steps that facilitate crossing the border,
development of the existing crossings and introducing organisational arrangements
streamlining the process and making it more user-friendly and, secondly, undertaking
complementary activities involving the creation and development of transport infrastructure
allowing an easy access to the border crossings and, thirdly, implementing many different
microprojects to improve good neighbourly relations and overcome the existing cultural
differences.

7
Priority 2
In contemporary economy, the ability to develop and adapt innovations plays a crucial role
in development processes. Therefore, one of the Programme’s priorities should be designed
so as to enhance such abilities, otherwise it will be difficult to expect as the eligible areas are
economically peripheral in relation to the respective national growth areas. It should also be
noted that the potential for the development of cross-border economic interactions
associated with trade exchange and with innovativeness should be regarded as high.
In particular, activities aimed to enhance the quality of human capital should be supported
as it is the key development factor in contemporary economy. Secondly, conditions fostering
development of the research cooperation should be created. This should entail increasing of
the quality of instruction and education system, as well as improving the conditions for
research and development activities, thus providing opportunities for transferring
innovations to business sector.
Priority 3
As a rule, peripheral border areas are characterised by a low quality of life of their residents,
in a number of aspects, ranging from difficult material conditions and worse access to the
labour market, to insufficient provision of social infrastructure to the poor quality of the
natural environment. The scale of these problems goes beyond the financial capacity of the
CBC Programme and calls for a national-level intervention. Nonetheless, one of the
components making up the quality of life has a clear cross-border character, being
associated with the existence of ecosystems that need shared protection. Therefore, the
Programme should focus on this particular component, leaving the remaining ones to be
addressed by the national governments. At the same time, it should be pointed out that
some of these components which are important for the local communities can be improved
as part of Priority 1.
BLOCK 4. MANAGEMENT SYSTEM
When it comes to the management system, most of the arguments is in favor of creation a
system for 2014-2020 which is based on proven solutions, if necessary, adjusted to the final
regulation ENI CBC. The decisions remains required regarding use of the experience and
skills of Euroregions and the possible introduction of the umbrella micro-project system
(quite often criticized). Some experts suggest that umbrella system may cause
implementation difficulties, while some others that there is no reason why umbrella system
cannot be introduced.
An analysis of administrative capacity leads to the conclusion, that in general it is possible to
introduce the electronic application submission system and a possible increase of the
accountability of the partner countries. The use of proven solutions increases the chance of
a timely and successful launch of the program.

8
2 Introduction
This expert opinion pertains to the shape of Poland-Belarusian-Ukrainian Cross-Border
Cooperation Programme (PL-BY-UA) implemented under European Neighbourhood
Instrument (ENI) in 2014-2020, which is to replace the present European Neighbourhood
and Partnership Instrument (ENPI). The study was commissioned by the Ministry for
Regional Development and implemented by the Centre for European Regional and Local
Studies (EUROREG) of the University of Warsaw, by a team coordinated by Prof. Grzegorz
Gorzelak, consisting of: Prof. Marek Kozak, Adam Płoszaj, PhD, Maciej Smętkowski, PhD, with
participation of Prof. Roman Szul, Karol Olejniczak, PhD, Dorota Celińska-Janowicz and
Jakub Rok.
The main purpose of the expert opinion was to specify the most important elements of the
PL-BY-UA programme, expected to contribute to integrated and sustainable development of
the neighbouring cross-border regions and harmonious territorial integration between EU
and its neighbouring countries. The elements consisted, firstly, of the geographical scope of
the Programme’s support area and diagnosis of socio-economic situation, also taking into
account the most important barriers for cross-border cooperation, including particularly
those connected with existence of external EU border, and completed with preparation of
SWOT and TOWS. At the next stage presented was a proposal for thematic scope of the
Programme, including its objectives, priorities, and measures, as well as indicating the
planned allocation of funds to specific measures. The final element was a proposal for
organizing the Programme’s implementation, regarding both the institutional and systemic
aspect.
The expert opinion consists of four thematic blocks, answering four most important research
questions. They guide the research process according to logical steps – starting with
definition of the object of the study (its spatial coverage), diagnosis of the situation, strategic
choices regarding thematic scope of the programme, and finally its operationalization
(management-related solutions).

9
3 The eligible area
3.1 Introduction
Every public intervention must have specific recipients. In case of spatial/regional/cross-
border policies, beneficiaries are located in territorial units or their aggregates making up
the so-called eligible area. Admittedly, successful intervention depends on the proper
delimitation of that area as it determines the specific choice of instruments which should be
adapted to the selected spatial scale.
The delimitation of the eligible area of public intervention supporting cross-border co-
operation ought to fulfil the following criteria:
• Enabling a concentration of funds that leads to supra-local and cross-border results
as well as complementarity and synergy effects.
• Considering the existing administrative/planning units and governments, including
territorial governments.
• Using statistical units which allow to use the existing databases to monitor changes
and evaluate the impact of the public intervention.
These criteria to a large extent reflect the multidimensional concept of a region formulated
by K. Dziewoński (1967), which includes the following features: a) regions as objectively
existing cognitive objects, b) administrative or planning regions as objects of public
intervention, and c) regions as subject of research determined by the aggregated statistics.
This concept was used to delimit the eligible areas supported by the CBC Programme ENI PL-
BY-UA (Fig. 1). The first step was focused on cartographic and spatial analysis of cross-border
interactions in the field of economy, culture and social issues, environment and institutions
(including the ones resulting from the CBC Programmes 2004-2006 and 2007-2013). In the
next step, its results were referred to the existing eligible area of the CBC Programme 2007-
2013, treating the adjacent areas and large cities situated outside the eligible area
separately. Based on the comparison of the range of CBC interactions and the existing
eligible areas, it was possible to determine the desirable spatial intervention range and
decide if, and to what extent, it is necessary to include adjacent areas and large cities into
the 2014-2020 programme round. The last step was to identify the context of the existing
administrative divisions and access to statistical data that should allow the Programme’s
results to be monitored and evaluated.

10
Fig.1. Block I analysis scheme: What should be the eligible area of the programme
intervention?
Source: own elaboration.
From the analysis scheme presented above, the following questions arise:
Question 1: What should be the eligible areas of the Programme with potential adjacent
areas?
Question 1a: What is the role of the adjacent areas in generating project applications and
are they necessary in the future?
Question 1b: Can large urban areas situated outside the eligible area play a substantial role
in attaining the Programme objectives? If so, how can this be achieved?

11
3.2 The eligible area in the Poland-Belarus-Ukraine Programme
As part of the first step, “regions as objects of cognition”, the following issues were
analysed: foreign trade (Appendix 1), tourism (Appendix 2), border traffic (Appendix 3),
cross-border ecosystems (Appendix 4), twinning city cooperation (Appendix 5), projects
implemented under the 2004-2006 and 2007-2013 programme rounds (Appendix 6) and
cooperation as part of Euroregions. On their basis, the significance of cross-border
cooperation in the investigated territorial units can be synthetically (qualitatively) evaluated
(Tab.1).
Tab. 1. Synthetic evaluation of the significance of analysed spatial units for cross-border
interactions at the Polish-Belarusian-Ukrainian border
Territorial unit Trade Tourism Border traffic
Ecosystems Twinning cities
ENPI cooperation
Euroregional cooperation
Poland
Lubelskie voivodship
- bialskopodlaski subregion YES YES YES YES YES YES YES
-chełmsko-zamojski subregion YES YES YES YES YES YES
-lublelski subregion YES YES YES YES YES
-pulawski subregion YES YES
Mazowieckie voivodship
-ostrołęcko-siedlecki subregion YES YES YES YES YES
Podlaskie voivodship
-białostocki subregion YES YES YES YES YES YES YES
-łomżyński subregion YES YES YES YES YES
-suwalski subregion YES YES YES YES YES YES
Podkarpackie voivodship
-krośnieński subregion YES YES YES YES YES
-przemyski subregion YES YES YES YES YES YES YES
-rzeszowski subregion YES YES YES YES
-tarnobrzeski subregion YES YES YES
Belarus
-Brest oblast YES YES YES YES YES YES
-Grodno oblast YES YES YES YES YES YES
-Minsk oblast YES YES YES
-Gomel oblast
Ukraine
-Lviv oblast YES YES YES YES YES YES
-Volyn oblast YES YES YES YES YES YES
-Zakarpatska oblast YES YES YES YES YES
-Ivano-Frankivsk oblast YES YES
-Rivne oblast YES
-Ternopil oblast YES YES
Source: own elaboration.

12
The quantitative analyses and qualitative evaluation of their results clearly demonstrate that
cross-border interactions are best developed in the subregions/oblasts situated directly on
the state border. Beyond them, there is a distinctly visible significance of the Lublin and
Rzeszów subregions in the case of Poland, and also of the Minsk oblast (including the city of
Minsk) in the case of Belarus. In contrast, the role of the adjoining Ukrainian oblasts is rather
marginal, so as that of the Puławy and Tarnobrzeg subregions on the Polish side of the
border. In addition, in the case of the Gomel oblast in Belarus, practically no cross-border
interactions with Poland can be observed. In parallel, large urban centres are significant for
cross-border interactions in the sphere of foreign trade and tourism, but mainly in absolute
terms, since when the significance of international linkages is relativised by the demographic
and/or economic potential, as a rule it becomes clear that cross-border relations with the
partner countries play a relatively minor role in the development of those territorial
systems.
As part of the second step, “regions as objects of intervention”, the legislation concerning
the delimitation of the Programme’s eligible areas, specific administrative system solutions
in individual countries and opinions expressed by both respondents and stakeholders of the
2004-2006 and 2007-2013 programme rounds were analysed.
Under the regulations arising from Article 8 of proposal for a REGULATION (EC) No COM
(2011) 839 OF THE EUROPEAN PARLIAMENT AND OF THE COUNCIL establishing a European
Neighbourhood Instrument, the following areas can be comprised by the Poland-Belarus-
Ukraine Programme:
(1) all territorial units corresponding to NUTS level 3 or equivalent, along the land borders
between Member States and partner countries and/or Russian Federation nonetheless (2) in
order to ensure the continuation of existing cooperation schemes and in other justified
cases, territorial units adjoining to those referred to in paragraph 1 may be allowed to
participate in cross-border cooperation and (3) it is possible to include, in duly justified
cases and under the conditions laid down in the strategy papers, major social, economic or
cultural centres that are not adjoining to eligible territorial units.
This means that a detailed analysis of cross-border interactions should be carried out for
those territorial units that do not fulfil criterion (1), before making the decision on the
grounds for their inclusion into the Programme’s eligible area.
In Poland, in administrative terms, leaving aside the local level (municipalities (LAU2) and
districts (LAU1)), voivodships having a dual governmental and self-governing nature operate
at the regional level (NUTS2), while NUTS3 subregions have merely statistical significance.
On the other hand, in Belarus and Ukraine there are governmental oblasts (equivalents of
NUTS2 in Poland) with executive powers, and at the next level down in the structure there
are raions, units with limited competencies and local character (equivalents of LAU1). In
consequence, there is a mismatch in the eligible area, between the administrative levels on
the Polish side of the border (NUTS3) in relation to the partners in the east (NUTS2). In order

13
to ensure congruity between the eligible area on both sides of the border, it would be
expedient to use NUTS2 voivodships on the Polish side for its delimitation.
Based on the opinions of beneficiaries and project applicants in the 2004-2006 and 2007-
2013 programme rounds (Appendix 7) as well as interviews with the stakeholders (Appendix
8) it can be concluded that:
• The current eligible area corresponds to the existing cross-border cooperation
relatively well.
• Some doubts can be raised concerning the need to distinguish the adjacent areas,
with a definite prevalence of those in favour of their continued existence, albeit in a
modified form. Some ideas were voiced to include the Lublin and Rzeszów subregions
into the eligible area, and the remaining part of the Minsk oblast plus the city of
Minsk in the case of Belarus. One the other hand, there were many voices to exclude
the Gomel oblast, and the issue of the adjacent areas in Ukraine raised a great deal of
controversy.
• The possibility to include other territorial units, among others large cities, caused
some controversy, with a slight prevalence of those in favour of such a solution
(particularly in the case of interviews), with the exception of Minsk -in the opinion of
the respondents from Belarus.
In effect, a comparison of the first step with the second shows a considerable consistency of
the results obtained using both methods. First and foremost, this refers to the cardinal
importance of NUTS3/NUTS2 territorial units situated directly on the border. At the same
time, the adjacent territorial units clearly play a visible role in cross-border cooperation.
Some of them can be incorporated into the eligible area, some should have their present
status continued and some should be excluded from the eligible area. In respect of large
cities situated outside the eligible and adjacent areas, there are no unequivocal grounds for
their inclusion into the Programme’s eligible area. In addition, it should be noted that large
cities representing major cross-border cooperation centres are located within the eligible
and adjacent areas. Also, a possibility should be allowed to implement projects in the eligible
area by national public institutions regardless of where they are located, when they are
directly responsible for elements of physical infrastructure or any services operating in the
eligible area.
The third step, “regions as objects of research”, involved identification of available statistical
data required for diagnosing the eligible area and monitoring the results of the planned
intervention. On this basis, the following conclusions can be proposed:
• For Poland, the widest range of statistical data can be obtained for voivodships, i.e.
NUTS level 2 (for instance, this is the last level for labour market statistics according
to BAEL, a labour force survey), although the availability of data is comparable at the
level of subregions, i.e. NUTS level 3 (for instance, this is the last level for GDP
statistics). Additionally, the changes at NUTS3 level introduced in Poland in 2008

14
should be incorporated in the new programme round. It should also be noted that,
on the Polish side of the border, the data from the municipal (LAU2) or district (LAU1)
levels can be freely aggregated since they are available from the Regional Data Bank
of the Central Statistical Office(GUS).
• In Ukraine, similarly to Belarus, oblasts are the basic level for aggregation of
statistical data (equivalents of NUTS2). Possibilities to use statistical data at a lower
aggregation level are as a rule rather/very limited.
In effect, it should be concluded that, in this approach, delimitation of the eligible area on
the basis of other territorial units than oblasts should be avoided, particularly in the case of
the eastern partners. This applies in particular to the western part of the Minsk oblast, for
which making estimates would be needed if data proved to be necessary.
Based on the three approaches presented above, the following eligible area for the Poland-
Belarus-Ukraine Programme 2014-2020 should be proposed:
a) on the Polish side, subregions (NUTS3): białostocki, łomżyński, suwalski, ostrołęcko-
siedlecki, bialski, chełmsko-zamojski, lubelski, krośnieński, przemyski, rzeszowski;
b) on the Belarusian side: Brest oblast, Grodno oblast;
c) on the Ukrainian side: Lviv, Volyn, Zakarpatska oblast.
Save for the Lublin and Rzeszów subregions, all the remaining territorial units meet the
formal criterion formulated in Article 8(1) of proposed regulation establishing a European
Neighbourhood Instrument of direct location on Poland’s border with Belarus and Ukraine.
The inclusion of the Lublin and Rzeszów subregions into the eligible area is possible based on
Article 8(2) of above mentioned regulation and justified, first, by strong cross-border
linkages with the eastern partners, as proved by the quantitative analyses (the subregions
fulfil: 5 (Lublin) and 4 (Rzeszów) of 7 analysed CBC interactions criteria – see Table 1, p. 12);
second, their incorporation will offset the incongruities in the administrative levels on both
sides of the border (NUTS3 Poland/NUTS2 equivalent Belarus and Ukraine) taking also into
account that Lublin and Rzeszów are capitals of border voivodships (NUTS2); and, thirdly,
also in the opinion of the majority of respondents, these cities are major centres of cross-
border cooperation. On the other hand, as regards the current eligible area, it should be
proposed to move the western part of the Minsk oblast the category of adjacent areas, due
to very weak cross-border interactions and also difficulties in the access to statistical data
which are needed to monitor the results of the intervention.
In respect of the PL-BY-UA Programme, it seems justified for the following territorial units to
continue as the Programme’s adjacent areas based on Article 8(2) of proposed EIS
regulation:
a) on the Polish side, subregions: puławski, tarnobrzeski;
b) on the Belarusian side: Minsk oblast (plus the city of Minsk);
c) on the Ukrainian side, oblasts: Ivano-Frankivsk, Rivne, Ternopil.

15
Cross-border interactions are weaker in these adjacent areas, but nevertheless they do have
some potential for development as well as well-established traditions of cooperation,
including euroregional one. Based on Table 1 that presents synthesis of conducted analysies
(Annexes 1-6) the subregions/regions fulfil between 1 to 3 analysed CBC interactions
intensity criteria in particular related to foreign trade, foreign tourism and euroregional
cooperation. As regards the present delimitation of the adjacent areas, there seem to be
justifiable grounds to exclude the Gomel oblast in Belarus due to the lack of any important
manifestations of its cross-border interactions with Poland. Leaving the adjacent areas in
Poland in their current form would lead to an administrative containment of the Programme
within the boundaries of the Lubelskie and Podkarpackie voivodships; a similar development
took place automatically in the case of the Łomża subregion in the Podlaskie voivodship
following the change of the country’s territorial division for statistical purposes (gaining
access to the border by the new NUTS3 subregion). On the Ukrainian side, it should be noted
that the situation of the adjacent areas in terms of the intensity of cross-border interactions
is similar to that of the Zakarpatska oblast.
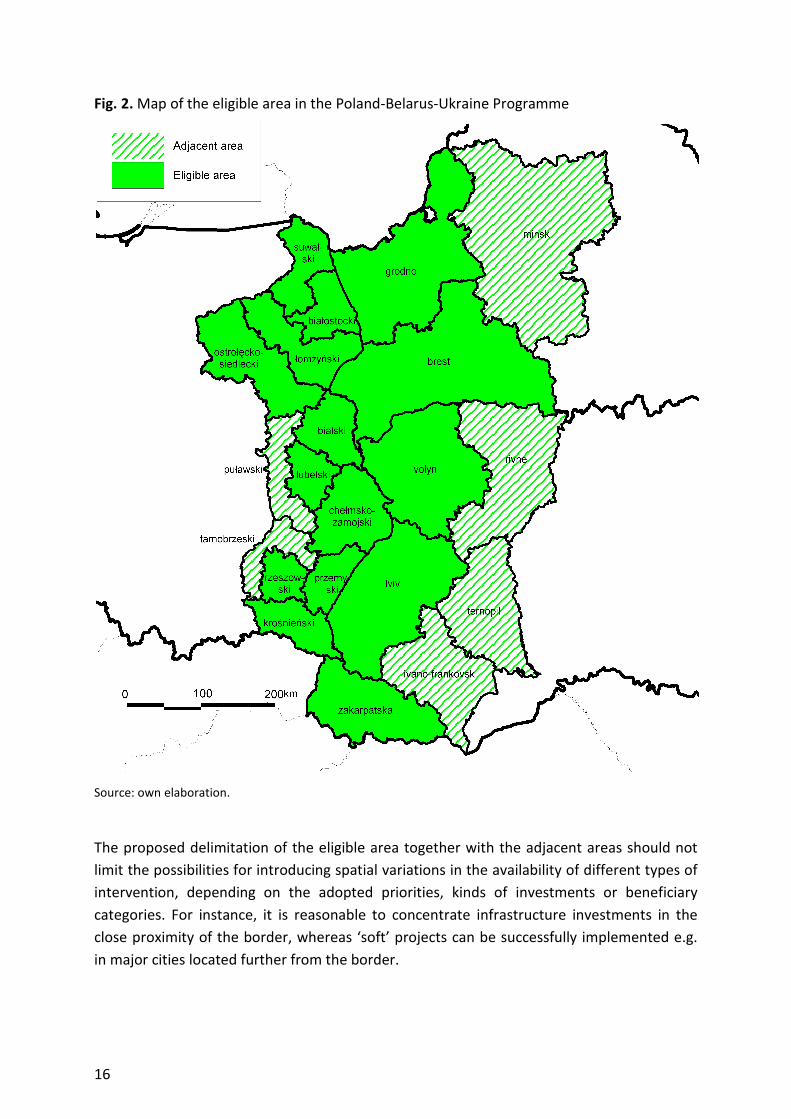
16
Fig. 2. Map of the eligible area in the Poland
Source: own elaboration.
The proposed delimitation of the eligible area
limit the possibilities for introducing spatial variations in the availability of
intervention, depending on the adopted priorities, kinds of investments or beneficiary
categories. For instance, it is
close proximity of the border
in major cities located further from the border
Map of the eligible area in the Poland-Belarus-Ukraine Programme
The proposed delimitation of the eligible area together with the adjacent areas should not
introducing spatial variations in the availability of
depending on the adopted priorities, kinds of investments or beneficiary
For instance, it is reasonable to concentrate infrastructure investments in the
close proximity of the border, whereas ‘soft’ projects can be successfully implemented e.g
major cities located further from the border.
with the adjacent areas should not
introducing spatial variations in the availability of different types of
depending on the adopted priorities, kinds of investments or beneficiary
to concentrate infrastructure investments in the
whereas ‘soft’ projects can be successfully implemented e.g.
17
4 Diagnosis of cross-border cooperation
4.1 Introduction
By cross-border cooperation, we mean various forms of interactions (relations) between
territorial units situated on the two sides of the border. These relations may take different
forms, ranging from economic, social and environmental to institutional and other forms,
including e.g. transport (see e.g. Komornicki 2003). One of the theories explaining the
intensity of spatial interactions used in our research is Ullman’s Triad (1957), which assumes
the dependence of such interactions on: a) complementarity, b) intervening opportunity,
and c) transferability. In a nutshell, complementarity is connected with the trade theory and
indicates the need for demand in one area and supply in another, a process which facilitates
mutual interactions. However, relations between regions can be modified by intervening
opportunities, which means that demand in one area can be satisfied by supply from other
areas. Thirdly, the outcome is determined by transferability, which is related to interactions
influenced by distance. In such a situation, this distance barrier is dependent on a number of
factors such as the costs of transport, existence of transport networks, and, most
importantly for the analysis at hand, barriers related to border crossing, including state
borders.
Taking the above into consideration, first we studied the preconditions and determinants of
interactions (cross-border cooperation) related to the existing regional resources, whose
comparison on both sides of the border may indicate whether they are complementary or
not. Those resources, in line with the Four Capital Model (Gorzelak et al. 2006), were divided
into the economic (fixed assets, infrastructure), human (workers and their skills), social (trust
and social mobilisation) and natural capital (natural resources and the ecosystem). Another
vital precondition is the political and institutional sphere, which can be understood broadly
as the administrative rules and potentials, including local governments and institutional
density, regarding the existing NGOs. These preconditions were analysed in detail, in the
form of a territorial audit presented below.
These preconditions may lead to interactions between the border areas. Nevertheless,
before that happens, various barriers need to be overcome, including those concerning the
functioning of the state borders. We identified these barriers and evaluated both their
significance and durability.

18
Fig.3. Block I analysis scheme: What are the barriers and opportunities of cross-border
cooperation in the eligible area?
Source: own elaboration.
Based on the existing determinants, and taking into account the defined barriers
(transferability), one can expect different kinds of interactions which can be defined as
cross-border cooperation. The most important dimensions of such cooperation include:
• Economic (e.g. commercial enterprise networks, foreign investments):
• Socio-cultural (tourism, cultural events);
• Environmental (e.g. cross-border ecosystem including basins, forests, etc. and
pollution migration);

19
• Institutional (e.g. cooperation between local governments, twin-cities, joint projects,
partnerships);
It should be noted that all these elements, internal determinants, barriers to cooperation
and cross-border interactions are affected by the external environment, e.g. global
megatrends such as globalisation or metropolisation, supranational organisations - including
the European Union, which also was taken into consideration in our research.
In the study, we used the extended SWOT analysis (Appendix 11) and TOWS analysis
(Appendix 12).

20
4.2 Diagnosis of cross-border cooperation in Polish-Belarus-Ukrainian
eligible area
The aim of the analysis is to diagnose the current condition of the economic, social and
natural capitals in the border regions concerned. The data used were derived primarily from
the national offices for statistics (selected indicators: Appendix 9). The diagnosis was made
for the Programme’s eligible areas, leaving out the adjacent areas.
4.2.1 Determinants of the development of cross-border cooperation
Population and the settlement structure
Save for its Belarusian part, the eligible area of the Poland-Belarus-Ukraine Programme is
relatively densely populated and has a population of 12.4 million. In 2012, the population on
the Polish side of the border totalled 5.136 million (41.4%), on the Belarusian – 2.452 million
(19.7%), and on the Ukrainian – 4.830 million (38.9%), which corresponds to the population
density at a level of 78.9 residents/km2 in Poland, 42.4 residents/km2 in Belarus and 88.3
residents/km2 in Ukraine. The major cities on the Polish side are the regional capitals: Lublin
(348 000), Białystok (294 000) and Rzeszów (182 000), which are followed by the subregional
centres: Suwałki (69 000), Łomża (63 000), Ostrołęka (53 000), Siedlce (76 000), Biała
Podlaska (58 000), Chełm (66 000), Zamość (66 000), Przemyśl (65 000) and Krosno (47 000).
Altogether, these main urban centres represent 27% of the border region’s population. The
cities which play a key role in the Ukrainian settlement network are Lviv (757 000), and,
though to a lesser extent, Lutsk (213 000) and Uzhhorod (116 000). The most notable smaller
cities include: Mukachevo (82 000), Drohobych (80 000), Chervonohorod (70 000) and Stryi
(62 000). The main cities on the Belarusian include Brest (311 000) and Grodno (314 000),
whilst the remaining cities play a rather insignificant role, with the exception of Baranovichy
(168 000), Pinsk (130 000) and Lida (98 000). It should be noted that a sizeable part of the
population still live in rural areas, and the rate of urbanisation remains much lower than in
Western European countries.
Economic capital
The eligible area of the Programme strongly varied in terms of affluence expressed as
regional income per capita, which in 2010 was ca. EUR 6500 on the Polish side, EUR 2900 on
the Belarusian side and EUR 1600 on the Ukrainian side of the border. These differences first
and foremost expressed wide disparities observable between these three countries. In
parallel, the border areas in all these countries were among the least developed regions, and
in 2010 reached 70.5% of the national average on the Polish side, 64.5% on the Belarusian
side and 63.8% on the Ukrainian side. It should also be noted that in the period 2008-2010
the situation of the border regions was rather stable; their rate of growth did not differ
significantly from the overall national figures, although with relatively strong fluctuations
associated with the economic crisis, which were particularly acutely visible in the Belarusian
part of the eligible area.

21
The low development level can first and foremost be attributed to an unfavourable
economic structure, with a persisting high share of traditional labour-intensive sectors in
gross value added (GVA), which ranged from 8.2% on the Polish side to 14.9% on the
Belarusian side, as compared to the UE average of approximately 2.0%. The main difference
between the individual components of the eligible area was the considerable
industrialisation on the Belarusian side, with its 45% share of industry and construction in
the regional income, as compared to approx. 28% and 21% in Poland and Ukraine,
respectively, i.e. 5pp and 8pp less than the (respective) national average. The structural
changes in this regard were progressing rather slowly. In the Polish part of the eligible area,
they were manifested by the diminishing significance of agriculture and a growing share of
industry, whilst in the Ukrainian part the significance of agriculture and industry was
diminishing relatively fast, a process which was accompanied by the increasing role of the
service sector.
The use of the workforce was not very efficient in the eligible area, and was manifested by
excessive employment in the unproductive agriculture sector. This was particularly true for
the Polish part of the eligible area, where the share of employment in the primary sector
surpassed 40%, as compared to over 21% in Ukraine and approx. 15% in Belarus. Relatively
high unemployment was another problem, especially in the Polish part of the eligible area,
which in 2012 ranged from 11.7% in the Lublin subregion to 17.4% in the Krosno subregion.
Furthermore, since 2008 unemployment on the Polish side showed an upward trend. On the
Ukrainian side of the border, the unemployment rate was considerably lower, oscillating
between 7.7% and 9.6% and showing a great deal of stability in the recent years (with the
exception of the Zakarpatska oblast, where it grew considerably). In contrast, according to
the national statistics, unemployment did not pose a problem in the Belarusian part of the
eligible area as it remained under 1% of the population able to work.
The eligible area did not attract any considerable volumes of foreign capital. It should also be
noted that the countries participating in the Programme were not equally attractive for
inward capital: in the period 2008-2012, Poland recorded an influx of USD 52 billion, as
compared to Ukraine’s USD 35 billion and Belarus’ USD 10 billion. Nevertheless, the
differences in the per capita values of invested capital were not significant, and amounted,
respectively, to USD 1400, USD 800 and USD 1100. The share of the Polish part of the eligible
area in the number of registered companies with foreign shareholdings was only 3.7%, but it
increased noticeably in the recent years, from 3.4% in 2009. Nonetheless, there are only 5.3
entities with foreign shareholdings per 10 000 population, as compared to the national
average of 19.5. Similarly, the Belarusian part of the eligible area attracted a mere 2.8% of all
FDIs in 2012.
To date, tourism has not been a sector of significance in the eligible area, with the exception
of a few local systems. Domestic tourists made up the bulk of overall tourist traffic, with a
rather insignificant role of foreign tourists, who accounted of 16% of tourists using
accommodation facilities. Moreover, in 2012 the number of tourists with overnight stays per

22
100 residents was 33 on the Polish side (with a total of 60 000 beds), as compared to the
national average of 55. In Ukraine, the number of tourists using accommodation facilities
was comparable, and, depending on the oblast, ranged between 10 and 20 tourists per 100
residents. In Belarus, foreign tourism mainly had the form of organised tours, but the scale
of this activity was rather limited.
The potential for endogenous development of the eligible area varied from country to
country, which was due, amongst others, to different penetration rates of SMEs, including
businesses run by individuals, in the respective border regions. In the Polish part of the
eligible area, the number of business entities registered in the REGON system was
approximately 395 000, which corresponds to 77 businesses per 1000 residents, as
compared to 109 000 businesses in Ukraine, i.e. 23 businesses per 1000 residents, and to
only 19 000 in Belarus, i.e. 8 businesses per resident. The degree of innovativeness of the
regional economy in the Polish part of the eligible area was similar to that of the national
economy, which was manifested inter alia by a similar percentage of those employed in the
R&D sector. This can be explained by the improved situation in the Podkarpackie voivodship.
Even so, while in the Polish part of the eligible area this percentage was 0.5%, it reached
0.2% in Ukraine and a meagre 0.1% in Belarus. This means that the border regions in the two
eastern countries clearly lagged behind the country’s core areas, notably the capital city
regions.
The transport infrastructure is of special significance for the development of the border
areas, also because of the need to service the transit traffic across the border. A number of
major European transport corridors run through the eligible area. These include: No. 2
Berlin-Moscow (E30 road and E20 railway route); No. 3 Dresden-Kiev (E40 road and E30
railway route), as well as Road No. 17 Warsaw-Lviv; Road No. 12 Lublin-Kiev, Road No. 19
Białystok-Grodno, the Warsaw-Kiev and Warsaw-Lviv railway routes, and the LHS railway line
No. 65 (wide-gauge track). It should be noted that, in the recent years, a number of
investments were made in connection with these corridors, aimed to improve their quality
and increase capacity. It should also be noted that the eligible area has a relatively high
density of the road network, albeit with strong differences across the countries concerned.
The road density in the Polish part of the eligible area is nearly two times as high as in the
Belarusian and Ukrainian parts. Importantly, some of the existing road infrastructure still
remains rundown and neglected, particularly in the Ukrainian part of the region concerned.
The same can be said for the rail network, which in addition is losing in competition with the
road transport, owing to long travel times and a low quality of the supporting infrastructure.
There were eight border crossings at the Polish-Ukrainian border handling regular passenger
traffic, including two rail border crossings, and eight such border crossings at the Polish-
Belarusian border, including three rail border ones. The main streams of passenger traffic,
however, are concentrated around several border crossings only. At the Polish-Ukrainian
border, these were: Dorohusk, Hrebenne, Korczowa and Medyka (representing 77%
crossings), and at the Polish-Belarusian border: Terespol, Kuźnica Białostocka and

23
Bobrowniki (representing 72% crossings). The significance of rail border crossings except
Terespol (ca. 650 000 crossings) for passenger traffic was only marginal, with the number of
crossings ranging from 250 000 in Kuźnica Białostocka to 100 000 citizens per year in
Dorohusk and Przemyśl. The most dynamic border traffic, at a level of 20 million crossings at
the Ukrainian border, was recorded in the years 2006 and 2007. It fell to 11.6 million in
2009, to increase again up to 13.8 million in 2011. In case of the Polish-Belarusian border,
the greatest volume of traffic, 13 million, was recorded in 2000, and the subsequent years
saw its gradual fall, down to a level of 8.2 million crossings in 2011. Nonetheless, the
capacity of border crossings for all types of traffic is still insufficient, which leads to periodic
bottlenecks, resulting in longer waiting times to cross the border.
Human and social capital
In the Polish part of the cross-border region, the number of the population in the recent
years was constant, as opposed to that in the Belarusian and Ukrainian parts. In the period
2004-2012, the number of the population on the Belarusian side of the border decreased by
over 5%, and on the Ukrainian side it fell by 1.4%. In the latter case, the fall in the number of
the population resulted both from natural decrease (in the Ukrainian part, the decrease in
2004-2012 was -0.5‰, and as much as -2.4‰ in the Belarusian part) and from emigration (in
the period at hand, 22 000 residents emigrated from the Belarusian part of the cross-border
region, and over 28 000 – from the Ukrainian part). Migration was also a serious problem in
the Polish part, but it was compensated by natural increase.
In terms of the demographic structure, the relatively most favourable situation could be
observed in the Polish part of the cross-border region, and the least favourable - in the
Belarusian part. In 2011, the share of the working-age population was, respectively, 63.5% in
the Polish part, 60.5% in the Ukrainian part, and 59.5% in the Belarusian part. In the same
year, the highest share of the pre-working age population in the total number of the
population was recorded on the Polish side of the border (19.3%), lower on the Ukrainian
side (18.3%), and the lowest – on the Belarusian side (17.2%). In consequence, in the
Belarusian and Ukrainian parts of the eligible area, there is a high share of the post-working
age population, 21.2% in the Ukrainian part and 23.2% in the Belarusian part of the eligible
area. By comparison, the situation in the Polish part of the cross-border region can be
viewed as rather favourable, with 17.2% of the population in post-working age. Nonetheless,
in a broader perspective, it should be concluded that even on the Polish side of the border
the problem of population ageing is very acute and likely to worsen in the coming years.1
In the Polish and Ukrainian parts of the cross-border region, access to higher education is at
a relatively good level (mainly due to the existence of academic institutions in Lviv, Lublin
and Rzeszów). In 2011, there were nearly 46 students per 1000 population on the Polish side
of the border, and nearly 44 on the Ukrainian side. Visibly lower values were noted in the
1Miszczuk Andrzej, Smętkowski Maciej, Płoszaj Adam, Celińska-Janowicz Dorota (2010) ‘Aktualne problemy
demograficzne regionu Polski wschodniej’. Raporty i Analizy EUROREG 5/2010, p. 65.

24
Belarusian part of the cross-border region, with 28 students per 1000 population. However,
the national statistics for Belarus are significantly better, and comparable with the results
from Poland and Ukraine, which probably means that the residents of the Belarusian part of
the cross-border region relatively frequently choose universities located outside of this area
(most often in Minsk).
The level of human capital, measured by the share of the population with higher education,
is relatively low in the Polish-Belarusian-Ukrainian cross-border region. On the Polish side of
the border, only 13.7% (2011) of the population had higher education. In the Belarusian part
of the eligible area, the respective value was similar, at a level of 13.8% (2009). Both in
Poland and Belarus, the situation in the cross-border region was worse in that regard than
the respective national average. For Ukraine, there are no statistics showing the educational
attainment of the population at the regional level.
The development of social capital, measured by the number of registered NGOs, is markedly
varied in the Polish-Belarusian-Ukrainian cross-border region. The highest share of NGOs in
relation to the demographic potential was noted in the Polish part of the eligible area: in
2012, there were slightly over 30 NGOs per 10 000 population. In contrast, there were nearly
twice as few NGOs on the Ukrainian side of the border (16.4 per 10 000 population). Both on
the Polish and Ukrainian sides of the border, the third (non-governmental) sector developed
dynamically in the recent years (in 2004-2012, the increase in the Polish part of the eligible
area was 48%, and it reached nearly 80% in the Ukrainian part). The situation in that respect
in the Belarusian part of the eligible area is completely different. Any thorough evaluation of
the condition and significance of the third sector on the Belarusian side of the border is not
possible due to the lack of relevant official statistics and analyses. However, on the basis of
the number and structure of the beneficiaries of the CBC programmes implemented so far it
can be concluded, that the NGO sector in Belarus is at a very low level of development.
In terms of public safety, the situation in the cross-border region was the most favourable on
the Ukrainian side of the border (6.6 registered crimes per 1000 population in 2011) and
somewhat less favourable on the Belarusian side (10.9). The highest number of crimes and
offenses was registered in the Polish part of the eligible area (22). In 2004-2011, in the Polish
and Belarusian parts of the cross-border region, the crime rate fell noticeably, but in the
Ukrainian part the situation in that regard did not improve. It should be stressed, however,
that these data only show registered crimes and that the actual scale of such phenomena is
probably greater. In addition to that, the differences in the statistical data across countries
may be due to the dissimilarities in the regulations of law and methodologies.
Natural capital
The area in question has outstanding environmental assets, associated mainly with the well-
preserved mountain, wetland and primeval forest ecosystems. Many national parks can be
found here – eight on the Polish side of the border (of a total of 23), eight on the Ukrainian
side (of 40) and two on the Belarusian side (of 4). The share of the area protected in this way

25
ranges from 2.4% in the Polish part of the eligible area and 3% in the Belarusian part to 3.9%
in the Ukrainian part, and is significantly higher than the respective national averages.
Importance of some of these areas surpass the national scale, as demonstrated by their
being inscribed on The Ramsar List of Wetlands of International Importance (4 areas in the
Polish part and 4 in the Ukrainian part) and on the UNESCO Biosphere Reserve List (5 areas).
In the latter case, cross-border cooperation is of cardinal importance. In 2012, the West
Polesie Biosphere Reserve (Poleski NP, Szacki NP and the Nadbużańskie Polesie Reserve) was
accorded the status of a transboundary Polish-Ukrainian-Belarusian reserve; in 1998, a
similar status was granted to the Polish-Slovakian-Ukrainian East Carpathians Biosphere
Reserve. Two more biosphere reserves protecting the Białowieża Forest/Belovezhskaya
Pushcha are situated near the border, and were inscribed separately in the Polish and
Belarusian UNESCO list. This area is also a natural habitat for many rare animal species such
as the European bison, bear, wolf, lynx and elk.
The afforestation rate for the area in question is approximately 31.9% (as compared, on
average, to 29.3% in Poland, 36% in Belarus and 15.6% in Ukraine), a considerable area is
also occupied by lowland wetlands. Some of these ecosystems have been preserved on a
scale unprecedented in Europe, particularly the Białowieża Forest/Belovezhskaya Pushcha,
the Biebrza Wetlands and Polesie/Polesia. High-quality soils, found e.g. in the Lublin Upland
and the Volhynia-Podolia Upland, are yet another important natural asset of the region in
question. Nearly one-fourth of Poland’s soils from the 1st and 2nd valuation class are found in
the Lubelskie voivodship.
The major cross-border ecosystems include the Białowieża Forest/Belovezhskaya Pushcha,
East Carpathians, Polesie/Polesia and the Bug River. The East Carpathians and
Polesie/Polesia are protected by cross-border biosphere reserves, but some of the species
which are under protection on the Polish side of the border do not enjoy such a status on
the other side of the border (e.g. wolf, elk, beaver). In the case of the Carpathians, the most
serious threats include the growing human pressure caused by the increasing volume of
tourist traffic and development of infrastructure, and illegal logging (in the Ukrainian part).
In case of the Białowieża Forest/Belovezhskaya Pushcha, there is also the problem of the
dissimilar protection status of migrating animals. Due to the unique nature of the Forest,
some opinions are also voiced that the Forest is not sufficiently well protected. On the Polish
side of the border, only 16% of the Forest’s area is comprised by the Białowieski NP; on the
Belarusian side, the entire Pushcha is protected as a national park, but with a lower
protection regime than in Poland’s national parks. The Bug is Poland’s border along a
distance of 363 kilometres, and its drainage basin covers an area of 39 400 km2 (19 400 km2
in Poland, 10 800 km2 in Ukraine and 9200 km2 in Belarus). Water quality in the river is
moderate along its central section, and poor along its lower section, due to an insufficient
degree of municipal waste treatment and run-off from the farmland. Flood threat is another
issue; this problem is the most acute during the thawing period and in those places where
the river valley is relatively narrow.
26
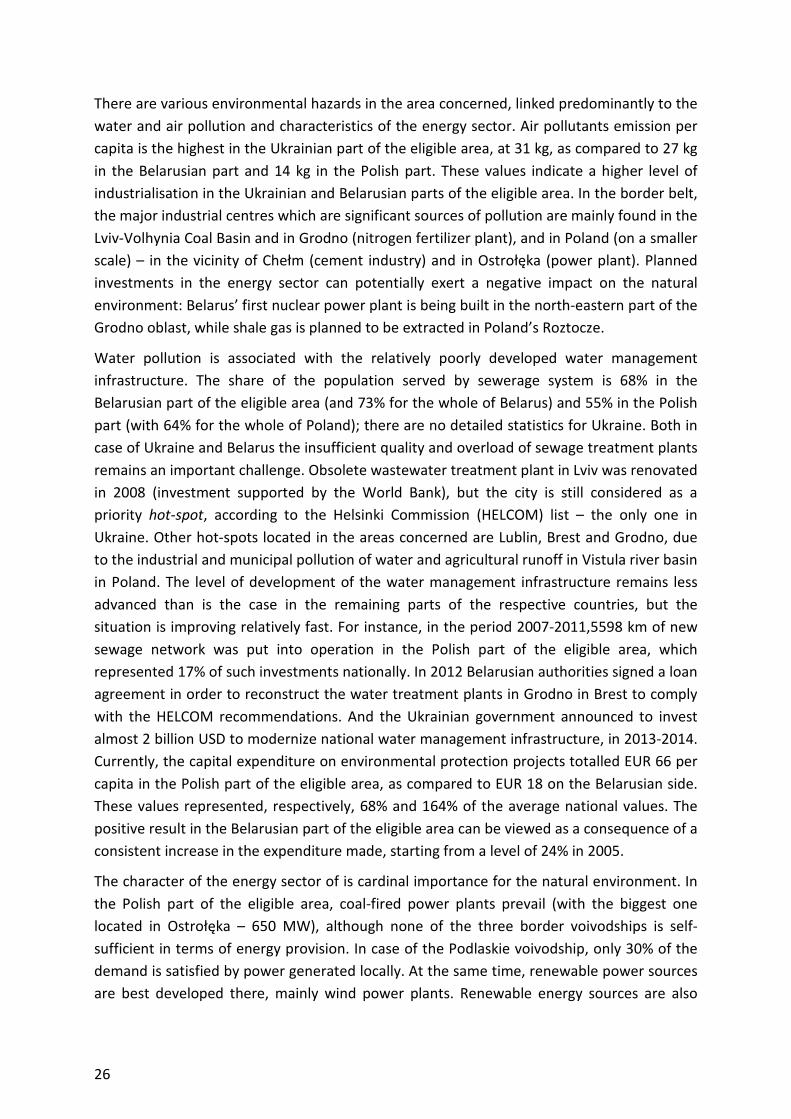
There are various environmental hazards in the area concerned, linked predominantly to the
water and air pollution and characteristics of the energy sector. Air pollutants emission per
capita is the highest in the Ukrainian part of the eligible area, at 31 kg, as compared to 27 kg
in the Belarusian part and 14 kg in the Polish part. These values indicate a higher level of
industrialisation in the Ukrainian and Belarusian parts of the eligible area. In the border belt,
the major industrial centres which are significant sources of pollution are mainly found in the
Lviv-Volhynia Coal Basin and in Grodno (nitrogen fertilizer plant), and in Poland (on a smaller
scale) – in the vicinity of Chełm (cement industry) and in Ostrołęka (power plant). Planned
investments in the energy sector can potentially exert a negative impact on the natural
environment: Belarus’ first nuclear power plant is being built in the north-eastern part of the
Grodno oblast, while shale gas is planned to be extracted in Poland’s Roztocze.
Water pollution is associated with the relatively poorly developed water management
infrastructure. The share of the population served by sewerage system is 68% in the
Belarusian part of the eligible area (and 73% for the whole of Belarus) and 55% in the Polish
part (with 64% for the whole of Poland); there are no detailed statistics for Ukraine. Both in
case of Ukraine and Belarus the insufficient quality and overload of sewage treatment plants
remains an important challenge. Obsolete wastewater treatment plant in Lviv was renovated
in 2008 (investment supported by the World Bank), but the city is still considered as a
priority hot-spot, according to the Helsinki Commission (HELCOM) list – the only one in
Ukraine. Other hot-spots located in the areas concerned are Lublin, Brest and Grodno, due
to the industrial and municipal pollution of water and agricultural runoff in Vistula river basin
in Poland. The level of development of the water management infrastructure remains less
advanced than is the case in the remaining parts of the respective countries, but the
situation is improving relatively fast. For instance, in the period 2007-2011,5598 km of new
sewage network was put into operation in the Polish part of the eligible area, which
represented 17% of such investments nationally. In 2012 Belarusian authorities signed a loan
agreement in order to reconstruct the water treatment plants in Grodno in Brest to comply
with the HELCOM recommendations. And the Ukrainian government announced to invest
almost 2 billion USD to modernize national water management infrastructure, in 2013-2014.
Currently, the capital expenditure on environmental protection projects totalled EUR 66 per
capita in the Polish part of the eligible area, as compared to EUR 18 on the Belarusian side.
These values represented, respectively, 68% and 164% of the average national values. The
positive result in the Belarusian part of the eligible area can be viewed as a consequence of a
consistent increase in the expenditure made, starting from a level of 24% in 2005.
The character of the energy sector of is cardinal importance for the natural environment. In
the Polish part of the eligible area, coal-fired power plants prevail (with the biggest one
located in Ostrołęka – 650 MW), although none of the three border voivodships is self-
sufficient in terms of energy provision. In case of the Podlaskie voivodship, only 30% of the
demand is satisfied by power generated locally. At the same time, renewable power sources
are best developed there, mainly wind power plants. Renewable energy sources are also

27
significant in the Podkarpackie voivodship (hydro-plants). Gas-fired power plant in
Belaazyorsk (over 1000 MW) is the main energy source in the Belarusian part of the eligible
area. Renewable energy is only in a nascent state; in 2011, the country’s first wind farm (1.5
MW) was put to operation in the Grodno oblast, and in 2012, a 17 MW hydro-plant was
launched. One 600 MW hard coal-fired plant operates in the Ukrainian part of the eligible
area. Renewable energy is not well developed, with the only significant source of this type
being a 27 MW hydro-plant in the Zakarpatska oblast.
4.2.2 Barriers to cross-border cooperation
First of all, it should be noted that the respondents strongly emphasised that currently cross-
border cooperation at the Polish-Ukrainian border, and even more perceptibly at the Polish-
Belarusian border, was far from fully tapping the potential in all the three spheres under
analysis, i.e. economic, socio-cultural and institutional. This was particularly well visible in
relation to the potential for the development of economic interactions in both trade
exchange and foreign investments. Lack of satisfaction from institutional cooperation was
expressed particularly strongly at the Polish-Belarusian border. Nonetheless, also at the
Polish-Ukrainian border some potential for expanding the cooperation between public
authorities and NGOs could be observed. Socio-cultural cooperation received the most
praise, although also in this case, particularly at the Polish-Belarusian border, a relatively low
level of satisfaction was expressed. It should be observed that there were no fundamental
differences between the respondents from the three countries regarding how cross-border
cooperation was evaluated, with the exception of not as positive evaluation of the Polish-
Belarusian cooperation as compared to Polish-Ukrainian cooperation, as indicated by the
respondents on the Belarusian side of the border.
As regards the barriers obstructing economic cooperation at the Polish-Ukrainian and Polish-
Belarusian borders, problems associated with the border regime were stressed particularly
strongly. It should be noted that this issue is related not only to the border infrastructure
alone, but also to the legal regulations associated with crossing the state border and the
operation of border crossings, including long waiting times for passenger and cargo
clearance. The visa traffic and operation of Polish consulates in Belarus and Ukraine which,
for various reasons, are not able to efficiently handle the applicants, are also part of the
problem. In consequence, this means that crossing the border involves a substantial effort in
terms of time and money, and clearly acts as a constraint on expanding cross-border
cooperation.
Secondly, attention was drawn to the existing legislative and institutional systems including
the differences observable between the partner countries which are not conducive to the
development of cooperation. Above all, this concerns a high degree of centralisation of the
public administration on the Ukrainian and Belarusian sides of the border, as well as limited,
and very often only superficial competences of the local authorities at different levels. This
problem has already been demonstrated in other research carried out at the Polish-
Belarusian-Ukrainian border (cf. e.g. Krok, Smętkowski 2006), which pointed to the existence
28
of a number of barriers obstructing economic cooperation, which could be summed up as a
triad: excessive red tape - opaque regulations - corruption.
Infrastructural problems were also frequently pointed out, mostly in relation to the road
infrastructure on the Ukrainian side of the border. This problem, however, was of secondary
significance in comparison to the ones mentioned above. Some respondents emphasised
that even an outstanding degree of infrastructural provision could not offset the negative
impact the border regime has on the development of cross-border cooperation. On the
other hand, it was pointed out that new border crossings should be opened to make border
traffic more efficient.
Another barrier was posed by the disparities in the level of economic development, which
had an impact on the availability of capital resources needed for cooperation to take place.
Moreover, it should be noted that the differences in the economic structure of the regions
adjacent to the border did not facilitate such cooperation either.
Respondents expressed an opinion that efforts to alleviate differences in the cultural
sphere, which according to over 60% respondents obstructed cooperation, should be both
initiated and continued, although the nuisance caused by this barrier was regarded as not
very significant. This sphere should be understood broadly, and should include stereotypes,
unresolved problems from the past and dissimilar mind-sets which evolved in the different
administrative and legislative systems.
Another issue which was often mentioned by the respondents was the geopolitical situation
(particularly with regard to Polish-Belarusian relations) at national level and dependence of
the implementation of joint projects, mostly in the sphere of institutional but also socio-
cultural cooperation, on political decisions taken by the highest-level authorities.
According to the respondents, the barriers hampering economic cooperation, listed above,
were similar in case of socio-cultural and institutional cooperation. The major differences
between them were as follows:
a) Socio-cultural cooperation:
• Difficulties associated with the border regime (need to obtain a visa and its high
cost in relation to the level of affluence of Poland’s eastern neighbours, long
waiting time to cross the border), which posed a more pressing problem than the
existing legislative and institutional environment;
• Cultural differences were more visible than those in the field of economic
cooperation.
b) Institutional cooperation:
• The legislative and institutional framework, which is a source of many problems
due to a high level of centralisation of the administration in the eastern partners’
countries, which can obstruct the flow of funds to the project partners, but is also
due to the CBC programme regulations, e.g. eligibility of VAT. This also relates to

29
information problems, which make it difficult to find adequate partners for the
implementation of joint initiatives.
To sum up, according to the respondents, the border and the border regime represented the
most important barriers to cross-border interactions at the Polish-Belarusian-Ukrainian
border. It should be noted that this applies not only to the border infrastructure but also to
the operation of the border crossings and legislation governing the crossing of state borders.
Secondly, the respondents pointed to legislative and institutional barriers created by
dissimilar regulations and differences in the administrative structures, which nonetheless
can only be resolved at national level. Physical infrastructure was also listed as a problem,
but of a secondary nature in comparison to those discussed above. In other words, the
respondents were aware that even an outstanding degree of infrastructure provision cannot
compensate for the negative impact of the border regime and legislative and institutional
environment on the development of cross-border cooperation. This also pertained to the
economic barrier, understood as lack of proportion in the level of development, which also
affects the provision of sufficient funds for making the cooperation a reality. At the same
time, it should be emphasised that broadly understood cultural differences still posed a
significant barrier in the respondents’ opinion, although not regarded as causing a great deal
of distress.
The respondents did not suggest many ways in which these problems could be resolved. The
most notable suggestions included the following:
• Introduction of local border traffic at the Polish-Belarusian border and expanding
local border traffic up to 50 km at the Polish- Ukrainian border;
• Introduction of joint border checks by the relevant services of the neighbouring
countries;
• Introduction of fixed parities for the distribution of the Programme funds among
the institutions of the neighbouring countries (a change which could boost
activities of the eastern partners),
• Expanding information activities and strengthening assistance aimed to maintain
and continue the contacts that have been established,
• Strengthening good neighbourly cooperation (between individuals), which should
help reduce the impact of cultural differences.

30
4.2.3 SWOT analysis
Based on the completed diagnosis and the analysis of cross-border interactions discussed in
the first part of the Report, we can identify strengths and opportunities, possibilities and
limitations relating to cross-border cooperation, as well as opportunities and threats which
might arise in the external environment, viz. (weights in brackets – 100 in each category,
representing the relative significance of the given issue):
STRENGTHS:
• Development of regular trade exchange that is replacing trading in open-air
marketplaces (45),
• Well-developed socio-cultural cooperation, largely reflecting the potential of the
border regions in this sphere (25),
• Interest in developing institutional cooperation, expressed by partners on both
sides of the border (15),
• Numerous cross-border ecosystems with significant environmental assets (15).
WEAKNESSES:
• Border regime associated with the external border of the European Union, with
various dysfunctions that occur at border crossings and which considerably
hamper cross-border interactions (35),
• Differences in the legislative and institutional systems, which hinders the
development of cross-border cooperation (25),
• Underdevelopment of technical infrastructure (transport and border crossings),
which poses a barrier to the development of cross-border interactions (15),
• Noticeable cultural barriers (including negative stereotypes), which obstruct the
development of cross-border cooperation (10),
• Cross-border environmental pollution, particularly in the drainage basin of the
Bug River (10),
• Wide disparities in the level of economic development, which does not facilitate
the development of cross-border cooperation (5).
POSSIBILITIES:
• Existence of large cities in the eligible area, which opens up possibilities for
endogenous development based on stimulating enterprise and innovation (30),
• Existence of higher education institutions, which opens up possibilities for the
development of academic and research cooperation and student exchange (25),
• Potential for the development of tourism, also inbound tourism, in selected local
systems (20),
• Potential for the development of logistics functions associated with the transit
location (20),

31
• Improved quality of human capital, providing the basis for socio-economic
development and cross-border cooperation (5).
LIMITATIONS:
• Low competitiveness of the border regions caused by an unfavourable economic
structure and ineffective use of the labour resources (35),
• Low attractiveness of the border regions for inward capital (20),
• Poorly developed transport infrastructure, including inefficient use of the
potential of rail transport (20),
• Lack of a local border traffic (LBT) agreement with Belarus (15),
• Population ageing, particularly on the Belarusian and Ukrainian sides of the
border (10).
OPPORTUNITIES:
• Development of trade exchange between the European Union, Belarus and
Ukraine (80),
• Alignment of the legislative and institutional systems of Poland and the
neighbouring countries (20).
THREATS:
• Little progress in the processes of integration with the European Union in the
neighbouring countries (40),
• Metropolisation processes leading to diminished significance of peripheral areas
(30),
• Unfavourable geopolitical situation (30).

32
4.2.4 TOWS analysis
Based on the factors identified in the SWOT analysis, a TOWS/SWOT analysis was conducted
to evaluate the interactions taking place between all the SWOT factors. For the purposes of
this exercise, possibilities were combined with opportunities and limitations with threats,
and the corresponding weights were: 0.8 internal factors for possibilities and limitations, and
0.2 external factors for opportunities and threats.
Fig. 4. Results of the TOWS/SWOT analysis
SWOT TOWS
0 T
O T
S 5,7 2,3
S 6,0 5,9
W 4,5 4,7
W 2,3 4,5
TOWS/SWOT
O T
S 11,7 8,2
W 6,9 9,2
Source: own elaboration.
The results of the TOWS/SWOT analysis can be interpreted in favour of the adoption of the
aggressive strategy. The strengths of the cross-border area and cross-border cooperation, if
capably used and further reinforced, could ensure that the existing opportunities for
development are taken advantage of. However, the results of the analysis are not quite
unequivocal since, in the TOWS/SWOT analysis, the difference of the power of relations
between the strengths and opportunities (11.7) and between the weaknesses and threats
(9.2) is not very big. On this basis, it could be argued that some elements of the defensive
strategy should also be adopted in order to minimise the weaknesses, so that they do not
reinforce the threats. To sum up, it can be said that the strengths of the macroregion should
be supported in the first place, and only then should the constraints for growth be removed.

33
5 Strategic objectives and thematic scope
5.1 Introduction
Determining the proper objectives, priorities and actions of the planned intervention is a key
for its success. The decision about the objective of the intervention has a political nature,
but still it ought to be based on a reliable diagnosis, so the objectives are realistic
(achievable) and adequate to the efficiency of the public funds spending and suitable to the
key challenges and problems. Moreover, the planned intervention has to be coherent with
other policies (technically speaking it has to be coherent with the binding documents) and
complementary to other interventions undertaken in a given area.
The intervention should be structuralized in a logical way so that the actions are in line with
the priorities and these fulfil the strategic objectives (Figure.5). This is a necessary condition
for positive connection between projects and planned impact of the intervention.
Objectives, priorities, and actions should be measurable. Assignment of appropriate
indicators allows assessment of the effects and impact of the intervention, and at the
implementation stage is a basis for setting the monitoring (and evaluation) system.
Important elements of realization of the effective intervention are: (1) the choice of the best
projects, which is possible thanks to suitable evaluation criteria of the projects applications;
(2) determining key strategic projects (which can be realized outside the open competitions);
(3) determining a suitable beneficiaries catalogue.
Factors reinforcing the effectives of the intervention may be: (1) an appropriate support
system for the beneficiaries (in the case of cross-border programmes it concerns mainly
support for creation of project partnership ); (2) creation of a catalogue of project ideas (in
the form of collection of best practices).
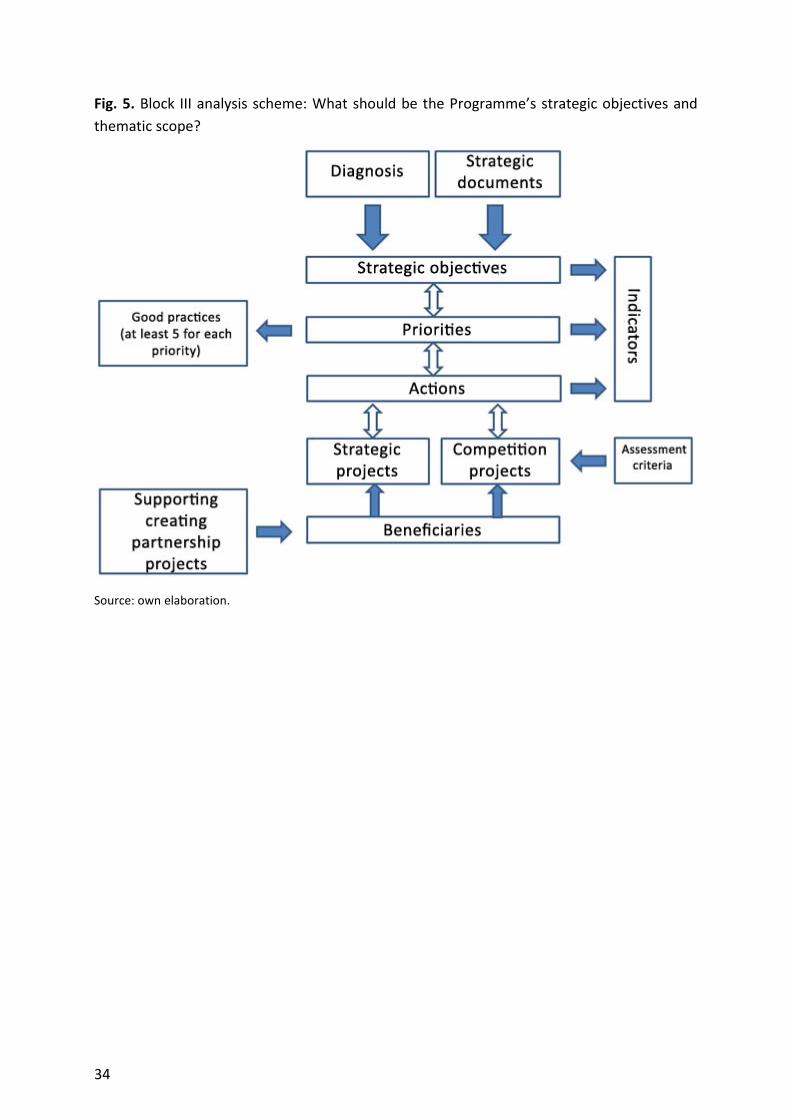
34
Fig. 5. Block III analysis scheme: What should be the Programme’s strategic objectives and
thematic scope?
Source: own elaboration.

35
5.2 Strategic objectives and thematic scope of the Poland-Belarus-Ukraine
Programme
5.2.1 Objectives of the Poland-Belarus-Ukraine CBC Programme
The main objective of the Programme is the development of cross-border cooperation in
the economic, social, environmental and institutional sphere. These dimensions of
cooperation should be complementary, which should allow to achieve the overriding
objective of the Programme, that could be defined as an attempt to create a functional,
cross-border region. In such a region, the role of barriers posed by the existence of state
borders should be limited to a minimum.
The strategic objective should be pursued under the following three priorities:
1. Supporting socio-economic integration of the border areas
2. Improving innovativeness of the economy in the border region
3. Improving the quality of life in the border areas
The Programme’s core objective and priorities have been based on a diagnosis of the eligible
area, which produced the following recommendations for the strategic intervention
framework:
• The peripherality of the eligible area, well visible in the socio-economic sphere, can
be alleviated by promoting cross-border interactions;
• The region is facing the challenge to meet the requirements of contemporary
knowledge-based economy, a situation which calls for improving the education
system and linking it to socio-economic development;
• The quality of life in the border areas should be enhanced, by such activities as
investments for the protection of the natural environment, development of social
infrastructure and strengthening of the local communities;
• The interest shown by the partners in cross-border cooperation is hindered by a
number of barriers, most of which are associated with the dissimilarities in the
administrative and legislative systems of the countries participating in the
Programme.
PRIORITY 1: Supporting socio-economic integration of the border areas
On the basis of the diagnosis, it was concluded that the main barrier to cross-border
cooperation in all the investigated areas is the existence of the state border and the
accompanying border regime. This barrier can be further aggravated by problems of
infrastructural nature, including the poor condition of the road infrastructure and a minor
role of railway transport in cross-border interactions. It should also be noted that in order to
ensure continued development of cooperation parallel measures should be put in place,
aimed to alleviate the disparities existing in the cultural sphere and associated with the
persisting negative stereotypes, resentments from the past and dissimilar types of mentality

36
that evolved under the different administrative and legislative systems, which can obstruct
not only social but also economic interactions.
First and foremost, measures intended to support the interactions between the border areas
should be pursued as a priority. They involve, firstly, steps that facilitate crossing the border,
development of the existing crossings and introducing organisational arrangements
streamlining the process and making it more user-friendly and, secondly, undertaking
complementary activities involving the creation and development of transport infrastructure
allowing an easy access to the border crossings and, thirdly, implementing many different
microprojects to improve good neighbourly relations and overcome the existing cultural
differences.
Measure 1.1. Construction and streamlining of the operation of border crossings
Measure 1.1. should aim to develop the border infrastructure and improve its efficient use.
Under the present border regime, it is the quality of this infrastructure and its ‘user-
friendliness’ that determine key border interactions in the economic, social and institutional
sphere.
As part of this measure, the following activities should be undertaken in particular: 1)
adaptation of the existing border crossings to handle pedestrian and bicycle traffic (at the
moment there are only two such crossings along the entire eastern border), 2) creating
possibilities for simplified border clearance for those travellers who rarely cross the border,
3) opening new road, rail, water, pedestrian and bicycle border crossings, particularly in
those locations where the required transport infrastructure is already in place, 4) developing
a coherent system of signage and visual identification of the border crossings, 5) building the
supporting border crossing infrastructure, 6) streamlining border crossing procedures and
training the border protection and customs services.
The first of these actions should help considerably increase the capacity of the border
crossings and reduce waiting times to cross the border without having to incur substantial
financial outlays. Such an arrangement should also foster the growth of transport companies
that offer transportation to the border. The second would involve the division of border
traffic into one generated by a small number of people who cross the border daily or several
times a week and one involving those who have not crossed the border during the last three
or six months. Such an arrangement would facilitate travel e.g. for tourists, business people,
as well as representatives of the authorities and institutions involved in joint projects. For
this group of travellers, a separate zone should be set up for their border clearance (or the
existing zone for bus/coach clearance could be used instead). The third proposed measure
arises from the relatively sparse distribution of the border crossings, which obstructs mutual
contacts for the local communities living on both sides of the border and hinders the
development of tourism. In many cases, a relevant transport infrastructure is in place on
both sides of the border, which means that the required financial expenditure would be
limited only to the construction of the border crossing infrastructure. The next proposed

37
measure should help improve the travellers’ comfort owing to the creation of an easily
understood system of signage and visual identification to facilitate the travellers’
movements, in addition to the development of the accompanying infrastructure, i.e. the
construction of parking lots, toilets and service centres. These measures should also
encompass the direct vicinity of the border crossings. It should be emphasised that the
current standard of the border crossings should be described as inferior, and the
components that make up the border infrastructure do not form any coherent whole. The
last proposed type of measures should aim to streamline the border crossing procedures,
including elimination of any redundant elements (e.g. undergoing border and customs
clearance checks at the same time, without having to move between the two) and training
programmes in customer service for officers dealing with travellers/visitors.
Measure 1.2. Improving transport accessibility of border crossings
Measure 1.2. should aim to develop the transport infrastructure leading to the border
crossings. In particular, it should include activities involving the construction and
modernisation of those elements of the transport network that are of crucial importance for
reducing the time needed to reach the border, increasing border crossing capacity,
eliminating the so-called ‘bottlenecks’ and repairing the road sections with inferior technical
standard and those which are not accommodated to handle specific types of traffic (such as
trucks). The aim here should be to ensure the complementarity between the measure in
question and Measure 1.1. In addition, this measure should be coordinated with the
development of the logistics functions in the eligible area, including the establishment of
multimodal reloading centres. Steps should be taken to ensure that the results of these
activities have a neutral or positive impact on the natural environment.
The following activities should in particular be pursued under the measure in question: 1)
construction and modernisation of transport infrastructure (road, rail, water), 2)
development of a multimodal transport system, 3) development and quality improvement of
the existing transport connections.
As part of the first type of initiatives, it is particularly important to prioritise the planned
projects in terms of their cross-border significance. Projects which should be given top
priority are those which can best improve the accessibility of the border crossings, given
their role for passenger and cargo traffic. As part of the second type of initiatives, it is
important to aim for the integration of the transport system using different modes of
transport. In particular, the increased role of rail and water transport should aim to reduce
the burden imposed on the road infrastructure and improve the border crossing capacity for
truck traffic. As part of the third type of projects, support should be given to activities
intended to develop and improve the existing transport connections, which could include
cooperation of carriers on both sides of the border, as well as the development of
information systems.

38
Measure 1.3. Development of good neighbourly relations and local initiatives
Measure 1.3 aims to build good neighbourly relations between the residents of the border
region. Projects implemented as part of this measure should allow residents from both sides
of the border to get to know one another. In the long run, such initiatives are bound to
produce better understanding between neighbours as well as build good and lasting
neighbourly relations. Establishing such people-to-people contacts will also create conducive
conditions for developing institutional collaboration, both within the Programme and
outside of it. Furthermore, the local initiatives in social sphere and health protection should
be supported within this measure including development and modernisation of
infrastructure and equipment purchases (e.g. ambulances). Such projects should be
implemented by local governments and other public bodies.
The measure in question should be implemented in the form of (a) project supporting local
initiatives and (b) a microprojects fund. Such an arrangement should allow to have the
procedures for project providers simplified to a minimum. The entities implementing such
microprojects should include in particular: NGOs, local governments, schools, culture
institutions, social welfare institutions, institutions operating in the field of sport and leisure,
as well as public institutions such as the police, border guard, fire service (incl. voluntary fire
brigades), etc.
Every such microproject should involve no fewer than two organisations on both sides of the
border. Additionally, residents from both sides of the border should be the final beneficiaries
of every microproject.
The following types of projects should be among the activities pursued as part of these
microprojects:
• Joint culture events (workshops, festivals, exhibitions, plein-airs, concerts,
conferences, cultural heritage protection, etc.);
• Joint sports and recreation events (sports events, training camps, trainings, sports
camps, etc.);
• Joint educational events (school exchanges for children and youth, joint camps, incl.
camps popularising the neighbour’s culture and language, etc.);
• Joint events tackling social problems (joint initiatives for groups threatened with
social exclusion, particularly children and youth, comprising various forms of
activities listed above);
• Joint events to promote entrepreneurship (fairs, conferences, business missions,
meetings of businesspeople, etc.);
• Joint events to promote cooperation between NGOs (exchange of good practices,
internships for employees and members of organisations, joint training programmes,
incl. language learning);

39
• Joint events to promote cooperation between local governments and their agencies
(exchange of good practices, internships for employees and members of
organisations, joint training programmes, incl. language learning);
• Cooperation of institutions and services (exchange of good practices, internships for
employees and members of organisations, joint training programmes, incl. language
learning).
In the framework of the measure, both new initiatives as well as recurring initiatives or next
editions of microprojects should be possible for implementation.
PRIORITY 2: Improving innovativeness of the economy in the border region
In contemporary economy, the ability to develop and adapt innovations plays a crucial role
in development processes. Therefore, one of the Programme’s priorities should be designed
so as to enhance such abilities, otherwise it will be difficult to expect as the eligible areas are
economically peripheral in relation to the respective national growth areas. It should also be
noted that the potential for the development of cross-border economic interactions
associated with trade exchange and with innovations should be regarded as high.
In particular, activities aimed to enhance the quality of human capital should be supported
as it is the key development factor in contemporary economy. Secondly, conditions fostering
development of the research cooperation should be created. This should entail increasing of
the quality of instruction and education system, as well as improving the conditions for
research and development activities, thus providing opportunities for transferring
innovations to business sector.
Measure 2.1. Improving the quality of human capital
As part of Measure 2.1, projects which aim to promote an all-out improvement of human
capital will be supported. The measure in question should ultimately strengthen the
development potential of the eligible area while concurrently reinforcing cross-border
cooperation between institutions and individuals alike. Activities to be supported include
educational projects, both in the sphere of formal education and lifelong learning. The
following types of projects will be implemented in particular:
• Generic, vocational and specialised training, incl. language courses and IT courses,
aimed to improve vocational qualifications of people in work and the unemployed;
• Bilingual classes at schools;
• Writing joint textbooks and curricula, also as part of e-learning;
• Specialised training programmes for teachers and trainers;
• Upgrading of school infrastructure (enlargement, repairs, purchase of teaching aids
and equipment, including audio-visual aids and computers),
• Universities of the Third Age,
• Training for the economically inactive (elderly people, people with disabilities), aimed
to improve their quality of life and mobilisation.

40
Measure 2.2. Cooperation of higher education and research institutions
Projects implemented under Measure 2.2 will aim to establish and develop cross-border
cooperation between higher education and research institutions. Such initiatives can cover
two areas (and the supported projects may involve one area or more). Their implementation
should help improve the quality and attractiveness of education and educational offer, in
addition to enhancing the quality and intensity of R&D activities in the cross-border area. An
additional result of the measure’s implementation will be reinforcement of the existing
institutional cooperation and establishing new collaboration contacts.
Two types of projects will be implemented under the measure at hand. First, these will be
projects concerning cooperation relating to higher education, involving in particular: student
exchanges, jointly organised summer schools, short crash courses and workshops (with the
participation of students from both sides of the border). Second, R&D projects will be
supported; they should assume active participation of researchers from both sides of the
border (minimum two institutions from the eligible area and from both sides of the border).
Such projects should be selected in an open call for proposals, with the research quality of
the proposed projects being the main evaluation criterion. The selection should be made on
the basis of at least three blind reviews prepared by active researchers specialising in a given
field (preferably, researchers from outside the eligible area should also be in the pool of
reviewers). In principle, the implementation of research projects should be restricted to
institutions operating in the eligible area. However, in situations justified by the
implementation of the project outputs, participation of institutions from beyond the eligible
area in the project consortium should be encouraged.
Infrastructure development projects and purchase of equipment should be allowed In the
framework of the measure infrastructure if it is necessary for the effective implementation
of the project.
PRIORITY 3: Improving the quality of life in the border areas
As a rule, peripheral border areas are characterised by a low quality of life of their residents,
in a number of aspects, ranging from difficult material conditions and worse access to the
labour market, to insufficient provision of social infrastructure to the poor quality of the
natural environment. The scale of these problems goes beyond the financial capacity of the
CBC Programme and calls for a national-level intervention. Nonetheless, one of the
components making up the quality of life has a clear cross-border character, being
associated with the existence of ecosystems that need shared protection. Therefore, the
Programme should focus on this particular component, leaving the remaining ones to be
addressed by the national governments. At the same time, it should be pointed out that
some of these components which are important for the local communities can be improved
as part of Measure 1.3.

41
Measure 3.1. Solving cross-border environmental problems
Measure 3.1. stipulates the protection and improvement of the quality of the natural
environment. The condition of the natural environment is a significant aspect bearing on the
quality of life of the residents. The unique environmental assets of the region in question
offer good conditions for pursuing sustainable development activities. To achieve this,
infrastructure investments promoting environmental protection and support offered to
cross-border cooperation in this sphere are of crucial importance.
The following initiatives should be undertaken in particular under the measure in question:
1) development of the infrastructure for water treatment and waste management,
preventing and reducing cross-border pollution, 2) coherent monitoring of the
environmental conditions and potential threats, and coordination of the early warning
system and counteracting crisis situations relating to environmental protection and natural
calamities, 3) cross-border cooperation to protect valuable ecosystems and threatened
animal species, 4) promoting energy conservation and broader use of renewable energy
sources, reducing air pollution, 5) reclamation of polluted areas and areas posing a threat of
environmental accidents, 6) raising ecological awareness, with a special emphasis on cross-
border environmental protection issues.
The first proposed activity involves investments in the construction and modernisation of
the existing waste treatment plants (use of efficient waste treatment technologies,
increasing capacity) and aims to enhance the quality of water in the border region, especially
in the Bug drainage basin. Another element of this activity is improving the condition of
waste management, e.g. by promoting efficient waste recycling and recovery, and upgrading
the safety standards in the existing landfills. The second proposed activity stipulates the
establishment of a coherent monitoring system based on the existing or planned national
systems of information on environmental conditions and potential threats (environmental
accidents, natural calamities). This involves preparing the relevant services for ensuring a
coordinated response to the notified threats, relating e.g. to flood warning, protection of
forests against fire, controlling the quality of water in the border rivers and water bodies. A
coherent system of environmental information will also allow making informed evaluation of
the spatial disparities and examining the pace of changes in the quality of the environment.
The third activity involves the development and implementation of coherent plans for the
protection of valuable cross-border ecosystems, identifying and addressing the main threats
(such as human pressure, dissimilar protection statuses of habitats/species on both sides of
the border). The fourth activity stipulates promotion of energy conservation through
modernisation of buildings and transmission networks, and popularising good practices and
models of action. Support should also be granted to the development of small-scale
renewable energy sources and to other initiatives facilitating reduction of air pollution. The
fifth activity involves reclamation of areas posing a threat of environmental accidents,
especially hazardous waste landfills and post-industrial and post-military sites. The final
activity is the implementation of ‘soft’ projects to raise ecological awareness of residents,
42
primarily in relation to cross-border environmental issues, unique environmental value of
the region and environment-friendly patterns of behaviour.
5.2.2 Indicative allocation for the Poland-Belarus-Ukraine CBC Programme
The concentration of the funds is necessary to achieve the critical mass effect, which in turn
is necessary to produce a tangible and lasting change of the situation in a given sphere.
Therefore, we propose to concentrate Programme allocation both at the level of priorities
and measures identified within the priorities. We propose to earmark 60% of the total
allocation to Priority 1, Supporting socio-economic integration of the border areas, as it is
crucial for the achievement of the strategic objective of the Programme, 20% to Priority 2,
Improving innovativeness of the economy in the border region and the three measures
planned for this priority, and 20% to Priority 3 and measures associated with resolving cross-
border environmental issues.
In light of the completed diagnosis, the key problem obstructing cross-border cooperation is
the barrier in the form of the state border that is at the same time an external border of the
European Union. Therefore, we propose to earmark 20% of the total allocation to Measure
1.1. Construction and streamlining of the operation of border crossings, and 15% to the
supplementary Measure 1.2 Improving transport accessibility of border crossings. To a large
extent, this reflects the scale of the problems associated with difficulties in crossing the
border (in many cases, long and unpredictable waiting times), with a relatively stable and
short time needed to get to the border crossing. Another important group of activities
should focus on people-to-people initiatives and local initiatives, which should promote the
development of good neighbourly relations. We propose to allocate 25% of the budget to
this particular measure. This is especially important in view of the still existing cultural
barriers that obstruct the development of cross-border cooperation.
As part of Priority 2, Improving innovativeness of the economy in the border region, the bulk
of the funds should be allocated to measures intended to improve the quality of human
capital as it offers the greatest potential for increasing innovation of the regional economy in
the long term – that is why we propose a 10% allocation. The transfer of know-how and
solutions between higher education and research institutions and the enterprise sector is
also regarded as significant (10%)..
The measures undertaken as part of the last priority Improving the quality of life in the
border areas should focus on finding solutions to environmental protection issues (20%),
whereas other components responsible for the quality of life should be funded from other
sources.
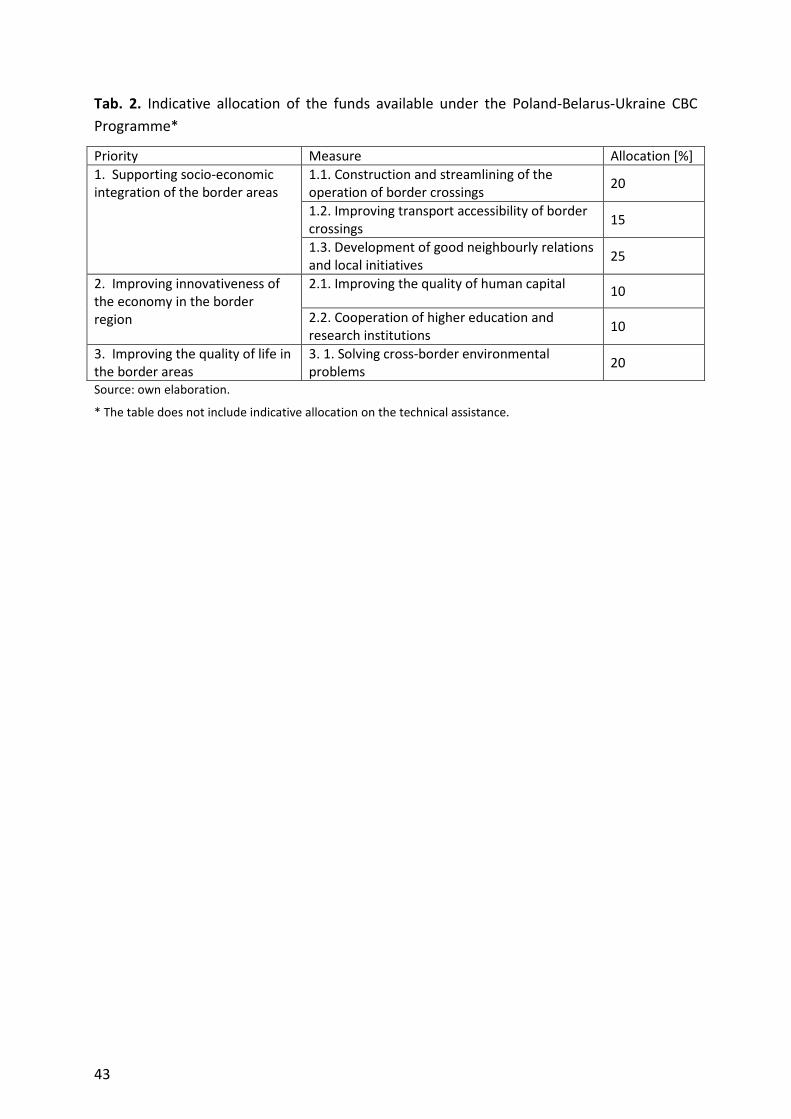
43
Tab. 2. Indicative allocation of the funds available under the Poland-Belarus-Ukraine CBC
Programme*
Priority Measure Allocation [%]
1. Supporting socio-economic integration of the border areas
1.1. Construction and streamlining of the operation of border crossings
20
1.2. Improving transport accessibility of border crossings
15
1.3. Development of good neighbourly relations and local initiatives
25
2. Improving innovativeness of the economy in the border region
2.1. Improving the quality of human capital 10
2.2. Cooperation of higher education and research institutions
10
3. Improving the quality of life in the border areas
3. 1. Solving cross-border environmental problems
20
Source: own elaboration.
* The table does not include indicative allocation on the technical assistance.

44
5.2.3 Monitoring indicators for the Poland-Belarus-Ukraine CBC Programme
Tab. 3. Monitoring indicators proposed for the Poland-Belarus-Ukraine CBC Programme
Measures Product outputs Result indicators
Name Base rate Name Base rate
PRIORITY 1. Supporting socio-economic integration of the border areas
1.1. Construction and streamlining of the operation of border crossings
Number of border crossings handling pedestrian and bicycle traffic
2 Number of / percentage of persons crossing the border by bike or on foot
PL-BY-UA: 7%*
Number of border crossings allowing for accelerated border checks of travellers
0 Capacity of border crossing points
PL-UA: 44/36 (2010)
Number of new border crossings opened 0 Average waiting time to cross the border in passenger traffic [min]
Data is collected daily by the Border Guard
[two measurements]. Methodology of this
indicator needs to be determined – in order
to achieve this, a strategic project
“Assessment of Poland-Belarus-Ukraine
borderland” has been proposed.
Number of border crossings with a consistent signage and visual identification system created
0 Average waiting time to cross the border in cargo traffic [min]
Data is collected daily by the Border Guard
[two measurements]. Methodology of this
indicator needs to be determined – in order
to achieve this, a strategic project
“Assessment of Poland-Belarus-Ukraine
borderland” has been proposed.
Number of border crossings with accompanying infrastructure created
0
1.2. Improving transport accessibility of border crossings
Length of new roads [km] 0 Travel time from main cities to the nearest border crossing points [min]
It is necessary to establish a list of cities
included in the measurement and to
determine the methodology (direct
assessment or estimations). In order to
achieve these, a strategic project
“Assessment of Poland-Belarus-Ukraine
borderland” has been proposed.
Length of modernised roads [km] 0
Length of new rail tracks [km] 0
Length of modernised rail tracks [km] 0
Number of completed water transport infrastructure projects
0
1.3. Development of good
Number of completed microprojects 0 Percentage of people with a positive attitude to the neighbours from the other
This indicator is currently non available and
thus requires further empirical research. In
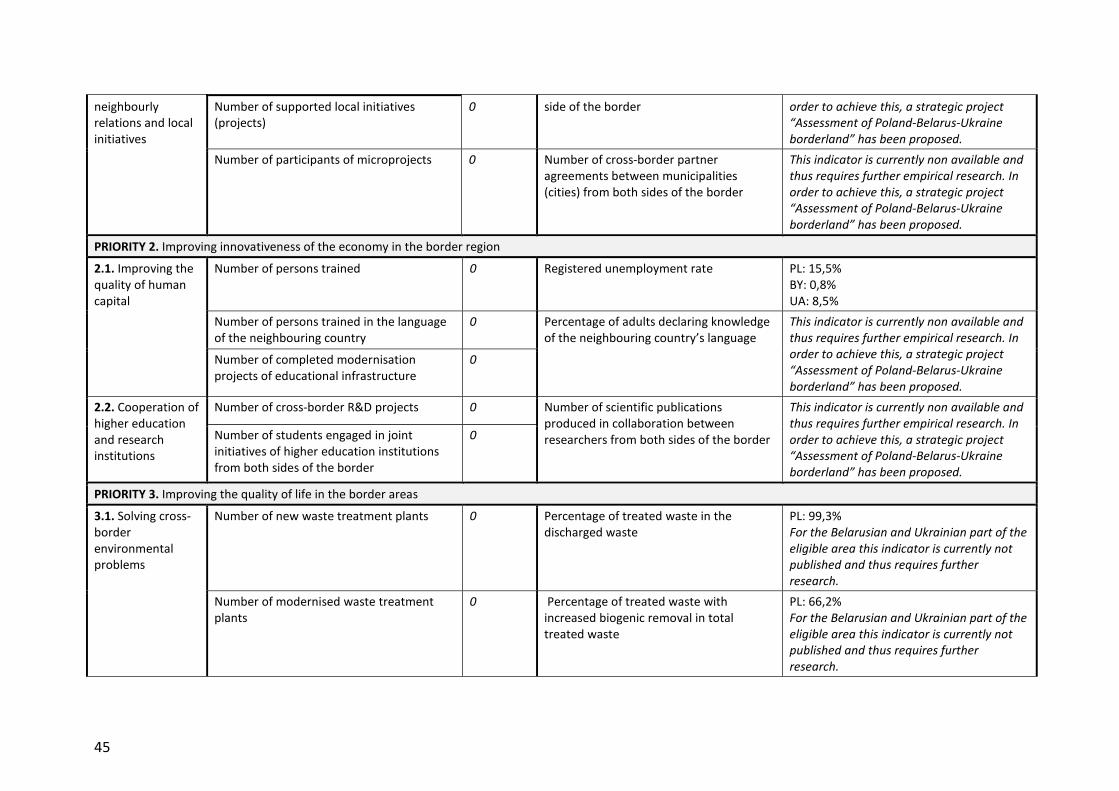
45
neighbourly relations and local initiatives
Number of supported local initiatives (projects)
0 side of the border order to achieve this, a strategic project
“Assessment of Poland-Belarus-Ukraine
borderland” has been proposed.
Number of participants of microprojects 0 Number of cross-border partner agreements between municipalities (cities) from both sides of the border
This indicator is currently non available and
thus requires further empirical research. In
order to achieve this, a strategic project
“Assessment of Poland-Belarus-Ukraine
borderland” has been proposed.
PRIORITY 2. Improving innovativeness of the economy in the border region
2.1. Improving the quality of human capital
Number of persons trained 0 Registered unemployment rate PL: 15,5% BY: 0,8% UA: 8,5%
Number of persons trained in the language of the neighbouring country
0 Percentage of adults declaring knowledge of the neighbouring country’s language
This indicator is currently non available and
thus requires further empirical research. In
order to achieve this, a strategic project
“Assessment of Poland-Belarus-Ukraine
borderland” has been proposed.
Number of completed modernisation projects of educational infrastructure
0
2.2. Cooperation of higher education and research institutions
Number of cross-border R&D projects 0 Number of scientific publications produced in collaboration between researchers from both sides of the border
This indicator is currently non available and
thus requires further empirical research. In
order to achieve this, a strategic project
“Assessment of Poland-Belarus-Ukraine
borderland” has been proposed.
Number of students engaged in joint initiatives of higher education institutions from both sides of the border
0
PRIORITY 3. Improving the quality of life in the border areas
3.1. Solving cross-border environmental problems
Number of new waste treatment plants 0 Percentage of treated waste in the discharged waste
PL: 99,3% For the Belarusian and Ukrainian part of the
eligible area this indicator is currently not
published and thus requires further
research.
Number of modernised waste treatment plants
0 Percentage of treated waste with increased biogenic removal in total treated waste
PL: 66,2% For the Belarusian and Ukrainian part of the
eligible area this indicator is currently not
published and thus requires further
research.

46
Number of units of rescue and monitoring services covered by support from the programme
0 Share of waste discharged in landfills in total collected waste
PL: 72,8% [data for NUTS-2 level] This indicator is due to be modified, along
with the expected changes in data
availability, linked to recent changes in
waste management regulations in Poland.
For the Belarusian and Ukrainian part of the
eligible area this indicator is currently not
published and thus requires further
research.
Surface of areas covered by cross-border environmental protection schemes
0 Number of gauging points in the system monitoring the condition of the environment
This indicator will be calculated basing on
data collected by Regional Environment
Protection Inspectorates.
Number of buildings that underwent thermomodernisation
0 Share of renewable energy in total energy generation
PL: 14,6% [data for NUTS-2 level] For the Belarusian and Ukrainian part of the
eligible area this indicator is currently not
published and thus requires further
research.
Surface of environmentally hazardous areas reclaimed
0
Number of participants in activities aimed to raise ecological awareness
0
* Estimation based on the assumption that 40% of all border crossings in Medyka are pedestrian crossings.

47
5.2.4 Compliance of the Programme with other programmes and strategies
The Poland-Belarus-Ukraine Cross-border Cooperation Programme 2014-2020, organised as
part of the European Neighbourhood Instrument (ENI), is intended to continue cooperation
in the border region, which was earlier developed under the Poland–Belarus–Ukraine
Neighbourhood Programme, as part of the European Neighbourhood and Partnership
Instrument (ENPI) 2007-2013.
The main objective of the Programme and its priorities comply with the European
Neighbourhood and Partnership Instrument Cross-Border Cooperation Strategy Paper 2014-
2020, which sets the following goals:
• To promote economic and social development in regions on both sides of common
borders;
• To address common challenges, in fields such as environment, public health and the
prevention of and fight against crime;
• To promote better conditions and modalities for ensuring the mobility of persons,
goods and capital.
• The promotion of local cross-border ‘people-to-people’ actions will remain an
important element to be deployed in support of any or all of these objectives.
In particular, it should be pointed out that the Programme places an emphasis on enhancing
integration in the cross-border region while striving to improve innovativeness of the
regional economy and address the common environmental problems, the natural
environment being one of the components responsible for the quality of life. The measures
proposed as part of the first Programme priority also aim to develop people-to-people
contacts, which should foster the development of good neighbourly relations.
As part of the measures in question, there is a far-reaching consistency of the proposed
arrangements and solutions with the EUROPE 2020 Strategy, particularly those aimed to
improve innovativeness of the economy, including the development of human capital and
environmental protection in the border areas.
The Programme is consistent with the External Border Fund, aimed to improve the control
and management of the flows of persons at the external borders of the EU. In particular, the
Programme should complement actions undertaken as part of the Fund by efforts aimed to
streamline and facilitate the crossing of the external border, also in terms of convenience.
The priorities laid down in the ENPI agree with the development priorities for Poland,
Belarus and Ukraine, as defined in the respective fundamental programme documents
adopted by the governments of the three countries. These are:
• Poland: Long Term Development Strategy. Poland 2030 – the Third Wave of
Modernity; Medium Term Development Strategy 2020; National Regional
Development Strategy 2010-2020: Regions, Cities, Rural Areas; National Spatial
Development Concept 2030

48
• Belarus: National Strategy for the Sustainable Socio-economic Development of the
Republic of Belarus Until 2020; Socio-economic Development Programme of the
Republic of Belarus for the Period 2011-2015.
• Ukraine: Programme for Economic Reforms 2010-2014: Social Development,
Competitive Economy, Efficient State; National Regional Development Strategy of
Ukraine for the Years 2004-2015.
In particular, it should be noted that the strategic framework of the above documents is
created by:
• Improving the competitiveness and innovativeness of the economy
• Measures to protect and effectively manage the natural environment
• Shaping the settlement system, which should help balance the development
processes spatially (e.g. by supporting diffusion processes, improving the accessibility
of services).
All these components are also addressed directly (the first two – by PRIORITIES 2 and 3) or
indirectly (the last – by PRIORITY 1) by the Poland-Belarus-Ukraine CBC Programme.
The Programme also takes into account the objectives set by regional and macroregional
development strategies. In the context of cross-border cooperation the documents address
on the one hand necessity to increase functional, spatial, social and cultural integration that
should reduce negative impact of border location. On the other hand they stress to different
extent the role of transport accessibility (including transit one), development of cultural ties,
tourism promotion and solving of common environmental problems as well as institutional
cooperation. The Programme PL-BY-UA fully address these objectives, in particular it
expands and deepen them by the development of component of cross-border integration
(PRIORITY 1), which could be an important step in overcoming the peripherality of the
border areas and solving the problems that they share, including the economic, social and
environmental sphere (PRIORITY 2 and PRIORITY 3). It also allows for the development of
institutional cooperation, which should help foster the exchange of experiences and the
transfer of good practices.
The Programme does not have a sufficiently large budget to be able to solve all problems
associated with laying the foundations for the development of the PL-BY-UA eligible area.
Therefore, it aims to provide assistance in addressing such problems in keeping with other,
broader programmes and strategies implemented in the eligible area. With this objection,
the Programme is fully compliant with other measures planned to be delivered in the eligible
area by the European Union and the cooperating States. The alignment of activities with the
operational programmes will be a task to be fulfilled by the managing institutions, which
should not be a source of any serious problems, considering the compatibility of the
strategic objectives.

49
5.2.5 Programme and thematic objectives of the cohesion policy
The objectives and measures proposed for implementation under the Poland-Belarus-
Ukraine and Poland-Russia Programmes largely follow the thematic objectives of the
cohesion policy for the years 2014-2020. The table below shows the relationships between
the priorities and objectives proposed for the Programmes and the thematic objectives of
the cohesion policy.
Tab. 4. Programme priorities and measures and the corresponding thematic objectives of
cohesion policy
Priority Measure Thematic objective of cohesion policy
1. Supporting socio-economic integration of the border areas
1.1. Construction and streamlining of the operation of border crossings
11. enhancing institutional capacity and an efficient public administration
1.2. Improving transport accessibility of border crossings
7. promoting sustainable transport and removing bottlenecks in key network infrastructures
1.3. Development of good neighbourly relations and local initiatives
9. promoting social inclusion and combating poverty 10. investing in education, skills and lifelong learning 11. enhancing institutional capacity and an efficient public administration
2. Improving innovativeness of the economy in the border region
2.1. Improving the quality of human capital
8. promoting employment and supporting labour mobility 9. promoting social inclusion and combating poverty 10. investing in education, skills and lifelong learning
2.2. Cooperation of higher education and research institutions
1. strengthening research, technological development and innovation 10. investing in education, skills and lifelong learning
3. Improving the quality of life in the border areas
3. 1. Solving cross-border environmental problems
6. protecting the environment and promoting resource efficiency
Source: own elaboration.
This list is general in nature and does not necessarily mean that the given measures and
thematic objectives fully overlap. Nevertheless, it can be clearly seen that the measures
proposed for the Programmes broadly tie in with 8 out of 11 thematic objectives of the
cohesion policy. This should be viewed as positive since the thematic goals are well justified
and established in the EU strategic documents. This can also largely be said about the
priorities and measures laid down for the proposed Programmes. The main discrepancies in
relation to the thematic goals are due to the specific nature of cross-border programmes at
the external EU border. In particular, this relates to the specific slant of the Programmes
towards cooperation and development of good neighbourly relations as well as streamlining
the border traffic.

50
5.2.6 Programme and thematic objectives of the European Neighborhood
Policy
Tab 5. Programme priorities and measures and the corresponding objectives of the Cross-
Border Cooperation in the European Neighborhood Policy
Priority Measure Goal of the Cross-Border Cooperation,
European Neighborhood Policy
1. Supporting socio-economic integration of the border areas Corresponds with: STRATEGIC OBJECTIVE C. Promote better conditions and modalities for facilitating the mobility of persons, goods and capital
1.1. Construction and streamlining of the operation of border crossings
10. Promotion of border management, and border security (Strategic objective: C)
1.2. Improving transport accessibility of border crossings
7. Improvement of accessibility to the regions, development of transport and communication networks and systems (Strategic objective: C)
1.3. Development of good neighbourly relations and local initiatives
Horizontal goal
2. Improving innovativeness of the economy in the border region Corresponds with: STRATEGIC OBJECTIVE A. Promote economic and social development in regions on both sides of common borders
2.1. Improving the quality of human capital
2. Support to education, research, technological development and innovation (Strategic objective: A)
2.2. Cooperation of higher education and research institutions
2. Support to education, research, technological development and innovation (Strategic objective: A)
3. Improving the quality of life in the border areas Corresponds with: STRATEGIC OBJECTIVE B. Address common challenges in environment, public health, safety and security
3. 1. Solving cross-border environmental problems
6. Environmental protection, climate change adaptation and disasters prevention/management (Strategic objective: B)
Source: own elaboration.
5.2.7 Thematic concentration in the Programmes
In order to ensure the critical mass for the intervention to be made as part of the
Programmes, it is desirable to concentrate the financial outlays on several selected
measures. As part of the Programmes concerned, 80% of the total allocation has been
earmarked for four measures. Such an arrangement draws directly on the thematic
concentration principle which has been adopted for territorial cooperation programmes.
Such concentration on several selected measures is aimed to ensure effective and efficient
fulfilment of the adopted objectives and making a tangible change. The measures to which
the remaining portion of the funds have been allocated are by assumption complementary
in nature; they will serve as vehicles for the implementation of some initiatives only,
intended to solve specific problems or to establish cooperation in a specific sphere. The will
not, however, be the main activities to be undertaken in a given sphere in the eligible area.
For instance, the Programmes envisage the funding of research and development activities,

51
especially those which require, initiate or strengthen cooperation between R&D institutions
across the eligible area. Therefore, the scale of the relevant support to be offered under the
Programmes will be relatively small. Although the development of R&D activities should be
supported on a much larger scale, this should be done as part of other programmes, not
necessarily the CBC.
5.2.8 Issues requiring institutional cooperation on both sides of the border
There are four groups of issues identified as the major problems facing the cross-border
region, which require collaboration of partners from both sides of the border (these four
topics were quoted most frequently in the interviews held for the purposes of this expert’s
report). Firstly, cooperation is needed to solve natural environment problems; this is
particularly well visible in case of water protection (border rivers, the Vistula Lagoon).
Secondly, cooperation is crucial to ensure smooth functioning of the borders, especially for
the smooth and comfortable crossing of the border. Thirdly, cooperation of various types of
services (police, fire service, ambulance service, border guard, etc.) is necessary both in their
daily operation and in emergency situations such as natural calamities. Fourthly, national-
level cooperation is necessary in respect e.g. of visas or regulations governing cross-border
cooperation (e.g. between NGOs, local governments, etc.). The first three topics can, and
should, be covered by cross-border cooperation programmes, while the fourth reaches
beyond the Programme’s format, being the domain of foreign and internal policies of the
countries concerned. At the same time, it should be emphasised that the legislative
arrangements, in particular the regulations governing the crossing of the border (and visa
regulations in particular) can often be factors having a greater bearing on the intensity of
cross-border cooperation than activities undertaken as part of the Programmes in question.
5.2.9 The role of the Microprojects Fund
The lessons learnt from the former programme, both from the programming period which is
now coming to an end, and from the period 2004-2006, as well as the experiences gained at
the western border (Poland-Germany CBC Programme) clearly demonstrate that
microprojects are well-founded and desirable initiatives. They play an important role in
building good neighbourly relations between the residents of the border areas, provide
opportunities for getting to know the neighbours living on the other side of the border and
help enhance mutual understanding. In addition, microprojects can help establish lasting
contacts and lay the foundation for collaboration as part of larger-scale initiatives, also those
funded from other sources than CBC programmes. The respondents with whom the
interviews were conducted distinctly indicate that there is a need for implementing
microprojects also in the 2004-2020 financial perspective. This applies equally to the Poland-
Belarus-Ukraine CBC Programme (where microprojects have already been conducted). In
case of the latter, however, it should be noted than one of the respondents was against
implementing microprojects. In this context, we should mention difficulties in the operation
and development of NGOs (which should be major beneficiaries of microprojects) in the
Kaliningrad oblast and in Belarus. The restrictions on the activity of NGOs could cripple the

52
effectiveness of the Microprojects Fund. Nevertheless, it does not necessarily have to be the
case, if other organisations such as municipalities, schools, community centres, sports clubs,
etc., show more initiative in their implementation.
5.2.10 Strategic projects in the Programmes
The respondents interviewed for the purposes of this study as a rule did not suggest any
specific strategic projects but only indicated areas in which such projects should be
implemented. The most frequently listed areas were the following: environmental
protection infrastructure, efficient operation of the border crossings (and construction of
new ones), development of cross-border tourism. Areas mentioned by some of the
respondents included: medical rescue, road infrastructure, development of enterprises.
Based on such generalised indications, it is difficult to argue that there exists a distinct need
and readiness on the part of the potential beneficiaries to implement strategic projects.
Nevertheless, we propose the following strategic projects for consideration:
• Construction of a pedestrian and bicycle bridge and a border crossing point on the
Bug river, between Terespol and Brest;
• Diagnosis of Poland-Belarus-Ukraine cross-border area.
Construction of a pedestrian and bicycle bridge and a border crossing point on the Bug
river, between Terespol and Brest
The construction of pedestrian border crossing point in Terespol/Brest and bridge over Bug
within Measure 1.1. and Measure 1.2. should allow to reach Brest Fortress by visitors. The
project has synergic effect as support the activities to reconstruct XIX century fortress. The
bridge that would link Terespol’s Gate and Border Island currently not accessible to visitors is
important element of fortress revitalisation. The partners of the project should be: Terespol
City Hall, Brzesc City Hall, Voivodship Office in Lublin, State Customs Committee of the
Republic of Belarus. The estimated cost of the project is 10-15 million EUR.
Assessment of Poland-Belarus-Ukraine borderland
It is proposed to implement as part of the programme a research project pertaining to cross-
border cooperation and attitudes towards neighbours on Poland-Ukraine-Belarus
borderland. The Poland-Ukraine-Belarus borderland is covered by quite numerous studies,
but they are based almost entirely on the generally available data from public statistics and
other secondary data. Missing, however, are projects collecting primary data, in particular
from public opinion studies of the whole cross-border area. Moreover, data from public
statistics of the three countries (Poland, Belarus, and Ukraine) are frequently difficult to
compare or even incomparable due to differing methodology, and thus it is necessary to
prepare methods allowing for adequate comparability.
The project should include mostly implementation of qualitative studies (with large sample,
allowing for analysis in various spatial, thematic, social, and other sections) throughout the
whole cross-border area, repeated every year or every two years. Moreover, as part of the

53
project conducted should be analyses of secondary data, as well as qualitative studies (field
studies, interviews) directed towards in-depth analysis of specific issues. The project should
have long implementation deadline (in order to allow for cyclical studies), e.g. 7 years.
The results of the project will have practical implications, providing materials for monitoring
programme (detailed analysis of the area, programme’s context, and even direct supply of
indices for monitoring programme's progress). The results of the projects should be
published in participants’ languages and in English. The project should involve regular
conferences.
Entities executing the project should be a consortium of scientific entities from all parts of
the support area, as well as entities from outside of the support area, but with significant
experience in cross-border research. The project partners could become, for example: Maria
Curie-Skłodowska University in Lublin, Lviv University, and Belarusian State University in
Minsk.
Approximate project’s budget: 2.2 m euro.
54
5.2.11 Examples of best practices in cross-border projects
In this part of the report examples of best practices from European Territorial Cooperation
are presented. The examples are organized according to three priorities proposed for the PL-
BY-UA Programme.
Priority 1. Supporting socio-economic integration of the border areas
Name of the Project
Development of the Traffic Lanes in the International Border Crossing Point Niirala
Programme
Cross-border cooperation programme: Finland (Karelia) – Russia 2007-2013.
Partners
Finnish Customs, Finland; The Finnish Border Guard, North Karelia Border Guard District,
Finland; Ministry of Construction of the Republic of Karelia, Russia.
Description of the Project
The project aimed at improving the throughput of Niirala border crossing point at the
Finnish-Russian border. Improvement in quality and speed of crossing the border was
supposed to translate into increased cross-border cooperation in many areas (social,
economic, etc.). The project involved creation of a plan for modernization of border crossing
point, which was later implemented. Its most important part was creation of new lanes and
equipment necessary for performing border inspection.
More details
http://www.kareliaenpi.eu/en/themes/lsp-projektit/projects/279

55
Name of the Project
Together against cross-border crime (Im Tandem gegen die Grenzkriminalität)
Programme
Cross-border cooperation programme: Poland (Lubuskie Province) – Brandenburg 2007-
2013.
Partners
Brandenburg State Police Headquarters, Provincial Police Headquarters in Gorzów
Wielkopolski, Provincial Police Headquarters in Szczecin.
Description of the Project
The project aims at establishing, facilitating, and strengthening cooperation between Polish
and German police in the cross-border region. It constitutes only one of more elements
supporting cooperation, taking place independently of it (on general principles, financed
from national funds) The project is thus supposed to support cooperation (its budget is
relatively small: 45 thousand euro for the period of 2012-2014). The most important
measures within the project are training courses for Polish and German policemen. The
training courses involve teaching Polish and German (basic level, improvement of existing
language skills), as well as professional issues specific for the police, such as the law of the
neighbouring country, procedures, etc. The training courses are supposed to facilitate work
of the policemen that requires them to contact people from the neighbouring country as
part of their duties. Cooperation of Polish and German police forces also consists in joint
Polish and German patrols, i.e. involving at least one Polish and one German policeman.
Such patrols operate e.g. during events attracting many people from both sides of the
border, such as e.g. Przystanek Woodstock in Kostrzyn.
More details
http://www.internetwache.brandenburg.de/sixcms/detail.php/10938128

56
Name of the Project
Baltic active education network for development of people-to-people interactions –
EDUpeople.
Programme
South Baltic Cross-border Co-operation Programme 2007 – 2013
Partners
EXPERYMENT Science Centre (Gdynia); eXperimentLabbet (Kalmaru)
Description of the Project
The project aimed at promoting cooperation between scientific centres and increasing the
scope of educational activities using modern methods and approach (experiments,
participation). The project allowed for increasing the offer of attractive forms of science
education. This suits well the developmental attempts to increase people’s knowledge and
competences in this respect, which in the long run should translate into innovativeness and
quality of life. The main measures within this project were: two seminars pertaining to active
education; six trainings courses for teachers on methods and form of active education;
cyclical "festival of experiments". Moreover, prepared were portable sets of educational
tools allowing for conducting experiments in physics and optics (the sets are used by schools
in the region). Cross-border cooperation within the project allowed for sharing knowledge
and experiences, which resulted in better quality and efficiency of activities undertaken
within the project.
More details
http://en.southbaltic.eu/db/index.php?p=6&id_db=4&id_record_=80

57
Name of the Project
European Good Neighbourhood Days: Zbereże-Adamczuki
Programme
Cross-Border Cooperation Programme: Poland-Belarus-Ukraine 2007-2013
Partners
Fundacja Kultury Duchowej Pogranicza [Foundation for Spiritual Culture of the Borderland]
and various local governments
Description of the Project
The project is cyclical; in 2013 it had its 10th edition. Crucial for the event is the fact that it
takes place on both sides of the border, usually in a place with no regularly active border
crossing point. In 2013 between Poland and Ukraine, near Zbereże (Włodawa County,
Poland) and Adamczuki (Shatsk Raion, Ukraine), on the Bug River, constructed was a
pontoon bridge on Bug and a temporary border crossing point for pedestrian and bicycle
traffic was established. During seven days border was crossed almost 36 thousand times at
that location. Reasons for crossing the border were connected with the event, which
included numerous attractions: cultural and recreational, of sporting and tourist nature.
Organized was also a conference entitled “Our Polesia, Our Bug River” and Poleskie Forum
Ekonomiczne (Polesia Economic Forum). Thematically, the project is quite typical soft
measure financed from microprojects fund. What makes it unique and worth particular
attention is opening of the border in a place where it is usually closed, and the fact that
many events take place directly near the border, on both sides of it. This gives participants of
the project many opportunities for making direct contacts with neighbours from the other
side of the border.
More details
http://fkdp.pl/europejskie-dni-dobrosasiedztwa-otwieraja-granice.html#more-3049

58
Name of the Project
Cross-Border Cooking: Gorzów Wielkopolski – Frankfurt (Oder). Educational cooperation
between Poland and Germany on common market of tourist services
Programme
Cross-Border Cooperation Programme: Poland (Lubuskie Province) – Brandenburg 2007-
2013.
Partners
City of Gorzów Wielkopolski (Febronia Gajewska-Karamać’s Catering Schools Complex in
Gorzów Wielkopolski); Construction Industry Educational Centre from Frankfurt (Oder)
Description of the Project
The project aimed at increasing the quality of vocational education in catering. Good
vocational education is an important factor for finding jobs by young people. From the point
of view of the region it is important that increasing the quality of cook’s education translates
into improvement of catering services, which in turn has good influence on the tourist-
related potential of the region. As part of the project created was a Polish-German
Educational Centre in Gorzów Wielkopolski, consisting of modernly equipped catering
workshops and client service workshops (staged modern restaurant room). Thanks to these
teaching aids education of young students of culinary art takes place in conditions
significantly similar to their future workplace. Moreover, the project involved study visits to
the region, which allowed for learning about regional products. Prepared and published was
also a book entitled “Menu along the Oder. A culinary and tourist guide to Brandengurg and
Lubusz Land”, including recipes for regional dishes from both Poland and German part of the
cross-border area.
More details
http://przepisnadobraszkola.edupage.org/

59
Priority 2: Improving innovativeness of the economy in the border region
Name of the Project
Creative learning environments – schools building competences to lead and learn in a rapidly
changing world – CreatLearn
Programme
South Baltic Cross-Border Co-Operation Programme 2007 – 2013.
Partners
Kalmar Municipality; Swedish National Touring Theatre Kalmar; Klaipeda District
Municipality Education Centre; Hanseatic City of Rostock; Bad Doberan County Council;
Municipality of Guldborgsund; Linnaeus University / School of Education, Psychology and
Sports Science.
Description of the Project
The project aims at developing, introducing in the pilot form, and evaluating new, creative
methods of teaching directed towards adjusting schools to quickly changing socio-economic
reality. An important aspect of the project is exchange of knowledge and good practices
between partners from various institutions and countries. The main actions within the
project include holding common cross-border conferences and workshops; training courses
for teachers on creative teaching methods, preparation of a couple of educational
programmes as part of the topic “Civil courage in South Baltic region societies”, preparation
of a publication pertaining to good practices in creative education. The project will result in
increased quality of teaching, not only in directly supported institutions, but also by creating
opportunities for expanding positive influence through dissemination measures.
More details
http://skolscenen-creatlearn.riksteatern.se/
60
Name of the Project
Integration and education of students, graduates and SME’s in terms of industrial design
management (DesignSHIP)
Programme
South Baltic Cross-Border Co-operation Programme 2007 – 2013.
Partners
Gdynia Innovation Centre; Association for Promotion of Hanseatic Institute for
Entrepreneurship and Regional Development at the University of Rostock; Wismar University
of Applied Sciences: Technology, Business and Design; Swedish Industrial Design Foundation.
Description of the Project
The project aims at economic development and education in industrial design. The main
activities within the project include comprehensive support for students and graduates. Each
year for three years an annual support will be offered to five groups of 6 people. Each group
will consist of students and graduates from various areas of knowledge (art, industrial
design, architecture, economy, management, business, law). During annual programme the
project group is supposed to complete a task, which requires preparation of a
comprehensive action plan including not only project-related issue, but also organizational,
financial and legal ones, etc. Participants of the project had the opportunity to develop their
competences and increase knowledge through participation in courses and study visits
designed specifically for them. The groups’ work on the tasks finishes with participation in
joint workshop at which the groups present the ideas and solutions they developed. The
presentations are assessed by industrial design management experts. Implementation of the
project also allows for cooperation and transfer of knowledge and good practices between
entities participating in it, which in the long run promotes greater professionalism and
quality of activities.
More details
http://balticdesignship.com/

61
Name of the Project
Øresund Materials Innovation Community
Programme
Oresund-Kattegat-Skagerrak Programme 2007 – 2013, Interreg IVA.
Partners
Øresund University; Lunds University; Københavns University; DTU; Roskilde University; ESS
Scandinavia; MAX Lab; Copenhagen Capacity; Invest in Skåne; Malmö Högskola.
Description of the Project
The project aimed at creating basis for coordinated development of new materials sectors in
the region. The region has many research institutions and businesses dealing with new
materials. The starting point for the project was thus the assumption that coordination of
activities can allow for creation of value added and strengthen the position of the region in
respect of new materials. The main activities within the project supported the sector and
included preparation of assumptions for creating system of education in new materials,
system for start-ups support, transfer of knowledge in technology parks, creating
atmosphere of cooperation and channels for communications between various actors.
Moreover, implemented were promotional activities aimed at building the brand of the
region's new materials sector. An important element of the project was also planning and
coordination of the future joint initiatives implemented by the regional sector of new
materials, as well as other actors interested in development of the sector (e.g. regional and
local authorities). The Project is an example of activity aimed at increasing innovativeness in
the knowledge-intensive sector, mostly through stimulating cooperation and coordination of
activities.
More details
http://www.oresund.org/materials

62
Name of the Project
Wales Ireland Network for Scientific Skills – WINSS
Programme
Ireland Wales Programme 2007 – 2013, Interreg IVA.
Partners
Waterford Institute of Technology; School of Chemistry Bangor University.
Description of the Project
The project aims at strengthening competences of human capital in cross-border region in
respect of advanced research and development skills related to life sciences. Increase of
quality of human capital in this area strengthens the R&D and industrial sector existing in the
region. Within the project implemented are three main activities: (1) specialist courses and
training sessions for researchers active in life sciences (e.g. on advanced research methods);
(2) implementation of advanced innovative R&D projects in four areas: pharmaceuticals,
industrial biotransformation, medical instruments, sensors; (3) dissemination and
networking events providing opportunity for establishing contacts and cooperation between
various actors from both countries (enterprises, research institutions, public administration,
etc.).
More details
http://www.winss.org/index.php/ireland/home/

63
Name of the Project
Vocational education in cross-border region as a basis for entrepreneurship development
Programme
Lithuania Poland cross-border cooperation programme 2007-2013.
Partners
Giżycko County (Poland); Vocational Education Centre in Alytus (Lithuania).
Description of the Project
The project aimed at increasing developmental potential of the localities participating in it
through increasing the scope and quality of vocational education, increasing quality of
human capital, and developing entrepreneurship. The main activities within the project
included: modernization of County Centre for Practical Education in Giżycko and purchase of
new equipment; purchase of equipment for the Vocational Education Centre in Alytus; a
publication pertaining to entrepreneurship in Giżycko County and in the city of Alytus;
holding two business forums and two conferences pertaining to vocational education,
training sessions for employees on public procurement taking into account conditions in the
partner’s country, i.e. for employees of Polish enterprises on Lithuanian law and for
employees of Lithuanian enterprises on Polish law, apprenticeships for students of
vocational schools (80 students in total). Participation of partners from both countries in the
project allowed for exchange of experiences and good practices, which allowed for more
effective activities undertaken by both partners.
More details
http://wrota.warmia.mazury.pl/powiat_gizycki/Edukacja/Aktualnosci/Edukacja-zawodowa-
w-regionie-transgranicznym-podstawa-rozwoju-przedsiebiorczosci.html

64
Priority 3. Improving the quality of life in the border areas
Name of the Project
Set up of joint response system to chemical and oil spills into river West Dvina (Daugava) in
winter time.
Programme
Latvia-Lithuania-Belarus Programme 2007 – 2013, Interreg IVA.
Partners
Utena Country Fire and Rescue Board (Utena, Lithuania); Establishment "Vitebsk regional
department of the Ministry for Emergency Situations of Belarus" (Vitebsk, Belarus); State fire
rescue institution "Republican Special Response Team" of the Ministry for Emergency
Situations of the Republic of Belarus (Minsk, Belarus).
Description of the Project
The project aimed at creation of a system for mitigating effects of waste spills to Daugava
River, flowing through Belarus, Latvia, and then into Baltic through Riga. Near this river
located are industrial installations creating a threat of spill of substances dangerous for
environment. Cross-border character of the river results in the fact that any spill in Belarus
(the upper section of the river) necessitates activities in both countries (Belarus and Latvia).
In such situation the key factor is good information flow and coordination of activities.
Implementation of the project contributed to streamlining of these processes. The main
activities involved holding two specialist training courses for services responsible for fighting
effects of spills and large cross-border winter exercises simulating routines undertaken in the
case of serious spillage. Moreover, purchased was a specialist equipment used for fighting
spills and prepared were emergency plans for various types of spills.
More details
http://www.enpi-cbc.eu/go.php/eng/1VL_1117_project_LLB_1_057/754

65
Name of the Project
Know-How-Sharing in fields of waste separation
Programme
Slovak-Austrian cross-border cooperation programme 2007-2013, Interreg IVA.
Partners
Mesto Skalica; GAUM- Gemeindeverband für Aufgaben des Umweltschutzes im Bezirk.
Description of the Project
The project aimed at improving waste management in town of Skalica and its
neighbourhood. In particular the aim was to increase the scope of separation and recycling
of organic waste. In implementation of the project participated an Austrian partner, who
contributed experience and know-how to the project. The main activities undertaken within
this project were: purchase and installation of containers for organic waste, creation of a
modern compost bin and purchase of specialist tools for it, publicity activities on organic
waste management methods (including special activities aimed at catering enterprises). Also
analysed were various models of financing collecting and recycling of organic waste.

66
Name of the Project
Joint Master Degree Study Program on the Management of Renewable Energy Sources –
ARGOS
Programme
Black Sea Basin 2007-2013.
Partners
“Ovidius” University of Constanta, South-East, Romania; Taurida National University, Crimea,
Ukraine; Technical University of Moldova, Chisinau, Republic of Moldova; Technical
University of Varna, Varna, Bulgaria; Istanbul Technical University, Istanbul, Turkey.
Description of the Project
The project aimed at improving the quality of higher level education on renewable energy
sources. It included six universities from six Mediterranean countries. The project included
many soft measures. It began with creation of a map of methods and scopes of education on
renewable energy sources in countries covered by the project. This provided a basis for
preparation of a joint educational, MA-level programme (according to Bologna standards
these are second degree studies). The main activities directly involving students were
interactive webinars (each involving 60 people), as well as 10-day summer school. Moreover
the project allowed for developing cooperation between the universities participating in it
and their employees, not only on educational activities, but also regarding R&D. Particularly
positive and important aspect of the project was that it pertained, on the one hand, to an
important and promising area of knowledge and skills, and, on the other hand, provided an
opportunity for establishing cooperation, sharing experiences and good practices, as well as
for meeting each other and better understanding of representatives of different
nationalities.
More details
www.bsun.org/argos

67
Name of the Project
Business to Nature – Interregional Approach to SMEs and Entrepreneurship in Natural Areas
Programme
Interregional Cooperation Programme INTERREG IV C
Partners
Polska Agencja Rozwoju Turystyki SA w Warszawie [Polish Tourism Promotion Agency SA in
Warsaw]; Warmińsko-Mazurska Agencja Rozwoju Regionalnego [Warmia and Masuria
Agency of Regional Development] (Poland); Institute for Economic Development of Ourense
Province (Spain); Östergötland Region’s Office (Sweden); Perugia Province (Italy); Regional
Committee for Tourism Promotion in Auvergne (France); Powys County (Great Britain); Gran
Paradis Foundation (Italy); Association for Alto Tamega Region’s Development (Portugal);
Veliko Tarnovo Municipality (Bulgaria); Pivka Centre for Local Development (Slovenia).
Description of the Project
The project aimed at identification and dissemination of good practices supporting
development of entrepreneurship, taking into account high standards of environmental
protection applying to areas of environmental value. It thus pertained to two important
areas: environment protection and entrepreneurship promotion. Creation of good
conditions for economic development is a particularly significant challenge in the case of
areas subject to legal protection. Thus sharing international experiences becomes
particularly important in such case. The project involved identification and description of 40
good practices. The project partners had the opportunity to share knowledge and
experiences during project meetings, as well as to directly learn some good practices during
study visits. An important element of the project was preparation of recommendations for
measures undertaken in regions of the project’s partner institutions.
More details
www.business2nature.eu

68
Name of the Project
Support to sustainable development of Sortavala town for the improvement of
environmental situation
Programme
Cross-Border Cooperation Programme: Finland (Karelia) – Russia 2007-2013.
Partners
Autonomous non-profit organization “Energy Efficiency Centre”, Russia; Municipal Unitary
Utility (MUU) District Heating, Russia; Municipal Unitary Utility (MUU) Water Services
(Vodokanal), Russia; Municipal Unitary Utility (MUU) Clean City, Russia; Keypro Oy, Finland;
Poyry Finland Oy, Finland; Ecofoster Group Oy, Finland.
Description of the Project
The project aimed at improvement of natural environment's quality in Russian town of
Sortavala. The project involved a number of soft measures. Most importantly it began with
assessment and identification of the most important problems and challenges. The project
relied greatly on experiences of the Finnish partners, who had significant experience in
addressing similar problems and challenges. Cooperation involved joint seminars, study
visits, as well as constant participation of Finnish experts in the project. A tangible effect of
the project was preparation of feasibility studies for infrastructure for water treatment,
sewage treatment, waste management, and heating. Prepared was also a technical
documentation package. Moreover, identified and described were examples of good
practices of public-private partnership regarding environmental issues. The project had a
significantly cross-border effect, consisting in transfer of knowledge and experiences
between partners from different sides of the border.
More details
http://www.kareliaenpi.eu/fi/teemat/cross-border-solutions/hankkeet/163-support-to-
sustainable-development-of-sortavala-town-for-the-improvement-of-environmental-
situation
5.2.12 Programme beneficiaries
The pool of the beneficiaries of the new programme should not differ from the one under
the present Programme, and should include all entities able to implement projects that
comply with the objective, priorities and measures of the Programme. Due to the nature of
the Programme, these will mainly be public institutions, administration and local
governments, administration bodies and their dependent entities (schools, community
centres, sports centres), higher education institutions, services (police, border guard,
medical rescue services, fire services, etc.), non-governmental organisations (associations,
foundations).

69
5.2.13 Project Evaluation and Selection criteria
One of the key factors influencing attainment of objectives of the Programme by the
implemented projects is appropriate selection of assessment criteria as well as projects’
selection. Appropriately selected criteria should allow for selecting the best projects that at
the same time will have a good chance of attaining sustainable effects, and thus effectively
implementing the Programme’s objectives.
In designing of the system of criteria for assessment and selection of projects within the
Programme we propose to use many years of experience in implementation of the European
Territorial Cooperation, collected in publication prepared by INTERACT2. First of all, we
propose to single out two types of criteria. Technical and implementation-related criteria,
and subject-related criteria. The subject-related criteria include the following criteria:
• adequacy to programme objectives;
• value added, understood as emergence during the project’s implementation of:
o innovativeness,
o cooperation between actors from different sides of the border (necessity to
cooperate in order to complete the project; effects obtained through
cooperation),
o complementariness with previously implemented projects,
• assumed effects of project implementation, measured by indicators planned to be
obtained (product, results, impact indicator);
• horizontal issues (e.g. equal opportunities, sustainable growth, etc.).
On the other hand, a group of technical and implementation-related criteria are:
• quality of project’s organization (action plan, division into work packages, agenda);
• partnership/management (appropriate structure and appropriate management
procedures; involvement of the partners);
• budget (realistic character of the budget, its cohesion, appropriate relation between
costs and benefits, i.e. efficiency);
• communication (appropriate way of informing the target groups about the project).
It should be noted that subject-related criteria should be definitely more important in the
final assessment than technical and implementation-related criteria. Interpretation of
particular indices and method of assessment and selection of projects, including marks for
particular criteria (the number of obtainable points, weights), should be adjusted to
particular measures and published competitions.
2 INTERACT (2012) Project Application and Assessment in European Territorial Cooperation Programmes,
Viborg: INTERACT.

70
5.2.14 Measures aimed to foster the establishment of project partnerships
The establishment of project partnerships can be supported by organising partners’
meetings, information and promotion campaigns, running a website and involving local and
regional governments.
Partners’ forums should be organised by the Joint Technical Secretariat. Importantly, such
forums should be held duly in advance before the calls for projects (should the need arise,
also after call for projects) are announced, so that the potential partners have enough time
to think the joint project through. Meetings should be organised, by rotation, in different
regions of the eligible area. In justified cases, the forums can be thematically restricted to
cover only selected Programme measures. As the Programme develops, it would be
desirable to engage the beneficiaries implementing the most interesting projects into such
meetings, so that they could share their experiences with potential new partners.
Another factor that can significantly influence the establishment of project partnerships is
the accessibility and transparency of the programme information. The information and
promotion campaign should outline the activities that are likely to be supported under the
Programme, place emphasis on good cooperation prospects and benefits that can be derived
from the implementation of initiatives undertaken under the Programme (by both the
beneficiaries and the environment). Importantly, information about the planned calls for
proposals should be published well in advance. When the call for proposals is announced,
information should be published about available training programmes for potential
beneficiaries. Such training should be organised in a way that facilitates the establishment of
partnerships (thematic groups, workshops). The campaign should be targeted primarily at
smaller entities, with little experience in cooperation. Therefore, emphasis should be placed
on promoting and encouraging microprojects as they can be viewed as a ‘gateway’ for
participation in the Programme.
Another initiative, complementing the campaign described above, is the launch of a
comprehensive website for the Programme, which should rest on two main pillars: the first
would be a unified database for collecting and making available information about the
implemented and planned projects and calls for proposals, and presenting, in a clear way,
interpretation of the regulations and legislative requirements. The second pillar would allow
for matching of entities with similar profiles of operation. To this end, social networking
tools should be used (e.g. Facebook, Twitter).
Last but not least, the local and regional governments could get engaged in the Programme
in two basic dimensions. Firstly, such government units should be encouraged to
create/make use of their institutional agreements to promote the Programme and provide
support in the matching od potential partners. Secondly, local governments should strive to
coordinate the existing formal cooperation networks (sectoral networks, NGO forums), so as
to fully tap their potential for establishing contacts between potential partners. In this
regard, strengthening the involvement of the Euroregions would be of particular importance
as they represent stable and relatively well-established structures.
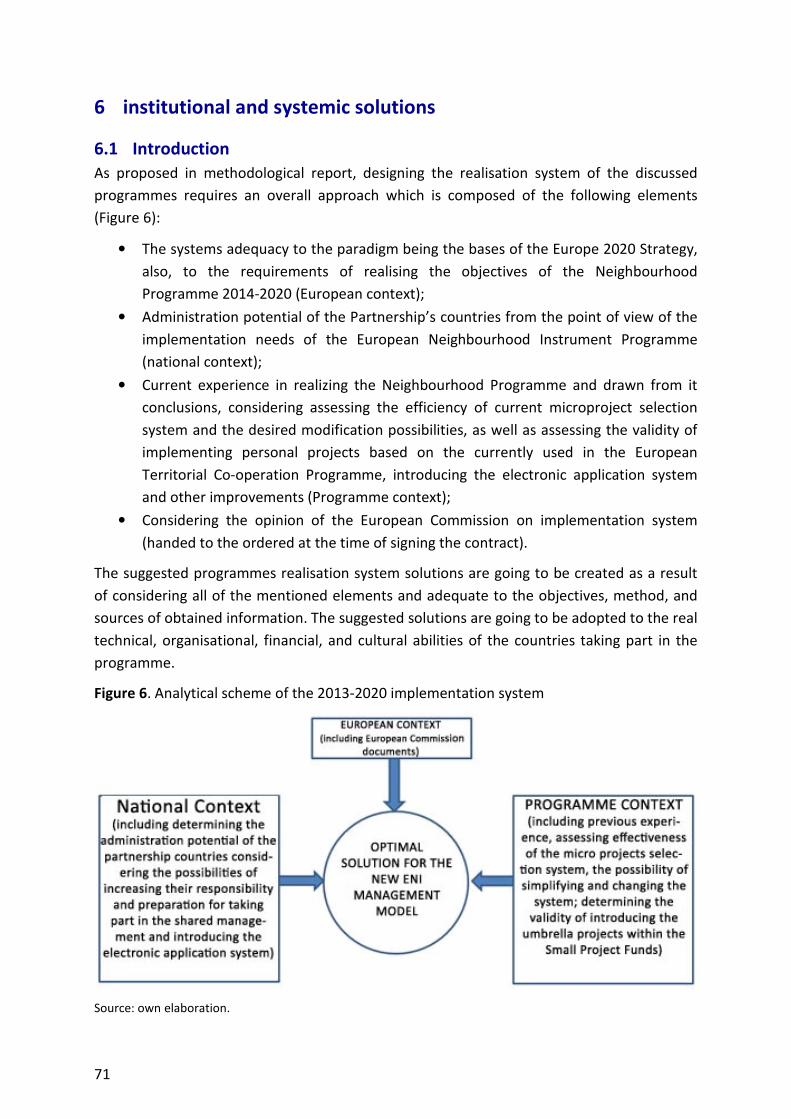
71
6 institutional and systemic solutions
6.1 Introduction
As proposed in methodological report, designing the realisation system of the discussed
programmes requires an overall approach which is composed of the following elements
(Figure 6):
• The systems adequacy to the paradigm being the bases of the Europe 2020 Strategy,
also, to the requirements of realising the objectives of the Neighbourhood
Programme 2014-2020 (European context);
• Administration potential of the Partnership’s countries from the point of view of the
implementation needs of the European Neighbourhood Instrument Programme
(national context);
• Current experience in realizing the Neighbourhood Programme and drawn from it
conclusions, considering assessing the efficiency of current microproject selection
system and the desired modification possibilities, as well as assessing the validity of
implementing personal projects based on the currently used in the European
Territorial Co-operation Programme, introducing the electronic application system
and other improvements (Programme context);
• Considering the opinion of the European Commission on implementation system
(handed to the ordered at the time of signing the contract).
The suggested programmes realisation system solutions are going to be created as a result
of considering all of the mentioned elements and adequate to the objectives, method, and
sources of obtained information. The suggested solutions are going to be adopted to the real
technical, organisational, financial, and cultural abilities of the countries taking part in the
programme.
Figure 6. Analytical scheme of the 2013-2020 implementation system
Source: own elaboration.

72
The analytical scheme presented above lists – for the purpose of clarity – two research
questions (3c. and 3d.) as parts of a programme context, specific for given management and
implementation solutions.
6.2 Optimal solutions within the new programme’s implementation system
An analysis of the experiences of the previous programme rounds suggests that the basic
solutions are well-established and proven to be satisfactory in the given circumstances by
most experts and majority of the respondents who answered the questionnaire (the
numbers differ depending on the question, some were left unanswered).The proposed key
solutions also remain in line with the main national and European documents, and as such
should be implemented without any problems.3 Among the respondents, 63.2% out of a
total of 272 were of the opinion that the management system as known from practice well
served to attain the objective of the Programme, 18.8 % were undecided, and 14.3 %
expressed negative opinions. Experts were of the opinion that the system should not be
changed for two reasons. First, it functions well and is accepted by all the stakeholders (with
the exception of microprojects, discussed below). Second, any significant change would
potentially lead to delays in programme commencement and implementation. Finally, it is
clear that such an existing system is in line with the European Union regulations and
strategies of the European Neighbourhood Programme. What is more, theregulations in
placeallow for a faster start of the programme than was the case in the past (due to the
experiences gained). When discussing potential solutions, one should bear in mind the
diagnosis presented for the Programme area. Despite numerous significant changes, certain
asymmetry in development is still present (see UE 2008, Diagnosis). Recent analyses stress
that there are still many opportunities left for adjustments of the overall implementation
arrangements to the area-specific needs (McMaster et al. 2013). For data and analysis of the
progress in the implementation of the objectives of the ENP in various partner countries,
see: EC 2013a; EC 2012.
Therefore,it is justified to say that the main elements of the implementation system in
institutional terms should be defined as follows:
• Joint Monitoring Committee (JMC)
• Joint Managing Authority (JMA) - the Ministry of Regional Development of the
Republic of Poland
3In case of the EU: UE 2011 (Proposal of the European Neighborhood Instrument); EU 2010 (Europe 2020
Strategy). In case of Belarus: with the National Strategy for the Sustainable Socio-economic Development of the Republic of Belarus Until 2020; In case of Ukraine: StateProgramme for the Socio-Economic Development of Ukraine for 2004-2015; Cross-borderCooperationAct. In case of Poland itiscompliant with the mainproposedstrategies (National Regional Development Strategy 2010-2010; Long Term National Development Strategy(2013) and Medium Term National Development Strategy (2012), Long Term Spatial Development Concept 2030 (2011).

73
• Joint Technical Secretariat (JTS) - the joint operational body assisting the Joint
Managing Authority and the Joint Monitoring Committee in carrying out their
duties;
• And Audit Authority and/or Control Contact Points .
Additionally, in order to facilitate communication with beneficiaries, subsidiaries of the JTS
(Information Points with certain delegated functions from the JTS) should be kept in the
partner states (Brest in Belarus and Lviv in Ukraine).
The functions of all these institutions should be based on the continuation of the functions
performed in 2007-2013. The main change (discussed below) proposed is the re-involvement
of the Euroregions as institutions responsible for the implementation of microprojects. The
question initially discussed was whether that role may be taken by selected local or regional
governments – this option, however, is not convincing, mostly due to the fact that
administrative workload and territorial responsibility would pose truly difficult problems,
which are not likely to appear in the case of the Euroregions. It is possible, that the final
decisions by the EU (or states PL, BYand UA on the management/implementation system
shall exclude Euroregions as intermediary bodies. Up to now the project of ENI CBC rules
(PROJECT made available by the MRD to Authors) nor known notions of the BY, UA and PL
does not refer to this issue. However, if so, the managing authority should retake the
managerial function or delegate it to other appropriate institution able to operate on both
sides of the border.
The aforementioned elements of the management system should allow for a faster
programme start and implementation. The interviewed experts were of the opinion that any
significant change, introduction of elements unknown and untested in the past, may result in
at least temporary implementation problems and delays. Taking into account that not only
the experts’ opinions, but also the findings in literature,4 microprojects (mostly of the
’people to people‘ nature) play a very important role in building cross-border relations
which,as the time passes, may lead to the common preparation and implementation of
larger projects.5
The interviewed specialists in Eastern affairs are of the opinion that the management system
is important, but its functioning to significantly depends on larger institutional and political
issues: mutual trust and willingness to cooperate are preconditions for successful
programme implementation. Also, from this point of view, mutual understanding reached in
the period 2007-2013 can be easily affected by the introduction of any untested or doubtful
solutions. Coming back to the role of the Euroregions and opportunities to utilise their wide
local cross-border contacts and experience in the delivery of microprojects, also taking into
account mixed experiences with the operationally complicated umbrella microproject
4See: Gorzelak, Zawalińska 2013.
5For more info about the significance of ‘people to people’ types of projects see: EU 2011a. Even if it brings
examples from ETC programmes, it is of a universal character and is meaningful also for ENP activities.

74
system established in other programmes, the involvement of Euroregions as operating
agencies for microprojects may be strongly recommended.
To sum up: most probably the more tested, effective and efficient solutions employed, the
more successful the programme implementation is going to be. There are some other
external issues that may influence the progress in the (fast) launch and implementation of
the programme, but a tested system would clearly contribute to a more positive approach
on the part of the stakeholders. There is no need to explain in details the system that has
operated in 2007-2013 period (with some doubts about the idea of introducing Umbrella
projects), as it is easily available from the MRD and JST. Should the ENI CBC Rules introduce
finally any changes, they should obviously be taken into account.
6.2.1 Administration potential of the partnership countries in relation to the
ENI implementation
Needless to say, the institutional systems in countries involved differ from one another. The
administrative system is most decentralised in Poland, while in Belarus and Ukraine the
administrative decision-making system is by far more centralised. This difference has to be
taken into account when talking about the administrative potential. Generally, the easiest
situation is in Poland. Probably the best way to present the problem would be to use the
questionnaire research data. Among 260 respondents representing all the three countries
who answered the question about Poland’s administrative potential, 56.5% assessed it as
high, 14.2% – as very high, 18.5% – as average, while only 5.8%as low or very low (with
10.8% who gave ’do not know’ answers). In the case of Ukraine, the respective data were as
follows: 13.8%-very high, 2.7% - average; 37.3% -low, 20.4% -very low, 8.1%, and 17.7% - ’do
not know‘. In the case of Belarus, there was a relatively high number of respondents who
could not say (38.8%) whether the administrative potential of Belarus is sufficient to
implement the Programme. There were 11.2 % answers evaluating it as ‘high’, 0.3% – as very
high, 17.7% - as average, 18.8% – as low, and 8.1% - as very low. Altogether, 70.7%
respondents assessed the administrative potential in Poland as high or very high, while in
the case of Ukraine and Belarus the respective values were 16.5% and 11.5%. If we add the
answers ‘average’, the difference is visible, but not that critical. Nevertheless, there are still
important differences with respect to the administrative potential, as to what should be
taken into account when discussing more detailed management solutions.
The final decision should be based on practical tests in individual countries. The problem
may lie not in ICTs but in the allocation of the decision-making powers, which would
significantly impact the opportunities for electronic application submission and selection in
certain countries (BY possibly). In other words, though in general this is not expected, it may
turn out that the system has weak elements. Possibly, decisions should be taken on a case by
case basis (in terms of a given border and type of projects). Anyway, everything possible
should be made to facilitate a wider usage of ICTs in the system.

75
Relatively critical (on the general, and not implementation level) were the publications in the
partner states, although they outlined the directions of necessary improvements (Gawrich
2010). It is worth remembering that not all the expectations of the Eastern partner societies
have as yet been met by the ENP, as it may be equally (or more) important for the future of
the ENP than the quality of administration or the ENPI management system. Or, as
peripherality of border areas, which turns out to be one of the most complex development
problems (see Miszczuk 2013). However, the data presented by the MRD in 2012 (MRD
2012) concerning the progress of the ENP PL-BY-UA programme leaves no doubt that the
interest shown by potential beneficiaries is much higher than the financial resources
available. A report on CBC cooperation post 2013 developed by EGO formulates a number of
challenges relating to the ETC programme, none of which are of a critical character (GEO
2012), but may serve as an additional source of information.
Taking into account all the available data concerning the national differences between the
institutional systems and administrative potentials of all the countries involved, the
possibility of increasing the scope of responsibilities of those countries in the 2013-2020
programme round cannot be assessed as high, since it largely depends on the national
institutional systems and organisational (administrative) cultures, whilst the differences
between the three countries call for prudent decisions in order to avoid possible difficulties
in the programme implementation.
This is one of the most disputed issues among experts. Up till now, the countries and
institutions involved have reached a level of a relatively effective cooperation. Therefore,
every attempt should be made in the future to introduce and deepen the shared
management concept, providing it will not affect negatively the system now in place. One
way or another, shared management may allow for a better adjustment of the instruments
to the needs of a given area.
6.2.2 Assessment of the efficiency of the microproject selection system in the
period of 2007-2013
The evaluation of the microproject system made by Centrum Rozwoju Społeczno-
Gospodarczego [Centre for Socio-Economic Development] (2010) suggested that it is not
satisfactory and has numerous weaknesses.
Contemporarily, the prevalent opinions on the solution adopted for the period 2007-2013
for microproject selection are similarly critical: it was less efficient and effective than in the
previous period (pre-2007). It was difficult and not flexible enough. The main reason for this
was that the ’umbrella projects‘ solution applied to Measure 3.2 (Initiatives of the Local
Communities) required that one main partner would be responsible for the management of
a set of other, mostly integrated, microprojects prepared and implemented by other entities
which, in case of failure of any individual microproject (resignation, implementation
problem, irregularities, etc.), required lengthy and difficult changes in the documentation.
Additionally, it meant an additional administrative burden for the Joint Technical Secretariat.

76
It comes as no surprise therefore that the general opinion is that the previous system (based
on the implementation of microprojects by the Bug, Carpathian, Neman and Białowieża
Forest Euroregions) was recommended by almost all the interviewed experts.
In general, probably the system of selection and assessment of the projects can be based on
the screened and adjusted selection criteria for the 2004-2006 period, as proven, working
and well known to beneficiaries and implementing institutions.
As explained earlier in this section, in case of the Microprojects Funds, the introduction of a
new Umbrella Programme form (as used in the ETC programmes) did not bring any
improvement in 2007-2013. Without repeating the arguments, it should be recommended
that the old system of microproject funds implemented by the Euroregions is re-introduced
as more efficient, effective and less troublesome for all the stakeholders. According to all the
interviewed experts, the Umbrella Programme selection system for 2007-2013 resulted in
many problems for both the implementing entities and the beneficiaries. Similarly, it did not
draw on the available experience and well-known potential of the Euroregions. In case of the
ENP programmes, with all their specificity, the umbrella projects concept may result in
slowing down their implementation.
Of course, providing that EU regulations (final, not projects) will not exclude institutions like
Euroregions from programme implementation. Up until now it cannot be taken as granted.
6.2.3 Analysis of the possibility of an electronic submission of applications
An electronic application system would make the process of applying for the Programme
grants much easier, faster and less costly. However, before introducing the system the
opinions of the stakeholders should be taken into account. As we remember, not in every
partner state the administrative potential was assessed as similarly high.6 Also answers to
the specific question whether in individual countries it would be possible to introduce an
electronic application system post 2013, are not univocal. Among 153 respondents assessing
the possibilities of Poland, 73.2% answered ‘yes’, 5.2% – ‘no’, and 21.6% – ‘do not know’.
Almost similarly positive were the opinions about Ukraine: among 103 respondents,
59.2%answered ‘yes’, 1.9% – ‘no’, 38.8% - ‘do not know’. The case of Belarus is more difficult
to assess and compare with others as the number of respondents (only 20) was significantly
lower than in Poland and Ukraine. Among them, a vast majority (13) answered ‘do not
know’, 6 – ‘yes’, and 1 – ‘no’.
These data suggest that making final decisions about introducing an electronic application
system now may be premature, since not all of them are viewed as ready. Introducing such a
system in some countries could potentially cause chaos in the overall system. Anyway, the
6 The diagnosis presented in the UE 2008 Programme PL-BY-UA suggested wide differences in terms of various
forms of infrastructure (including ICT) between the countries in question. This specific issue of the ENP was not discussed directly.

77
emphasis during the 2004-2020 period should be put on the preparation of all the countries
involved for a wider use of electronic systems in programme implementation.
As mentioned above, introducing electronic circulation of documents (specifically the
application system, as it is probably of key importance for efficient implementation) would
improve the programme management, providing all the partner countries are not only
technically prepared to take part in such a system. At the moment, there is no clear and
decisive evidence that this condition is fulfilled in the countries involved. Therefore, it would
be rather recommended to pay more attention to preparing all the parties and stakeholders
involved to it, as one of the additional tasks of the 2014-2020 programme. It has to be
remembered, however, that this issue may be influenced, to a degree that cannot as yet be
assessed, by differences in the administrative (institutional) systems unique for each of
those countries. If so, any changes in the management system may be inefficient.
Among the main difficulties regarding management may be the slowdown in the influx of
applications from certain countries and areas, as the systems there may not be fully
operational, in particular at the beginning of the programme implementation. It is not clear
whether the hardware and connections (broadband) will everywhere be able to cope with
an increased data transfer. Lack of experience in using new solutions (technology) may also
result in an increased number of mistakes made in the documents and multiplication of
faulty documents (versions) available on the Internet, thus adding new elements of chaos in
the system.
On the enhancements’ side, speeding up the application processes and a wider use of
software to cope with the documents in the system would be an advantage. Despite all the
problems that may be encountered, the electronic application system should be introduced
from the very beginning of the 2014-2020 programme. Certainly, it should be accompanied
by the necessary and well prepared training schemes for all the stakeholders, in order to
ensure effective and efficient operation.
6.2.4 Conclusions
To sum up, we have assumed that the implementation system is affected by three different
groups of factors typical of the European, national and programme contexts. It seems
justified to say that, in this particular aspect of programme implementation, the national
factors that to a large extent are external and independent from the managing institutions
and the EU regulations are relatively the most important (the administrative potential, but
also the development level). The programme context could prove important, in particular in
the relation to making choices between various implementation solutions and arrangements
(like the Umbrella programme to handle local community initiatives, microprojects).Both the
scientific analysis (McMaster et al. 2013) and the EU regulation proposals for the new period
seem to leave enough room for manoeuvre for all the countries involved to adjust (within
the national limits) to the common implementation/management system. It also leads to the

78
conclusion that the implementation system for the consecutive period should be based on
the best experiences gained until now.

79
7 References
Centrum Rozwoju Społeczno-Gospodarczego, 2010, Raport Końcowy. Ocena skuteczności
systemu wdrażania Funduszu Małych Projektów i Projektów Sieciowych w Programie
Operacyjnym Współpracy Transgranicznej Polska (Województwo Lubuskie) –
Brandenburgia 2007 – 2013, w ramach Europejskiej Współpracy Terytorialnej,
Szczecin; badanie ewaluacyjne na zlecenie Ministerstwa Rozwoju Regionalnego.
CSIS & IFRI (Centre for Strategic and International Studies and Institut Françcais des Relations
Internationales), 2008, Russia’s 2020 Strategic Economic Goals and the Role of
International Integration, Washington and Paris.
Dziewoński K., 1967, Teoria regionu ekonomicznego, Przegląd Geograficzny, Nr 39(1), ss. 33-50.
EC, 2010, COMMUNICATION FROM THE COMMISSION, EUROPE 2020: A strategy for smart,
sustainable and inclusive growth.
EC, 2012, JOINT STAFF WORKING DOCUMENT: Implementation of the European
Neighbourhood Policy in 2012 Regional Report: Eastern Partnership.
EC, 2013 a, JOINT STAFF WORKING DOCUMENT Implementation of the European
Neighbourhood Policy in 2012 Statistical Annex.
EC, 2013, JOIN(2013) 4 final, European Neighbourhood Policy: Working towards a Stronger
Partnership.
EGO, 2012, Wyzwania i cele dla programów współpracy trans granicznej z udziałem Polski po
2013 roku, raport dla Ministerstwa Rozwoju Regionalnego.
EU 2011a, EUROPEAN TERRITORIAL COOPERATION. BUILDING BRIDGES BETWEEN PEOPLE,
Brussels.
EU, 2008, Program Współpracy Transgranicznej Polska-Białoruś- Ukraina 2007-2013.
EU, 2011, Proposal for a REGULATION OF THE EUROPEAN PARLIAMENT AND OF THE
COUNCIL establishing a European Neighbourhood Instrument; {SEC(2011) 1466
final}{SEC(2011) 1467 final}.
Gawrich A., Melnykovska I., Schweickert R., 2010, Neighbourhood Europeanization through
ENP: The Case of Ukraine. Journal of Common Market Studies, Vol. 48. Number 5. pp.
1209–1235.
Gorzelak G., Płoszaj A., Smętkowski M., 2006, Ocena strategii rozwoju regionu -
wykorzystanie modelu czterech kapitałów, Studia Regionalne i Lokalne, Nr 3(25)/2006,
ss. 67 - 82.
Gorzelak G., Zawalińska K. (eds), 2013, European Territories: From Cooperation to
Integration?; Warszawa: Wyd. Naukowe Scholar.
GUS, 2011, Ruch graniczny oraz przepływy towarów i usług na zewnętrznej granicy Unii
Europejskiej na terenie Polski, Główny Urząd Statystyczny, Warszawa.

80
INTERACT (2012) Project Application and Assessment in European Territorial Cooperation
Programmes, Viborg: INTERACT.
Kawałko, B., 2011, Wybrane problemy polsko-ukraińskiej współpracy transgranicznej,
Barometr Regionalny, Analizy i prognozy nr 2(24)/2011.
Komornicki T., 2003, Przestrzenne zróżnicowanie międzynarodowych powiązań społeczno-
gospodarczych w Polsce, Prace Geograficzne nr 190, IGiPZ PAN, Warszawa.
Krok K., Smętkowski M. (red.), 2006, Cross-border co-operation of Poland after EU
enlargement, Wyd. Nauk. Scholar, Warszawa.
MAiC, 2012, Długookresowa Strategia Rozwoju Kraju. Polska 2030 – trzecia fala
nowoczesności.
McMaster I., van der Zwet A., Vironen H., 2013, Territorial Cooperation Governance, in: G.
Gorzelak, K. Zawalińska (eds) European Territories: From Cooperation to Integration?;
Warszawa: Wyd. Naukowe Scholar.
Miszczuk A., 2013, Uwarunkowania peryferyjności region przygranicznego, Lublin:
Norbertinum.
Miszczuk A., Smętkowski M., Płoszaj A., Celińska-Janowicz D., 2010, Aktualne problemy
demograficzne regionu Polski wschodniej, Raporty i Analizy EUROREG 5/2010,
Warszawa.
MRR (Ministerstwo Rozwoju Regionalnego), 2012, Overview of the Programme Progress
[CBC PL-BY-UA 2007-2013], presentation at the conference ‘The Art of Cooperation’,
Kazimierz Dolny (Poland), 15.11.2012; http://www.pl-by-ua.eu/en,news,93 [accessed
15.07.2013].
MRR, 2010, Krajowa Strategia Rozwoju Regionalnego 2010-2020: Regiony, Miasta, Obszary
wiejskie.
MRR, 2011, Koncepcja Przestrzennego Zagospodarowania Kraju 2030.
MRR, 2012, Średniookresowa Strategia Rozwoju Kraju 2020.
National Strategy for Sustainable Development for the Period to 2020 of the Republic of
Belarus, The National Sustainable Development Commission of Belarus, Minsk, 2004.
76 pp.
Obłój K., 2007, Strategia organizacji. W poszukiwaniu trwałej przewagi konkurencyjnej,
Polskie Wydawnictwo Ekonomiczne, Warszawa.
Płoszaj A., 2013, Two Faces of Territorial Cooperation in Europe: Twinning Cities and
European Territorial Cooperation Programmes [w:] Gorzelak G., Zawalińska K. (red.):
European Territories: From Cooperation to Integration? Warszawa: Wydawnictwo
Naukowe Scholar, pp. 69-96.
Pogranicze Polsko-Słowacko-Ukraińskie, Urząd Statystyczny w Rzeszowie, Rzeszów, 2009.

81
PROGRAM OF ECONOMIC REFORMS 2010-2014: Prosperous Society, Competitive Economy,
Effective State, Committee on Economic Reforms under the President of Ukraine,
07.2010.
PROGRAM OPERACYJNY POLSKA WSCHODNIA 2014-2020 (PO PW) (projekt), wrzesień 2013.
Rettinger, R., 2010, Stan i perspektywy rozwoju bazy noclegowej w obwodzie lwowskim,
Prace Komisji Geografii Przemysłu, Nr 16, ss. 226-236.
Strategia Rozwoju Województwa Lubelskiego na lata 2014-2020 (z perspektywą do 2030 r.).
STRATEGIA ROZWOJU WOJEWÓDZTWA PODKARPACKIEGO na lata 2007 – 2020, Aktualizacja
na lata 2013 – 2020.
Strategia Rozwoju Województwa Podlaskiego do roku 2020.
Tourism and tourist resources in the Republic of Belarus, National Statistical Committee of
the Republic of Belarus, Minsk, 2012.
Ullman E.L., 1957, American commodity flow,University of Washington Press, Seattle,
Washington.
Державна Стратегія Регіонального Розвитку на період до 2015 року, 07.2006.
ПРОГРАММА деятельности Правительства Республики Беларусь на 2011 – 2015 годы,
02.2011.

82
8 Appendices
Appendix 1. Analysis of foreign trade
Aim:
The purpose of the analysis was to investigate the spatial range of economic cross-border
interactions taking place between Poland, Belarus, and Ukraine, on the basis of available
statistical data.
Indicators:
Foreign trade was selected as the indicator to reflect economic interactions, a choice
primarily due to the availability of statistical data. Two basic indicators were selected for the
analysis:
• Volume of foreign trade with Belarus/Ukraine per capita, in EUR
• Share of Belarus/Ukraine in overall foreign trade.
The former indicator shows the significance of a given phenomenon for a given local system,
and the latter illustrates the relative significance of the interactions with a given country in
the context of such overall interactions in a given local system.
Data sources:
For Poland, the analysis was conducted at the district level, using the data received from the
Ministry of Finance.
In case of Belarus, the analysis was based on the publication Foreign Trade of Belarus
Republic 2012.
In case of Ukraine, the data of the State Statistics Service of Ukraine, as published in Regions
of Ukraine (2011), were used.
Methodology:
First, thematic maps were prepared for the selected indicators. The ‘natural break’ method
was chosen for classification purposes, using an arbitrary division into five class intervals. In
addition, synthetic maps of trade interactions were prepared, by adding the standardised
values of both variables and dividing a given phenomenon into four classes, viz.: lower than
0 – very weakly noticeable phenomenon; 1 noticeable phenomenon; 2 strongly noticeable
phenomenon, and 3 very strongly noticeable phenomenon.
Second, tabular presentations were prepared, based on the values selected for the indicator
analysis in (a) the eligible area (b) the adjacent areas (c) large cities (for Poland, regional
capitals) (d) the remaining regions of a given country.
Third, spatial analyses were made to identify the correlations between the values of the
indicators concerned and the distance from the state border.

83
Products:
a) Thematic maps
Fig. 1. Foreign trade with Belarus in 2011
Synthetic map – significance of foreign trade with Belarus
Fig. 1. Foreign trade with Belarus in 2011
significance of foreign trade with Belarus

84
Note: The significance of foreign trade with Belarus is noticeable primarily in the Podlaskie
voivodship, notably in its three border districts, plus Białystok, and in some districts of the
Lubelskie voivodship, in particular Biała Podlaska and the surrounding land district, plus
Lublin. The considerable significance of trade exchange with Belarus is also clearly visible in
most of the Mazowieckie voivodship (especially in the districts surrounding Siedlce) and
Warsaw, and also in the Łódzkie voivodship, though to a lesser extent. Other than those,
solid trade linkages with Belarus were found in the districts surrounding Szczecin, which was
probably due to using the port complex of Szczecin-Świnoujście.

85
Fig. 2. Foreign trade with Ukraine in 2011
Synthetic map – significance of foreign trade with Ukraine
Fig. 2. Foreign trade with Ukraine in 2011
significance of foreign trade with Ukraine

86
Note: The significance of foreign trade with Ukraine is best visible in the Przemyśl subregion
which considerably surpasses other regions in that regard. In addition to that, the role of
trade Ukraine is particularly well visible in the town of Chełm and its land district, the
majority of district of the Lubelskie and Podkarpackie voivodships, inc
capitals, Lublin and Rzeszów. As the distance from the border increases, the system of
spatial interactions becomes more dispersed, but with clearly visible ‘enclaves’ such as
Warsaw, some districts in Silesia, as well as the district
The significance of foreign trade with Ukraine is best visible in the Przemyśl subregion
which considerably surpasses other regions in that regard. In addition to that, the role of
trade Ukraine is particularly well visible in the town of Chełm and its land district, the
majority of district of the Lubelskie and Podkarpackie voivodships, including their regional
capitals, Lublin and Rzeszów. As the distance from the border increases, the system of
spatial interactions becomes more dispersed, but with clearly visible ‘enclaves’ such as
Warsaw, some districts in Silesia, as well as the districts of Ełk and Inowrocław.
The significance of foreign trade with Ukraine is best visible in the Przemyśl subregion,
which considerably surpasses other regions in that regard. In addition to that, the role of
trade Ukraine is particularly well visible in the town of Chełm and its land district, the
luding their regional
capitals, Lublin and Rzeszów. As the distance from the border increases, the system of
spatial interactions becomes more dispersed, but with clearly visible ‘enclaves’ such as
s of Ełk and Inowrocław.

87
b) Tables
Tab. 1. Foreign trade with Belarus and Ukraine in 2011
Foreign trade with Belarus [MEUR]
Foreign trade with Belarus per capita
Share of Belarus in foreign trade
Foreign trade with Ukraine
Foreign trade with Ukraine per capita
Share of Ukraine in foreign trade
Total
2 043 53 1.4 4 670 121 3.2
Eligible area PL
388 100 4.1 351 92 3.8
Adjacent areas PL
122 50 1.5 309 126 3.7
Large cities (outside eligible and adjacent areas)
414 58 1.6 735 103 2.8
Remaining regions
1 119 45 1.1 3 276 130 3.1
Note: There is a visible concentration of foreign trade with Belarus in the eligible area (20%),
its significance being over two times higher per capita than in the remaining regions of the
country, and nearly three times higher in terms of the share of foreign trade in total
turnover. The significance of the adjacent areas was also considerable (6%), as opposed to
the minor significance of large cities in relation to their potential (20%) and the crucial role
of the remaining districts (55%). All these categories, however, were similar in value in terms
of trade per capita and share in the overall trade exchange.
The concentration of foreign trade with Ukraine in the eligible area was rather weak (7.5%),
and only slightly higher than that in the adjacent areas (6.5%). At the same time, the volume
of trade per capita was higher in the adjacent areas, with a similar share in overall trade
exchange. It should also be noted, however, that these values were only slightly higher than
the national average. The significance of large cities in relation to their potential was rather
low, which in effect produced lower-than-average values per capita and share in the overall
trade exchange. The role of the remaining districts was absolutely pivotal as they accounted
for 70% of trade exchange with Ukraine, which considerably affected the observable
national averages.

88
Tab. 2. Foreign trade of Belarus with Poland in 2011
Foreign trade with Poland [USD m] (estimated)
Foreign trade per capita in USD (estimated)
Share of Poland in foreign trade (%) (estimated)
Total
2 414 248 2.8
Eligible area BY
213 83 2.8
Adjacent areas BY
576 195 2.8
Minsk
984 642 2.8
Note: The data on the value of foreign trade in the respective spatial categories are
estimates (assuming a constant share of Poland in foreign trade nationally). On this basis, it
can be concluded that the significance of foreign trade with Poland is potentially the
greatest for Minsk, much lower in the adjacent areas, and the lowest in the eligible area.
However, it can be assumed that the real significance of foreign trade with Poland for the
eligible area is considerably higher, especially with regard to its share in overall trade
exchange. This is due to the correlation, demonstrated below, between a distinct decrease
of the percentage of trade with the given country and the increase in the distance from the
border, and the value of purchases made by individual tourists, which were left out of these
statistics. The value of shopping done by foreigners (mostly Belarusians) who crossed the
border with Poland totalled PLN 1 949 000 000, and the value of purchases by Poles in
Belarus was PLN 64 000 000.
Tab. 3. Foreign trade of Ukraine with Poland in 2011
Foreign trade with Poland [USD mln]
Foreign trade per capita [USD]
Share of Poland in foreign trade (%)
Total
5 777 126 3.8
Eligible area
1 136 235 12.0
Adjacent areas
523 144 14.7
Kiev
1 194 428 3.8
Note: The Ukrainian regions making up the eligible area on the Ukrainian side of the border
have a 20% share in foreign trade exchange with Poland, which approximately corresponds
to the trade exchange of the state capital. In their case, the share of foreign trade with
Poland is 12%, as compared to a mere 3.8% in Kiev. On the other hand, in Kiev the
significance of the trade with Poland in per capita terms is much higher. The adjacent areas
are not as significant as they represent less than 10% of overall trade exchange, with its per
capita values only a little higher than the national average. In their case, however, the
significance of foreign trade with Poland is even greater, at a level of ca. 15%. The value of

89
purchases made by foreigners (mostly Bela
2011 totalled PLN 3 114 000 000, and the value of shopping done Poles who travelled to
Belarus was PLN 331 000 000.
c) Spatial analysis
Fig. 3. Foreign trade with Belarus
kilometres)
a) volume of foreign trade with Belarus
Note: With the exception of several districts situated directly on the border, no significant
differences can be seen in the per capita values of foreign trade with Belarus as the distance
from the border crossings increases. However, it is clearly observable that the significance of
Belarus as a trade partner rapidly decreases as the distance from the border increas
a fast pace of such decrease observable up to 100 km and a slower one, up to a threshold of
200 km from the border.
purchases made by foreigners (mostly Belarusians) who crossed the border with Poland in
000 000, and the value of shopping done Poles who travelled to
000 000.
. Foreign trade with Belarus in powiats and distance from the border
olume of foreign trade with Belarus EUR per capita b) share of Belarus in overall foreign trade
: With the exception of several districts situated directly on the border, no significant
seen in the per capita values of foreign trade with Belarus as the distance
from the border crossings increases. However, it is clearly observable that the significance of
Belarus as a trade partner rapidly decreases as the distance from the border increas
a fast pace of such decrease observable up to 100 km and a slower one, up to a threshold of
rusians) who crossed the border with Poland in
000 000, and the value of shopping done Poles who travelled to
and distance from the border (horizontal axis in
hare of Belarus in overall foreign trade (%)
: With the exception of several districts situated directly on the border, no significant
seen in the per capita values of foreign trade with Belarus as the distance
from the border crossings increases. However, it is clearly observable that the significance of
Belarus as a trade partner rapidly decreases as the distance from the border increases, with
a fast pace of such decrease observable up to 100 km and a slower one, up to a threshold of

90
Fig. 4. Foreign trade with Ukraine
kilometres)
a) volume of foreign trade with Ukraine
capita
Note: In terms of the per capita values of foreign trade with Ukraine, the impact of the
distance factor is not observable; moreover, if the border districts are excluded, the scale of
this phenomenon increases up to the distance of 100 km from the border. How
terms of the share of Ukraine in foreign trade exchange, it distinctly falls as the distance
from the border increases, very quickly up to 120 km, and less quickly up to 300 km.
. Foreign trade with Ukraine in powiats and distance from the border
olume of foreign trade with Ukraine EUR per b) share of Ukraine in overall foreign trade
: In terms of the per capita values of foreign trade with Ukraine, the impact of the
distance factor is not observable; moreover, if the border districts are excluded, the scale of
this phenomenon increases up to the distance of 100 km from the border. How
terms of the share of Ukraine in foreign trade exchange, it distinctly falls as the distance
from the border increases, very quickly up to 120 km, and less quickly up to 300 km.
and distance from the border (horizontal axis in
hare of Ukraine in overall foreign trade (%)
: In terms of the per capita values of foreign trade with Ukraine, the impact of the
distance factor is not observable; moreover, if the border districts are excluded, the scale of
this phenomenon increases up to the distance of 100 km from the border. However, in
terms of the share of Ukraine in foreign trade exchange, it distinctly falls as the distance
from the border increases, very quickly up to 120 km, and less quickly up to 300 km.

91
CONCLUSIONS
The following major conclusions may be drawn on the basis of the analyses made so far:
• In case of foreign trade with Belarus, some concentration of trade turnover can be
observed in the eligible area, within 100 km from the border (particularly in some of
the border districts); the role of trade interactions with Belarus in the adjacent areas
does not considerably diverge from the remaining regions of the country; similarly,
large cities are no different in this respect.
• In case of trade turnover with Ukraine, considerable dispersion of linkages can be
observed across Poland, although with a slight prevalence of both the eligible (mainly
due to the Przemyśl subregion), and the adjacent areas. However, spatial analysis did
not demonstrate any major significance of the distance from the border for Polish-
Ukrainian trade relations.
• Based on estimates, the eligible area in Belarus does not differ in any important way
in terms of foreign trade with Poland, save for purchases made by individual tourists.
On the other hand, the adjacent areas, and Minsk in particular, can become
significant centres of trade exchange with Poland.
• In Ukraine, notable centres of trade exchange with Poland are found both within the
eligible area and in the adjacent areas, with a major role played by shopping tourism
in the eligible area. Kiev plays a substantial role in the trade exchange, even when the
number of the population is taken into account.

92
Appendix 2. Analysis of tourist traffic
Aim:
The aim of analysis was to show the spatial range of cross-border social and cultural
interactions taking place between Poland, Belarus, and Ukraine, based on available statistical
data.
Indicators:
Tourism was selected as the area reflecting social and cultural interactions, mainly due to
the availability of statistical data. The following two indicators were chosen for analysis:
• Number of accommodated tourists from Belarus/Ukraine per 1000 population,
• Number of Belarusians/Ukrainians as a percentage of foreign tourists.
The former illustrates the significance of the factor for a given local system, and the latter –
the relative significance of the relations with a given country in the context of its overall
foreign tourism interactions.
Data sources:
In the case of Poland, the analysis was made at the district level, on the basis of Central
Statistical Office (GUS) data.
In the case of Belarus, the data on organised tourists at the oblast level were used, based on
the publication Tourism and Tourist Resources in The Republic of Belarus published by the
National Statistical Committee of the Republic of Belarus, although some estimates had also
to be made.
In the case of Ukraine, the estimated data were used, based on the publications Pogranicze
Polsko-Słowacko-Ukraińskie, Statisitcal Office Rzeszów, 2009 and R. Rettinger “Stan i
perspektywy rozwoju bazy noclegowej w obwodzie lwowskim”, Prace Komisji Geografii
Przemysłu, 2010.
Methodology:
First, thematic maps were prepared for the selected indicators. The ‘natural break’ method
was chosen for classification purposes, using an arbitrary division into five class intervals. In
addition, synthetic maps of trade interactions were prepared, by adding the standardised
values of both variables and dividing a given phenomenon into four classes, viz.: lower than
0 – very weakly noticeable phenomenon; 1 noticeable phenomenon; 2 strongly noticeable
phenomenon, and 3 very strongly noticeable phenomenon.
Second, tabular presentations were prepared, based on the values selected for the indicator
analysis in (a) the eligible area (b) the adjacent areas (c) large cities (for Poland, regional
capitals) (d) the remaining regions of a given country
Third, spatial analyses were made to identify the correlations between the values of the
indicators concerned and the distance from the state border.

93
Products:
a) Thematic maps
Fig. 1. Belarusians accommodated in Poland in 2012
Synthetic map – significance of travels by Belarusians
Accomodated Belarussianper 1000 inhabitants
50 do 200 (5)
30 do 50 (4)
10 do 30 (13)
1 do 10 (88)
0 do 1 (269)
Belarussian as per cent ofaccomodated foreign tourists
50 do 76,8 (3)
30 do 50 (5)
10 do 30 (31)
1 do 10 (174)
0 do 1 (166)

94
Note: The Podlaskie voivodship is the main destination for tourists from Belarus coming to
Poland, in particular the districts where border crossings are located, plus Białystok. This is
also true for Biała Podlaska and its land district situated in the Lubelskie voivodship. There is
also a visible concentration of the stays of Belarusian citizens in the eastern part of the
Mazowieckie voivodship, along the access roads to Warsaw. Other than that, considerable
significance of the incoming tourism from Belarus can be observed in the remaining parts of
the Mazowieckie and Lubelskie voivodships and in the Łódzkie voivodship. The sizeable
concentration in some of the districts situated at Poland’s western border can be considered
as proof of transit accommodation.

95
Fig. 2. Ukrainians accommodated in Poland in 2012
Synthetic map – significance of travels by Ukrainians
Accomodated Ukrainiansper 1000 inhabitanrs
50 do 84,4 (6)
30 do 50 (6)
10 do 30 (26)
1 do 10 (174)
0 do 1 (167)
Ukrainians as per cent ofaccomodated foreign tourists
50 do 100 (16)
30 do 50 (23)
10 do 30 (69)
1 do 10 (215)
0 do 1 (56)
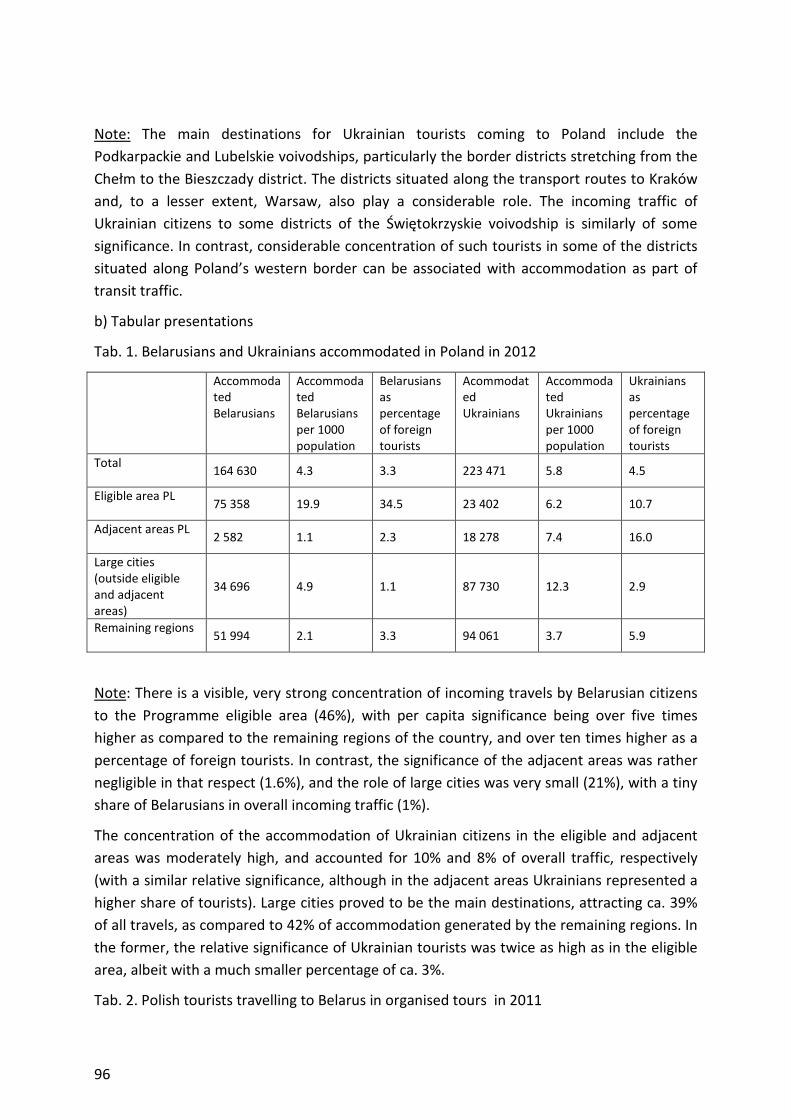
96
Note: The main destinations for Ukrainian tourists coming to Poland include the
Podkarpackie and Lubelskie voivodships, particularly the border districts stretching from the
Chełm to the Bieszczady district. The districts situated along the transport routes to Kraków
and, to a lesser extent, Warsaw, also play a considerable role. The incoming traffic of
Ukrainian citizens to some districts of the Świętokrzyskie voivodship is similarly of some
significance. In contrast, considerable concentration of such tourists in some of the districts
situated along Poland’s western border can be associated with accommodation as part of
transit traffic.
b) Tabular presentations
Tab. 1. Belarusians and Ukrainians accommodated in Poland in 2012
Accommodated Belarusians
Accommodated Belarusians per 1000 population
Belarusians as percentage of foreign tourists
Acommodated Ukrainians
Accommodated Ukrainians per 1000 population
Ukrainians as percentage of foreign tourists
Total
164 630 4.3 3.3 223 471 5.8 4.5
Eligible area PL
75 358 19.9 34.5 23 402 6.2 10.7
Adjacent areas PL
2 582 1.1 2.3 18 278 7.4 16.0
Large cities (outside eligible and adjacent areas)
34 696 4.9 1.1 87 730 12.3 2.9
Remaining regions
51 994 2.1 3.3 94 061 3.7 5.9
Note: There is a visible, very strong concentration of incoming travels by Belarusian citizens
to the Programme eligible area (46%), with per capita significance being over five times
higher as compared to the remaining regions of the country, and over ten times higher as a
percentage of foreign tourists. In contrast, the significance of the adjacent areas was rather
negligible in that respect (1.6%), and the role of large cities was very small (21%), with a tiny
share of Belarusians in overall incoming traffic (1%).
The concentration of the accommodation of Ukrainian citizens in the eligible and adjacent
areas was moderately high, and accounted for 10% and 8% of overall traffic, respectively
(with a similar relative significance, although in the adjacent areas Ukrainians represented a
higher share of tourists). Large cities proved to be the main destinations, attracting ca. 39%
of all travels, as compared to 42% of accommodation generated by the remaining regions. In
the former, the relative significance of Ukrainian tourists was twice as high as in the eligible
area, albeit with a much smaller percentage of ca. 3%.
Tab. 2. Polish tourists travelling to Belarus in organised tours in 2011
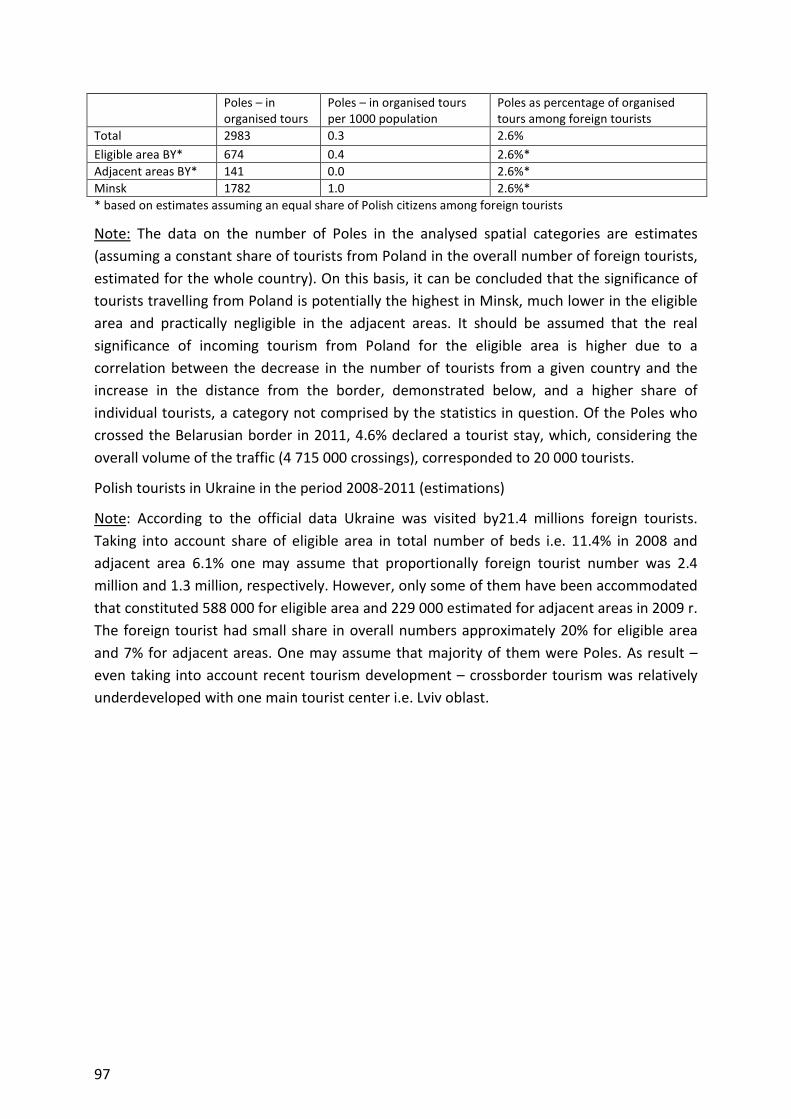
97
Poles – in organised tours
Poles – in organised tours per 1000 population
Poles as percentage of organised tours among foreign tourists
Total 2983 0.3 2.6%
Eligible area BY* 674 0.4 2.6%*
Adjacent areas BY* 141 0.0 2.6%*
Minsk 1782 1.0 2.6%*
* based on estimates assuming an equal share of Polish citizens among foreign tourists
Note: The data on the number of Poles in the analysed spatial categories are estimates
(assuming a constant share of tourists from Poland in the overall number of foreign tourists,
estimated for the whole country). On this basis, it can be concluded that the significance of
tourists travelling from Poland is potentially the highest in Minsk, much lower in the eligible
area and practically negligible in the adjacent areas. It should be assumed that the real
significance of incoming tourism from Poland for the eligible area is higher due to a
correlation between the decrease in the number of tourists from a given country and the
increase in the distance from the border, demonstrated below, and a higher share of
individual tourists, a category not comprised by the statistics in question. Of the Poles who
crossed the Belarusian border in 2011, 4.6% declared a tourist stay, which, considering the
overall volume of the traffic (4 715 000 crossings), corresponded to 20 000 tourists.
Polish tourists in Ukraine in the period 2008-2011 (estimations)
Note: According to the official data Ukraine was visited by21.4 millions foreign tourists.
Taking into account share of eligible area in total number of beds i.e. 11.4% in 2008 and
adjacent area 6.1% one may assume that proportionally foreign tourist number was 2.4
million and 1.3 million, respectively. However, only some of them have been accommodated
that constituted 588 000 for eligible area and 229 000 estimated for adjacent areas in 2009 r.
The foreign tourist had small share in overall numbers approximately 20% for eligible area
and 7% for adjacent areas. One may assume that majority of them were Poles. As result –
even taking into account recent tourism development – crossborder tourism was relatively
underdeveloped with one main tourist center i.e. Lviv oblast.

98
c) Spatial analysis
Fig. 3. Accommodated tourists from Belarus in powiats and distance from the border
(horizontal axis in kilometres)
a) accommodated Belarusians per 1000 inhabitants b) Belarusians as percentage of foreign tourists
Note: The spatial distribution of the significance of Belarusian tourists’ accommodation was
bipolar. On the one hand, the highest values could be observed within 50 km from the
border, and on the other hand – within a distance of over 500 km, which could indicate that
this was transit traffic across Poland. On the other hand, an analysis of the percentage of
Belarusian tourists indicates that it was visibly the highest in the border belt, and rapidly
decreased up to a distance of 100 km, and then fell more slowly, up to a distance of 250 km
from the border.

99
Fig. 4. Accommodated tourists from Ukraine in powiats and distance from the
border(horizontal axis in kilometres)
a) accommodated Ukrainians per 1000 inhabitants b) Ukrainians as percentage of foreign tourists
Note: The number of accommodated Ukrainian tourists per 1000 population did not show
any distinct irregularities save for marginal cases. However, this number fell noticeably as
the distance from the border increased: at a rapid rate up to a distance of ca. 150 km, and
more slowly at a distance between 150 and 300 km. The impact of the border was greater in
terms of the percentage of Ukrainian tourists in the overall number of foreign tourists. In the
districts situated closest to the border, this share was higher than 40%, fell under 20% at a
distance of 150 km and to less than 10% when the distance from the border was longer than
225 km.
CONCLUSIONS:
The following major conclusions may be drawn on the basis of the analyses made so far:
• In case of tourists from Belarus, there is a visible very strong concentration of
incoming traffic in the eligible area within 100 km from the border, with a minor role
of the adjacent areas and a relatively small significance of large cities (mostly the
environs of Warsaw and Łódź);
• In case of tourists from Ukraine, there is a visible very strong concentration of
incoming traffic in the eligible area and in the adjacent area, primarily in the Rzeszów
subregion and, to a lesser extent, in the Lublin subregion, which do not differ from
the eligible area in the values of these indicators. The significance of travels to
Poland of Ukrainian tourists decreases when the distance from the border is longer
that 200 km, except some districts, including large cities.
• Poles relatively seldom visit Belarus. The capital city is most frequently chosen as a
place of accommodation. It can be expected that the eligible area is also an

100
important destination (save for the eastern part of the Minsk oblast), whereas tourist
visits to the adjacent areas are very rare, with the exception of Minsk.
• Lviv oblast was relatively often visited by Poles with significant concentration of
tourist traffic in City of Lviv. In general eligible area was more attractive for Polish
tourist than adjacent areas, but with certain potential for cross border tourism
development.

101
Appendix 3. Analysis of border traffic
Aim:
The aim of the analysis was to examine the spatial range of cross-border interactions
between Poland and Belarus and Ukraine, based on the available statistical data on border
traffic.
Indicators:
The following indicators were used: the distance of the place of residence from the border
and the distance of the place of shopping on the other side of the border, calculated for
citizens who use border crossings.
Data sources:
The source of data was a report by the Polish Central Statistical Office (GUS) entitled: Border
traffic and movement of goods and services at European Union’s external border on the
territory of Poland in 2011.
Methodology:
The distances were analysed depending on the availability of statistical data, i.e. for the
intervals: 0-30 km, 30-50 km, 50-100 km, 100 or more km.
Generally speaking, in the case of Belarus all the cities within a 100 km radius are located
within the eligible area, whereas the adjacent area begins at a distance of ca. 200 km from
the border. The situation is similar in Ukraine, the only difference being that the adjacent
area begins ca. 150 km from the border. By contrast, practically the entire area of the
Kaliningrad oblast is at a distance of less than 100 km from the border crossings. In Poland,
the adjacent area begins 50 km from the Polish-Ukrainian border and at least 100 km from
the Polish-Belarusian border.
The results were affected by the border regime effective at the time of the survey,
particularly with regard to the existence of the so-called LBT (local border traffic) in a given
territory. Such arrangements were in force at the Polish-Ukrainian borderland were only at a
planning stage at the Polish-Belarusian border.

102
Products:
Fig. 1. Purpose of stay abroad based on border traffic surveys in 2011
Note: On all of Poland’s external borders, the main reason for crossing the border was the
intention to do shopping in the neighbouring country. Foreigners coming to Poland from the
Kaliningrad oblast were an exception since in this particular case transit and tourism were
relatively often cited as the purpose of the travel (however, this took place before the
introduction of LBT arrangements) and, to a lesser degree, also of the travels of Poles to
Belarus, where visits to family and friends were relatively often quoted as the reason for the
travel.
Tab. 1. Citizens crossing the Polish-Belarusian border by place of accommodation and
purpose of travel
Distance from the border] (km) 0-30 30-50 50-100 Over 100
Polish-Belarusian border
- foreigners place of residence (in BY) 58.8 12.1 14.3 14.8
- foreigners shopping (in PL) 24.8 26.3 37.9 11.0
- Poles place of residence (in PL) 47.8 22.1 25.7 4.5
- Poles shopping (in BY) 85.9 6.8 3.4 4.0
Polish-Ukrainian border
- foreigners place of residence (in UA) 67.5 8.2 15.2 9.1
- foreigners shopping (PL) 77.0 11.0 7.1 4.9
- Poles place of residence (PL) 52.7 18.6 21.4 7.3
- Poles shopping (UA) 93.2 1.4 3.6 1.8
Note: Travels to Belarus were strongly concentrated in the border belt up to 30 km from the
border crossing, particularly in the case of Polish citizens, fewer than 15% of whom travelled
to regions located further away, and only 4% travelled longer distances than 100 km from
the border. On the other hand, only some 30% Belarusians stayed at a distance of over 50
103
km from the border, with as few as 15% coming from regions located further away.
Belarusians went shopping in Poland mainly in the belt located up to 50 km from the border,
although as many as 49% travelled further than 50 km from the border, but only 11% went
further than 100 km.
Travels to Ukraine were also strongly concentrated in the border belt, a situation caused
probably by the LBT regulations. One in two Poles lived at a distance up to 30 km from the
border, but as many as 93% went shopping to places located less than 30 km from the
border, and only 1.8% travelled more than 100 km. On the other hand, 67.5% foreigners
(Ukrainians) lived in the border belt, and fewer than 10% travelled from regions located over
100 km from the border. They also went shopping in the border belt (77%), and only 12%
travelled more than 50 km from the border.
CONCLUSIONS:
The following major conclusions may be drawn on the basis of the analyses made so far:
• As regards the Polish-Belarusian border, the delimitation of the eligible area on the
Polish side of the border is adequate in relation to the directions of border traffic,
and on the Belarusian side there is a visible concentration of traffic in the eligible
area, save for the eastern part of the Minsk oblast and a negligible role of the
adjacent areas in Belarus (they represent destinations for fewer than 4% of all
citizens who cross the border to do shopping);
• As regards the Polish-Ukrainian border, the delimitation of the eligible area on the
Polish side of the border is adequate in relation to the directions of border traffic,
and the role of the adjacent areas in the 50-100 km belt is relatively small (with 7% of
citizens crossing the border for shopping purposes); a similar situation can be
observed on the Ukrainian side, where the adjacent areas situated further than 100
km are destinations for fewer than 8% of those who cross the border to do shopping.

104
Appendix 4. Analysis of cross-border ecosystems
Aim:
The aim of the analysis was to identify major cross-border ecosystems situated at the Polish-
Belarusian-Ukrainian border.
Indicators:
The analysis involves the drainage basins of the rivers crossing international borders as well
as other natural complexes such as the biggest wooded areas (in lowlands, uplands and
mountains).
Data sources:
The following documents and studies were used as sources of environmental information:
• Koncepcja Przestrzennego Zagospodarowania Kraju [The national spatial
development concept], Ministry of Regional Development, 2011.
• B. Kawałko, 2011, ‘Wybrane problemy polsko-ukraińskiej współpracy transgranicznej’
[Selected issues concerning Polish-Ukrainian cross-border cooperation, Barometr
Regionalny No. 2(24).
Methodology:
On the basis of the available sources relating to the hydrographic network (including the
drainage basin boundaries of the major rivers) and the location of the major natural
complexes (including forest complexes), a list was prepared of districts/raions which
incorporate parts of these ecosystems. In case of the river network, the adopted principle
was that of non-transference of cross-border impacts, save for the international border
rivers.

105
Products:
Fig. 1. Cross-border ecosystems at the Polish
administrative division
border ecosystems at the Polish-Belarusian-Ukrainian borders and the Ukrainian borders and the

106
Note: The Białowieża Forest is the key cross-border component at the Polish-Belarusian
border. Other ecosystems of some significance include the Narew and the Bug drainage
basins on the Belarusian side, and the Neman drainage basin on the Polish side. On the
Polish-Ukrainian border, the major ecosystem is formed by the drainage basin of the San and
the Bug and, to a lesser extent, by the drainage basin of the Dniester. Others include the
ecosystem of Western Polesia, Roztocze hills, the Przemyśl Plateau and the Eastern Beskids
(Bieszczady Mountains).
The map demonstrates that the cross-border impacts on the Polish side are concentrated in
the relatively narrow belt of districts situated in the Podlaskie, Lubelskie and Podkarpackie
voivodships; in Belarus – in the border raions of the Brest oblast and, to a lesser extent, of
the Grodno oblast, and in Ukraine – in the border raions of the Volyn, Lviv and Zakarpattia
oblasts.
CONCLUSIONS:
The following major conclusions may be drawn on the basis of the analyses made so far:
• The range of the cross-border ecosystems on the Polish-Belarusian-Ukrainian borders
is much smaller than that of the current eligible area, being in fact confined within
the belt of districts situated directly along the border (with very few exceptions). In
effect, their cross-border impacts are considerably limited, in the case of the
Ostrołeka-Siedlce subregion in the Mazowieckie voivodship (adjacent areas), of the
Rzeszów and Tarnobrzeg subregions in the Podkarpackie voivodship and of the Lublin
and Puławy subregions in the Lubelskie voivodship. There is a similar situation in the
case of the adjacent areas situated in Belarus and Ukraine.

107
Appendix 5. Analysis of twinning cities co-operation
Aim:
The aim of the analysis was to identify major cross-border ecosystems situated at the Polish-
Belarusian-Ukrainian border.
Indicators:
The following indicators were selected for analysis:
• LQ total – location quotient for city twinning agreements between cities/communes
in the cross-border area and neighbouring countries;
• LQ cross-border area – location quotient for city twinning agreements between
cities/communes in the cross-border area and cities/communes in neighbouring
countries.
The data shows the state of the indicators as of autumn 2011. The value of LQ above 1
means that CBC cooperation is relatively well developed in comparison to country average,
while below 1 means the opposite.
Data sources:
The data on twinning cities were collected in the framework of ESPON TERCO project7. More
information can be found in the publication: Płoszaj Adam (2013) Two Faces of Territorial
Cooperation in Europe: Twinning Cities and European Territorial Cooperation Programmes
[in:] Gorzelak Grzegorz, Zawalińska Katarzyna (eds.): European Territories: From Cooperation
to Integration? Warszawa: Wydawnictwo Naukowe Scholar, pp. 69-96.
Methodology:
As part of the exercise, thematic maps were prepared to show the LQ values broken down
by districts/raions and project value, broken down by NUTS3/raions per capita.
7 www.esponterco.eu

108
Fig. 1. Location quotient for city twinning agreements between cities/communes in the
cross-border area and neighbouring countries – Poland-Belarus-Ukraine
Note: Twinning cities cooperation between Poland, Belarus and Ukraine is relatively
important for most of subregions and oblasts in the analysed cross-border area. Only the
Zakarpatska oblast and Mińsk oblast have values of the LQ below 1. Highest value of the LQ
is reached by Bialski podregion, but this is due to the low number of twinning cities
agreements in general in this subregion.

109
Fig. 2. Location quotient for city twinning agreements between cities/communes in the
cross-border area and cities/communes in neighbouring countries
Note: Location quotient based on city twinning agreements between cities/communes in the
cross-border area (i.e. excluding agreements going beyond the area) shows even more
important concentration of this kind of cooperation. Only for the Minsk oblast in Belarus as
well as Rivne oblast and Ternopil oblast in the Ukraine LQ values are lower than 1 what can
suggest that the in their case twinning cities cooperation with partners from cross
area is not very important (or not very well developed).
ocation quotient for city twinning agreements between cities/communes in the
cities/communes in neighbouring countries – Poland
Location quotient based on city twinning agreements between cities/communes in the
border area (i.e. excluding agreements going beyond the area) shows even more
ncentration of this kind of cooperation. Only for the Minsk oblast in Belarus as
well as Rivne oblast and Ternopil oblast in the Ukraine LQ values are lower than 1 what can
suggest that the in their case twinning cities cooperation with partners from cross
area is not very important (or not very well developed).
ocation quotient for city twinning agreements between cities/communes in the
Poland-Belarus-Ukraine
Location quotient based on city twinning agreements between cities/communes in the
border area (i.e. excluding agreements going beyond the area) shows even more
ncentration of this kind of cooperation. Only for the Minsk oblast in Belarus as
well as Rivne oblast and Ternopil oblast in the Ukraine LQ values are lower than 1 what can
suggest that the in their case twinning cities cooperation with partners from cross-border
110
CONCLUSIONS:
Twinning cities cooperation can be seen as important form of cooperation in analysed cross
border areas. However the intensity of the cooperation seems to be higher in
subregions/oblasts located closer to the national borders and lower in subregions/oblasts
located further away from the border (this is true especially for adjacent areas in the Ukraine
and Belarus).

111
Appendix 6. Analysis of Programme beneficiaries
Aim:
The aim of the analysis was to discuss the spatial extent of cross-border cooperation
between Poland, Belarus and Ukraine based on the Contracting Authority’s database of the
beneficiaries of the Programmes operating in 2004-2006 and 2007-2013.
Indicators:
The following indicators were selected for analysis:
• Number of beneficiaries of projects in the Neighbourhood Programme PL-BY-UA
INTERREG IIIA 2004-2006 (Small Projects Fund excluded) on Polish side of the border
and Programme CBC PL-BY-UA 2007-2013 on both side of the border;
• Estimated value of projects implemented under Programme CBC 2007-2013 per 1000
population (under the assumption of project’s implementation in location of
beneficiary).
Data sources:
The data sources included the databases of beneficiaries and projects in the 2007-2013
Programmes, made available by the Contracting Authority. For Poland, the period 2004-2006
financed under INTERREG IIIA was also taken into account. However, this period was left out
of the analysis in case of the Eastern partners where the funding was provided under the
TACIS CBC Programme.
Methodology:
As part of the exercise, thematic maps were prepared to show the numbers of beneficiaries
broken down by districts/raions and project value, broken down by NUTS3/raions per capita.

112
Products:
Fig. 1. Number of beneficiaries of Poland
districts (for Poland also Neighbourhood Programme
Note: The concentration of beneficiaries by location was visible higher on the Polish side,
with major located in the cities of: Białystok, Chełm, Lublin, Rzeszów, Hajnówka, Suwałki,
and, to a lesser extent, Zamość and Jarosław. On this basis, it can be conclud
beneficiaries were of considerable significance in the adjacent areas, especially the Lublin
and Rzeszów subregions (plus Łomża, although to a lesser extent). In Ukraine, the key
beneficiary locations in the 2007
border oblasts. There were considerably fewer beneficiaries in other raions of the Lviv and
Volyn oblasts, some of which lie directly on the border. Likewise, there were few
Fig. 1. Number of beneficiaries of Poland-Belarus-Ukraine CBC Programme 2007
also Neighbourhood Programme 2004-2006 was included
The concentration of beneficiaries by location was visible higher on the Polish side,
with major located in the cities of: Białystok, Chełm, Lublin, Rzeszów, Hajnówka, Suwałki,
and, to a lesser extent, Zamość and Jarosław. On this basis, it can be conclud
beneficiaries were of considerable significance in the adjacent areas, especially the Lublin
and Rzeszów subregions (plus Łomża, although to a lesser extent). In Ukraine, the key
beneficiary locations in the 2007-2013 period were Lviv and Lutsk, as the capitals of the
oblasts. There were considerably fewer beneficiaries in other raions of the Lviv and
Volyn oblasts, some of which lie directly on the border. Likewise, there were few
Ukraine CBC Programme 2007-2013, by
was included)
The concentration of beneficiaries by location was visible higher on the Polish side,
with major located in the cities of: Białystok, Chełm, Lublin, Rzeszów, Hajnówka, Suwałki,
and, to a lesser extent, Zamość and Jarosław. On this basis, it can be concluded that the
beneficiaries were of considerable significance in the adjacent areas, especially the Lublin
and Rzeszów subregions (plus Łomża, although to a lesser extent). In Ukraine, the key
, as the capitals of the
oblasts. There were considerably fewer beneficiaries in other raions of the Lviv and
Volyn oblasts, some of which lie directly on the border. Likewise, there were few

113
beneficiaries in the Zakarpatska oblast, and they were considerably dispersed. The
beneficiaries in the Programme’s adjacent area on the Ukrainian side of the border were
mainly located in the oblast capitals: Ivano-Frankivsk, Ternopil and Rivne. The major
locations in Belarus were Brest and Grodno, in addition to Minsk, situated in the adjacent
area. Other than those, there were some individual projects in the Grodno and Brest oblasts,
with no beneficiaries to be found in the western part of the Minsk oblast and in the Gomel
oblast.

114
Fig. 2. Estimated value of projects implemented under the Poland-Belarus-Ukraine CBC
Programme per capita, by NUTS3/oblast in 2007-2013 (in cathegories based on natural break
method)
Note: On the Polish side of the border, the largest concentration of the project value per
capita could be observed in the Białystok and Zamość subregions. High values of this
indicator could also be found in the remaining subregions of the Podkarpackie voivodship,
including Rzeszów (with the exception of the Tarnobrzeg subregion), and in the Podlaskie
voivodship (with the exception of the Suwałki subregion). These were followed by the
border oblasts in Belarus and the Volyn oblast in Ukraine. In terms of the population, the
volume of funding was smaller in the Lviv and Zakarpatska oblasts, and in Poland – in the

115
remaining subregions of the Lubelskie voivodship (with the exception of the Puławy
subregion, where there were no projects supported from the Programme funds). Much
smaller amounts were invested in the adjacent areas, which was well visible in the Puławy
and Tarnobrzeg subregions and in the adjacent Ukrainian oblasts. Similarly, there were no
projects implemented in the eastern part of the Minsk oblast. Small absorption of the
Programme funds could also be observed in the Mazowieckie voivodship, in its Ostrołeka
and Siedlce subregion, due to the subregion’s exclusion from the Large Scale Projects
component, which absorbed significant part of the allocation.
CONCLUSIONS:
The following major conclusions may be drawn on the basis of the analyses made so far:
• In the Poland-Ukraine-Belarus Neighbourhood Programme INTERREG IIIA 2004-2006
on the Polish side of the border and in the 2007-2013 CBC PL-BY-UA Programme
round, there was a visible, strong concentration of beneficiaries’ location in the belt
of districts lying directly on the border and in the largest cities, situated both in the
eligible area and in the adjacent areas. In the 2004-2006 period in particular, the
beneficiaries were largely concentrated in Lublin, and in the 2007-2013 period - in
Rzeszów. In the years 2007-2013, beneficiaries on the Ukrainian side of the border
were mainly located in Lviv and Lutsk, and also in the major cities of the adjacent
areas. The main location centres in Belarus were Grodno and Brest, as well as Minsk,
a city situated in the adjacent area. With the exception of the latter, no project
beneficiaries were found in the adjacent areas.
• In terms of the concentration of funds per capita, the PL-BY-UA CBC Programme
2007-2013 was quite visibly concentrated in the eligible area, albeit with some
discernible intraregional differences. The role of adjacent areas was small, which can
also be attributed to limitations in access to funding. Minsk was one exception, but in
this particular case it is difficult to establish to what extent this was due to the actual
allocation of funds in this city or rather to the funds being distributed further down in
the structure, at the raion level.

116
Appendix 7. Analysis of survey results
Aim:
The aim of the analysis was to summarise the findings from the surveys on the delimitation
of the eligible area, the existence of the adjacent areas and inclusion of other areas into the
Programme, including large cities.
Data sources:
The data sources were based on the questionnaires circulated among the beneficiaries and
project applicants from the 2004-2006 and 2007-2013 programming periods.
Methodology:
The questionnaire was sent out to beneficiaries and project applicants (incl. micro-projects)
included in the databases made available by the Polish Ministry for Regional Development.
Out of 1970 questionnaires sent to the email addresses provided in the PL-BY-UA
Programme database, 281 questionnaires were returned, this translates into a 15% rate of
return (the effective return rate being even higher since some of the email addresses proved
to be no longer valid).
Products:
Tab. 1. Location of beneficiaries / project applicants
Poland Number % Ukraine Number % Belarus Number %
Total 154 100.0 Total 102 100.0 Total 21 100.0
Lubelskie 56 36.4 Lviv 56 54.9 Brest 11 52.4
Mazowieckie 9 5.8 Volyn 24 23.5 Grodno 9 42.9
Podlaskie 50 32.5 Rivne 4 3.9 Gomel 1 4.8
Podkarpackie 39 25.3 Ternopil 4 3.9 Minsk 0 0.0
Ivano-Frankivsk 3 2.9
Zakarpatska 11 10.8
Note: Polish respondents were relatively evenly distributed among the regions concerned,
with the exception of the Ostrołęka-Siedle subregion, which was represented only by nine
questionnaires. The concentration rate of respondents was much higher in Ukraine, where
55% interviewees who took part in the survey came from the Lviv oblast, another ca. 35% -
from the remaining two eligible areas of Volyn and Zakarpatska, and only 11% from the
adjacent areas. The situation was similar in the case of Belarus, where nearly all respondents
came from the Grodno and Brest voblasts, with only one response originating from the
Gomel voblast.

117
Tab. 2. Location of partners
a) Location – partners of Polish institutions
PL � UA N % PL � BY N %
Total 130 100.0 Total 82 100.0
Lviv 69 53.1 Brest 38 46.3
Volyn 39 30.0 Grodno 36 43.9
Rivne 4 3.1 Gomel 0 0.0
Ternopil 2 1.5 Minsk 8 9.8
Ivano-Frankivsk 7 5.4
Zakarpatska 9 6.9
b) Location – partners of Belarusian and Ukrainian institutions
UA � PL N % BY� PL N %
Total 111 100.0 Total 22 100.0
Lubelskie 56 50.5 Lubelskie 6 27.3
Mazowieckie 5 4.5 Mazowieckie 12 54.5
Podlaskie 4 3.6 Podlaskie 3 13.6
Podkarpackie 46 41.4 Podkarpackie 1 4.5
Note: Partners of Polish institutions were situated first and foremost in the Lviv and Volyn
oblasts, with only 10% located in the Programme’s adjacent area; a similar situation could be
observed in Belarus. Partners of Ukrainian institutions were situated in Lubelskie and
Podkarpackie voivodships, with only 8% in Podlaskie and Mazowieckie. In contrast, most
partners of Belarusian institutions were located in Mazowieckie, and to a lesser extent in
Lubelskie. Only 14% of partner institutions were situated in Podlaskie, but the fact that the
voivodship was so poorly represented could be due to the small number of institutions in the
Belarusian sample.
Tab. 3. Do you think that the Poland-Belarus-Ukraine (PL-BY-UA) CBC Programme 2014-2020
should still allow projects to be implemented by beneficiaries from the adjacent areas? (%)
Poland Belarus Ukraine
N % N % N %
Total 151 100.0 19 100.0 100 100.0
Definitely yes 36 23.8 3 15.8 35 35.0
Yes 44 29.1 4 21.1 28 28.0
Rather yes 18 11.9 8 42.1 14 14.0
Hard to say 19 12.6 1 5.3 8 8.0
Rather no 10 6.6 1 5.3 7 7.0
No 17 11.3 2 10.5 6 6.0
Definitely no 7 4.6 0 0.0 2 2.0
Yes - total 98 64.9 15 78.9 77 77.0
No - total 34 22.5 3 15.8 15 15.0
Weighted average* [average (1-7) – 4]
1.0 1.1 1.5

118
Note: The interviewees from all the surveyed countries were in favour of continued
possibility to implement projects by beneficiaries from the adjacent areas. This view
received relatively the weakest, albeit still quite firm support from the respondents in
Poland, and was most strongly backed by Ukrainian respondents. Arguably, this could be
explained by the existence of a well-developed partnership network with institutions located
in Lublin and Rzeszów.
Tab. 4.Should beneficiaries from outside the eligible area (including large areas) take part in
the PL-BY-UA CBC Programme, provided the project outputs concern the eligible area? (%)
Poland Belarus Ukraine
N % N % N %
Total 149 100.0 20 100.0 102 100.0
Definitely yes 17 11.4 3 15.0 13 12.7
Yes 26 17.4 5 25.0 24 23.5
Rather yes 24 16.1 7 35.0 13 12.7
Hard to say 20 13.4 1 5.0 18 17.6
Rather no 21 14.1 2 10.0 13 12.7
No 24 16.1 2 10.0 19 18.6
Definitely no 17 11.4 0 0.0 2 2.0
Yes - total 67 45.0 15 75.0 50 49.0
No - total 62 41.6 4 20.0 34 33.3
Weighted average* [average (1-7) – 4]
0.0 1.0 0.4
Note: The issue of allowing projects to be implemented by beneficiaries from outside the
Programme eligible area raised some controversy. For all practical purposes, Belarus was the
only country where this concept was supported by the respondents. The concept attracted
slightly more proponents in Ukraine than in Poland, where opinions on this matter were split
nearly evenly.
CONCLUSIONS:
The following major conclusions may be drawn on the basis of the analyses made so far:
• In respect of the Poland-Belarus-Ukraine Programme, the interviewees expressed
strong support for beneficiaries situated in the adjacent areas to be allowed to
implement projects. In part, this could be explained by the location of Lublin and
Rzeszów outside of the eligible area, and these two cities are notable centres of
institutional cooperation with the neighbouring countries. At the same time, the
survey found that both the interest in taking part in the survey and the location of
the partners (with the exception of the case referred to above) were rather marginal
in the adjacent areas; in case of Belarus and Ukraine, the share of such areas did not
as a rule exceed 10% in all the analysed categories, despite the fact that they had
comparable demographic and economic potential to that of the eligible area.
119
• In respect of the Poland-Belarus-Ukraine Programme, the concept of institutions
situated outside of the eligible and adjacent areas being able to implement projects
caused some controversy, and was found attractive by a majority of the respondents
only in Belarus.

120
Appendix 8. Analysis of interviews
Aim:
The aim of the analysis was to discuss the results of the analysis of the interviews concerning
the delimitation of the eligible area, existence of the adjacent areas and inclusion of other
areas, including large cities, into the Programme.
Data sources:
The data sources included the interviews held with the stakeholders of the 2007-2013
Programme round, in the period from 10 June - 3 July 2013.
Methodology:
Based on the detailed interview scenario, information was collected using three methods: a)
during direct face-to-face meetings, b) during recorded telephone conversations, and c)
based on written answers to questions. The latter method was mainly used in interviews
with the Belarusian partners.
Products:
1. In your opinion, what should be the eligible area in the Poland-Ukraine-Belarus 2014-
2020 CBC Programme?
As a rule, the respondents did not see any need to make considerable changes in the
delimitation of the current eligible area of the Poland-Ukraine-Belarus Programme and
found it adequate for the purposes of cross-border cooperation. As regards the adjacent
areas in Poland, the inclusion of Rzeszów and Lublin into the Programme’s eligible area was
considered desirable, first due to the considerable significance of these cities for the present
cross-border cooperation, and second on account of the administrative differences between
the regions on the Polish (NUTS3) vs. Belarusian and Ukrainian sides of the border (NUTS2).
For the adjacent areas in Belarus, weakness of the present cooperation was emphasized,
particularly with the Gomel oblast, and the rationale for its inclusion into the Programme
was questioned. Nevertheless, the Belarusian side argued in favour of its continued
participation in the Programme due to the existing potential for developing Belarusian-
Ukrainian cooperation. Similar doubts were raised with regard to the adjacent areas in
Ukraine. Some respondents also pointed out that weak interactions could also be observed
in relation to the Zakarpatska oblast. On the other hand, some experts indicated the existing
interactions of the adjacent areas, both those historically rooted and those associated with
the present labour migration.
2. Do you think that the current so-called adjacent areas PL-BY-UA (PL – NUTS Łomża,
Lublin, Puławy, Rzeszów, Tarnobrzeg, BY – eastern part of the Minsk, Gomel voblast,
UA – Rivne, Ternopil and Ivano-Frankivsk oblasts) play a significant role in cross-
border cooperation between Poland, Ukraine and Belarus?

121
The significance of the adjacent areas in Poland was particularly strongly emphasized for the
Rzeszów and Lublin subregions, whereas practically all respondents on the eastern side of
the border stressed their marginal importance. One exception was Minsk and the Minsk
oblast – according to Belarusian respondents, these two units should be incorporated into
the Programme. In the respondents’ opinion, lesser interest expressed by potential
beneficiaries in these areas could be attributed to the absence of the infrastructure
component which is especially pertinent, taking into account the low development level of
the regions in question.
3. Do you think that other territorial units (state capitals, main urban centres of the
neighbouring regions) situated outside of the eligible area should be incorporated
into the Programme, and if so, how should this be done?
Some respondents were definitely against such a possibility, emphasizing its artificiality and
difficulties in demonstrating the cross-border effect and pointed out that this would cripple
the development of the institutional potential of beneficiaries located in the eligible area. In
contrast, the proponents stressed the fact that some key institutions responsible e.g. for
border infrastructure are based in the state capital, a consideration that should be taken into
account while designing the Programme.
4. How do you view the concept to concentrate the funding in a belt of districts (raions)
directly adjoining the border?
Respondents fully agreed on the need to increase the concentration of funds in the belt of
the border districts. All the respondents emphasized that this should particularly apply to
infrastructure projects, while allowing the possibility to implement ‘soft’ projects at a longer
distance from the border. Some respondents believed that such increased concentration
should comprise the belt of two districts or the subregions situated directly on the border.
Nonetheless, some opinions were also voiced that such a change, however, could lead to
excessive disproportions within the eligible area, particularly on the eastern side of the
border.

122
Appendix 9. Socio-economic indicators
Tab. 1. Basic characteristic of Programme CBC PL-BY-UA eligible area – economic capital
Indicator Area (km2) Population ('000) GDP per capita (EUR)
GDP per capita (country average=100)
SME's per 1000 inhabitants
R&D employment per 1000 employees
GVA Agriculture %
GVA Industry % GVA Services %
Year 2012 2008 2012 2010 2010 2012 2012 2010 2010 2010
PL - eligible area 65 148 5 096 5 137
6 548 70.5 76.9 5.2 8.2 27.9 63.9
BY - eligible area 54 710 4 839 4 830
1 635 63.8 22.6 2.2 11.9 21.2 66.9
UA - eligible area 57 786 2 496 2 453
2 904 64.5 7.7 1.0 14.9 44.9 40.2
Tab. 2. Basic characteristic of Programme CBC PL-BY-UA eligible area – natural capital
Indicator Area covered by national parks (% of total area)
Afforestation rate (%)
Emission of air pollutants (w/o CO2) from main stationary sources per capita (kg)
Access to a sewage network (% of population)
Number of hot-spots according to HELCOM
Sewage network put into operation (total km)
Capital expenditure on fixed assets for environmental protection and water management (€)
Year 2012 2012 2011 2011 2012
2007-2011 2011
PL - eligible area 2.4 29.0
13.5 55.1 2
5598.4 65.6
BY - eligible area 3.0 34.1
27.5 67.8 2
- 18.1 (2010)
UA - eligible area 3.9 32.8
31.5 - 1
- -
Tab. 3. Basic characteristic of Programme CBC PL-BY-UA eligible area – social and human capital
Wskaźnik Population in pre-working age (%)
Population in working age (%)
Population in post-working age (%)
Students per 1 thousand inhabitants
Population with higher education (%)
Non-governmental organizations per 10 thousands inhabitants
Registered crimes per 1 thousand inhabitants
Year 2011 2011 2011 2011 2011 (Białoruś: 2009) 2012 2011
PL – eligible area 19,3 63,5 17,2 46 13,7 30 22
BY – eligible area 17,2 59,5 23,2 28 13,8 - 10,9
UA – eligible area 18,3 60,5 21,2 44 - 16,4 6,6

123
Appendix 10. Barriers to cross-border cooperation based on survey
results
The data were based on the questionnaires circulated among the beneficiaries and project
applicants from the 2004-2006 and 2007-2013 programming periods in eligible areas.
Tab. 1. How do you view current cross-border cooperation between Poland and the
neighbouring countries in relation to the potential existing in the following areas?
Sphere
Polish-Ukrainian cooperation Polish-Belarusian cooperation
Average (1 – very bad 5- very good)
Standard deviation
Average (1 – very bad 5- very good)
Standard deviation
All respondents (N=258) (N=247)
Economic 2.8 0.9 2.3 1.2
Socio-cultural 3.5 0.9 2.7 1.3
Institutional 3.3 0.9 2.4 1.3
Polish respondents (N=141) (N=148)
Economic 2.8 0.8 2.5 1.1
Socio-cultural 3.5 0.9 2.9 1.1
Institutional 3.3 0.9 2.6 1.1
Ukrainian respondents (N=100) (N=80)
Economic 2.9 1.0 2.5 1.2
Socio-cultural 3.6 1.0 3.1 1.3
Institutional 3.2 1.0 2.5 1.5
Belarusian respondents (N=17) (N=19)
Economic 3.4 0.5 2.1 1.4
Socio-cultural 3.7 0.6 2.2 1.4
Institutional 3.4 0.5 2.1 1.3

124
Tab. 2. Can you please name the major barriers in individual areas of cross-border
cooperation between Poland and the neighbouring countries, which are associated with the
presence of the state border and assess their significance?
Barriers Polish-Ukrainian cooperation Polish-Belarusian cooperation
Barrier (yes)
% of N
Significance (1- small 5-large)
Barrier (yes)
% of N
Significance (1-small 5-large)
Economic cooperation
Legislative-institutional 215 83.3 3.6 134 76.6 4.1
Border regime 217 84.1 3.9 132 75.4 4.3
Infrastructural 190 73.6 3.5 113 64.6 3.7
Economic 184 71.3 3.3 105 60.0 3.5
Cultural 166 64.3 2.0 99 56.6 2.5
Socio-cultural cooperation
Legislative-institutional 193 74.8 3.1 122 69.7 3.8
Border regime 208 80.6 3.8 121 69.1 4.0
Infrastructural 175 67.8 3.4 98 56.0 3.6
Economic 164 63.6 3.0 90 51.4 3.2
Cultural 169 65.5 2.2 97 55.4 2.5
Institutional cooperation
Legislative-institutional 208 80.6 3.5 129 73.7 4.1
Border regime 199 77.1 3.6 123 70.3 4.1
Infrastructural 171 66.3 3.3 96 54.9 3.6
Economic 168 65.1 3.2 92 52.6 3.3
Cultural 157 60.9 2.2 92 52.6 2.6
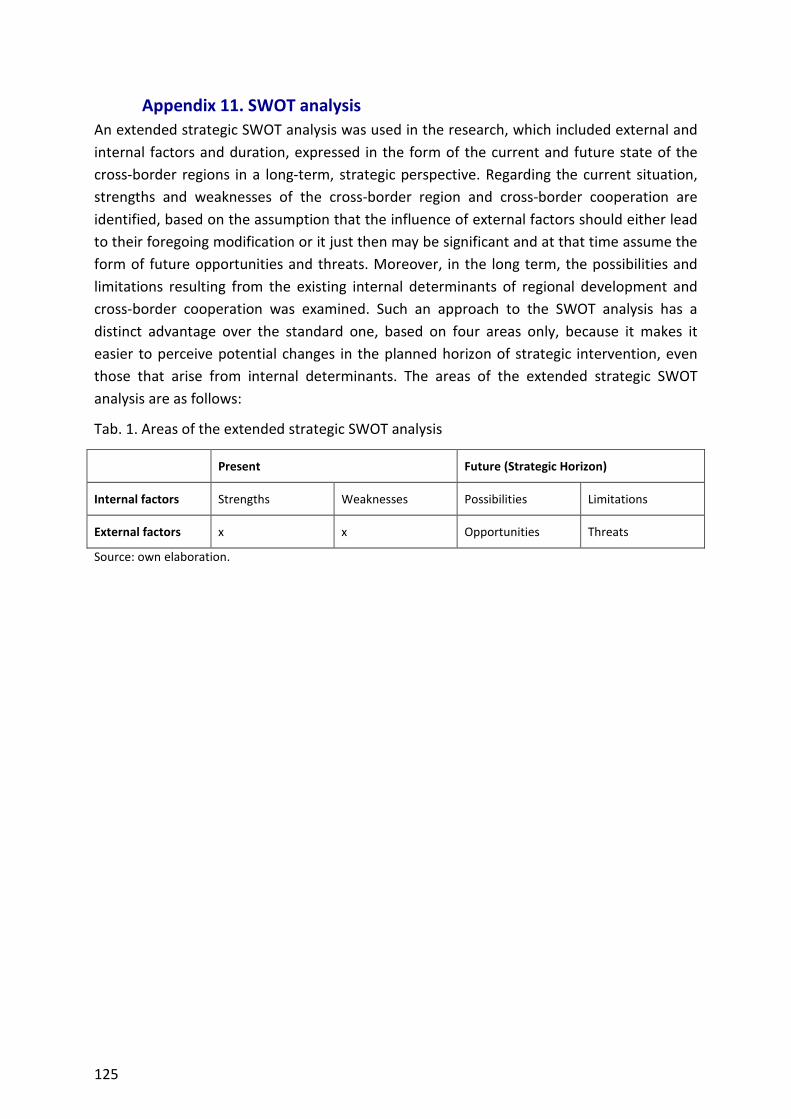
125
Appendix 11. SWOT analysis
An extended strategic SWOT analysis was used in the research, which included external and
internal factors and duration, expressed in the form of the current and future state of the
cross-border regions in a long-term, strategic perspective. Regarding the current situation,
strengths and weaknesses of the cross-border region and cross-border cooperation are
identified, based on the assumption that the influence of external factors should either lead
to their foregoing modification or it just then may be significant and at that time assume the
form of future opportunities and threats. Moreover, in the long term, the possibilities and
limitations resulting from the existing internal determinants of regional development and
cross-border cooperation was examined. Such an approach to the SWOT analysis has a
distinct advantage over the standard one, based on four areas only, because it makes it
easier to perceive potential changes in the planned horizon of strategic intervention, even
those that arise from internal determinants. The areas of the extended strategic SWOT
analysis are as follows:
Tab. 1. Areas of the extended strategic SWOT analysis
Present Future (Strategic Horizon)
Internal factors Strengths Weaknesses Possibilities Limitations
External factors x x Opportunities Threats
Source: own elaboration.

126
Appendix 12. TOWS analysis
The TOWS analysis is a well-established strategic method (Obłój 2007). Although it is
generally used for analyses of organisations, it can also be successfully applied for analysing
territorial units. The TOWS analysis is based on the results of the SWOT analysis and
involvesan examination of those areas of the SWOT analysis which influence each other the
most. For the purposes of the TOWS analysis, the results of the extended SWOT analysis are
simplified into four areas. The possibilities were with the opportunities and the limitations -
with threats. This approach is justified by the fact that the connected areas are related to the
future. The TOWS analysis is performed by creating eight compositions which answer the
questions:
• Does a given strength support an opportunity/possibility?
• Does a given strength allow to overcome threats/limitations?
• Does a given weakness hinder a given opportunity/possibility?
• Does a given weakness increase the potential of threats/limitations?
• Does a given opportunity/possibility increase a given strength?
• Does a given opportunity/possibility allow to overcome a given weakness?
• Does a given threat/limitation hinder a given strength?
• Does a given threat/limitation increase a given weakness?
The results are presented in the form of a table and measured quantitatively. Based on the
calculations, we obtain a cross table which shows the number and the strength of the
interactions between the fields of the SWOT analysis. On this basis, it is possible to
determine the recommended strategy, viz.:
• “Aggressive” strategy: using the opportunities/possibilities and strengths;
• “Competitive” strategy: using the opportunities/possibilities and weaknesses;
• “Conservative” strategy: neutralization of threats/limitations using strengths;
• “Defensive strategy”: neutralization of threats/limitations and limiting
weaknesses;
Tab. 1. Normative strategy matrix
Opportunities/possibilities Threats/limitations
Strengths Aggressive strategy Conservative strategy
Weaknesses Competitive strategy Defensive strategy
Source: Obłój 2007, p. 337.


