Expert System for Characterization of Electroencephalography (EEG)_IMP
4
Student Conference on Research and Development (SCOReD) 2003 Proceedings, P utrajaya, Malaysia Expert System for Characterization of Electroencephalography (EEG) Signals to Detect Sleep Onset F. A. Hamid', A. Hussain', ' A . Mohamed', M . A . Mohd Alii, B . Yeop Majli;', R. A. AI?, and A . S . Mohamed4 'EESE Dept., Faculty ofEngineEririf;g Institute of Microengineering and N anoelectronics Universiti Kebangsaan Malaysia, 43600 UKM B angi Selango r Dam1 Ehsan, Malaysia Dept. o f Othorhinolaryngology & 'Dept. o f Medicine Faculty o f Medicine, Universiti Kebangsaan Malaysia 56000 Cheras, Kuala Lumpu r, Malaysia e-maiI: imah~v1si.cne.ukni.n~~~ ini(ii2eiie.~IkIn,iny, zah~~cug.~~kni.mp, [email protected] & burliau(iilenq. ikmmy 4 Abstract- This paper describes the development of an approach that uses expert system to differentiate various stages of sleep: i.e. from awake state to stage I1 sleep. An expert system that performs sleep staging using the ' characteristics analysis of the human sleeps. electroencephalogr aphy (EEG) signals is presented. The ' Kappa PC expert system shell, th e frequencies and waveforms characteristics of the EEG signals were used in he implementation ofthe sleep on set detection. Keywords Driver drowsiness, sleep onset, expert system, electroencephalography. I. INTRODUCTION Driver drowsiness is a n important risk on the roads in which it is one of he main factors leading to accidents or near-missed accidents, This fact has been proven by many studies that have established links between driver drowsiness an d road accidents. Therefore, it crucial to develop methods so as to reduce risks of accidents due to drowsiness. Presently, several studies have tried to model th e behavio r of drowsy driver by e stablishing links between drowsiness and certain parameters related to vehicle as well as the driver [ I ] &[2]. Sleep onset detection can be used to prevent driver drowsiness that gives major implication in transportation system safety. EEG signal has been found to be the mast predictive and reliable indicator of detecting the onset of sleep [ 1 1 . Therefore, it is important to understand the characteristics of EE G signal in order to determine when the drowsiness begins. EXPERIMENTAL SETUP In this work, the data from three normal persons aged between 23 and 31 years were recorded using sampling rate o f 25 6 Hz . Subjects were requested to perform brain-related activities such as reading and perfodng simple calculation. No filtering was apphed to the data during recording. The subjects were seated i n a sound- controlled room with dim lighting and air-conditioner unit switched on for providing extra comfort to the subjects. Subjects were also asked to abstain from taking excessive caffeine and naps on the day prior to testing. Additionally, they were asked to reduce their sleep during the night prior to testing so that subjec ts will be deprived from their sleep. Eighteen electrodes are placed over the scalp and connected by wires to an EEG machine. Surface electrodes are placed at specific locations on the subjects scalp as recommended by lnternationnl Electrocnc~pphalograpli~ rid Clinical Neurophysiology (SEEGCN). The system is known as the '10-20 System' since it is derived by 10% an d 20 % measurements relative to four scalp landmarks [3]. The signals from he brain are very small (measured in pV ) and therefore, amplification is required before the electrical signals are displayed and stored. To classify the EE G signals, the power spectral density (PSD) s extracted for values within the range of the delta, theta, alpha and beta waves i.e. from 0. 5 to 30 Hz . No pre-filtering or artifact removal was applied to the data. Fig. l(a) shows the EE G signal as recorded by the MEDELEC machine whil e Fig. 1 (b) depicts the I second duration of the single channel plot for T5-01 lectrode. In Fig. l(c) and (d), the Fast Fourier Transform (FFT) plot and PSD plot are shown, respectively. 0-7803-8 173-4/03/$17.00 02003 IEEE. 5 Authorized licensed use limited to: NATIONAL INSTITUT E OF TECHNOLOGY ROURKELA. Downl oaded on July 29,2010 at 14:54:21 UTC from IEEE Xplore. Restrictions apply.
Transcript of Expert System for Characterization of Electroencephalography (EEG)_IMP
8/8/2019 Expert System for Characterization of Electroencephalography (EEG)_IMP
http://slidepdf.com/reader/full/expert-system-for-characterization-of-electroencephalography-eegimp 1/4
Student Conference on Research and Development (SCOR eD) 2003 Proceedings, P utrajaya, Malaysia
Expert System for Characterization of Electroencephalography (EEG)
Signals to Detect Sleep Onset
F. A. Hamid', A. Hussain', 'A . Mohamed', M. A. Mohd Alii,B . Yeop Majli;', R. A. AI?, and A. S . Mohamed4
'EESE Dept., Faculty ofEngineEririf;g Institute of Microengineering and N anoelectronics
Universiti Kebangsaan Malaysia, 43600 UKM B angiSelango r Dam1 Ehsan, MalaysiaDept. o f Othorhinolaryngology& 'Dept. of Medicine
Faculty o f Medicine, Universiti Kebangsaan Malaysia56000 Cheras, Kuala Lumpu r, Malaysia
e-maiI:i m a h ~ v 1 s i . c n e . u k n i . n ~ ~ ~ini(ii2eiie.~IkIn,iny, z a h ~ ~ c u g . ~ ~ k n i . m p ,
[email protected] & burliau(iilenq. ikmmy
4
Abstract- This paper describes the development of an
approach that uses expert system to differentiate various
stages of sleep: i.e. from awake state to stage I1 sleep. An
expert system that performs sleep staging using the' characteristics analysis of the human sleeps.
electroencephalography (EEG) signals is presented. The
' Kappa PC expert system shell, the frequencies andwaveforms characteristics of the EEG signals were usedin he implementation ofth e sleep on set detection.
Keywords
Driver drowsiness, sleep onset, expert system,
electroencephalography.
I. INTRODUCTION
Driver drowsiness is a n important risk on the roads inwhich it is one of he main factors leading to accidentsor near-missed accidents, This fact has been proven by
many studies that have established links between driverdrowsiness and road accidents. Therefore, it is crucial to
develop methods so as to reduce risks of accidents dueto drowsiness.
Presently, several studies have tried to model thebehavio r of drowsy driver by e stablishing links between
drowsiness and certain parameters related to vehicle as
well as the driver [ I ] &[2]. Sleep onset detection can be
used to prevent driver drowsiness that gives majorimplication in transportation system safety. EEG signal
has been found to be the mast predictive and reliable
indicator of detecting the onset of sleep [11.
Therefore, it is important to understand thecharacteristics of EEG signal in order to determinewhen the drowsiness begins.
LL. EXPERIMENTALSETUP
In this work, the data from three normal persons agedbetween 23 and 31 years were recorded using samplingrate of 25 6 Hz. Subjects were requested to performbrain-related activities such as reading and perfodng
simple calculation. No filtering was apphed to the data
during recording. The subjects were seated in a sound-
controlled room with dim lighting and air-conditioner
unit switched on for providing extra comfort to the
subjects.
Subjects were also asked to abstain from taking
excessive caffeine and naps on the day prior to testing.Additionally, they were asked to reduce their sleep
during the night prior to testing so that subjec ts will bedeprived from their sleep. Eighteen electrodes are
placed over the scalp and connected by wires to an EEGmachine. Surface electrodes are placed at specificlocations on the subjects scalp as recommended by
lnternationnl Electrocnc~pphalograpli~ rid ClinicalNeurophysiology (SEEGCN).
The system is known as the '10-20 System' since it is
derived by 10% and 20 % measurements relative to four
scalp landmarks [3]. The signals from he brain are verysmall (measured in pV) and therefore, amplification isrequired before the electrical signals are displayed and
stored. To classify the EEG signals, the power spectraldensity (PSD) s extracted for values within the range of
the delta, theta, alpha and beta waves i.e. from 0.5 to 30
Hz.
No pre-filtering or artifact removal was applied to the
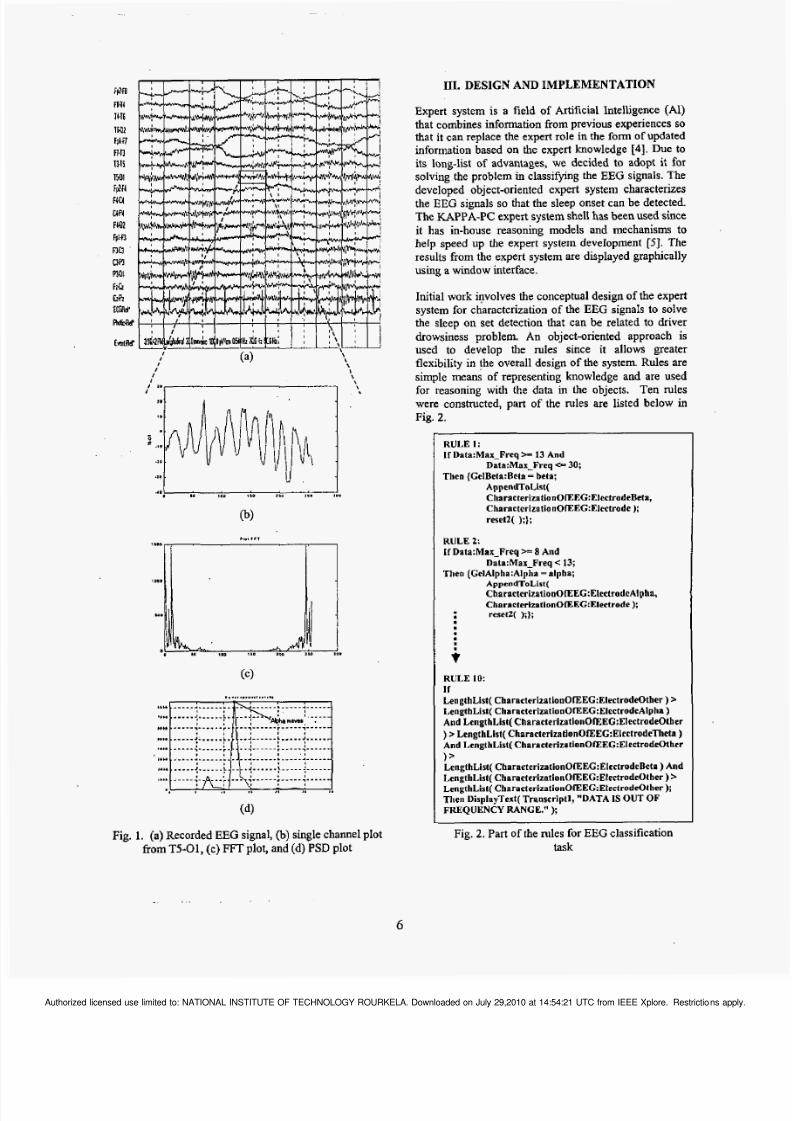
data. Fig. l(a) shows the EEG signal as recorded by theMEDELECmachine while Fig. 1 (b) depicts the I second
duration of the single channel plot for T5-01 lectrode.
In Fig. l(c) and (d), the Fast Fourier Transform (FFT)plot and PSD plot are shown, respectively.
0-7803-8 173-4/03/$17.00 02003 IEEE.5
Authorized licensed use limited to: NATIONAL INSTITUTE OF TECHNOLOGY ROURKELA. Downloaded on July 29,2010 at 14:54:21 UTC from IEEE Xplore. Restrictions app
8/8/2019 Expert System for Characterization of Electroencephalography (EEG)_IMP
http://slidepdf.com/reader/full/expert-system-for-characterization-of-electroencephalography-eegimp 2/4
II
II
I
\4\
I
,
Fig. 1. (a) Recorded EEG signal, (b) single channel plotfrom TS-01, (c) FFT plot, and (d) PSD plot
111. DESIGNAND MPLEMENTATION
Expert system is a field of Artificial Intelligence (AI)
that combines information from previous experiences sothat it can replace the expert role in the form of updatedinformation based on the expert knowledge [4].Due toits long-list of advantages, we decided to adopt it forsolving the problem in classifying the EEG signals. The
developed object-oriented expert system characterizesthe EEG signals so that the sleep onset can be detected.Th e KAPPA-PC expert system shelf hasbeen used since
it has in-house reasoning models and mechanisms tohelp speed up the expert system development [SI.Th e
results from the expert system are displayed graphicallyusing a window interface.
Initial work involves the conce ptual design of the expertsystem for characterization of the EEG signaIs to solvethe sleep on set detection that can be related to driver
drowsiness problem. An object-oriented approach isused to develop the d e s since it allows greaterflexibility in the overall design of the system. Rules are
simple means of representing knowledge and are usedfor reasoning with the data in the objects. Ten rules
were constructed, part of the rules are listed below inFig. 2,
RULE 1:
I f Data:Max-Freq * 3 And
Then (Ce1Beta:Betn= beta;
Dnta:Max-Frcq 30;
AppcndToList(
CharacterizatianOfEEG:ElectrodeBeta,
Chnracterization0fEEG:Electrode ):
reset2( );};
RULE 7:
If Data:Max_Freq+ And
Data:Max-Freq < 13;Then (GelA1pha:Alpha =alpha;
AppendToList(
CharacterizatioaOfEEC:ElcctrodcAIpha,Charncterlzntion0fEEG:Electrode :
reset2( );};.
i
RULE 10:
LengthList( Charncterizatian0fEEC:ElectrodeOther ) 5
LengthList( Charscterization0EEG:ElectrodeAlpha )
And LengthList( Characterization0l'EEC:ElectrodeOther
)>LengthList( Characterization0fEEEC:ElectrodeTheta
And LengthList( Chnrncterizntion0lEEC:ElectrodcOthcr
1'LengthList( Charactcrization0CEEG:ElcctrodeBeta AndLengthList( Charaetcrization0lEEG:EfectrodcOther >LengthList( Charaeterization0lEEG:EtectrodeOther ;
Then DisplayTextt Transcriptl, "DATA IS OUT OFFREQUENCY RANGE." ;
i r
Fig. 2. Part of the rules forEEG classification
task
6
Authorized licensed use limited to: NATIONAL INSTITUTE OF TECHNOLOGY ROURKELA. Downloaded on July 29,2010 at 14:54:21 UTC from IEEE Xplore. Restrictions appl
8/8/2019 Expert System for Characterization of Electroencephalography (EEG)_IMP
http://slidepdf.com/reader/full/expert-system-for-characterization-of-electroencephalography-eegimp 3/4
INTRODUCTIONESINTRODUCTIQN 9
INOIWDUAL NO
I Y E S IC H O O 5
ELECTRODE
INDlV lDUAL
TESTING
(USING RULE 1 -5 )I . I
TESTING
OUTPUT
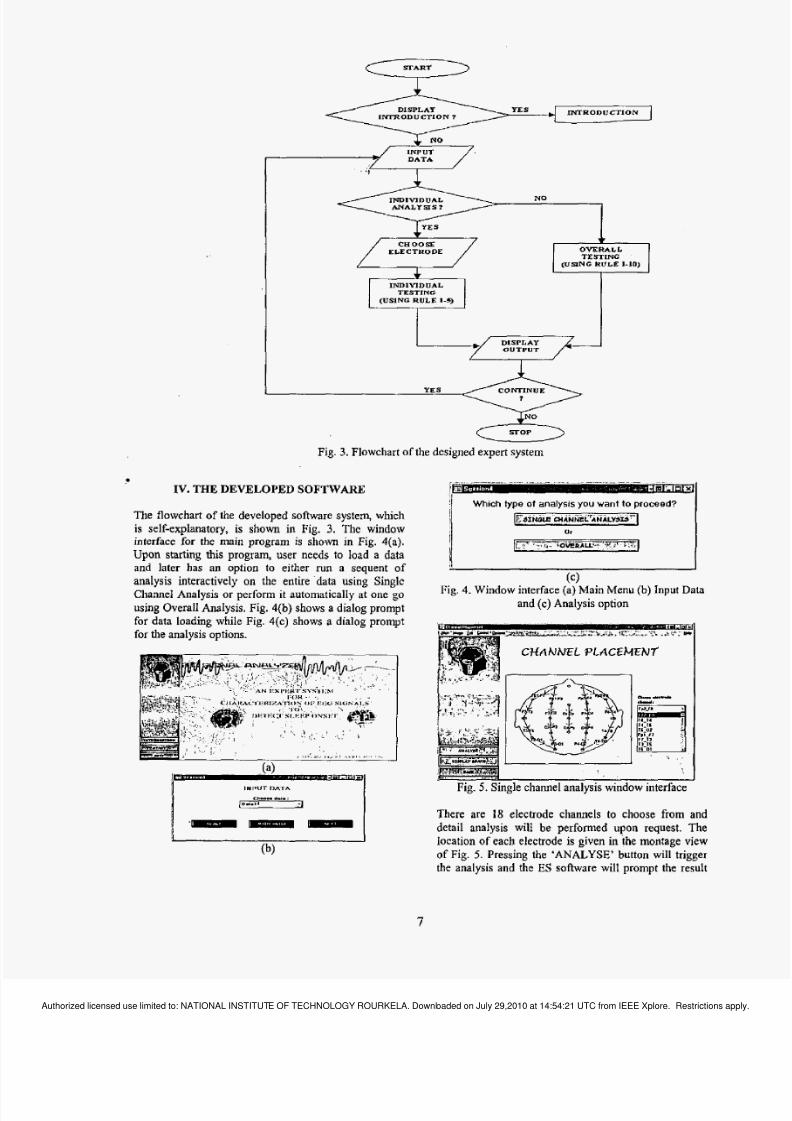
Fig. 3. Flowchart of the designed expert system
IV.THE DEVELOPED SOFTWARE
The flowchart of the developed software system, whichis self-explanatory, is shown in Fig. 3. The windowinterface for the main program is shown in Fig. 4(a).
Upon starting this program, user needs to load a data
and later has an option to either run a sequent ofanalysis interactively on the entire data using SingleChannel Analysis or perform it automatically at one go
using Overall AnaIysis. Fig. 4(b) shows a dialog promptfor data loading while Fig. 4(c) shows a dialog prompt
for the analysis options.
Which type of analysisyou want to proceed?
ESINolE C H A N i h i k N A L W I 3 -
p-miJ"EwTmt
( c)Fig. 4.Window interface (a) Main Menu (b) Input Data
and (c) Analysis option
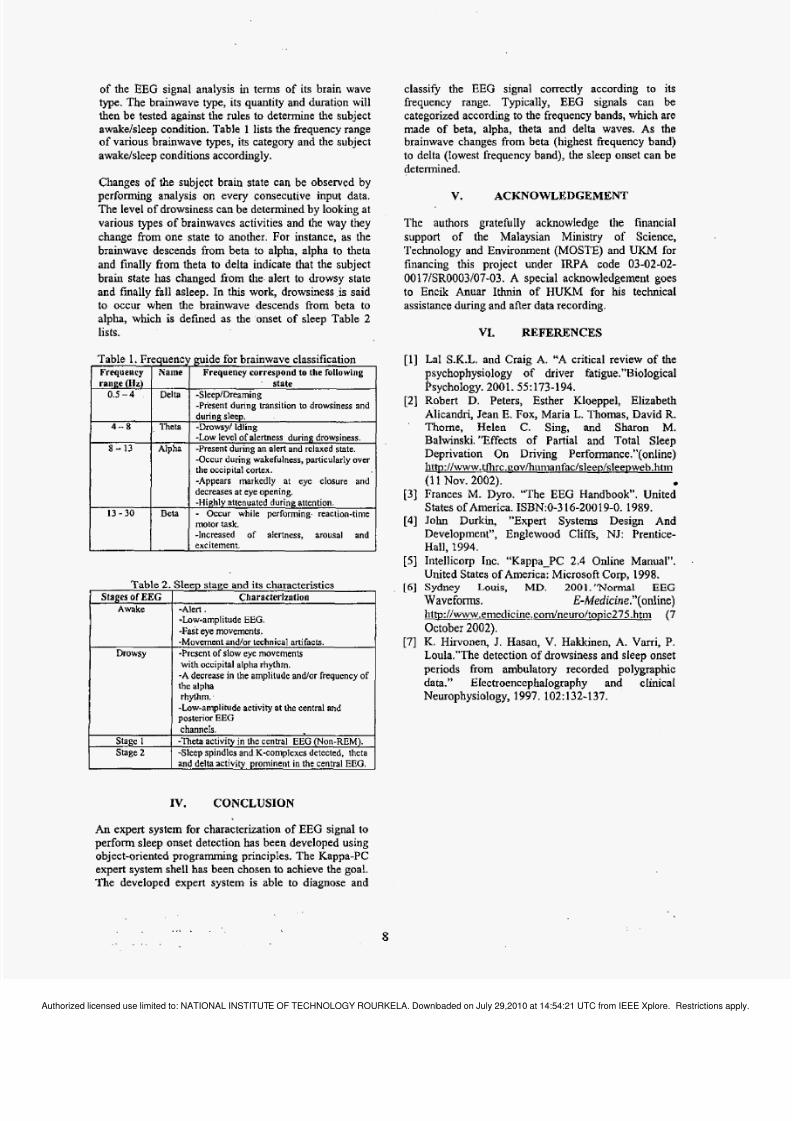
Fig. 5 . Single channel analysis window interface
There are 18 electrode channels to choose from anddetail analysis will be performed upon request. Thelocation of each electrode is given in the montage view
of Fig. 5. Pressing the 'ANALYSE' button will trigger
the analysis and th e ES software will prompt the result
7
Authorized licensed use limited to: NATIONAL INSTITUTE OF TECHNOLOGY ROURKELA. Downloaded on July 29,2010 at 14:54:21 UTC from IEEE Xplore. Restrictions app
8/8/2019 Expert System for Characterization of Electroencephalography (EEG)_IMP
http://slidepdf.com/reader/full/expert-system-for-characterization-of-electroencephalography-eegimp 4/4
of the EEG signal anatysis in terms of its brain wave
type. Th e brainwave type, its quantity and duration willthen be tested against the rules to determine the subject
awakehleep condition. Table 1 lists the frequency rangeof various brainwave types, its category and the subject
awakehleep conditionsaccordingly.
Changes of the subject brain state can be observed byperforming analysis on every consecutive input data.The level of drowsiness can be determined by looking at
various types of brainwaves activities and the way they
change from one state to another. For instance, as the
brainwave descends from beta to alpha, alpha to theta
and finally from theta to delta indicate that the subject
brain state has changed from the, alert to drowsy state
and finally fall asleep. In this work, drowsiness is said
to occur when the brainwave descends from beta toalpha, which is defined as the onset of sleep Table 2
lists.
Table 1. Fre uencFrequency
NameFrequency correspond
tothe following
ran e Hz
ide for brainwave classification
0.5 - 4 Delta -Sleep/Dreaming-Picsent during transition to drowsiness and
TIable 2
t-rowsy
Stage 2
during slccp.-Drowsy/ Idling-Low level of alertness during drowsin ess.
-Present during an ale n and relaxed state.-Occur during wakerulness, panicularly overthe occipital cortex.
-Appears markedly ai eye closure nnd
decreases at eye opening.
-Highly stteouated during attention- Occur while performing. reaction-time
motor rask.-Increased of alertness, arousal andexcitement.
kleep stage and its characteristics
Characterization
-Alert.-Low-amplitude EEG.
-Fait eye movements.-Movement andlor technical artifacts.
-Present f slow eye movements
with occipital alpha rhythm.
-A decreas e in the amplitude and/or frequency ofthe alpha
rhythm.
-Low-amplitudeactivity at the central andaosteriorEEG
channels.
-Theta activity i n the central EEG (Non-REM).
-Sleep spindles and K-complexes detecled, thetaand delta activity prominent in the central EEG.
IV. CONCLUSION
An expert system for characterization of EEG signal toperform sleep onset detection has been developed usingobject-oriented programming principles. The Kappa-PCexpert system shell has been chosen to achieve the goal.
The developed expert system is able to diagnose and
.. I ..
. . . .
classify the EEG signal correctly according to its
frequency range. Typically, EEG signals can be
categorized according to the frequency bands, which are
made of beta, alpha, theta and delta waves. As thebrainwave changes from beta (highest frequency band)
to delta (lowest frequency band), the sleep onset can be
determined.
V. ACKNOWLEDGEMENT
Th e authors gratefdly acknowledge the financial
support of the Malaysian Ministry of Science,
Technology and Environment (MOSTE) an d UKM for
financing this project under IRPA code 03-02-02-
00 7/SR0003/07-03. A special acknowledgement goes
to Encik Anuar Ithnin of HUKM for his technical
assistance during and after data recording.
VI. REFERENCES
[l] La1 S.K.L. and Craig A. “A critical review of the
psychophysiology of driver fatigue.”BioIogicalPsychology. 2001.55: 173-194.
[2] Robert D. Peters, Esther Kloeppel, Elizabeth
Alicandri, Jean E. Fox, Maria L. Thomas,David R.’ Thome, Helen C. Sing, and Sharon M.
Balwinski. ”Effects of Partial and Total SleepDeprivation On Driving Perfomnce.”(onIine)
l~M://www.fhrc.~ov/htmianfac/sleep/slee~web.htm
(1 1Nov. 2002).133 Frances M. Dyro. “The EEG Handbook”. United
States of America. 1SBN:OJ16-20019-0. 1989.
[4] John Durkin, ”Expert Systems Design And
Development”, Englewood Cliffs, NJ: Prentice-Hall, 1994.
[SI Intellicorp Inc. “Kappa-PC 2.4 Online Manual”.United States of America: Microsoft Corp, 1998.[63 Sydney Louis, MD. 2001.’Woml EEG
Waveforms. E-Medicine,”(odine)S I (7
October 2002).
[7 ] K. irvonen, J. Basan, V. Hakkinen, A. Varri, P.
Loula.”The detection of drowsiness and sleep onset
periods from ambulatory recorded polygraphic
data.” Electroencephalography and cIinical
Neurophysiology, 1997. 102: 132-137.
.
8
Authorized licensed use limited to: NATIONAL INSTITUTE OF TECHNOLOGY ROURKELA. Downloaded on July 29,2010 at 14:54:21 UTC from IEEE Xplore. Restrictions app