Expert Elicitation to Populate Early Health Economic...
54
| Master Thesis: Expert Elicitation to Populate Early Health Economic Models of Medical Diagnostic Devices in Development | Page | 1 Master Thesis Health Sciences July 2011 Expert Elicitation to Populate Early Health Economic Models of Medical Diagnostic Devices in Development Wieke Haakma
Transcript of Expert Elicitation to Populate Early Health Economic...

| Master Thesis: Expert Elicitation to Populate Early Health Economic Models of Medical Diagnostic Devices in Development | Page | 1
Master Thesis Health Sciences
July 2011
Expert Elicitation to Populate Early Health Economic Models of Medical Diagnostic Devices
in Development
Wieke Haakma

| Master Thesis: Expert Elicitation to Populate Early Health Economic Models of Medical Diagnostic Devices in Development | Page | 2
Master Thesis Health Sciences:
Expert Elicitation to Populate Early Health Economic Models of Medical Diagnostic Devices in Development
Wieke Haakma
July 2011
Wieke Haakma
Student number: 0151963
E-mail: [email protected]
Supervisors: Prof. Dr. Maarten J. IJzerman
Dr. Lotte M.G. Vrijhoef-Steuten
Dr. Laura Bojke

| Master Thesis: Expert Elicitation to Populate Early Health Economic Models of Medical Diagnostic Devices in Development | Page | 3
Contents
Abstract ..............................................................................................................................................5
1. Introduction ....................................................................................................................................6
1.1. Early Health Technology Assessment ........................................................................................7
1.2. Expert elicitation ......................................................................................................................8
1.3. Diagnostic pathway ..................................................................................................................8
1.4. Photoacoustic Mammography ..................................................................................................9
1.5. Research question .................................................................................................................. 10
2. Methods ....................................................................................................................................... 11
2.1. Expert elicitation techniques .................................................................................................. 11
2.1.1. Participating experts ........................................................................................................ 11
2.1.2. Behavior and mathematical approach in expert elicitation............................................... 11
2.1.3. Elicitation of priors in diagnostic research ........................................................................ 11
2.1.4. Determination of credible intervals ................................................................................. 12
2.1.5. Representing experts’ beliefs ........................................................................................... 12
2.1.6. Bias ................................................................................................................................. 13
2.1.7. Calibration ....................................................................................................................... 14
2.1.8. Synthesis method ............................................................................................................ 14
2.2. Expert elicitation procedure used in the case study application .............................................. 14
2.2.1. Objective of the elicitation ............................................................................................... 14
2.2.2. Sample of experts ............................................................................................................ 14
2.2.3. Quantities elicited ........................................................................................................... 15
3. Results .......................................................................................................................................... 21
3.1. Experts’ experiences with the elicitation questionnaire .......................................................... 21
3.2. Tumor characteristics ............................................................................................................. 22
3.2.1. Impact of tumor characteristics ....................................................................................... 25
3.2.2. Calibration process analysis ............................................................................................. 26
3.3. Sensitivity and specificity ........................................................................................................ 27
3.4. Combining tumor characteristics with the expert elicitation procedure .................................. 29
3.5. Expected performance of PAM II ............................................................................................ 30
3.6. Possible benefit of PAM II over MRI ........................................................................................ 31
4. Discussion ..................................................................................................................................... 32
5. Recommendations ........................................................................................................................ 36
| Master Thesis: Expert Elicitation to Populate Early Health Economic Models of Medical Diagnostic Devices in Development | Page | 4
5.1. Determination per tumor type ............................................................................................... 36
5.2. Hypothetical patients ............................................................................................................. 36
5.3. Integrating expert elicitation .................................................................................................. 36
5.4. Calibration method ................................................................................................................ 37
5.5. Participating experts .............................................................................................................. 37
6. Conclusion .................................................................................................................................... 38
Acknowledgement ............................................................................................................................ 39
References ........................................................................................................................................ 40
Appendix .......................................................................................................................................... 43
A. Questionnaire ........................................................................................................................... 43
B. Probability distribution of TNR based on 14 radiologists ............................................................ 46
C. Tumor characteristics ................................................................................................................ 47
D. Experts’ estimations regarding tumor characteristics ................................................................ 48
E. Experts’ estimations regarding TPR and TNR.............................................................................. 53
F. Recommendation regarding the development of PAM II ........................................................... 54

| Master Thesis: Expert Elicitation to Populate Early Health Economic Models of Medical Diagnostic Devices in Development | Page | 5
Abstract Purpose: During the development of new diagnostic and therapeutic devices, it is desirable to indicate the cost-effectiveness through modeling and to establish its potential clinical value to guide further developments. However, in these early stages of development, there are usually no or sparse clinical data available. In this study, expert elicitation was used as a method to estimate uncertain priors of the diagnostic performance of a new imaging device, i.e. Photoacoustic Mammography (PAM). We compared PAM as an alternative to Magnetic Resonance Imaging (MRI) as a second line diagnostic in the detection of breast cancer.
Method: Expert elicitation was used as a method to formulate the knowledge and beliefs of experts regarding the future performance of PAM and to quantify this information into probability distributions. 18 experienced radiologists (specialized, in examining MR-images of breasts) were asked to estimate the importance of different tumor characteristics in the examination of images of breasts. Following this, the performance of visualizing these characteristics were estimated for both MRI and PAM. Using the mathematical approach to elicitation, the radiologists estimated the true positive rate (TPR) and true negative rate (TNR) based on existing MRI data (with a TPR of 263 out of 292, and a TNR of 214 out of 308) and specified the mode (the most likely value), the lower, and the upper boundaries (a 95% credible interval). An overall probability density function (PDF) was determined using the linear opinion pooling method in which weighting is applied to reflect the performance of individual experts.
Result: The elicited judgments show that the most important characteristics in the discrimination between benign and malign tissue are mass margins (30.44%) and mass shape (28.6%). The oxygen saturation (2.49%) and mechanical properties (9.48%) were less important as there is limited information available about the added value of these characteristics. The performance of MRI on visualizing mass margins and mass shape was estimated to be higher than PAM, where PAM scored higher in the performance of displaying oxygen saturation and mechanical properties. An overall score of MRI (82.28) and PAM (54.03) indicates that MRI performs best in visualizing lesions of the breast. From the expert elicitation process an overall sensitivity was estimated ranging from 58.9% to 85.1%, with a mode of 75.6%. The specificity ranged from 52.2% to 77.6%, with a mode of 66.5%. Radiologists expressed difficulties making the estimations, as they felt there was insufficient data about the manner in which PAM visualizes different tumor types.
Conclusion: The examination of tumor characteristics indicates that PAM is inferior over MRI. However, if oxygen saturation and mechanical properties are more important in the examination of images of breasts, this results in higher performance of PAM. Using expert elicitation in the absence of clinical data, prior distributions of the range of sensitivity and specificity can be obtained. Theoretically, this data can be fed into early health economic models. There were, however, difficulties expressed by experts in estimating the performance of PAM, given the limited existing evidence and clinical experience. The expression of uncertainty surrounding their beliefs should reflect the infancy of the diagnostic method, however further clinical trials should be commissioned to indicate whether these results are valid. Before that, the use of the elicited priors in health economic models requires careful consideration.

| Master Thesis: Expert Elicitation to Populate Early Health Economic Models of Medical Diagnostic Devices in Development | Page | 6
1. Introduction Worldwide, companies and research institutes are investing billions of dollars in the development of medical devices. Only a small amount of these devices will actually be implemented in a clinical setting. Hence, the need to evaluate these devices during development is large [2, 3]. In the development of new medical devices, four stages can be distinguished. Figure 1 shows these stages from basic research to clinical deployment. Basic research involves considerations of the mechanism and principles of the medical device. The mechanism is translated into a prototype in the second stage. In deciding about product development, a clinical case analysis is relevant. This third stage involves the formal assessment of comparators and the possible benefits of the new medical device. The outcome of the clinical trial should indicate whether the new product is of added value compared to current rival technologies. Moreover, it is important to identify the health economic consequences at this stage.
Figure 1 A flowchart for product development [2]
Due to limited healthcare budgets, health care providers need to consider the value for money of any new medical device. Methods are required to obtain this information and to inform healthcare providers in adopting new medical technologies [2]. The application of health technology assessment at an early stage of development supports (1) developers in prioritizing between several competing possible cost-effective concepts, prototypes or features and (2) identifies parameters that have a large impact on the diagnostic value and on the potential cost-effectiveness [3]. Other than the cost to benefit ratio, which is not statutory to provide, developers of medical devices are legally obligated to indicate a Conformité Européenne (CE) marking to guarantee the safety of a medical device [4]. Furthermore, developers need to classify their medical product. Dependent on the classification, developers are obligated to register their medical product at a ‘Notified body’ within their country. These ‘Notified bodies’ are independent organizations which are appointed by the government to check whether the medical products meet the statutory quality requirements [5].
Health economic models can be used to identify the possible cost-effectiveness of a medical technology. The use of expert opinions as data input for economic models is increasingly utilized. Economic modeling can extrapolate data from trials with short timeframes into long-term estimates. It can also play a key role in prioritizing and planning future trials and research. Iterative approaches are often applied to evaluate the cost-effectiveness of healthcare technologies at different phases of their product lifecycle. This can be used to inform the reimbursement of funding of healthcare technologies [6]. Within the field of medical diagnostics the need to evaluate the cost-effectiveness of health care interventions through modeling increases, since the adoption in healthcare strongly depends on the possible cost-effectiveness of the medical device. However, it is not always feasible

| Master Thesis: Expert Elicitation to Populate Early Health Economic Models of Medical Diagnostic Devices in Development | Page | 7
to populate these economic models with empirical data especially in early stages, due to the unavailable or insufficient published trials or observational data. Expert opinions can be used to fill in data gaps or supplement trial or observational data. As shown in figure 1, further downstream the process, more information becomes available about the potential clinical outcome and added value to the current medical devices. In an early stage, data from observed evidence (randomized controlled trials, RCT) or literature is difficult to obtain. Therefore, there is a prima facie for the use of judgments elicited from experts.
1.1. Early Health Technology Assessment Early health technology assessment (HTA) is used to evaluate medical product development. HTA can be applied to support decisions for healthcare providers on the adoptions of new medical technologies, for example by indicating the potential clinical outcome. This information can be used to indicate cost-effectiveness to inform reimbursement of funding of medical devices. To collect evidence on the health economic benefits of medical technology early (Bayesian) health economic modeling is used, which allow for existing evidence to be updated by new information available at that point [3]. Health economic models can be applied in an early stage of development. However, uncertainty needs be taken into account to populate these economic models. Different methods have been applied to predict potential clinical outcomes in an early stage of development. Hummel et al argued that Analytic Hierarchy Process (AHP) can be used to estimate priors for model input to determine cost-effectiveness in an early stage of development [7]. Hilgerink et al assessed the potential clinical value of a medical technology called photoacoustic imaging in different scenario’s using AHP, where different parameters were taken into account. In this study results were obtained from group discussions [8].
Another approach has been applied by Bojke et al to assess the cost effectiveness of two treatments for active psoriatic arthritis [9]. This involves expert elicitation where experts were asked to predict unknown parameters. Johnson et al investigated the relevance of expert elicitation methods to estimate the probability of 3-year survival with and without the medicine Warfarin [10]. Leal et al used expert elicitation to estimate the parameters of an economic model to evaluate new methods for testing DNA [11]. Hiance et al investigated the use of experts’ prior beliefs to estimate the three years event-free survival of two treatment in chronic lymphocytic leukemia [12].
An expert elicitation method is intended to link an expert’s beliefs to an expression of these in a statistical form [13, 14]. Where AHP uses pairwise comparisons to measure the impact of parameters, expert elicitation methods directly assesses parameters and presents these parameters as distributions and therefore characterizes its uncertainty. These values can be directly integrated into cost-effectiveness models. Uncertainty is essential in cost-effectiveness analysis and exists because one can never predict for certain what the costs and outcomes associated with the use of a particular diagnostic device will be. Moreover, there can be an unlimited number of priors elicited. In the present study we explore the use of expert elicitation to assess medical devices in an early stage of their development. The case of photoacoustic (PA) imaging will be used. PA imaging is used to identify vascularization in tissue, as tumor growth is often associated with enhanced blood vessel supply. An important application of this technology includes breast cancer visualization. The proof of principle of PA imaging in the detection of breast cancer has been developed by the Biomedical Photonic Imaging (BPI) at the University of Twente, called the Twente Photo Acoustic Mammoscope (PAM). Though PAM is still in the translation stage (see figure 1) and the prototype is still in

| Master Thesis: Expert Elicitation to Populate Early Health Economic Models of Medical Diagnostic Devices in Development | Page | 8
development, there is no clinical information available. As the assessment of PAM in an early stage is based on objective information (information about the principle of PAM) and subjective information (regarding potential future benefits of PAM), it is important to take into account the uncertainty of these estimations [3].
1.2. Expert elicitation Although expert elicitation has been used to obtain estimates of treatment effects for medicine [9, 10], its use in the assessment of medical (diagnostic) devices is unknown. Expert elicitation provides an estimate of the possible outcome without the need of large expensive clinical trials. Using elicitation, the current level of knowledge relating to clinical experiences is used to formulate judgments about one or more uncertain priors. This can then be formulated into a probability distribution [15]. It is important to characterize the uncertainty of estimations properly before propagating them through the health economic model [9, 14].
1.3. Diagnostic pathway Different imaging technologies are used in screening and diagnosis of breast cancer. To detect whether a tumor is present, first an X-ray mammogram is taken. This method is relatively easy and reliable. However, it offers poor contrast of breast tissue in young woman, where the tissue is more dense. In addition, the use of radiation can induce tumor growth. Following that, an ultrasound image will be obtained. Ultrasound is often used in addition to X-ray mammography and can be used to distinguish between a tumor, cyst, or benign lesion. If the information is not sufficient to grade the lesion, a patient can be eligible for Magnetic Resonance Imaging (MRI). During contrast enhanced MRI, the contrast agent gadolinium is often used. This contrast agent is expected to carry a small risk regarding chemical exposure. Contrast enhanced MRI can identify angiogenesis (growth of new blood vessels, essential for cancer progression) and the permeability of the vessel wall around the tumor due to the fact that blood vessels in malignant tissue are often leak. The examination of suspect tissue is based on both the morphology (tissue characteristics) and the dynamic behavior of the blood stream (vascularization) [16]. MRI has a high sensitivity (overall >95%) but a low specificity (between 20% and 90%, strongly dependent on patient population) [16]. Due to this combination of high sensitivity and low specificity, the number of false positives (disease-free patients with a positive test result) is high. The latter can lead to unnecessary biopsies, stress, and treatments for the patient. Due to the high costs of MRI and the high false positive rate, the use of MRI is often restricted [16, 17]. MRI can be used in the detection of breast cancer in two settings. First, as a screening test for women at high risk of developing breast cancer, for instance those with mutations of BRCA1 and BRCA2 genes. Secondly, as an adjunct to mammography for the selection of local therapy in women with known or suspected breast cancer. Another application of MRI is the preoperative staging of the tumor to determine the tumor size, multifocality, or multicentricy. MRI is also used to monitor the effect of neoadjuvante chemotherapy (where the potential decrease of angiogenesis is being visualized) [16-18]. When a patient is suspected to have breast cancer, a biopsy is performed, since this remains the standard method to confirm the diagnosis of breast cancer. However, the incidence of malignancy found by biopsy is very low, ranging from 10 to 35%. It is desirable to improve early characterization of breast masses and thereby reducing the number of benign breast tumors biopsied. This way, breast tumors can be treated in the most effective manner [19].

| Master Thesis: Expert Elicitation to Populate Early Health Economic Models of Medical Diagnostic Devices in Development | Page | 9
Figure 2 Diagnostic trajectory breast cancer, A) X-ray mammogram, B) Ultrasound, C) Biopsy, D) MRI, and E) PAM
In the present study the clinical value of PAM is investigated as an alternative to MRI in the diagnostic trajectory of breast cancer (figure 2).
1.4. Photoacoustic Mammography The Photoacoustic Mammography is an imaging technique used to detect breast cancer. PAM can be used either as a screening or diagnostic device. PAM is based on the principle of photoacoustics, which is the combination of light (optics) and ultrasound. Short Near Infrared (NIR) laser light is send into the breast and absorbed by hemoglobin within the erythrocytes in blood vessels. This leads to a rise in temperature and results in thermal expansion of the vessels. Through this an ultrasound wave is generated which can be detected by the ultrasound detector. As such, the optimal contrast of light and low scattering of ultrasound in breast tissue can be combined. This provides the opportunity to identify angiogenesis, which is the same process that is visualized using MRI. After data acquisition, a 3D image of the blood vessels in the breast can be reconstructed [1, 20].
Figure 3 a) X-ray mammogram, b) transverse ultrasound image, c) craniocaudal view of a photoacoustic slice image [1]

| Master Thesis: Expert Elicitation to Populate Early Health Economic Models of Medical Diagnostic Devices in Development | Page | 10
PAM is expected to be less expensive than MRI and more comfortable for the patient than current technologies available for detecting breast cancer (e.g. X-ray mammography). Furthermore, this technique does not make use of ionizing radiation as in X-ray mammography. PAM is still in an early stage of development, at this time only one prototype exists (PAM I). Small clinical trials have been performed in diagnostic setting using the first prototype of the PAM [1, 21]. A second prototype is now being developed (PAM II).
1.5. Research question The current study focuses on the assessment of expert elicitation as a means to evaluate the usefulness of a medical device at an early stage in its development.
The main research question is:
Is expert elicitation a valid approach to characterize uncertainty regarding the diagnostics performance of photoacoustic mammography in an early stage of development?
Expert elicitation methods are applied to PAM II where the added clinical value of PAM II in comparison to MRI is estimated. PAM II is considered as an alternative to MRI in a second line diagnostic setting, where an X-ray mammogram and an ultrasound image have already been obtained. This setting was chosen because the current focus of PAM (in clinical trials) is also on diagnosis and results obtained from this study can be relevant for the development of PAM. Currently, there is more known about the performance of PAM I in clinical settings which makes the limited data available more relevant as a reference for experts. Different methods of expert elicitation exist. The aim of this study is to develop and use a method which reduces bias sufficiently and provides an accurate method to elicit the diagnostic value of PAM II. Therefore, unknown priors will be identified to indicate the diagnostic value of PAM II. These unknown priors are then quantified using the expert elicitation method. After results have been obtained, it is desirable to translate this information into recommendations to improve PAM II during development, since in an early stage it is still possible to adjust the technology.
| Master Thesis: Expert Elicitation to Populate Early Health Economic Models of Medical Diagnostic Devices in Development | Page | 11
2. Methods This chapter is divided into two parts. The first part contains an overview of expert elicitation as a method. This is followed by the second part in which the applied method is described in more detail.
2.1. Expert elicitation techniques
2.1.1. Participating experts To estimate unknown priors, individual experts are included in this study. To avoid impartiality and subjectivity of the responses, several criteria have to be used to select the experts [22]. There are different criteria an expert has to meet e.g. expertise, availability and willingness to participate, understanding of the general problem, impartially, and the lack of an economic or personal stake in the potential findings [23]. In addition, the expert’s tenure and experience in the domain of knowledge is important, since this has a major influence on judgmental and analytical behavior. Publications and number of public debates or lectures on the subject are also considered as criteria for the identification of experts [22].
2.1.2. Behavior and mathematical approach in expert elicitation To elicit priors either a behavioral or a mathematical approach can be used. Using the behavioral approach a group of experts is asked to elicit their beliefs and the focus is to achieve consensus. Through the interaction between experts, it is believed that they express their judgments more accurately. It may be beneficial for the elicitation process that experts can exchange information before the elicitation itself, to discuss potential sources of evidence and to clarify the definition of the question posed to them [11].
However, there are some concerns related to a behavioral approach. The result may not truly reflect the combined expertise and experience of the group. Diversity of the participants has different effect on the results, where strong personalities may influence the outcome. Group consensus may not always be easily achieved. For some topics, experts might not agree with each other [24]. Furthermore the behavioral approach has the tendency to produce over-confident results [23].
In the second approach, the mathematical approach, discussion is not encouraged and experts are elicited individually. The beliefs are combined to generate an overall distribution using mathematical techniques. This approach has been reviewed and tested [13, 23]. Moreover, it is easier and less costly [11]. However, there is no credible mathematical model, which includes all important factors and fits all cases. In literature, there is some debate about which method fits best [15, 23, 25].
2.1.3. Elicitation of priors in diagnostic research The diagnostic performance of medical devices is often characterized by their sensitivity and specificity. These terms are difficult to interpret and direct assessment can lead to inaccurate results. Furthermore, there is a correlation between these parameters which is often visualized using receiving operator characteristic (ROC) curves that needs to be taken into account when estimating these uncertain parameters. The estimation of the true positive rate (TPR) i.e. the amount of sick people who are correctly identified as having the condition, and true negative rate i.e. the amount of healthy people who are correctly identified as having the condition, can provide more transparency and can be easier for experts to elicit. In estimating diagnostic value using a 2*2 table (table 1) it would be sufficient to estimate TNR and TPR as the false positive rate (FPR), i.e. the amount of

| Master Thesis: Expert Elicitation to Populate Early Health Economic Models of Medical Diagnostic Devices in Development | Page | 12
disease-free patients with a positive test result, and false negative rate (FNR), i.e. the amount of sick patients with a negative test result, will follow from that.
Table 1 Test results
Disease Yes No
Test Positive TPR FPR Negative FNR TNR
From table 1 the sensitivity and specificity can be calculated by using equation 1 and 2.
Sensitivity =TPR
TPR + FNR (1)
Speci icity =TNR
FPR + TNR (2)
2.1.4. Determination of credible intervals A credible interval is defined as the range of values that an expert believes that X, the parameters of interest, will fall into, within a specified degree of credibility [13]. There are two main approaches (1) the fixed and (2) the variable method. In the fixed interval method, the range of all possible values that X can take is presented in equally distributed intervals. For each of these intervals, the expert is then asked to estimate the probability that X will fall into that interval [13, 15]. Examples are the bin and chips method [9, 26, 27], the verbal rating scale [28], the visual analogue scale [28], and the complementary interval method [11]. With the variable interval method, the expert is asked to vary the interval in which he wishes to place a specified amount of his probability. The probability is often specified as a percentile (e.g. the 95, 75, 50, 25 or 5%) [23]. Examples of the variable interval method include the probability wheel, direct elicitation of credible intervals, in which the estimation of a 95% credible interval is often used, or estimating the most likely value (mode) of parameter X, followed by the lowest and highest likely value [9, 11, 15]. Different parameters can be elicited including the mode, the mean, and the median. The elicited interval can be plotted as a cumulative distribution function (CDF) or as a probability density function (PDF).
2.1.5. Representing experts’ beliefs The representation of experts’ judgments can be achieved using different methods (e.g. line graphs, histograms, plotting distributions using a CDF or PDF) [26]. For the CDF method, the expert is asked to give a median estimate of p (the estimated prior) and one or more quantiles (usually two) of his subjective distribution for p. The PDF method elicits the density function rather than the distribution function. However, it is debatable which method produces the best distributions. Garthwaite et al suggest that the CDF method is most preferable since this method tends to yield distributions which are slightly less (unrealistic) tight than the PDF method [15]. However, other studies have shown that

| Master Thesis: Expert Elicitation to Populate Early Health Economic Models of Medical Diagnostic Devices in Development | Page | 13
the PDF is more intuitive than a cumulative distribution function, and its use is associated with improved feasibility and validity [26]. The PDF method is expected to be more intuitive for an inexperienced expert to use than for example the bisection method where the 25% and the 75% quantiles are being estimated. There is some debate which credible interval is most appropriate to elicit [15]. Too narrow intervals can lead to overconfident results and it is unlikely to elicit intervals with 100% certainty, especially since these estimations are made in an early stage of development and limited data is available. A smooth distribution is considered to be a more realistic way of representing the experts’ opinions, as it allows different probabilities for each possible point estimated and avoids abrupt variations from one point to another [11]. To reduce uncertainty, feedback should be provided to the expert to display the experts’ beliefs in a correct way. It helps the expert to refine their understanding of definitions and requirements, explore their knowledge, maintain self-consistency and therefore greatly reduce cognitive biases [29].
2.1.5.1. PERT approach To graphically display the experts’ probability density function, different methods can be applied. The Project Evaluation and Review Technique (PERT) approach can be used to calculate the mean (µ), standard deviation (σ), alpha (α) and beta (β) [30]. There is some debate whether the PERT approach is too simplistic, which can lead to inaccuracies in the beta approximations [31, 32]. When only estimating the mode, lower and upper boundaries this approach is most appropriate to calculate these parameters, especially since this approach has the ability to display skewed distribution.
2.1.5.2. Fitting distributions The most commonly used distributions for eliciting priors represented as probability distributions, are the beta distribution and the normal distribution. Beta distributions form a flexible and mathematically convenient class for quantities constrained to lie between 0 and 1 [33]. The normal distribution is characterized by the ‘bell-shaped’ curve of its density function [23].
2.1.6. Bias During an elicitation process, bias could be introduced due to different factors e.g. experts who have difficulties understanding the elicitation process or conflicts of interest. It is therefore advisable to provide training before the elicitation to familiarize the experts with the information about the medical device and the elicitation process and how the results are being processed. Experts should be aware of the possible bias that could be present and influence their judgments. Other aspects that could have influence on the results are judgment by anchoring and adjustment. They can be caused by providing initial values to the experts, which experts can adjust to obtain a final estimate. An experiment conducted by Tversky and Kahneman et al demonstrated the effect, where a starting value influences the adjustment which is then usually too small [34]. Judgment by availability is an aspect which could influence the results. When experts have the ability to recall a certain situation such as reading information about a similar medical device which performs well, they could also estimate the performance of the medical device to be effective as well [34]. Furthermore, experts can be too confident about their results which can lead to overly narrow distributions. Strategies that may reduce bias are for example (1) including an example or training exercise, (2) use clear instructions or a standardized script, (3) providing of feedback, and (4) providing an opportunity for revision.

| Master Thesis: Expert Elicitation to Populate Early Health Economic Models of Medical Diagnostic Devices in Development | Page | 14
2.1.7. Calibration The purpose of calibration is to receive a relative weighting index for each expert. Cooke et al gives empirical evidence that the calibration method improves the overall performance of elicitation [35]. Equal weights are commonly used in weighting experts. However, this approach is limited because it has been proven that experts do not perform equally in an elicitation exercise [23]. Self-scoring is another approach but this is considered subjective, because experts are unlikely to think they are giving poor quality opinions and will usually reward themselves a high score. Furthermore, the weighting method based on seed questions (questions of which the answer is known to the researcher but not to the expert) can be used. Seed variables (outcome of seed questions) have a threefold purpose (1) to quantify experts’ performance as subjective probability assessors (2) to enable performance-optimized combinations of expert distributions and (3) to evaluate and hopefully validate the combination of expert judgments [25]. Other methods used to weight the performance of an expert are ranking by experience and background [25].
2.1.8. Synthesis method There are two commonly applied methods used to synthesize the experts’ beliefs, i.e. the weighted combination and the Bayesian approaches. The most commonly used method is weighted combination via the linear pooling method. This generates an overall weighted distribution [9, 11]. The weights of the experts depend on their expertise and are obtained using calibration method (see section 2.1.7. Calibration). The Bayesian method is used to synthesize multiple experts’ opinions by viewing each opinion as a data input used to update a decision makers prior. This then generates a single posterior distribution [15]. There are several studies which have used Bayesian methods [10, 26, 36]. It is not clear from literature which method performs best. Bojke et al indicated that the Bayesian random effect predictive model does not reflect the current state of knowledge on the unknown parameters. This can only be achieved by using linear pooling [9].
2.2. Expert elicitation procedure used in the case study application
2.2.1. Objective of the elicitation In this study experts (radiologists specialized in examining MR imaged of breasts) were asked to express their beliefs regarding the clinical value of PAM II. It is investigated whether this information can provide estimations regarding the clinical outcome and if it can be used to guide further developments.
2.2.2. Sample of experts We aimed for a total of 20 radiologists to be in the study. Two radiologists were unable to attend, therefore, 18 radiologists were included. Radiologists were only recruited if they had sufficient experience with MRI. Radiologists have the appropriate knowledge, experience and expertise in the detection of breast cancer and have impact and influence on the possible outcome of the performance of PAM II in the future, as they are the people who will assess the images obtained using PAM II. According to Knol et al, 18 radiologists are sufficient to perform an expert elicitation session, as the authors argue that the benefits of including more than 12 experts begin to level off [37].

| Master Thesis: Expert Elicitation to Populate Early Health Economic Models of Medical Diagnostic Devices in Development | Page | 15
2.2.3. Quantities elicited As discussed, the clinical value of a diagnostic device is often reported in terms of sensitivity and specificity. However, due to the correlation between sensitivity and specificity it is not feasible to directly determine these parameters. Therefore, the TPR and TNR are being determined. However, direct determination of these parameters is not appropriate, since radiologists are not aware of the performance of PAM II in this stage to identify these characteristics.
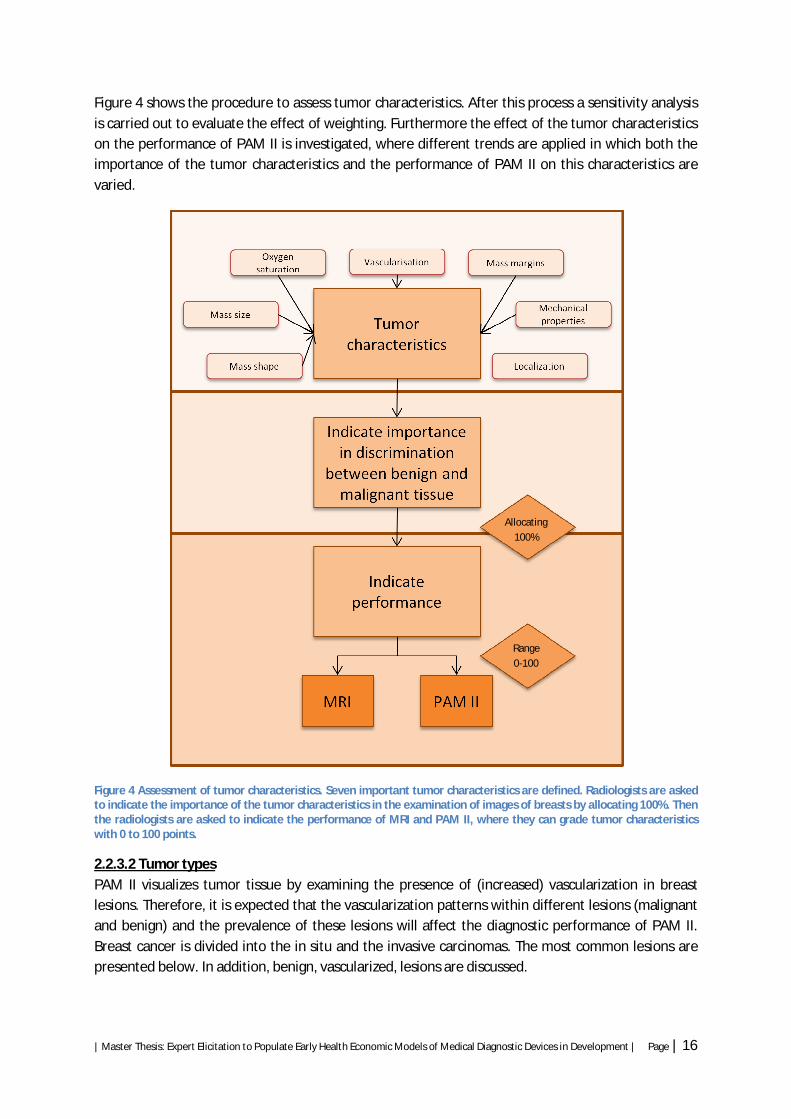
Prior to expressing their beliefs regarding the TPR and TNR for PAM II, radiologists are asked to indicate the performance of PAM II and MRI on different tumor characteristics used in the examination of images of breasts. These tumor characteristics are identified from literature [8], the BI-RADS classification system to grade breast lesions [38], and the abilities of both MRI and PAM II. These tumor characteristics are: (1) mass margins, (2) mass shape, (3) mass size, (4) vascularization, (5) localization, (6) oxygen saturation, and (7) mechanical properties. The last two characteristics are additional features PAM II provides and can contribute in the examination of images of breasts. Information about the oxygen saturation is thought to determine the speed with which a tumor is growing. Malignant tissues may have lower oxygen saturation due to imbalanced oxygen supply and uptake and increased blood volume due to angiogenesis [39]. Mechanical (or acoustic) properties could provide information about the speed of sound (density) and acoustic attenuation (stiffness). Malignancies have higher speed of sound with respect to healthy surrounding tissues. Higher acoustic attenuation signals are associated with malignancies regardless of the corresponding speed of sound [21] (more information regarding the tumor characteristics can be found in appendix C). After the evaluation of these characteristics, the TPR and TNR are being estimated.
2.2.3.1. Tumor characteristics First radiologists are asked to estimate how important tumor characteristics are in the examination of images of breast lesions. They are asked to indicate the importance of all tumor characteristics by allocating 100% to all seven tumor characteristics. Following this, they are asked how MRI and PAM II will visualize these characteristics. The radiologists can grade each characteristic with a value ranging from 0 to 100, where 0 indicates a low performance and 100 a high performance. During the synthesis, an overall importance of tumor characteristics is obtained through equation 3, where I is the importance, tc is an tumor characteristic with j ranging from 1 to 7, w is the weight of a radiologist with i ranging from 1 to 17. Finally, the performance of both MRI and PAM II were estimated for each individual tumor characteristic through equation 4, where P is the performance of a tumor characteristic j. An overall performance of MRI and PAM II can be obtained by equation 5, where P is the overall performance.
퐼(푡푐 ) = 푤 ∗ 퐼 푡푐 (3)
푀푅퐼_푃(푡푐 ) = 푤 ∗ 푀푅퐼 (푡푐 ) (4)
푃(푀푅퐼) = 푀푅퐼_푃(푡푐 ) (5)
| Master Thesis: Expert Elicitation to Populate Early Health Economic Models of Medical Diagnostic Devices in Development | Page | 16
Figure 4 shows the procedure to assess tumor characteristics. After this process a sensitivity analysis is carried out to evaluate the effect of weighting. Furthermore the effect of the tumor characteristics on the performance of PAM II is investigated, where different trends are applied in which both the importance of the tumor characteristics and the performance of PAM II on this characteristics are varied.
Figure 4 Assessment of tumor characteristics. Seven important tumor characteristics are defined. Radiologists are asked to indicate the importance of the tumor characteristics in the examination of images of breasts by allocating 100%. Then the radiologists are asked to indicate the performance of MRI and PAM II, where they can grade tumor characteristics with 0 to 100 points.
2.2.3.2 Tumor types PAM II visualizes tumor tissue by examining the presence of (increased) vascularization in breast lesions. Therefore, it is expected that the vascularization patterns within different lesions (malignant and benign) and the prevalence of these lesions will affect the diagnostic performance of PAM II. Breast cancer is divided into the in situ and the invasive carcinomas. The most common lesions are presented below. In addition, benign, vascularized, lesions are discussed.
Allocating 100%
Range 0-100

| Master Thesis: Expert Elicitation to Populate Early Health Economic Models of Medical Diagnostic Devices in Development | Page | 17
2.2.3.2.1. Carcinoma in situ In situ carcinomas of the breast are either ductal or lobular. Ductal carcinoma in situ (DCIS) is the most common cancer type of the non-invasive cancers. DCIS is the most rapidly growing subgroup of breast cancer due to the availability of more accurate diagnostic medical devices (approximately 15 to 25%) [40]. Although (neo) vascularization in DCIS is visualized within different types of DCIS [40], it is still not always possible to visualize all DCIS types, when looking only at vascularization patterns [41, 42]. LCIS is the second largest group of the in situ carcinomas and is, unlike DCIS, typically an incidental finding in a biopsy. The prevalence of LCIS ranges from 2.3% to 9.8%.
2.2.3.2.2. Invasive cancer The most common type of invasive breast cancer is the infiltrating ductal carcinoma, accounting for approximately 60-80% of all the breast carcinomas [43]. Infiltrating lobular carcinomas are the second most common type of invasive breast cancer, accounting for approximately 10% of the invasive lesions. [43]. Invasive tumors are well vascularised and can therefore be visualized using PAM.
2.2.3.2.3. Benign vascular tissue Within the nonmalignant group, there are also lesions which are vascularised. Examples are fibroadenomas, scars, inflammations, and hematomas. The prevalence of these lesions is highly dependent on the patient group under consideration. Fibroadenomas are common in young women. Vargas et al reported a prevalence of 72% of fibroadenomas in women aged younger than 30 years [44].
In this study it is investigated how these lesions can have an influence on the sensitivity and specificity. The prevalence of these lesions are identified for the target group of patients in a diagnostic trajectory.
2.2.3.3. Eliciting distributions To determine which method is most appropriate to elicit uncertainty, three radiologists of the Medisch Spectrum Twente (MST) were asked to complete a pilot elicitation exercise. They were asked to indicate which method they preferred to estimate the TPR of PAM II. Fixed and variable interval methods were assessed [23]. In the fixed interval method, the ‘bin and chips’ method (a graphical version) was used, where radiologists were asked to place 20 crosses of 5% in an interval running from 0 to 100 with steps of 5. In the variable interval method radiologists had to define the upper and lower boundaries and the mode within a 95% probability interval. Radiologists indicated that it was possible to estimate the mode and the boundaries of the interval. However, when asked to divide the chips within the interval they experienced difficulties. Their difficulties were mainly due to the unfamiliarity of the radiologists with indicating probabilities within the intervals. Two of the three preferred the variable interval method. Two radiologists indicated a skewed distribution. Therefore, the variable interval method was used in this case study application.
| Master Thesis: Expert Elicitation to Populate Early Health Economic Models of Medical Diagnostic Devices in Development | Page | 18
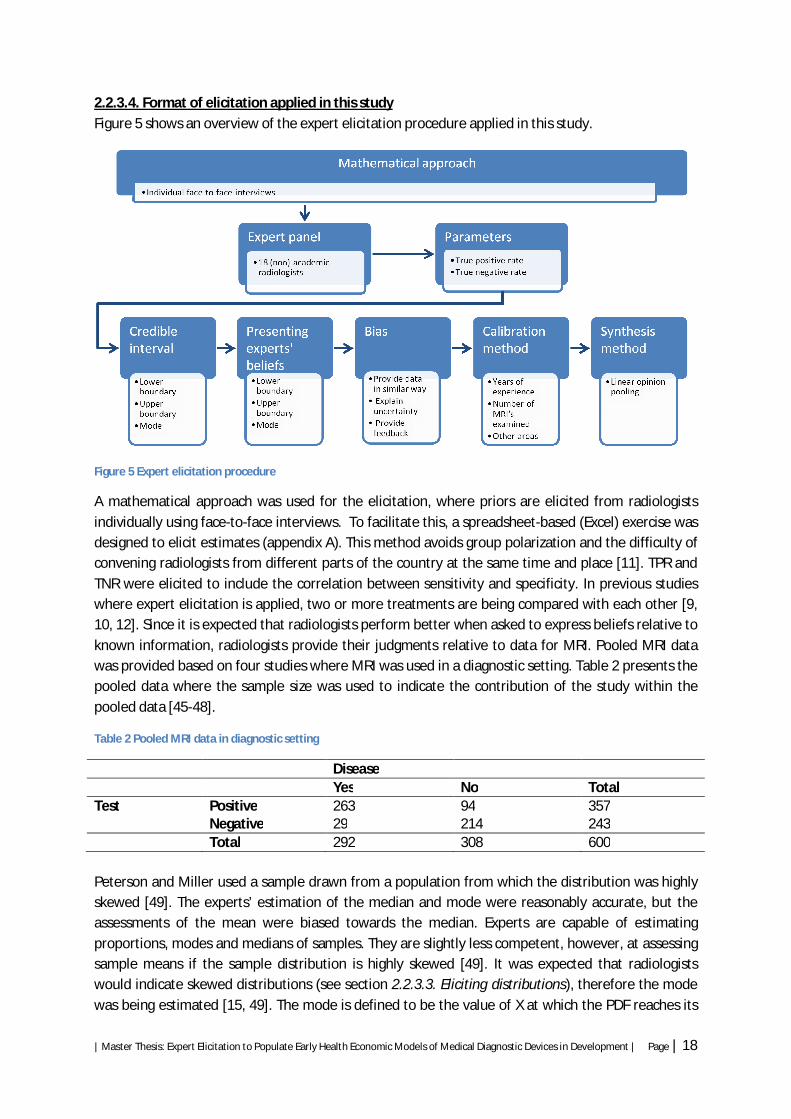
2.2.3.4. Format of elicitation applied in this study Figure 5 shows an overview of the expert elicitation procedure applied in this study.
Figure 5 Expert elicitation procedure
A mathematical approach was used for the elicitation, where priors are elicited from radiologists individually using face-to-face interviews. To facilitate this, a spreadsheet-based (Excel) exercise was designed to elicit estimates (appendix A). This method avoids group polarization and the difficulty of convening radiologists from different parts of the country at the same time and place [11]. TPR and TNR were elicited to include the correlation between sensitivity and specificity. In previous studies where expert elicitation is applied, two or more treatments are being compared with each other [9, 10, 12]. Since it is expected that radiologists perform better when asked to express beliefs relative to known information, radiologists provide their judgments relative to data for MRI. Pooled MRI data was provided based on four studies where MRI was used in a diagnostic setting. Table 2 presents the pooled data where the sample size was used to indicate the contribution of the study within the pooled data [45-48].
Table 2 Pooled MRI data in diagnostic setting
Disease Yes No Total Test Positive 263 94 357 Negative 29 214 243 Total 292 308 600 Peterson and Miller used a sample drawn from a population from which the distribution was highly skewed [49]. The experts’ estimation of the median and mode were reasonably accurate, but the assessments of the mean were biased towards the median. Experts are capable of estimating proportions, modes and medians of samples. They are slightly less competent, however, at assessing sample means if the sample distribution is highly skewed [49]. It was expected that radiologists would indicate skewed distributions (see section 2.2.3.3. Eliciting distributions), therefore the mode was being estimated [15, 49]. The mode is defined to be the value of X at which the PDF reaches its

| Master Thesis: Expert Elicitation to Populate Early Health Economic Models of Medical Diagnostic Devices in Development | Page | 19
maximum. It is indicated as the most likely value of X [23]. However, some distributions have more than one mode, therefore the mode is often not chosen to estimate the center of the distribution [50]. Comparing the mode with the mean and the median and considering the inexperience of the radiologists towards eliciting probability distributions, the ‘most likely value’ is expected to be the most intuitive parameter for radiologists to elicit.
Due to the limited time available and for the convenience of the method for radiologists, the variable interval was used, where radiologists were asked to indicate the mode, the lower and the upper boundaries within a 95% credible interval. A graphical display was used to represent the radiologists’ probability density function, where the PERT approach was applied to calculate the mean (µ) (equation 6), standard deviation (σ) (equation 7), alpha (α) (equation 8) and beta (β) (equation 9), as only the mode, the lower and the upper boundary were being estimated [30].
µ =푚푖푛+ 4 ∗ 푚표푑푒+ 푚푎푥
6 (6)
휎 =푚푎푥 − 푚푖푛
6 (7)
훼 =µ −푚푖푛
푚푎푥 −푚푖푛∗
µ −푚푖푛 ∗ (푚푎푥 − µ)휎
(8)
훽 =푚푎푥 − µµ −푚푖푛
∗ 훼 (9)
A beta distribution was used, since this is a flexible and mathematically convenient class to distribute the PDF. To reduce bias, different aspects were integrated in the elicitation process. First a heterogeneous and critical group of radiologists was gathered of which all had comparable knowledge of PAM II. The information the radiologists had regarding PAM II was provided by the researcher. As the attitude towards new technology affects the estimation of the performance of new technology, different background questions were asked including the experience with doing research and purchasing new equipment within their department. After obtaining this information from all radiologists, the group was divided into early adopters, which were characterized by their broad experience with doing research and by being open but critical attitude towards new medical devices and therapies, and the majority. Radiologists received a face-to-face interview of 30 to 45 minutes in which the same data of PAM II was presented for each individual radiologist. First the medical device, PAM, was introduced. Then uncertainty of obtaining information regarding the clinical outcome in an early stage of development was explained. Radiologists were informed about the elicitation process and the purpose of elicitation. Questions were accurately formulated and feedback was provided to check whether the questions were understood. After the elicitation process, radiologists had the opportunity to revise their answers.
2.2.3.4.1. Calibration process It is expected that there is a variety in the performance (weights) of radiologists. Therefore, a calibration method is applied to weigh radiologists with respect to their individual scores. To

| Master Thesis: Expert Elicitation to Populate Early Health Economic Models of Medical Diagnostic Devices in Development | Page | 20
determine whether seed questions can be used as a calibration method, the radiologists were asked to determine questions applicable to assess the performance of their colleagues. Radiologists indicated question such as ‘ Which trajectory will a patient with palpable tumor should go through’ or ‘When will MRI be used in the detection of breast cancer?’. These questions were difficult to use as seed questions, since these questions cannot be quantified and there is not one unanimous answer to these questions. Therefore, radiologists’ clinical background was used to calibrate radiologists instead. The factors to reflect the performance of individual radiologists are based on literature [51, 52] and interviews with radiologists and included (1) years of experience, (2) average number of MRI’s examined per week, and (3) the examination of MRI’s in other areas. Table 3 Calibration factors
Years of experience (weight 0.45)
Average number of MRI’s examined per week (weight 0.45)
Examining MRI’s in other areas (weight 0.1)
X<3 1 X<5 1 X=0 1 X=>3 2 5<=X<10 2 X>0 2 10<=X 3 Years of experience and the average number of MRI’s received a weight of 0.45, where the examination of MRI’s in other areas received a weight of 0.1, because it is expected that the first two factors represent the largest part of the weight of radiologists. Each factor is scored differently. The two ways of scoring are included to provide the possibility to change both factors (i.e. years of experience etc.) and the scoring within these factors (see table 3). Miglioretti et al indicated that radiologists gain most clinical experience during the first 3 years after residency [51]. Therefore this is used as a cutoff point where experience of radiologists < 4 years receives 1 point. Experienced radiologists (=> 4 years experience) receive 2 points. Liberman et al suggest that the repetition of performing biopsies results in a higher technical success rate [52]. This may be applicable on the examination of MR images, where a higher amount of images examined indicates a higher success rate in the examination. Within each factor, differences between radiologists are observed and were taken into account during the calibration process to indicate the performance of individual radiologists . After gathering the radiologists’ estimations and weights, the estimated parameters were synthesized. To improve the feasibility and the transparency of this study the linear pooling method is used to obtain an overall probability distribution. The radiologists’ weights are aggregated and are used to obtain an overall weighted distribution 푝(휃) = ∑ 푤 푝 (휃), where p(Ѳ) is the probability distribution for the unknown parameter Ѳ and where 푤 is the radiologist i’s weight summing up to 1.

| Master Thesis: Expert Elicitation to Populate Early Health Economic Models of Medical Diagnostic Devices in Development | Page | 21
3. Results After analyzing the data, 1 of the 18 radiologists was excluded. The radiologist was excluded due to the high amount of uncertainty within his estimation after visual inspection. His estimation conflicts with the results obtained from the other radiologists.
3.1. Experts’ experiences with the elicitation questionnaire The included experts where radiologists from both academic and non-academic hospitals. Other information related to the calibration process and the weights of experts is provided in table 4. Table 4 Information and calibration weights of radiologists
Expert Academic hospital?
Years of experience
Average number of MRI’s examined per week
Examining MRI’s in other areas
Calibration weight of expert for tumor characteristics
Calibration weight of expert for sensitivity and specificity
1 Yes 5 6 4 0.06522 0.07824 2 Yes 2 5 4 0.04970 0.05949 3 Yes 10 3 1 0.05116 0.06157 4 No 15 3 4 0.05116 0.06157 5 No 10 15 1 0.07928 0.09491 6 Yes 10 6 2 0.06522 0.07824 7 Yes 1.5 6 2 0.04970 0.05949 8 No 0.2 4 4 0.03564 0.04282 9 Yes 24 15 1 0.07928 0.09491 10 No 15 5 0 0.06219 0.07454 11 No 8 15 4 0.07928 0.09491 12 No 1 5 4 0.04970 0.05949 13 No 5 5 3 0.06522 0.07824 14 No 20 2 3 0.05116 0.06157 15 Yes 7 3 1 0.05116 N/A 16 No 18 10 4 0.06522 N/A 17 No 2 7 2 0.04970 N/A 18 Yes 17 3 4 Excluded from
study Excluded from study
During face-to-face interviews, radiologists expressed difficulties while formulating their judgments. The radiologists attributed these difficulties to limited existing evidence and clinical experience. In the assessment of the tumor characteristics, radiologists indicated that they did not have sufficient data about the added value of oxygen saturation and the mechanical properties. Consequently, the performance of MRI and PAM II for oxygen saturation and mechanical properties were difficult to determine.
| Master Thesis: Expert Elicitation to Populate Early Health Economic Models of Medical Diagnostic Devices in Development | Page | 22
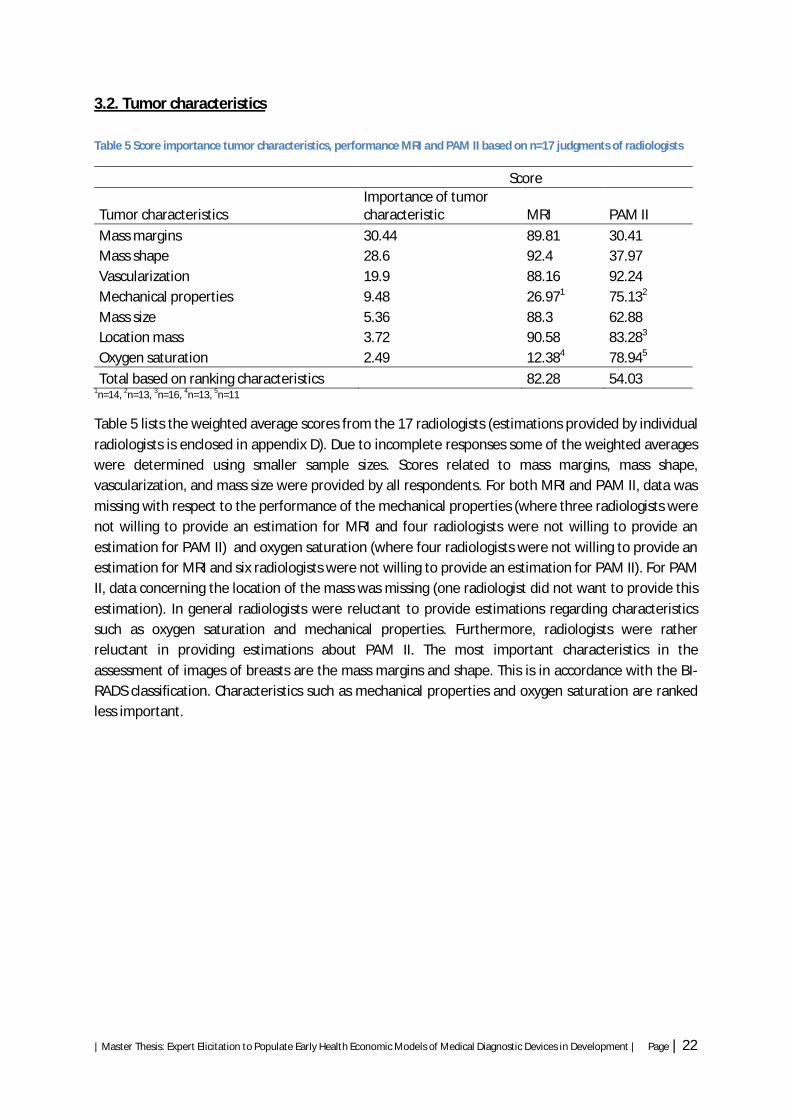
3.2. Tumor characteristics Table 5 Score importance tumor characteristics, performance MRI and PAM II based on n=17 judgments of radiologists
Score
Tumor characteristics Importance of tumor characteristic MRI PAM II
Mass margins 30.44 89.81 30.41 Mass shape 28.6 92.4 37.97 Vascularization 19.9 88.16 92.24 Mechanical properties 9.48 26.971 75.132
Mass size 5.36 88.3 62.88 Location mass 3.72 90.58 83.283
Oxygen saturation 2.49 12.384 78.945
Total based on ranking characteristics 82.28 54.03 1n=14, 2n=13, 3n=16, 4n=13, 5n=11
Table 5 lists the weighted average scores from the 17 radiologists (estimations provided by individual radiologists is enclosed in appendix D). Due to incomplete responses some of the weighted averages were determined using smaller sample sizes. Scores related to mass margins, mass shape, vascularization, and mass size were provided by all respondents. For both MRI and PAM II, data was missing with respect to the performance of the mechanical properties (where three radiologists were not willing to provide an estimation for MRI and four radiologists were not willing to provide an estimation for PAM II) and oxygen saturation (where four radiologists were not willing to provide an estimation for MRI and six radiologists were not willing to provide an estimation for PAM II). For PAM II, data concerning the location of the mass was missing (one radiologist did not want to provide this estimation). In general radiologists were reluctant to provide estimations regarding characteristics such as oxygen saturation and mechanical properties. Furthermore, radiologists were rather reluctant in providing estimations about PAM II. The most important characteristics in the assessment of images of breasts are the mass margins and shape. This is in accordance with the BI-RADS classification. Characteristics such as mechanical properties and oxygen saturation are ranked less important.

| Master Thesis: Expert Elicitation to Populate Early Health Economic Models of Medical Diagnostic Devices in Development | Page | 23
Figure 6 Distribution of the importance of the tumor characteristics
Figure 6 shows the distribution of the estimations with respect to the importance of tumor characteristics. Figure 6 shows large deviations from the mean for mass shape (σ=12.73) and vascularization (σ=10.95).
Figure 7 Score MRI and PAM II with the importance of the tumor characteristics
0
10
20
30
40
50
60
70
Mass margins Mass shape Mass size Vascularization Oxygen saturation
Location mass Mechanical properties
Impo
rtanc
e
25th percentile
Min
Median
Max
75th percentile
σ=1.1σ=1.11
σ=1.34
σ1.59
σ=1.56σ=1.69
σ=2.24
σ=1.43
σ=1.53
σ=1.8
σ=1.42
σ=1.88
σ=1.86
σ=1.52
0
5
10
15
20
25
30
35
0
10
20
30
40
50
60
70
80
90
100
Scor
e tu
mor
chr
acte
rist
ics
Scor
e M
RI a
nd P
AM
Performance MRI
Performance PAM
Importance
| Master Thesis: Expert Elicitation to Populate Early Health Economic Models of Medical Diagnostic Devices in Development | Page | 24
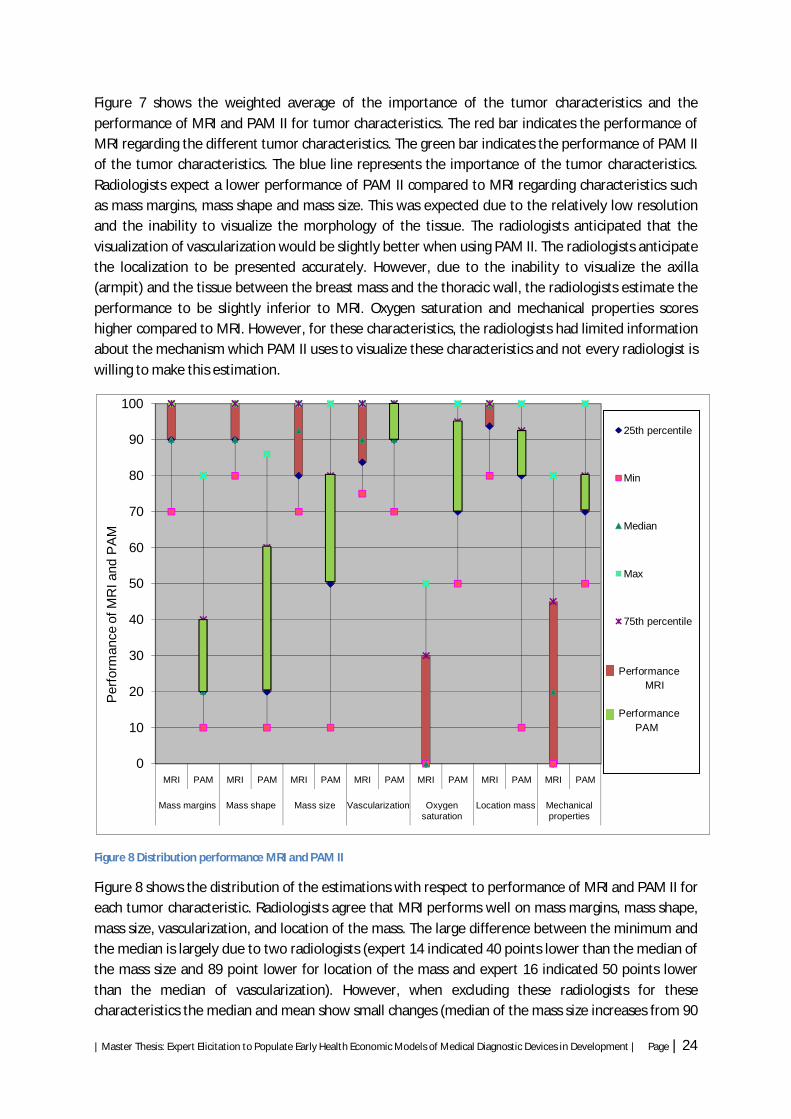
Figure 7 shows the weighted average of the importance of the tumor characteristics and the performance of MRI and PAM II for tumor characteristics. The red bar indicates the performance of MRI regarding the different tumor characteristics. The green bar indicates the performance of PAM II of the tumor characteristics. The blue line represents the importance of the tumor characteristics. Radiologists expect a lower performance of PAM II compared to MRI regarding characteristics such as mass margins, mass shape and mass size. This was expected due to the relatively low resolution and the inability to visualize the morphology of the tissue. The radiologists anticipated that the visualization of vascularization would be slightly better when using PAM II. The radiologists anticipate the localization to be presented accurately. However, due to the inability to visualize the axilla (armpit) and the tissue between the breast mass and the thoracic wall, the radiologists estimate the performance to be slightly inferior to MRI. Oxygen saturation and mechanical properties scores higher compared to MRI. However, for these characteristics, the radiologists had limited information about the mechanism which PAM II uses to visualize these characteristics and not every radiologist is willing to make this estimation.
Figure 8 Distribution performance MRI and PAM II
Figure 8 shows the distribution of the estimations with respect to performance of MRI and PAM II for each tumor characteristic. Radiologists agree that MRI performs well on mass margins, mass shape, mass size, vascularization, and location of the mass. The large difference between the minimum and the median is largely due to two radiologists (expert 14 indicated 40 points lower than the median of the mass size and 89 point lower for location of the mass and expert 16 indicated 50 points lower than the median of vascularization). However, when excluding these radiologists for these characteristics the median and mean show small changes (median of the mass size increases from 90
0
10
20
30
40
50
60
70
80
90
100
MRI PAM MRI PAM MRI PAM MRI PAM MRI PAM MRI PAM MRI PAM
Mass margins Mass shape Mass size Vascularization Oxygen saturation
Location mass Mechanical properties
Per
form
ance
of M
RI a
nd P
AM
25th percentile
Min
Median
Max
75th percentile
Performance MRI Performance PAM
| Master Thesis: Expert Elicitation to Populate Early Health Economic Models of Medical Diagnostic Devices in Development | Page | 25
to 92.5, median of the location of the mass increases from 99 to 99.5, and the median of vascularization shows no shift). The characteristics oxygen saturation and mechanical properties are more widely distributed compared to the other characteristics. The heterogeneity of judgments of the performance of PAM II for vascularization, location of the mass, and mechanical properties is relatively low.
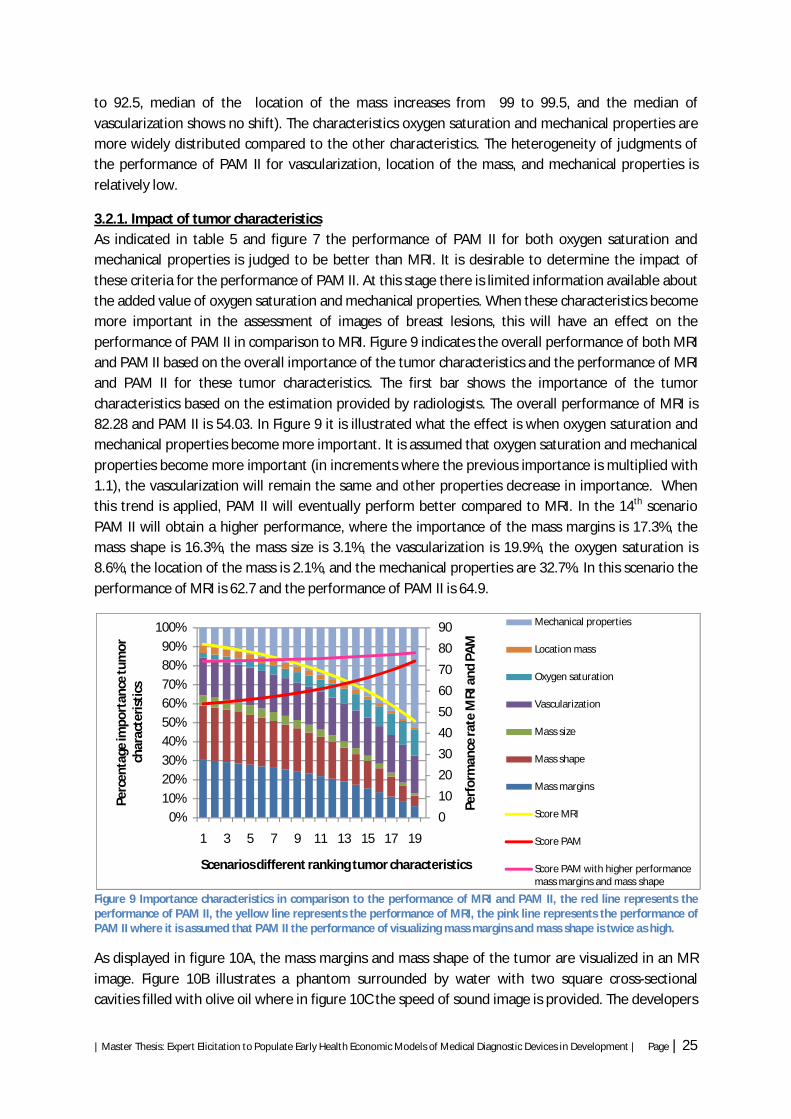
3.2.1. Impact of tumor characteristics As indicated in table 5 and figure 7 the performance of PAM II for both oxygen saturation and mechanical properties is judged to be better than MRI. It is desirable to determine the impact of these criteria for the performance of PAM II. At this stage there is limited information available about the added value of oxygen saturation and mechanical properties. When these characteristics become more important in the assessment of images of breast lesions, this will have an effect on the performance of PAM II in comparison to MRI. Figure 9 indicates the overall performance of both MRI and PAM II based on the overall importance of the tumor characteristics and the performance of MRI and PAM II for these tumor characteristics. The first bar shows the importance of the tumor characteristics based on the estimation provided by radiologists. The overall performance of MRI is 82.28 and PAM II is 54.03. In Figure 9 it is illustrated what the effect is when oxygen saturation and mechanical properties become more important. It is assumed that oxygen saturation and mechanical properties become more important (in increments where the previous importance is multiplied with 1.1), the vascularization will remain the same and other properties decrease in importance. When this trend is applied, PAM II will eventually perform better compared to MRI. In the 14th scenario PAM II will obtain a higher performance, where the importance of the mass margins is 17.3%, the mass shape is 16.3%, the mass size is 3.1%, the vascularization is 19.9%, the oxygen saturation is 8.6%, the location of the mass is 2.1%, and the mechanical properties are 32.7%. In this scenario the performance of MRI is 62.7 and the performance of PAM II is 64.9.
Figure 9 Importance characteristics in comparison to the performance of MRI and PAM II, the red line represents the performance of PAM II, the yellow line represents the performance of MRI, the pink line represents the performance of PAM II where it is assumed that PAM II the performance of visualizing mass margins and mass shape is twice as high.
As displayed in figure 10A, the mass margins and mass shape of the tumor are visualized in an MR image. Figure 10B illustrates a phantom surrounded by water with two square cross-sectional cavities filled with olive oil where in figure 10C the speed of sound image is provided. The developers
0
10
20
30
40
50
60
70
80
90
0%10%20%30%40%50%60%70%80%90%
100%
1 3 5 7 9 11 13 15 17 19
Perf
orm
ance
rate
MRI
and
PA
M
Perc
enta
ge im
port
ance
tum
or
char
acte
risti
cs
Scenarios different ranking tumor characteristics
Mechanical properties
Location mass
Oxygen saturation
Vascularization
Mass size
Mass shape
Mass margins
Score MRI
Score PAM
Score PAM with higher performance mass margins and mass shape

| Master Thesis: Expert Elicitation to Populate Early Health Economic Models of Medical Diagnostic Devices in Development | Page | 26
of PAM II indicate that the mechanical properties will be displayed as intensity plots where the information about the speed of sound and the acoustic attenuation (density and stiffness) in tissue is provided [21, 53]. If mechanical properties are visualized using intensity profile plots, the mass margins and mass shape can be displayed as well.
Therefore, this can result in a higher performance of PAM II in visualizing the mass margins and mass shape. Assuming that this leads to a performance of PAM II that is twice as high concerning mass margins and mass shape, this results in a higher overall performance for PAM II. Figure 9 shows this effect. The pink line represents the performance of PAM II under the aforementioned circumstances. The pink line shows a higher performance of PAM II in using the through radiologists estimated importance of the tumor characteristics (start scenario). However, this is still lower than MRI. When the same trend is applied, where the mechanical properties and oxygen saturation become more important, the pink line shows an increasing performance of PAM II.
3.2.2. Calibration process analysis To indicate the influence of the calibration process on the outcome, different weighting are applied. It is assumed that the examination of MR images in other areas can contribute to the performance of radiologists. However, it is also possible that this factor does not contribute to the performance of radiologists, since this is based on radiologists beliefs and is not described in literature. Therefore, a different weighting method is applied where the years of experience and the average number of MRI’s examined per week both weigh 0.5. However, it is not known how many MRI’s radiologists must have examined to improve his performance. The repetition of examining MR images is expected to lead to a higher success rate [52]. Nevertheless, this learning curve may be exponential (as with the learning curve of radiologists, who gain most clinical experience after the first 3 years [51]) and can have a cut-off point at for example 10 MRI’s per week. Therefore, within the average number of MRI’s examined per week the weighting was modified, where radiologists receive 1 point when examining < 5 MRI’s per week and 2 points when examining > 5 MRI’s per week.
A
C B
Figure 10 A) MR image of breast determining mass margins and shape, B) Phantom surrounded by water, C) Speed of sound (SOS) tomogram of the phantom demonstrating the ability of the method to reconstruct SOS plots

| Master Thesis: Expert Elicitation to Populate Early Health Economic Models of Medical Diagnostic Devices in Development | Page | 27
Table 6 Adapted weighting
Individual weighting
Difference individual vs. adapted weighting ranking
Performance MRI individual weighting
Difference individual vs. adapted weighting performance MRI
Performance PAM II individual weighting
Difference individual vs. adapted weighting performance PAM II
Mass margins 30.44 -0.1 89.81 -0.03 30.41 -0.24
Mass shape 28.6 0.28 92.4 -0.04 37.97 -0.25
Mass size 5.36 0.07 88.3 -0.08 62.88 -0.12
Vascularization 19.9 -0.37 88.16 -0.4 92.24 -0.17
Oxygen saturation 2.49 -0.03 12.38 0.06 78.94 0
Location mass 3.72 0.01 90.58 0.06 83.28 -0.04 Mechanical properties 9.48 0.14 26.97 -0.58 75.13 -0.04 Standard deviation 0.2 0.25 0.1
Table 6 shows the differences in results when comparing the adapted weighting with the initial weighting. The eventual results do not show large differences.
3.3. Sensitivity and specificity 17 radiologists where asked to indicate the TPR and TNR based on pooled data of MRI. 14 radiologists were willing to make an estimation about the potential performance of PAM II. Three radiologists indicated that it was too early to make these estimations due to the absence of data from clinical trials. The other radiologists expressed difficulties in estimating the TPR and TNR, given the limited existing evidence and clinical experience of PAM II. The individual estimations of the TPR and TNR can be found in appendix E.
Figure 11 Probability distribution of estimations of TPR of 14 radiologists, where the probability ranges from 0 (unlikely that this will occur), to 1 (very likely that this will occur)
0,00000
0,02000
0,04000
0,06000
0,08000
0,10000
0,12000
0,14000
0,16000
0,18000
0,20000
1 15 29 43 57 71 85 99 113
127
141
155
169
183
197
211
225
239
253
267
281
Prob
abili
ty
True positive rate
Expert 1
Expert 2
Expert 3
Expert 4
Expert 5
Expert 6
Expert 7
Expert 8
Expert 9
Expert 10
Expert 11
Expert 12
Expert 13
Expert 14
| Master Thesis: Expert Elicitation to Populate Early Health Economic Models of Medical Diagnostic Devices in Development | Page | 28
Figure 11 shows the distributions of TPR from the 14 radiologists. This shows that there is considerable heterogeneity between radiologists. The estimations provided by 14 radiologists of the TPR are ranging from 50 to 292 and the TNR ranged from 50 to 308, which indicates a high diversity (the distributions provided by radiologists of the TNR is enclosed in appendix B). The overall mean of the TPR is 217.3 and of the TNR is 203.2. The combined distribution of all 14 radiologists of the TPR ranged from 172 to 248.6, with a mode of 220.8 and the TNR ranged from 160.9 to 238.9, with a mode of 204.8.
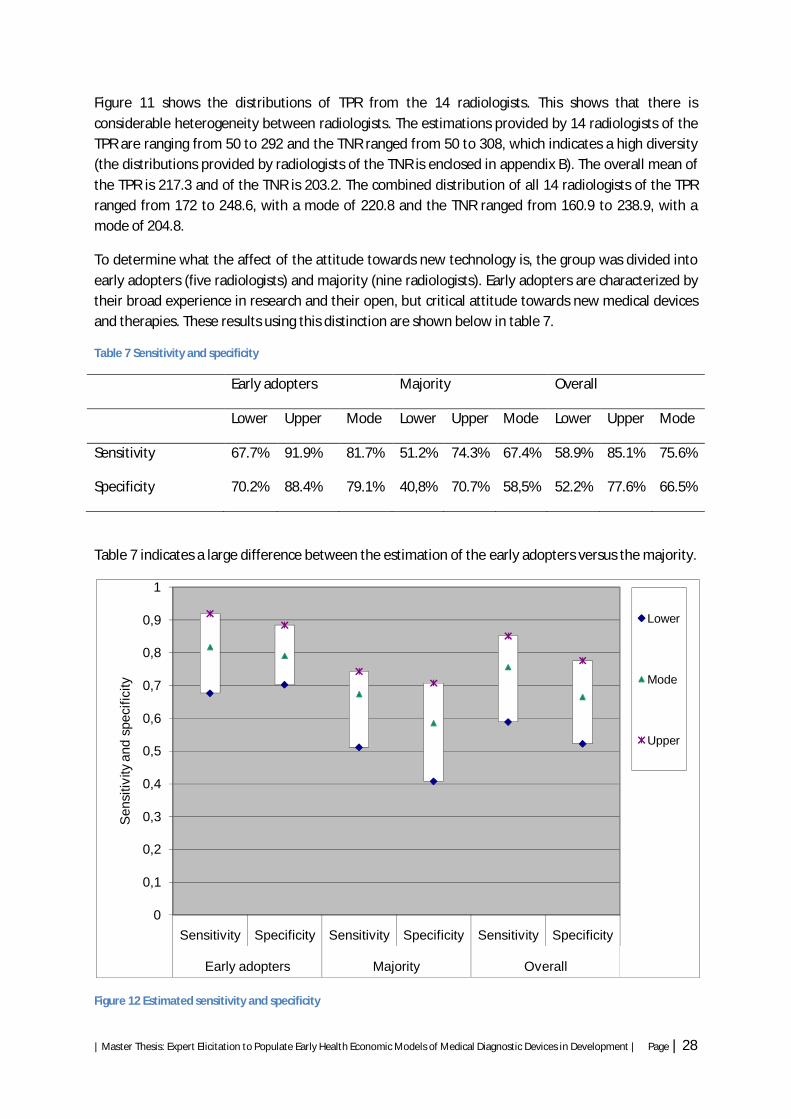
To determine what the affect of the attitude towards new technology is, the group was divided into early adopters (five radiologists) and majority (nine radiologists). Early adopters are characterized by their broad experience in research and their open, but critical attitude towards new medical devices and therapies. These results using this distinction are shown below in table 7.
Table 7 Sensitivity and specificity
Early adopters Majority Overall
Lower Upper Mode Lower Upper Mode Lower Upper Mode
Sensitivity 67.7% 91.9% 81.7% 51.2% 74.3% 67.4% 58.9% 85.1% 75.6%
Specificity 70.2% 88.4% 79.1% 40,8% 70.7% 58,5% 52.2% 77.6% 66.5%
Table 7 indicates a large difference between the estimation of the early adopters versus the majority.
Figure 12 Estimated sensitivity and specificity
0
0,1
0,2
0,3
0,4
0,5
0,6
0,7
0,8
0,9
1
Sensitivity Specificity Sensitivity Specificity Sensitivity Specificity
Early adopters Majority Overall
Sen
sitiv
ity a
nd s
peci
ficity
Lower
Mode
Upper

| Master Thesis: Expert Elicitation to Populate Early Health Economic Models of Medical Diagnostic Devices in Development | Page | 29
Figure 12 shows the difference in estimations of the sensitivity and specificity between the different groups. The early adopters estimate the performance of PAM II to be higher in comparison to the majority. The overall sensitivity and specificity is somewhere in between. Since there is not sufficient data with respect to the manner in which PAM II visualizes different tumor types, the estimations are often based on expectation of how PAM II will visualize these tumors. These estimations are based on the information provided of PAM II and their knowledge and experience with different types of technologies used to detect breast lesions.
3.4. Combining tumor characteristics with the expert elicitation procedure To indicate inconsistency of radiologists the results from the assessment of tumor characteristics and the assessment of the TPR and TNR are compared. Figure 13 shows the PAM II/MRI-ratio obtained in the assessment of tumor characteristics on the x-axis and the difference in sensitivity and specificity between MRI and PAM II obtained in the assessment of the TPR and TNR on the y-axis. In the individual elicitation of the tumor characteristic not every radiologist was willing to make an estimation for each tumor characteristic (especially for the oxygen saturation and mechanical properties). Therefore, some values were missing. To fill these missing data, the mean of the remaining radiologists was taken.
Figure 13 Combining estimations of tumor characteristics with TPR and TNR
It is expected that radiologists show consistency in their individual estimations i.e. when the performance of PAM II based on tumor characteristics is estimated to be lower than MRI, this should be observed in the estimation of the TPR and TNR as well. There is some inconsistency shown in the estimations of radiologists, however, it is hard to draw conclusions based on this comparison, since it is not known how the sensitivity and specificity are correlated to each other.
It was observed that there was a difference in the way radiologists indicated estimations between tumor characteristics and the TPR and TNR. When radiologists were asked to indicate the performance of both MRI and PAM II to visualize these characteristics, radiologists tended to provide estimations based on information and knowledge. Due to the very specific and detailed questions asked during the assessment of tumor characteristics, radiologists tended to base their estimations
Expert 10
Expert 16 Expert 8
Expert 13
Expert 6 Expert 1
Expert 9
Expert 15
Expert 14 Expert 11
Expert 5
Expert 4
Expert 12
Expert 7
Expert 3Expert 2
Expert 17
-0,7
-0,6
-0,5
-0,4
-0,3
-0,2
-0,1
0
0,1
0,2
0,3
0,4
0,20 0,37 0,43 0,47 0,49 0,57 0,58 0,58 0,62 0,67 0,74 0,75 0,78 0,81 0,84 1,01 1,13
PAM
II-M
RI fo
r sen
siti
vity
and
spe
cific
ity
Ratio (PAM II/MRI) based on tumor characteristics
Sensitivity PAM-MRI
Specificity PAM-MRI

| Master Thesis: Expert Elicitation to Populate Early Health Economic Models of Medical Diagnostic Devices in Development | Page | 30
only on knowledge, experience, and information available, therefore estimations about e.g. PAM II were difficult to provide. During the elicitation of TPR and TNR, it was observed that radiologists were more willing to base their estimation on expectations.
3.5. Expected performance of PAM II During the interviews the radiologists noted their expectations about the performance of PAM II. Due to the fact that PAM II is based on visualizing angiogenesis, the presence of angiogenesis within a tumor will indicate the ability of PAM II of visualizing this lesion. However, there are different tumor types of which not every type shows angiogenesis. This will influence the detection rate of PAM II. Radiologists expected that DCIS will be hard to visualize using PAM II, since not all types of DCIS show vascularization. Benign, vasculated tissue (e.g. fibroadenomas) is expected to be classified as false positive. Furthermore, due to the relatively low resolution, it is expected that small tumors will be missed.
It is desirable to indicate the prevalence of various tumor types in this study population. Different articles report results related to the prevalence of different tumor types for patients diagnosed with MRI in the second line diagnostics [45-48]. This data is pooled, where the size of the study sample is used as weights to indicate the contribution of the study within the pooled data, of which an overall score of different lesions was obtained.
Table 8 Prevalence tumor types
Lesions Per lesion Overall
Malignant lesions Invasive 81,45% 39,84%
DCIS 17,81% 8,71%
LCIS 0,74% 0,36%
Total 100,00% 48,91%
Nonmalignant lesions Benign 86,31% 44,09%
Atypical histology 8,00% 4,09%
Vascular benign lesions 5,69% 2,90%
Total 100,00% 51,09%
Table 8 indicates the prevalence rate of different tumor types. Of the malignant tissue, both the DCIS and LCIS group are expected to be hard to visualize. These account for 18.55% of all malignant tumors. Of the non-malignant lesions the vascular benign lesions (e.g. fibroadenomas, scars, inflammations, hematomas) are expected to be detected using PAM II and therefore diagnosed as malignant tissue. The atypical histology group shown in table 8 contains both nonvascular and vascular benign lesions. It is not known how this group is subdivided, since the study of Bluemke et al did not provide this information [45]. For the nonmalignant lesions, the vascular benign and atypical histology group (13.69%) is expected to have a negative influence on the specificity of PAM II.
PAM II has the ability to visualize the whole breast. However, as with X-ray mammography, it does not have the ability to visualize the tissue between the breast and the thoracic wall and the axilla. The prevalence of tumors located in this region is expected to have an influence on the final outcome as well. Although, the prevalence of tumor tissue present in the axilla is relatively low (0.3-1%) [54, 55].

| Master Thesis: Expert Elicitation to Populate Early Health Economic Models of Medical Diagnostic Devices in Development | Page | 31
Estimations based on the prevalence of different tumor types indicate that within the malignant group 81.45% will be detected. Of the benign lesions 86.31% are non vascular and they are assumed to be defined through PAM II as benign.
These results are based on the prevalence of different tumor types. It is likely that not all invasive tumors will be detected, since very small tumors are difficult to visualize. Within the DCIS group there can be lesions in which angiogenesis is present.
3.6. Possible benefit of PAM II over MRI In this study it is investigated what the impact of PAM II in the future will be in the detection of breast cancer. During interview different aspects are suggested to improve the diagnostic performance of PAM II. Visualization of tumor tissue depends to a large extent on the resolution. Improvement of the resolution will lead to a higher sensitivity, where (small) tumor lesions will be detected more accurately. The resolution depends upon the measurement time, the detector sensitivity and the quality of the algorithm, therefore, improving these aspects can lead to a higher resolution [56]. Furthermore, the oxygen saturation and mechanical properties are additional features. Representing these features in an accurate way is of importance, since this will differentiate PAM II from other technologies. To display oxygen saturation it is necessary to use at least two laser wavelengths. For the mechanical properties, it should be investigated how intensity profile plots can contribute in the assessment of breast lesions. During the assessment of different tumor characteristics it was observed that the mass margins and mass shape are important aspects in the assessment of images of breast lesions. Piras et al indicated the possibility to reconstruct the speed of sound and acoustic attenuation images simultaneous with the photo-acoustic image. This way it can be feasible to determine the mass shape, mass margins, vascularization, stiffness and density at the same time [21]. MRI has a high sensitivity, which is hard to match. However, its specificity is very low due to the detection of gadolinium which can diffuse into intracellular spaces, which causes the high false positive rate. Theoretically the specificity of PAM II can be beneficial to exclude the diagnosis breast cancer, since it does not have this limitation. Further recommendations for the development of PAM II are enclosed in appendix F.

| Master Thesis: Expert Elicitation to Populate Early Health Economic Models of Medical Diagnostic Devices in Development | Page | 32
4. Discussion The goal of this study was to investigate the use of expert elicitation methods to indicate the diagnostic performance of PAM II in an early stage of development. Since the uncertainty of the true value of PAM II is high in an early stage of development, we determined the uncertainty around the experts’ estimations of the performance of PAM II as well. The experts participating in this study included 18 radiologists of both academic as non academic hospitals specialized in examining MR images of breasts. The method was based on identifying different priors including tumor characteristics and the TPR and TNR rate, during individual face-to-face interviews. The overall distribution of the TPR and TNR were synthesized using the linear opinion pooling method in which weighting is applied to reflect the performance of individual radiologists.
During the interviews, it was observed that radiologists were not familiar with providing estimations of new (unknown) medical devices based on limited data and considered the outcome of clinical trials to be the standard to assess medical devices. Radiologists less familiar with PAM II are more reserved to indicate a high performance, as there is no information available of its performance in clinical setting. Three radiologists were not willing to make these estimations due of the limited amount of information and data available. Therefore, in the analysis and interpretation of the results, much attention was paid to assess the validity and accuracy of the data.
Especially for oxygen saturation and mechanical properties it was difficult to elicit an estimation from the radiologists, since these characteristics are at this moment not generally integrated in the assessment of images of breasts and limited existing evidence is available regarding the added value of these characteristics. Radiologists indicated a higher importance for mechanical properties, which can be explained by the fact that most radiologists are known with the possible impact of this characteristic. Due to the available information about medical devices such as Elastography, which represent similar information, radiologists indicated to be familiar with this type of information and were more willing to express expectations with respect to mechanical properties.
During the elicitation procedure it was observed that there was a difference in estimating the tumor characteristics on the one hand and the TPR and TNR on the other hand. In both cases, radiologists were asked to indicate judgments of the future performance of PAM II based on information, knowledge, experience, expertise and expectations. During the assessment of tumor characteristics it was observed that radiologists based their judgments on information and knowledge, but not so much on expectations. In the assessment of the TPR and TNR, however, it was observed that radiologists did include their expectations in the estimations. This could be explained by the difference in type of questions asked. The assessment of different tumor characteristics contained very specific questions, and radiologists did not have the opportunity to include uncertainty in their estimations. The assessment of the TPR and TNR involved less specific priors to be elicited and uncertainty was taken into account, through which it seemed more feasible for radiologists to provide estimation including their expectations.
It is difficult to compare the results obtained from the assessment of the tumor characteristics with the results obtained from the elicitation of the TPR and TNR. This is among other things due to the correlation between the sensitivity and specificity. This correlation is often presented using a receiver operating characteristic (ROC) curve. These plots are based on cut-off points. Defining cut-off levels

| Master Thesis: Expert Elicitation to Populate Early Health Economic Models of Medical Diagnostic Devices in Development | Page | 33
for diagnostic tests is a difficult process which should combine practical considerations (when is a tumor ‘malignant’) with numerical evidence (the actual TPR). It is not known how this correlation is defined for MRI or for PAM II.
Moreover, the impact of extra features (i.e. oxygen saturation and mechanical properties) on the performance of PAM II was investigated. At this moment there is limited information available about the importance of these characteristics in the assessment of images of breasts. In the future, when there is more information available regarding oxygen saturation and mechanical properties, these characteristics could become more important in the assessment of images of breasts. When this trend is applied, PAM II will perform better compared to MRI. Whether or not the mechanical properties and oxygen saturation will eventually be more important than mass margins and mass shape, will depend on the outcome of research regarding these relatively new characteristics and whether they will be adopted by radiologists and integrated in the assessment of images of breasts. Furthermore, based on the expectations of radiologists, the performance of PAM II will improve compared to MRI, if PAM II is able to visualize the characteristics more accurately (e.g. improving resolution, displaying margins and shape by representing mechanical properties in intensity plots).
Prior to the elicitation process, information on PAM II was provided based on the principle of PAM II and earlier obtained data from PAM I. It is important to provide images, since the profession of a radiologist includes primarily the examination of images. However, only images of the first prototype were available. Radiologists often indicated to find it difficult to estimate the performance of PAM II, when no images of PAM II are available. This may have induced more uncertainty in their estimations. The information presented to the radiologists, had a major impact on the estimations of the radiologists. In this study, the presented data of the MRI can induce bias through anchoring and adjustment. However, since it is easier for radiologists to compare PAM II to MRI in the assessment of both tumor characteristics and the TPR and TNR, this potential induces bias is expected to be smaller than the bias induced when direct estimations of PAM II are obtained without the comparison with MRI of the tumor characteristics and TPR and TNR.
The information of PAM II was provided using a presentation. This is non time-consuming and reduces diversity in which the information is provided to different radiologists. An alternative can be to present the data using a film. This reduces the difference between the way the presentation is provided to the radiologists even more. However, a film of PAM was not available and it was deemed too time-consuming to produce it.
In this study, radiologists often based their estimations on the expectations of how PAM II will visualize different tumor types. Theoretically, it is possible to calculate the sensitivity and specificity, based on these expectations and the prevalence of different tumor types. It is expected that PAM II will have difficulties detecting the DCIS group, while benign vascular lesions, such as fibroadenomas might be detected, which would lead to a negative influence on the specificity. The use of this calculation approach resulted in a higher sensitivity and specificity than the results obtained through the elicitation of the TPR and TNR (resp. 81.45% and 75.6% for sensitivity and 86.31 and 75.6% for the specificity). However, the calculation approach induces uncertainty as well, since there are more factors which influence the diagnostic performance (e.g. small tumors can be missed and the amount

| Master Thesis: Expert Elicitation to Populate Early Health Economic Models of Medical Diagnostic Devices in Development | Page | 34
of DCIS tumors which displays angiogenesis is not known). It is therefore only used as an approximation of what the diagnostic performance can be in the future.
The most optimal situation is when vascularization patterns can discriminate between benign and malignant tissue. In the near future it is desirable to indicate vascularization pattern protocol, which radiologists can use in the assessment of photo-acoustic images. However, assessing images based on vascularization patterns requires large clinical trials, where vascularization patterns can be linked to specific tumor types. Furthermore, the learning curve of radiologists should be taken into account. A new technology requires new skills and until radiologists are capable of assessing photo-acoustic images in the most accurate way, the diagnostic performance in clinical practice remains uncertain.
As discussed, there are different methods available to evaluate medical devices in an early stage of development including AHP and expert elicitation methods. AHP uses pairwise comparisons to measure the impact of parameters, where expert elicitation methods directly determines parameters and presents these parameters as distributions and therefore characterizes its uncertainty. Hilgerink et al compared PAM II with conventional diagnostic mammography techniques, including MRI, using AHP methods [8]. In this study different aspects where taken into account including costs, patient comfort, diagnostic performance and risks, where the diagnostic performance was considered to be most important of a diagnostic breast imaging device. They concluded that only in the most negative scenario is MRI preferred over PAM II. In this study, the sensitivity and specificity were estimated to be much lower and are in conflict with the results obtained in the study of Hilgerink et al. However, in this study only the diagnostic performance of PAM II was determined, where in the study of Hilgerink et al different aspects where estimated. Another explanation between the difference in outcome is related to the different experts included and methods of obtaining the results. Hilgerink et al used group discussions to indicate the performance of PAM II. In the present study, experts are elicited individually during face-to-face interviews. They included a diverse expert panel consisting of a nurse practitioner, medical experts, engineers, and developers of PAM. All had different backgrounds and different information and knowledge of PAM. In this study the participating experts consisted of radiologists who were not familiar with PAM. They where therefore not influenced by information and beliefs about the performance of PAM II beforehand. However, the experts of Hilgerink et al had more experience and knowledge of PAM than the experts included in this study.
More information and knowledge of PAM II could result in higher estimations and could also lead to a reduction of the variance around the estimations. Nevertheless, in an early stage of development, developers are often too optimistic about the performance of their product and are often tended to estimate the value of their device to be higher than its true value. Valloje-Torres et al illustrated this effect during a 3-stage economic evaluation of absorbable pins, compared with metallic fixation, in osteotomy to treat hallux valgus, where they compared estimations provided by developers with data which was later available [57]. It is therefore debatable whether the inclusion of developers as experts in an expert panel is desirable, since this could lead to too optimistic results.
The identification of experts remains an important issue. Dependent on the purpose of the study, experts can be included. In this study the diagnostic performance was being determined, where radiologists are expected to provide appropriate estimations. However, it is desirable to that experts are well known with PAM II. Nevertheless, during the determination of other aspects, it is important

| Master Thesis: Expert Elicitation to Populate Early Health Economic Models of Medical Diagnostic Devices in Development | Page | 35
to include other experts as well (e.g. when assessing patient comfort of a diagnostic device, patients can be included as experts).
To improve knowledge on PAM II in this study, the developer should administer the questions to the radiologists. The developer is better suited to answer the questions related to the technology. Here however, a different researcher was used to administer the questions. Nevertheless, the use of a different researcher has benefits as well. It reduces any potential bias of personal stake in clinical findings and ensures that the radiologists are privy to similar information.
Due to the early stage of development of PAM II, uncertainty is high. However, the results obtained from this studies provides information regarding the performance of PAM II in comparison to MRI and for which parameters at this stage the uncertainty is highest and need to be further investigated. In the future, results obtained from large clinical trials will indicate whether this method is valid to use in the assessment of PAM II in an early stage of development. Until then, these results could be used to indicate the expected diagnostic value and to identify parameters that have large impact on the diagnostic value and the potential cost-effectiveness (e.g. oxygen saturation and mechanical properties) PAM II provides.

| Master Thesis: Expert Elicitation to Populate Early Health Economic Models of Medical Diagnostic Devices in Development | Page | 36
5. Recommendations With respect to PAM II, radiologists estimated the TPR and TNR based on the prevalence of different tumor types, assuming that not all tumor types display vascularization. To improve the certainty around these estimations it is important to provide more information about the manner in which PAM II visualizes different tumor types. It is therefore advised to update the results when information of images provided by PAM II are available. Large clinical trials with PAM II should indicate whether these results are valid and expert elicitation could be used in early technology assessment. Until that, expert elicitation methods could provide information regarding the performance of PAM II and the uncertainty surrounding estimations provided by experts. However, due to the difficulties expressed by radiologists in the estimations of uncertain priors regarding PAM II, some recommendations are provided to improve the validity of these results.
5.1. Determination per tumor type In this study the tumor characteristics and TPR and TNR rate were elicited for a casemix of all tumor types present in the study population. Radiologists based their estimation often on their expectations of how PAM II will visualize different tumor types. Therefore, it could be more appropriate to elicit the tumor characteristics and the TPR and TNR rate for each tumor type individually. With the values obtained from the assessment for the tumor characteristics per tumor type and with the values of the performance of MRI and PAM II for each tumor characteristic, an estimation of the overall performance per tumor type can be obtained for both technologies. After this assessment of the TPR and TNR, the individual probability distribution can be synthesized into one probability distribution. This could be more appropriate and might lead to a more accurate estimations, since radiologists do not know beforehand which kind of lesion type is involved.
5.2. Hypothetical patients Another approach to investigate the diagnostic performance of PAM II when limited data regarding PAM II is available, involves the use of hypothetical patients. When images of different breast lesions become available using PAM II and pathological findings indicate the grade of these lesions, these images could be shown to multiple radiologists where they are asked to indicate whether the lesions is benign or malignant. In this way information is obtained of the potential diagnostic performance of PAM II based on different radiologists. Nevertheless, when more data becomes available, images obtained with PAM II of different lesions could be estimated by the same radiologist.
5.3. Integrating expert elicitation As expert elicitation methods includes uncertainty it could be of added value to integrate this within other methods. In the study of Hummel et al, AHP was applied to estimate priors for model input to estimate cost-effectiveness in an early stage of development of PAM II [7]. Expert elicitation methods could be integrated in this setting, where experts are asked to indicate the certainty of their estimations. This can be presented as for example probability distributions. Furthermore, the results regarding the diagnostic performance of PAM II could be integrated in the study Hilgerink et al. This additional information could provide a more accurate estimation regarding the diagnostic performance of PAM II. Furthermore, to populate early health economic models, additional parameters (other than sensitivity and specificity) are also important. Other aspects included by

| Master Thesis: Expert Elicitation to Populate Early Health Economic Models of Medical Diagnostic Devices in Development | Page | 37
Hilgerink et al (i.e. costs, patient comfort and risks) should be included in this research as well to indicate the overall added value of PAM II.
5.4. Calibration method In this study the calibration method was based on clinical background regarding the radiologists to indicate the performance of radiologists. Ideally, the performance of radiologists should be based on their TPR and TNR (i.e. how much images are correctly assessed by the radiologists). In the future, when this information is available, this could provide a more accurate way of reflecting the performance of radiologists.
5.5. Participating experts Though there was diversity in the answers provided by radiologists, additional estimations of other radiologists could contribute to the validity and accuracy of the overall probability distribution of the TPR and TNR. At this stage, it is impossible to compare results obtained from this study with clinical data. Therefore, it might be valuable to elicit the same priors using the behavior approach, where the focus is to achieve consensus. Comparing both results could provide additional information whether these results are valid and accurate and might reduce uncertainty.

| Master Thesis: Expert Elicitation to Populate Early Health Economic Models of Medical Diagnostic Devices in Development | Page | 38
6. Conclusion Using expert elicitation in the absence of clinical data, prior distributions for sensitivity and specificity of diagnostic device, PAM II can be obtained. These were parameters for which, previously, there was no clinical data to inform clinical or research decisions. Theoretically, this evidence can be used in early health economic models to establish cost-effectiveness and help inform resource allocation decisions. The results can be updated when new data becomes available from further clinical studies. There were, however, difficulties expressed by radiologists in estimating the performance of PAM II, since there was limited existing evidence available and clinical experience with PAM II is still of small scale and experimental. When more information regarding PAM II is available, the uncertainty of estimations of the performance of PAM II is expected to decrease.
Results obtained from this study indicated the importance of different tumor characteristics used in the examination of images of breasts and the performance of PAM II at visualizing these tumor characteristics. The most important characteristics in the discrimination between benign and malign tissue are the mass margins (30.44%), mass shape (28.6%), and vascularization (19.9%). Mass size (5.36%) and location of the mass (3.72%) were found to be less important. It is unclear what the contribution of oxygen saturation will be in the assessment of breast tissue, since there is limited information available about its performance and has therefore a low ranking (2.49%). Mechanical properties obtained a higher ranking (9.48%) in comparison to oxygen saturation, as there is more information available about its potential use. The performance of MRI on visualizing mass margins and mass shape was estimated to be higher than PAM II, where PAM II scored higher in the performance of displaying oxygen saturation and mechanical properties. An overall score of MRI (82.28) and PAM II (54.03) indicates that MRI performs best in visualizing lesions of the breast. From the expert elicitation process an overall sensitivity of PAM II ranged from 58.9% to 85.1%, with a mode of 75.6%. The specificity ranged from 52.2% to 77.6%, with a mode of 66.5%. Early adopters indicate a higher sensitivity and specificity than the majority of the radiologists.
In the evaluation of diagnostic devices in an early stage of development, expert elicitation can identify parameters which have a large impact on the diagnostic value. It can also identify the uncertainty surrounding the parameters and can indicate whether these parameters need to be further investigated. Expert elicitation can therefore be an appropriate method to guide further developments. To improve the validity of radiologists’ estimations in this study, it is desirable to elicit priors for specific tumor types, since radiologists indicated to base their estimations on an aggregate expectation about how PAM II will visualize the various tumor types.
In an early stage of the development of PAM II, the expression of uncertainty surrounding experts’ beliefs reflect the infancy of the medical device, however, further clinical trials should be commissioned to indicate whether these results are accurate. Until then, it must be noted that the use of the elicited priors in health economic models requires careful consideration.

| Master Thesis: Expert Elicitation to Populate Early Health Economic Models of Medical Diagnostic Devices in Development | Page | 39
Acknowledgement I would like to thank my supervisors, Maarten IJzerman and Lotte Steuten, for their supervision and the helpful and interesting conversations which guided me through this research. I would like to thank Laura Bojke for providing her knowledge and input about expert elicitation methods and sharing her thoughts. Furthermore, I would like to thank all radiologists that participated in this study for providing their input. I would like to thank Srirang Manohar, Michelle Heijblom, and Daniele Piras as well for providing me the information about PAM II. I would like to thank Marjolein Hilgerink for the useful and pleasant conversations and for providing me her experience and knowledge with respect to her earlier research related to PAM. During my master thesis I had conversations with different people from the department Health Technology and Services Research. I would like to thank all these people for their open attitude and their willingness to share their knowledge. I would like to thank Lizette Utomo, Nick Ziengs, and Remy Klaassen, for sharing their vision and providing their helpful comments. To conclude, I would like to thank my fellow students for their (mental) support during the last few months.

| Master Thesis: Expert Elicitation to Populate Early Health Economic Models of Medical Diagnostic Devices in Development | Page | 40
References 1. Jose J, Manohar S, Kolkman RG, Steenbergen W, van Leeuwen TG. Imaging of tumor vasculature using Twente photoacoustic systems. Journal of Biophotonics. 2009;2(12):701-17. 2. IJzerman MJ, Steuten LMG. Early assessment of medical technologies to inform product development and market access. A review of methods and applications. 2011. 3. Vallejo-Torres L, Steuten LMG, Buxton MJ, Girling AJ, Lilford RJ, Young T. Integrating health economics modeling in the product development cycle of medical devices: A Bayesian approach. International Journal of Technology Assessment in Health Care. 2008;24(04):459-64. 4. Overheid. Besluit op medische hulpmiddelen: Artikel 7. Department: Volksgezondheid, Welzijn en Sport.2011. 5. Overheid. Besluit op medische hulpmiddelen: Artikel 4, 5. Department: Volksgezondheid, Welzijn en Sport.2011. 6. Sullivan W, Payne K. The appropriate elicitation of expert opinion in economic models. Pharmacoeconomics. 2011;29(6):455-9. 7. Hummel M, Vrijhoef-Steuten LMG, Groothuis-Oudshoorn KGM, IJzerman MJ. How Analytic Hierarchy Process may will missing gaps in early decision modeling. 2010. 8. Hilgerink MP, Hummel MJM, Manohar S, Vaartjes SR, IJzerman MJ. Assessment of the added value of the Twente Photoacoustic Mammoscope in breast cancer diagnosis. 2011. 9. Bojke L, Claxton K, Bravo-Vergel Y, Sculpher M, Palmer S, Abrams K. Eliciting distributions to populate decision analytic models. Value in Health. 2010 Aug;13(5):557-64. 10. Johnson SR, Tomlinson GA, Hawker GA, Granton JT, Grosbein HA, Feldman BM. A valid and reliable belief elicitation method for Bayesian priors. Journal of Clinical Epidemiology. 2010;63(4):370-83. 11. Leal J, Wordsworth S, Legood R, Blair E. Eliciting Expert Opinion for Economic Models: An Applied Example. Value in Health. 2007;10(3):195-203. 12. Hiance A, Chevret S, Lévy V. A practical approach for eliciting expert prior beliefs about cancer survival in phase III randomized trial. Journal of Clinical Epidemiology. 2009;62(4):431-7. 13. Bojke L, Soares M. Eliciting experts' beliefs to characterise uncertainties in decision analytic models. 2011. 14. Bojke L, Claxton K, Sculpher M, Palmer S. Characterizing Structural Uncertainty in Decision Analytic Models: A Review and Application of Methods. Value in Health. 2009 Jan 9;12(5):739-49. 15. Garthwaite AJ, Kadane JB, O'Hagan A. Statistical Methods for Eliciting Probability Distributions. Journal of the American Statistical Association. 2005;100(470):680-701. 16. Mammacarcinoom: Landelijke richtlijn met regionale toevoegingen. Versie 11 Nationaal Borstkankeroverleg Nederland (NABON), Vereniging voor Integrale Kankercentra (VIKC), Kwaliteitsinstituut voor de Gezondheidszorg CBO, The Netherlands. 2008. 17. Kankerbestrijding. Beeldvormende technieken binnen de kankerbestrijding, Vizier op de toekomst. KWF kanker bestrijding, The Netherlands. 2005. 18. Zonderland HM, Tuut MK, Heeten den GJ, Asperen van CJ, Block de GH, Rutgers EJ, et al. Richtlijn 'Screening en diagnostiek van het mammacarcinoom' (herziening). Nederlands Tijdschrift voor Geneeskunde. 2008;152:2336-9. 19. Chaudhari MH, Forsberg F, Voodarla A, Saikali FN, Goonewardene S, Needleman L, et al. Breast tumor vascularity identified by contrast enhanced ultrasound and pathology: initial results. Ultrasonics. 2000;38(1-8):105-9. 20. Manohar S, Vaartjes SE, van Hespen JC, Klaase JM, van den Engh FM, Steenbergen W, et al. Initial results of in vivo non-invasive cancer imaging in the human breast using near-infrared photoacoustics. Optics express. 2007 Sep 17;15(19):12277-85. 21. Piras D, Wenfeng X, Steenbergen W, van Leeuwen TG, Manohar SG. Photoacoustic Imaging of the Breast Using the Twente Photoacoustic Mammoscope: Present Status and Future Perspectives. Selected Topics in Quantum Electronics, IEEE Journal of. 2010;16(4):730-9.

| Master Thesis: Expert Elicitation to Populate Early Health Economic Models of Medical Diagnostic Devices in Development | Page | 41
22. Osuagwu CC, Okafor EC. Framework for eliciting knowledge for a medical laboratory diagnostic expert system. Expert Systems with Applications. 2010;37(7):5009-16. 23. O'Hagan A, Buck CE, Daneshkhah A, Eiser JR, Garthwaite PH, Jenkinson DJ, et al. Uncertain Judgements: Eliciting Experts' Probabilities: John Wiley & Sons, Ltd; 2006. 24. Forester J, Bley D, Cooper S, Lois E, Siu N, Kolaczkowski A, et al. Expert elicitation approach for performing ATHEANA quantification. Reliability Engineering & System Safety. 2004;83(2):207-20. 25. Slottje P, Sluijs JPvd, Knol AB. Expert Elicitation: Methodological suggestions for its use in environmental health impact assessments National Institute for Public Health and the Environment. 2008. 26. Johnson SR, Tomlinson GA, Hawker GA, Granton JT, Feldman BM. Methods to elicit beliefs for Bayesian priors: a systematic review. Journal of Clinincal Epidemiology. 2010;63(4):355-69. 27. McKenna C, McDaid C, Suekarran S, Hawkins N, Claxton K, Light K, et al. Enhanced external counterpulsation for the treatment of stable angina and heart failure: a systematic review and economic analysis. Health Technology Assessment. 2009;13(24):1-111. 28. Ohnhaus EE, Adler R. Methodological problems in the measurement of pain: A comparison between the verbal rating scale and the visual analogue scale. Pain. 1975;1(4):379-84. 29. Low Choy S, James A, Mengersen K. Expert elicitation and its interface with technology: a review with a view to designing Elicitator. 2009. 30. van Dorp RJ, Kotz S. A novel extension of the triangular distribution and its parameter estimation. Journal of the Royal Statistical Society: Series D (The Statistician). 2002;51(1):63-79. 31. Lau H-S, Somarajan C. A proposal on improved procedures for estimating task-time distributions in PERT. European Journal of Operational Research. 1995;85(1):39-52. 32. Lau HS, Comarajan C. A simple and logical alternative for making PERT time estimates. IIE Transactions. 1995;28(3):183-92. 33. Spiegelhalter DJ, Abrams KR, Myles JP. Bayesian Approaches to Clinical Trials and Health-Care Evaluation. 2004. 34. Tversky A, Kahneman D. Judgment under Uncertainty: Heuristics and Biases. Science. 1974;185(4157):1124-31. 35. Cooke RM, Goossens LHJ. Procedures Guide for Structural Expert Judgement in Accident Consequence Modelling. Radiation Protection Dosimetry. 2000;90(3):303-9. 36. Tan S-B, Chung YFA, Tai B-C, Cheung Y-B, Machin D. Elicitation of prior distributions for a phase III randomized controlled trial of adjuvant therapy with surgery for hepatocellular carcinoma. Controlled clinical trials. 2003;24(2):110-21. 37. Knol AB, Slottje P, van der Sluijs JP, Lebret E. The use of expert elicitation in environmental health impact assessment: a seven step procedure. Environ Health. [Research Support, Non-U.S. Government]. 2010;9:19. 38. ACR BI-RADS- MRI Lexicon Classification Form. American College of Radiology. 2003. 39. Xu R, Young D, Mao J, Povoski S. A prospective pilot clinical trial evaluating the utility of a dynamic near-infrared imaging device for characterizing suspicious breast lesions. Breast Cancer Research. 2007;9(6):88. 40. Ruiz A, Almenar S, Cerdá M, Hidalgo JJ, Puchades A, Llombart-Bosch A. Ductal Carcinoma In Situ of the Breast: A Comparative Analysis of Histology, Nuclear Area, Ploidy, and Neovascularization Provides Differentiation Between Low- and High-Grade Tumors. The Breast Journal. 2002;8(3):139-44. 41. Ando Y, Fukatsu H, Ishiguchi T, Ishigaki T, Endo T, Miyazaki M. Diagnostic utility of tumor vascularity on magnetic resonance imaging of the breast. Magnetic Resonance Imaging. 2000;18(7):807-13. 42. Weidner N, Semple JP, Welch WR, Folkman J. Tumor Angiogenesis and Metastasis — Correlation in Invasive Breast Carcinoma. New England Journal of Medicine. 1991;324(1):1-8. 43. Mallon E, Osin P, Nasiri N, Blain I, Howard B, Gusterson B. The Basic Pathology of Human Breast Cancer. Journal of Mammary Gland Biology and Neoplasia. 2000;5(2):139-63.
| Master Thesis: Expert Elicitation to Populate Early Health Economic Models of Medical Diagnostic Devices in Development | Page | 42
44. Vargas HI, Vargas PM, Eldrageely K, Gonzalez KD, Burla ML, Venegas R, et al. Outcomes of Surgical and Sonographic Assessment of Breast Masses in Women Younger Than 30. The American Surgeon. 2005;71:716-9. 45. Bluemke DA, Gatsonis CA, Chen MH, DeAngelis GA, DeBruhl N, Harms S, et al. Magnetic resonance imaging of the breast prior to biopsy. JAMA : the journal of the American Medical Association. [Clinical Trial Multicenter Study Research Support, U.S. Government, P.H.S.]. 2004;292(22):2735-42. 46. Gibbs P, Liney GP, Lowry M, Kneeshaw PJ, Turnbull LW. Differentiation of benign and malignant sub-1 cm breast lesions using dynamic contrast enhanced MRI. Breast. [Research Support, Non-U.S. Government]. 2004 Apr;13(2):115-21. 47. Bone B, Aspelin P, Bronge L, Isberg B, Perbeck L, Veress B. Sensitivity and specificity of MR mammography with histopathological correlation in 250 breasts. Acta Radiol. [Research Support, Non-U.S. Goverment]. 1996 Mar;37(2):208-13. 48. Nunes LW, Schnall MD, Orel SG. Update of breast MR imaging architectural interpretation model. Radiology. [Research Support, Non-U.S. Government Research Support, U.S. Government, P.H.S. Validation Studies]. 2001 May;219(2):484-94. 49. Peterson C, Miller A. Mode, Median, and Mean as Optimal Strategies. Journal of Experimental Psychology. 1964;68(4):363-7. 50. Meyer MA, Booker JM. Eliciting and Analyzing Expert Judgment: American Statistical Association and the Society for Industrial and Applied Mathematics; 2001. 51. Miglioretti DL, Gard CC, Carney PA, Onega TL, Buist DSM, Sickles EA, et al. When Radiologists Perform Best: The Learning Curve in Screening Mammogram Interpretation1. Radiology. 2009 December 1, 2009;253(3):632-40. 52. Liberman L, Benton CL, Dershaw DD, Abramson AF, LaTrenta LR, Morris EA. Learning Curve for Stereotactic Breast Biopsy: How Many Cases Are Enough? American Journal of Roentgenology. 2001;176(3):721-7. 53. Manohar S, Willemink RGH, Heijden van der F, Slump CH, Leeuwen van TG. Concomitant speed-of-sound tomography in photoacoustic imaging. Applied physics letters. 2007;91(13):1911. 54. MacLean J. Breast Cancer in California: A Closer Look. California Breast Cancer Research Program. 2004. 55. Sohn VY, Arthurs ZM, Sebesta JA, Brown TA. Primary tumor location impacts breast cancer survival. The American Journal of Surgery. 2008;195(5):641-4. 56. Manohar S, Kharin A, Vos C, van Hespen JCG, Steenbergen W, Leeuwen van TG. The Twente Photoacoustic Mammoscope: Towards clinical trials 2008. 57. Vallejo-Torres L, Steuten L, Parkinson B, Girling AJ, Buxton MJ. Integrating Health Economics Into the Product Development Cycle: A Case Study of Absorbable Pins for Treating Hallux Valgus. Medical Decision Making. 2010.

| Master Thesis: Expert Elicitation to Populate Early Health Economic Models of Medical Diagnostic Devices in Development | Page | 43
Appendix
A. Questionnaire
Achtergrond vragen Antwoord Hoe lang bent u werkzaam als mammaradioloog?
Hoeveel MRI's beoordeelt u gemiddeld per week?
Beoordeelt u naast de borstkanker diagnostiek nog binnen andere vakgebieden MRI's?
Heeft u in de laatste 5 jaar nog nieuwe technieken aangeschaft/onderzoek naar gedaan? Tumorkarakteristieken Welke eigenschappen voor het onderscheid maken tussen benigne en maligne weefsel vindt u het belangrijkst? Ranking Score (max 100) Nog te verdelen: 1. Randen massa
100
2. Vorm massa
3. Grootte van massa
4. Vascularizatie
5. Zuurstofsaturatie
6. Locatie massa
7. Stijfheid en dichtheid van massa
Per karakteristiek kunt u per techniek een score van 0-100 punten toekennen. MRI PAM 1. Randen massa
2. Vorm massa
3. Grootte van massa
4. Vascularizatie
5. Zuurstofsaturatie
6. Locatie massa
7. Stijfheid en dichtheid van massa

| Master Thesis: Expert Elicitation to Populate Early Health Economic Models of Medical Diagnostic Devices in Development | Page | 44
True positive rate en true negative rate Waarden van MRI in het diagnosticeringstraject van borstkanker, gepooled.
Ziekte Aanwezig Afwezig Totaal Test Positief 263 94 357 Negatief 29 214 243
Totaal 292 308 600
Waarden voor PAM Ziekte Aanwezig Afwezig Totaal Test Positief 200 94 294 Negatief 92 214 306
Totaal 292 308 600

| Master Thesis: Expert Elicitation to Populate Early Health Economic Models of Medical Diagnostic Devices in Development | Page | 45
Het interval van de TPR ligt tussen
Waarde die het meest waarschijnlijk is (modus) 200
Minimum 150 Maximum 250
Het interval van de TNR ligt tussen Waarde die het meest waarschijnlijk is (modus) 214 Minimum 150 Maximum 290
0
0,005
0,01
0,015
0,02
0,025
1 18 35 52 69 86 103
120
137
154
171
188
205
222
239
256
273
290
Probability
Probability
0
0,002
0,004
0,006
0,008
0,01
0,012
0,014
0,016
0,018
1 19 37 55 73 91 109
127
145
163
181
199
217
235
253
271
289
307
Probability
Probability

| Master Thesis: Expert Elicitation to Populate Early Health Economic Models of Medical Diagnostic Devices in Development | Page | 46
B. Probability distribution of TNR based on 14 radiologists
Figure 14 Probability distribution of estimations of TNR of 14 radiologists, where the probability ranges from 0 (unlikely that this will occur, to 1 (very likely that this will occur)
0,00000
0,05000
0,10000
0,15000
0,20000
0,25000
1 16 31 46 61 76 91 106
121
136
151
166
181
196
211
226
241
256
271
286
301
Prob
abili
ty
True negative rate
Expert 1
Expert 2
Expert 3
Expert 4
Expert 5
Expert 6
Expert 7
Expert 8
Expert 9
Expert 10
Expert 11
Expert 12
Expert 13
Expert 14
Expert overall

| Master Thesis: Expert Elicitation to Populate Early Health Economic Models of Medical Diagnostic Devices in Development | Page | 47
C. Tumor characteristics The first six tumor characteristics are described by Hilgerink et al [8]. The last characteristic is an additional feature PAM II will provide [21].
Mass margins The margins of a mass have different appearances in images, that may be indicators of malignancy. Different appearances are for example: surrounding, lobular, obscured, turbid or spicular.
Mass shape
The shape of a mass can also be an indicator of malignancy. Different appearances of masses are for example: round/oval, or lobular. Also the shapes within a mass can be important for diagnosis.
Mass size To examine if a lesion has grown with respect to previous images, it may be important to be able to determine the exact size of a mass.
Vascularization When a tumor grows, small blood vessels grow around it (angiogenesis) for nutrition supply and waste removal. A number of studies have shown that the degree of vascularity within an invasive breast carcinoma may be of prognostic value. Several other studies have also shown that various premalignant lesions of the breast can induce angiogenesis in animal experimental systems and in the human breast.
Oxygen saturation Oxygen saturation is thought to be indicative of the speed with which the tumor is growing: malignant tissues may have lower oxygen saturation due to imbalanced oxygen supply and uptake and increased blood volume due to angiogenesis.
Location mass The location of a mass/lesion can be important for diagnosis. Full breast imaging may be an important option, but also zooming in on a specific area and displaying this area with high quality.
Mechanical properties Mechanical (or acoustic) properties could provide information about the speed of sound (density) and acoustic attenuation (stiffness). Malignancies have higher speed of sound with respect to healthy surrounding tissues. Higher acoustic attenuation signals are associated with malignancies regardless of the corresponding speed of sound [21].

| Master Thesis: Expert Elicitation to Populate Early Health Economic Models of Medical Diagnostic Devices in Development | Page | 48
D. Experts’ estimations regarding tumor characteristics
Expert 1
Characteristics MRI PAM Score expert / 100 Score MRI Score PAM
Ratio's PAM/MRI
1. Mass margins 70 20 0,2 14 4 2. Mass shape 80 40 0,25 20 10 3. Mass size 80 60 0,15 12 9 4. Vascularization 80 85 0,2 16 17 5. Oxygen saturation 30 80 0,05 1,5 4 6. Location 90 90 0 0 0 7. Mechanical properties 20 80 0,15 3 12 66,5 56 0,842105263
Expert 2
Characteristics MRI PAM Score expert / 100 Score MRI Score PAM
1. Mass margins 100 40 0,2 20 8 2. Mass shape 100 60 0,15 15 9 3. Mass size 80 80 0,1 8 8 4. Vascularization 80 70 0,2 16 14 5. Oxygen saturation 30 80 0,15 4,5 12 6. Location 80 80 0,1 8 8 7. Mechanical properties 80 50 0,1 8 5 79,5 64 0,805031447
Expert 3
Characteristics MRI PAM Score expert / 100 Score MRI Score PAM
1. Mass margins 100 20 0,2 20 4 2. Mass shape 100 30 0,2 20 6 3. Mass size 100 80 0,2 20 16 4. Vascularization 100 100 0,2 20 20 5. Oxygen saturation 0 0 0 0 6. Location 100 100 0 0 0 7. Mechanical properties 80 0,2 0 16 80 62 0,775

| Master Thesis: Expert Elicitation to Populate Early Health Economic Models of Medical Diagnostic Devices in Development | Page | 49
Expert 4
Characteristics MRI PAM Score expert / 100 Score MRI Score PAM
1. Mass margins 100 30 0,333333333 33,33333333 10 2. Mass shape 100 50 0,333333333 33,33333333 16,66666667 3. Mass size 100 100 0 0 0 4. Vascularization 90 100 0,333333333 30 33,33333333 5. Oxygen saturation 0 100 0 0 0 6. Location 100 100 0 0 0 7. Mechanical properties 90 0 0 0 96,66666667 60 0,620689655
Expert 5
Characteristics MRI PAM Score expert / 100 Score MRI Score PAM
1. Mass margins 95 10 0,35 33,25 3,5 2. Mass shape 80 10 0,15 12 1,5 3. Mass size 80 70 0 0 0 4. Vascularization 100 100 0,5 50 50 5. Oxygen saturation 40 60 0 0 0 6. Location 100 90 0 0 0 7. Mechanical properties 20 75 0 0 0 95,25 55 0,577427822
Expert 6
Characteristics MRI PAM Score expert / 100 Score MRI Score PAM
1. Mass margins 100 50 0,4 40 20 2. Mass shape 90 50 0,15 13,5 7,5 3. Mass size 100 90 0,05 5 4,5 4. Vascularization 100 100 0,15 15 15 5. Oxygen saturation 50 50 0 0 0 6. Location 100 80 0,1 10 8 7. Mechanical properties 50 80 0,15 7,5 12 91 67 0,736263736
Expert 7
Characteristics MRI PAM Score expert / 100 Score MRI Score PAM
1. Mass margins 99 60 0,4 39,6 24 2. Mass shape 99 86 0,3 29,7 25,8 3. Mass size 99 70 0 0 0 4. Vascularization 85 90 0,12 10,2 10,8 5. Oxygen saturation 0 0 0 6. Location 99 60 0,12 11,88 7,2 7. Mechanical properties 75 75 0,06 4,5 4,5 95,88 72,3 0,754067584

| Master Thesis: Expert Elicitation to Populate Early Health Economic Models of Medical Diagnostic Devices in Development | Page | 50
Expert 8
Characteristics MRI PAM Score expert / 100 Score MRI Score PAM
1. Mass margins 95 10 0,4 38 4 2. Mass shape 95 70 0,45 42,75 31,5 3. Mass size 100 50 0,05 5 2,5 4. Vascularization 75 70 0,05 3,75 3,5 5. Oxygen saturation 0 0 0 6. Location 95 85 0,05 4,75 4,25 7. Mechanical properties 0 0 0 0 94,25 45,75 0,485411141
Expert 9
Characteristics MRI PAM Score expert / 100 Score MRI Score PAM
1. Mass margins 80 80 0,3 24 24 2. Mass shape 100 80 0,3 30 24 3. Mass size 100 80 0 0 0 4. Vascularization 100 100 0,2 20 20 5. Oxygen saturation 0 100 0,1 0 10 6. Location 80 80 0 0 0 7. Mechanical properties 20 80 0,1 2 8 76 86 1,131578947
Expert 10
Characteristics MRI PAM Score expert / 100 Score MRI Score PAM
1. Mass margins 90 10 0,35 31,5 3,5 2. Mass shape 90 10 0,35 31,5 3,5 3. Mass size 95 60 0,05 4,75 3 4. Vascularization 85 90 0,25 21,25 22,5 5. Oxygen saturation 0 0 0 0 6. Location 95 0 0 0 7. Mechanical properties 0 0 0 0 89 32,5 0,365168539
Expert 11
Characteristics MRI PAM Score expert / 100 Score MRI Score PAM
1. Mass margins 90 20 0,3 27 6 2. Mass shape 95 30 0,2 19 6 3. Mass size 90 50 0,1 9 5 4. Vascularization 90 90 0,2 18 18 5. Oxygen saturation 0 70 0 0 0 6. Location 95 90 0,1 9,5 9 7. Mechanical properties 75 70 0,1 7,5 7
90 51 0,566666667

| Master Thesis: Expert Elicitation to Populate Early Health Economic Models of Medical Diagnostic Devices in Development | Page | 51
Expert 12
Characteristics MRI PAM Score expert / 100 Score MRI Score PAM
1. Mass margins 80 50 0,35 28 17,5 2. Mass shape 90 20 0,2 18 4 3. Mass size 90 30 0,05 4,5 1,5 4. Vascularization 100 100 0,25 25 25 5. Oxygen saturation 80 0 0 0 6. Location 100 90 0,1 10 9 7. Mechanical properties 0,05 0 0 85,5 57 0,666666667
Expert 13
Characteristics MRI PAM Score expert / 100 Score MRI Score PAM
1. Mass margins 90 20 0,2 18 4 2. Mass shape 90 10 0,4 36 4 3. Mass size 90 90 0 0 0 4. Vascularization 100 90 0,08 8 7,2 5. Oxygen saturation 0,02 0 0 6. Location 90 90 0 0 0 7. Mechanical properties 0 70 0,3 0 21 62 36,2 0,583870968
Expert 14
Characteristics MRI PAM Score expert / 100 Score MRI Score PAM
1. Mass margins 90 20 0,35 31,5 7 2. Mass shape 90 20 0,25 22,5 5 3. Mass size 50 50 0,1 5 5 4. Vascularization 90 90 0,15 13,5 13,5 5. Oxygen saturation 0 70 0 0 0 6. Location 10 10 0,05 0,5 0,5 7. Mechanical properties 30 50 0,1 3 5 76 36 0,473684211
Expert 15
Characteristics MRI PAM Score expert / 100 Score MRI Score PAM
1. Mass margins 100 10 0,45 45 4,5 2. Mass shape 100 10 0,45 45 4,5 3. Mass size 100 10 0 0 0 4. Vascularization 100 100 0,05 5 5 5. Oxygen saturation 0 100 0 0 0 6. Location 100 75 0 0 0 7. Mechanical properties 0 100 0,05 0 5 95 19 0,2

| Master Thesis: Expert Elicitation to Populate Early Health Economic Models of Medical Diagnostic Devices in Development | Page | 52
Expert 16
Characteristics MRI PAM Score expert / 100 Score MRI Score PAM
1. Mass margins 70 20 0,2 14 4 2. Mass shape 90 30 0,6 54 18 3. Mass size 70 10 0 0 0 4. Vascularization 40 90 0,1 4 9 5. Oxygen saturation 0 0 0 0 6. Location 100 100 0 0 0 7. Mechanical properties 0 0,1 0 0 72 31 0,430555556
Expert 17
Characteristics MRI PAM Score expert / 100 Score MRI Score PAM
1. Mass margins 90 40 0,25 22,5 10 2. Mass shape 90 60 0,2 18 12 3. Mass size 80 80 0,1 8 8 4. Vascularization 75 90 0,2 15 18 5. Oxygen saturation 0 90 0,1 0 9 6. Location 100 100 0,05 5 5 7. Mechanical properties 0 75 0,1 0 7,5 68,5 69,5 1,01459854
Excluded expert
Karakteristieken MRI PAM Score expert / 100 Score MRI Score PAM
1. Mass margins 80 0,4 32 0 2. Mass shape 70 0,2 14 0 3.Mass size 30 20 0 0 0 4.Vascularization 70 100 0,2 14 20 5. Oxygen saturation 0 0 0 6. Location 0 70 0 0 0 7. Mechanical properties 0 40 0,2 0 8
60 28 0,466666667
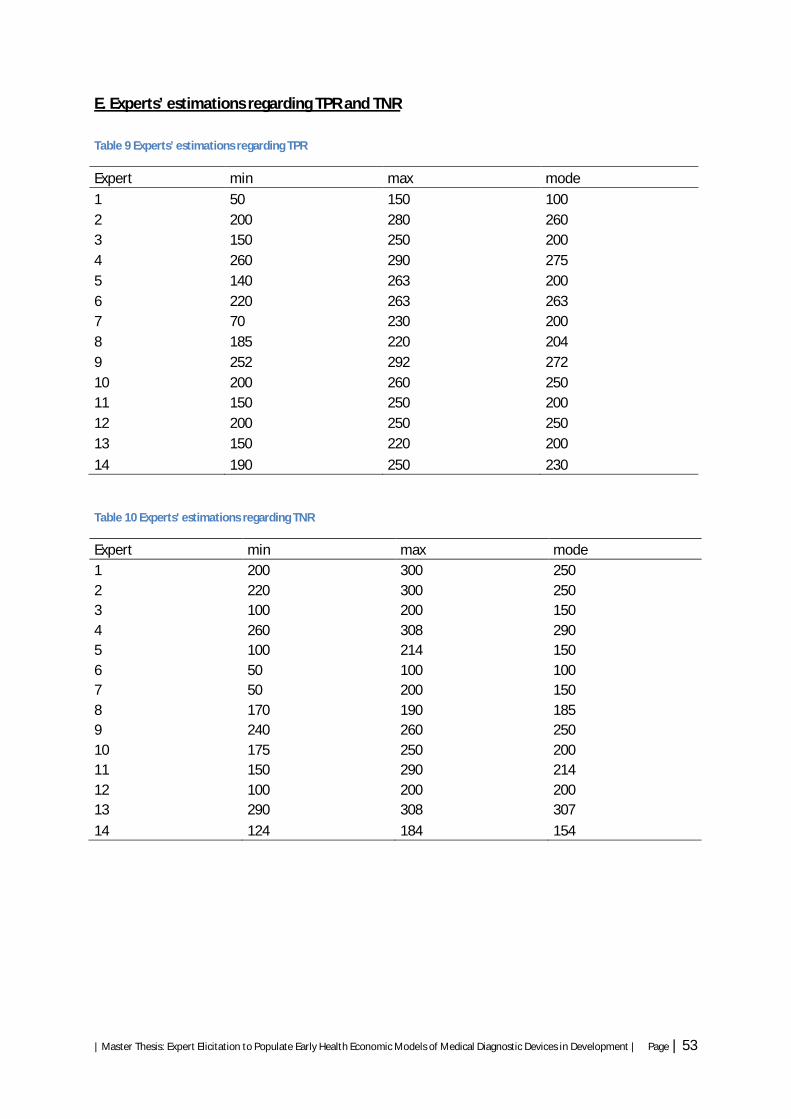
| Master Thesis: Expert Elicitation to Populate Early Health Economic Models of Medical Diagnostic Devices in Development | Page | 53
E. Experts’ estimations regarding TPR and TNR Table 9 Experts’ estimations regarding TPR
Expert min max mode
1 50 150 100 2 200 280 260 3 150 250 200 4 260 290 275 5 140 263 200 6 220 263 263 7 70 230 200 8 185 220 204 9 252 292 272 10 200 260 250 11 150 250 200 12 200 250 250 13 150 220 200
14 190 250 230
Table 10 Experts' estimations regarding TNR
Expert min max mode 1 200 300 250 2 220 300 250 3 100 200 150 4 260 308 290 5 100 214 150 6 50 100 100 7 50 200 150 8 170 190 185 9 240 260 250 10 175 250 200 11 150 290 214 12 100 200 200 13 290 308 307
14 124 184 154
| Master Thesis: Expert Elicitation to Populate Early Health Economic Models of Medical Diagnostic Devices in Development | Page | 54
F. Recommendation regarding the development of PAM II As for the development of PAM II, radiologists indicated that the ability to visualize the morphology of the tissue is an important aspect. It is therefore recommended to combine the photo-acoustic images with ultrasound images. For example, an ultrasound detector could be used that would detect and send ultrasound. Localization of the malignant tissue is highly important. Photo-acoustic guided biopsy is therefore recommended, since pathology examination remains the standard to indicate or exclude malignancy. During the menstrual cycle, women experience diversity in vascularization. To reduce hormonal induced visualization of vascularization, PAM should be performed between the 7th and 14th day after the menstrual period [16]. Additional features of PAM (i.e. oxygen saturation and mechanical properties), distinguish PAM from other imaging techniques. With these characteristics PAM could be of added value to currently used technologies. More research is needed regarding the manner in which these characteristics can support diagnoses. Furthermore, displaying mechanical properties could contribute in detecting mass margins and shape. It is recommended to investigate the manner in which mechanical properties will be visualized and how this could contribute to detecting mass margins and shape. As Piras et al indicated, it is advised to display the speed of sound and acoustic attenuation images simultaneously with the photo-acoustic images [21]. In this study PAM was placed in second line diagnostic trajectory. An alternative setting can be screening women at high risk for developing breast cancer. However, at this moment it is less feasible to apply PAM in a screening setting, since medical devices have to meet different criteria to be suitable for screening (the sensitivity is most important and has to be sufficient, at this moment X-ray mammography is the golden standard for screening and has a sensitivity of approximately 90%, however, the specificity has to be sufficient as well to reduce the FPR) and there is no information available with respect to clinical experiences. When more information becomes available regarding PAM in a screening setting, its potential added value in this setting can be investigated. Since fibroadenomas are common benign lesions in young women and the prevalence is high (72% in women aged younger than 30 years [44]) is recommended to first investigate the way in which PAM will visualize these tumor types and if these benign lesions could be identified using PAM. In the future, it could play an important role as a screening test for women at high risk for breast cancer development such as those with mutations of BRCA1 and BRCA2 genes, where X-ray mammography offers poor resolution as these women have dense breast tissue and MRI has a low specificity rate.