
Heat Conduction in Complicated Nanostructures: Experiments ...

EXPERIMENTS AND MODELING OF THE EFFECTS OF HEAT
EXPOSURE ON FATIGUE OF 6061 AND 7075
ALUMINUM ALLOYS
by
ANDREW THOMAS BRAMMER
J. BRIAN JORDON, COMMITTEE CHAIR
MARK E. BARKEY
BETH TODD
A THESIS
Submitted in partial fulfillment of the requirements for the degree of
Master of Science in the Department of Mechanical Engineering
in the Graduate School of The University of Alabama
TUSCALOOSA, ALABAMA
2013

Copyright Andrew Thomas Brammer 2013
ALL RIGHTS RESERVED

ii
ABSTRACT
Strain-controlled fatigue tests were performed on 6061-T6 and 7075-T651 aluminum
alloys as well as additional specimens of the same materials after exposure to a temperature of
538ºC for 1 hour and cooling to room temperature. The fatigue behavior of all four materials was
characterized using traditional strain-life analysis. The fatigue data was found to show no
appreciable effect of the heat exposure in low cycle fatigue, and a decrease in fatigue life in high
cycle fatigue in both 6061 and 7075. In addition, scanning electron microscopy was employed to
determine that crack initiation occurred at Fe-rich particles and subsequence analysis was used to
measure crack growth rates. The fatigue cracks were found to initiate at cracked intermetallic
particles in the peak-aged alloys and at de-bonded particles in the heat exposed alloys. Using
standard metallographic techniques, microstructural characterization including grain size,
intermetallic particle size, and nearest neighbor distance were quantified. As such, this
characterization data was implemented into a microstructure-sensitive fatigue model resulting in
a unique set of modeling parameters to capture the experimental results of both the peak-aged
and thermally-affected 6061 aluminum alloy and 7075 aluminum alloy data.

iii
DEDICATION
This thesis is dedicated to all of my family and friends who have been providing moral
support throughout the time I have been working on this study.

iv
LIST OF ABBREVIATIONS AND SYMBOLS
Cm Coefficient in Modified Coffin Manson Law
α Ductility exponent in Modified Coffin Manson Law
q Exponent in remote strain to local plastic shear strain
y1 Constant in remote strain to local plastic shear strain
y2 Linear constant in remote strain to local plastic shear strain
ξ Geometric factor in micromechanics study
r Exponent in micromechanics study
ω Omega
σ Load path dependent and loading combination parameter
ζ Exponent in small crack growth
CI HCF constant in small crack growth
CII LCF constant in small crack growth
χ Crack growth rate constant
εf' Fatigue ductility exponent

v
σf' Fatigue strength coefficient
b Fatigue strength exponent
c Fatigue ductility exponent
N Fatigue life in cycles
Δεe/2 Elastic strain range
Δεp/2 Plastic strain range
K' Cyclic strength coefficient
n' Cyclic strain hardening exponent
MSF Multistage Fatigue

vi
ACKNOWLEDGEMENTS
I would like to thank everyone who helped me to be able to complete this degree, to enumerate:
Dr. Jordon, for guidance, Dr. Todd, for allowing me to participate in the GK-12 program, and
Dr. Barkey, for sharing his expertise in material testing through class and helping me learn to
conduct tests in a research setting. Additionally, I would like to thank Johnny Godwin and Rich
Martens in the Central Analytical Facility for the University of Alabama for teaching me to use
the scanning electron microscopes for imaging, EDS, and EBSD. Finally, I would like to thank
some other graduate students who helped me learn how to use various pieces of equipment along
with helping me make sure I was on top of all of the requirements: Harish Rao, Todd Butler,
Dave Metz, and Ousama Abdelhadi.

vii
CONTENTS
ABSTRACT....................................................................................................................................ii
DEDICATION................................................................................................................................iii
LIST OF ABBREVIATIONS AND SYMBOLS...........................................................................iv
ACKNOWLEDGEMENTS............................................................................................................vi
LIST OF TABLES..........................................................................................................................ix
LIST OF FIGURES.........................................................................................................................x
1. Introduction..................................................................................................................................1
2. Experiment...................................................................................................................................4
2.1. Materials and Specimens..........................................................................................................4
2.2. Experimental Procedure............................................................................................................4
3. Fatigue Model..............................................................................................................................6
3.1. Strain-Based Approach.............................................................................................................6
3.2. Microstructure-Based Approach...............................................................................................7
3.2.1. Stages of Fatigue Damage.....................................................................................................8

viii
3.2.2. Crack Incubation Regime......................................................................................................8
3.2.3. Small Crack Growth Regime...............................................................................................10
3.2.4. Long Crack Growth Regime................................................................................................11
4. Results and Discussion..............................................................................................................12
4.1. Microstructure.........................................................................................................................12
4.2. Monotonic Stress-Strain Behavior..........................................................................................13
4.3 Cyclic Stress-Strain Behavior..................................................................................................13
4.4. Fatigue Crack Initiation..........................................................................................................15
4.5. Fatigue Crack Growth.............................................................................................................16
4.6. Multistage Fatigue Model Correlations..................................................................................17
5. Summary....................................................................................................................................19
6. References..................................................................................................................................21

ix
LIST OF TABLES
1. Monotonic Properties of 6061-T6, 6061-A, 7075-T651, and 7075-A.......................................24
2. List of tested specimens, including cycles to failure and strain amplitude ( * indicates
runout).....................................................................................................................................25
3. Cyclic Properties of 6061-T6, 6061-A, 7075-T651, and 7075-A..............................................27
4. Multistage Fatigue (MSF) Model constants..............................................................................28

x
LIST OF FIGURES
1. The intermetallic particles of a) 6061-T6, b) 6061-A, c) 7075-T651, and d) 7075-A aluminum
alloys.......................................................................................................................................29
2. Histogram of the area of individual intermetallic particles for a) 6061 and b) 7075 aluminum
alloys.......................................................................................................................................30
3. The etched microstructure of a) 6061-T6, b) 6061-A, c) 7075-T651, and d) 7075-A aluminum
alloys.......................................................................................................................................32
4. The monotonic and cyclic stress strain curves for a) 6061 and b)7075 aluminum alloys.........33
5. The strain-life equation fits for a) 6061 and b) 7075 aluminum alloys.....................................35
6. The first cycle hysteresis loops for the a) 6061-T6, b) 6061-A, c) 7075-T651, and d) 7075-A
aluminum alloys......................................................................................................................37
7. Stabilized (mid-cycle) hysteresis cycles for a) 6061-T6, b) 6061-A, c) 7075-T651, and
d) 7075-A aluminum alloys....................................................................................................41
8. Stress-amplitude evolution over the cycle of the fatigue test for a) 6061-T6, b) 6061-A, c)
7075-T651, and d) 7075-A aluminum alloys.........................................................................45
9. The particle in the image of specimen T-6-5, tested at 0.003 strain amplitude, is typical of the
crack initiation sites found in the 6061-T6 aluminum alloy...................................................49

xi
10. The particle in this image specimen A-6-10, tested at 0.007 strain amplitude is typical of the
crack initiation sites in the 6061-A aluminum alloy, with clusters of particles that are larger
than those found in the 6061-T6 aluminum alloy...................................................................50
11. The particle in this image of specimen T-7-20, tested at 0.0045 strain amplitude is indicative
of the initiation sites of 7075-T651. Almost exclusively the failures occurred at particle
clusters....................................................................................................................................51
12. The particle in this image of specimen A-7-1 tested at 0.007 strain amplitude is one of the
typical modes of failure..........................................................................................................52
13. Fatigue striations were seen on most fracture surfaces on all materials represented by these
shown from specimen A-6-8, with the crack growth direction indicated by the arrow.........53
14. Compiled crack growth rates respective to overall crack length for a) the 6061 aluminum
alloy and b) the 7075aluminum alloy.....................................................................................54
15. MSF model fit to the strain-controlled fatigue data in the peak-aged and heat-effected states
for a) AA6061 and b) AA7075 aluminum alloys...................................................................56
16. MSF fit of incubation and small crack growth for a) 6061-T6, b) 6061-A, c) 7075-T651, and
d) 7075-A aluminum alloys....................................................................................................58

1
1. Introduction
Since most structural components fail due to cyclic loading, the capability to accurately
predict the structural health of a component under expected and unexpected conditions is
paramount to safe designs. In the aerospace and automotive industries interested in lightweight
designs, aluminum alloys are frequently used as structural and sheeting components. As such,
there are several common high-strength aluminum alloys that are typically used, including many
of the 2XXX, 6XXX, and 7XXX series aluminum alloys. In fact, the 6061 aluminum alloy is one
of the most easily formable of this group of aluminum alloys but does not offer high strength,
whereas, the 7075 aluminum alloy is typically employed for its high strength. The 6061 is an
aluminum-silicon-magnesium alloy that has good strength and very high formability that allows
it to be extruded or otherwise formed into complex geometries like multi-hollow bodies [1]. This
makes aluminum 6061-T6 aluminum alloys very adaptable for use in the form of plates,
extrusions, foils, sheets, pipes, forgings, and even structural forms in the aerospace, construction,
and transportation industries [2]. On the other hand, the 7075 is an aluminum-zinc alloy that has
a higher specific strength but a lower formability. This lower formability limits its use to
structural members in less complicated geometries (rolled plates) especially in the aerospace and
transportation industries [1].
As many components and structures employ aluminum alloys like 6061 and 7075 in
order to reduce weight while maintaining strength, there are some unexpected consequences in
applications involving exposure to medium to high temperatures. In fact, the effect of high

2
temperature exposure approaching annealing conditions on the fatigue behavior of some
common aluminum alloys merits further examination. Recent work by Prietto et al. [3] showed
high-temperature degradation of tensile behavior in a 6061-T6 aluminum alloy subjected to a
thermal blast. Here, the material exposed to higher temperatures had both a lower hardness and a
lower tensile strength. In addition, the effect of heat treatment on the monotonic mechanical
properties of 6061 aluminum was also explored by Mrówka-Nowotnik [4], where variation of
Young's Modulus (E), strength coefficient (K), strain-hardening exponent (n), and 'hardening
coefficient (m), were quantified with respect to the aging time. The strength coefficient value
was found to increase with aging beyond the T6 temper, but the strain-hardening exponent and
hardening exponent values decreased while Young's Modulus stayed relatively constant.
Unlike in the case of 6061 aluminum alloy, the effect of high temperature exposure on
the fatigue properties of 7075-T651 aluminum alloy have not been studied directly; however, the
effect of annealing on monotonic and anisotropy in cold worked 7075 aluminum alloy[5] was
studied. Annealing at 400ºC for 5 minutes provided for the optimal forming characteristics and
anisotropy [5]. As such, the effect of annealing or high temperature exposure on fatigue strength
or fundamental mechanism is not understood.
In traditional fatigue analysis, an empirical curve fit is applied to load-controlled or
strain-controlled cyclic experimental data to generate fatigue properties that can be used correlate
the general trends expected from a given material. However, fatigue data commonly has scatter
up to an order of magnitude in fatigue lives that cannot be captured by these classical methods
accurately due to the nature of a curve fit. Furthermore, any change in the material or temper
necessitates a re-characterization of the "new" material and model fitting without a direct link to
the underlining mechanism. Thus, to address this, a multistage engineering fatigue model was

3
proposed by McDowell, et al. [6], to address effects of different microstructure features and
defects in cast aluminum alloys. This model has since been expanded to wrought aluminum
alloys, magnesium alloys, and some steel alloys [7-15]. The multistage fatigue model discretizes
the fatigue process into experimentally observed stages including as crack incubation (inc),
microstructurally small crack growth (MSC), physically small crack growth (PSC), and long
crack growth (LC) [6]. This model employs microstructural information and macroscopic
material properties to account for variation fatigue life, fatigue data scatter, and the contribution
of the different phases of the fatigue process. As such, the purpose of this paper is to explore the
effect of high-temperature exposure on the fatigue behavior of 6061 and 7075 aluminum alloys
and use the multistage fatigue modeling paradigm to capture the trends from both the peak-aged
and heat-affected alloys under fully-reversed applied cyclic loading.

4
2. Experiment
2.1. Materials and Specimens
The 6061-T6 and 7075-T651 aluminum alloys were obtained in an extruded form and
machined into dog-boned shaped fatigue specimens following ASTM E606 [17] that contained a
13 mm gage length. Both the 6061 and 7075 aluminum alloy specimens were divided into two
groups, one group was tested in the as received condition, while the second group was tested
after exposure to a temperature of 538ºC for 1 hour and then cooled to room temperature prior to
testing. For the purposes of this paper, the temperature exposed material will be referred to as
annealed and designated as 6061-A and 7075-A, respectively. Prior to being loaded in the testing
machine all of these specimens were hand-ground in the axial direction with 800 grit
metallurgical paper to remove any circumferential marks due to machining.
2.2. Experimental Procedure
To examine the microstructure of the two aluminum alloys, untested specimens were
sectioned in both the cross section and extruded direction. A compression mounted phenolic
epoxy was applied prior to grinding and polishing to a 1μm finish and a Keller's etchant was
used to etch the materials. The grain sizes were calculated using the intercept method according
to ASTM E112 [17]. Using an optical microscope, the statistical size and nearest neighbor
distance of intermetallic particles were quantified. Furthermore, a computer-based image-

5
analyzer, originally employed in [16], was used to measure the statistical information from the
images on the microstructural features like particle size and spacing.
Monotonic tests were conducted at a strain rate of 0.0001mm/mm/s to failure and the
strain was measured using an axial extensometer with a 12.5mm gage length. The fatigue tests
were performed using an axial extensometer under strain control at 5 Hz under fully reversed (R
= -1) loading to 50,000 cycles. Note that under strain control, the load was allowed to develop
during each cycle. After 50,000 cycles, the specimen was considered cyclically stable and the
tests were continued to failure in load control at 30 Hz. Strain amplitudes tested were 0.002,
0.003, 0.004, 0.005, 0.006, and 0.007 with the 7075-T651 also being tested at 0.008 and 0.009
strain amplitudes to achieve appreciable plasticity for modeling purposes. Failure of the strain
fatigue tests was defined as a 50% drop in the peak stress amplitude achieved.
The fracture surfaces from the fatigue tests were examined using scanning electron
microscopy (SEM) for the purposes of measuring crack growth striations and identifying crack
initiation sites. The specimens were prepared by cutting immediately below the fracture surface,
mounting to an SEM sample holder using carbon tape, and cleaning in a plasma cleaner for 5:00
minutes. An Electron Diffraction Spectroscopy (EDS) Camera was used to gather chemical
analysis of the initiation sites in the fracture surfaces.

6
3. Fatigue Model
3.1 Strain-Based Approach
Strain-based fatigue modeling is used frequently in low-cycle fatigue applications where
it can accurately capture the plasticity driving fatigue damage in this regime. The strain-based
approach works using a fully-reversed, constant-amplitude test to resolve elastic and plastic
strains, as shown in Equation 2.
(2)
The stress amplitude, /2, can be expressed as a function of the number of reversals empirically
by the Basquin equation [18-21]
(3)
where is the fatigue strength coefficient and b is the fatigue strength exponent. Since the
elastic strain amplitude, e, is equal to /2 , where is the elastic modulus, Eq. (3) can be
transformed to give the elastic strain amplitude as
(4)
On the other hand, the dependence of reversals to failure on the plastic strain amplitude is
represented by the Coffin-Manson equation [18-21]
(5)

7
where is the fatigue ductility coefficient, and c is the fatigue ductility exponent. Combining
Eqs. (3) and (4), we obtain the total strain amplitude as a function of the number of cycles to
failure [18-21]
(6)
Similar to monotonic stress-strain curves that have been used to determine design
parameters for engineering structures and components, cyclic stress-strain curves can be used to
assess the durability of the same structures and components which experience cyclic loading.
Analogous to the monotonic deformation in tension, the cyclic stress-strain behavior can be
represented by a power law function [20]
(7)
where K is the cyclic strength coefficient and n is the cyclic strain hardening exponent.
3.2 Microstructure-Based Approach
The Multistage fatigue (MSF) model was originally developed to model a cast Al-Si-Mg
alloy [6], and it has since been expanded to model wrought aluminum alloy [7-9,12], cast
magnesium alloys [10, 13-14], and wrought magnesium alloys [15, 21]. In this model, the
number of cycles are associated with the specific stages of damage are given below:
where NInc is the number of cycles to incubate a crack at a micronotch that includes the
nucleation of crack-like damage and early crack propagation through the zone of the
micronotch’s root influence; NMSC is the number of cycles required for propagation of a

8
microstructurally small crack; NPSC is the number of cycles required for propagation of a
physically small crack (PSC), and NLC is the number of cycles required for long crack
propagation.
3.2.1. Stages of Fatigue Damage
Crack incubation involves nucleation plus small crack growth at the micronotch on the
order of ½ D, where D is the inclusion size. Small crack growth (MSC) comprises propagation
of microstructural cracks with lengths that fall within ai < a < k MS, where ai is the initial crack
length, MS is a characteristic length scale (defined as the smallest grain size) of interaction with
microstructural (MS) features, and k is a multiplier where 1 ≤ k ≤ 3 [6-7]. The PSC range
consists of crack propagation with a crack length in the interval of k MS < a <~ (10 MS).
Depending on the microstructural inclusion morphology and texture of the matrix, the PSC
regime may extend from 300 µm to ~2-3 mm in length.
3.2.2. Crack Incubation Regime
The fatigue damage incubation life, Ninc , is characterized by the cyclic damage at the
micronotch root. For the purposes of this paper the terms micro-notch and inclusion are used
interchangeably. This required implementation of a modified Coffin-Manson law [6] at the
microscale as follows:
(8)
where is the nonlocal damage parameter around an inclusion, is the local average
maximum plastic shear strain amplitude, and and are linear and exponential coefficients
for fatigue crack incubation life, respectively. The numerical value of the exponent was

9
selected to be in the range of the macroscopic Coffin-Mason law [6]. Note that is estimated by
the following relations:
, (9)
. (10)
Here, is the remote applied strain amplitude, th is the microplasticity threshold, and l is the
nominal linear dimension of the plastic zone size in front of the inclusion. The ratio is defined
as the square root of the ratio of the plastic zone over the inclusion area, and the parameters
and are determined from micromechanical simulations [7]. The limiting ratio, , indicates
the transition from proportional (constrained) micronotch root plasticity to nonlinear
(unconstrained) micronotch root plasticity with respect to the applied strain amplitude, where has been found to be suitable for extruded Al alloys. [7]. Future micromechanical
finite element simulations will be needed to confirm that this limiting ratio is the same for all
four materials. The parameter Y [6-7] is correlated as , where R is the load
ratio, and y1 and y2 are model constants. For completely reversed loading cases, .
Furthermore, when reaches its limits the parameter Y is revised to include the geometric effects
related to the type of inclusion, . The debonded particle and pore of the same size
may cause a different Y as a factor of three or greater [23]. The correlation of the plastic zone
size is calculated using the with respect to the remote loading strain amplitude,
, (11)
a

10
, (12)
where r, a shape constant for the transition to the limited plasticity, is determined through
micromechanical simulations [7], and is the percolation limit [6].
3.2.3 Small Crack Growth Regime
Similar to modeling efforts in wrought Al alloys [7], we combine the mathematical
expressions for the MSC and PSC regimes into a single mathematical form. Crack growth in the
MSC/PSC is governed by the range of crack tip displacement, CTD, which is proportional to
the crack length, and the nth
power of the applied stress amplitude, , in the high cycle fatigue
(HCF) regime and to the macroscopic plastic shear strain range, , in the low cycle fatigue
(LCF), and it is given by the following,
(13)
(14)
Here, χ is a constant for a given microstructure, typically less than unity and usually taken as
0.32 for several different alloys [7], ai is the initial crack length, GS is grain size, GS0 is a
reference grain size. The , , and χ are material dependent parameters that capture the
microstructural effects on MSC growth [6-8]. The threshold value for crack tip displacement
was defined on the order of the Burger’s vector for the Al-rich matrix [24], . The term is the combination of the uniaxial effective stress amplitude, , and the maximum principal stress range, , and is given as

11
, with as the path dependent loading parameter after Ref. [7], where is a
weighting parameter such that gives the von Mises stress state, and gives the
maximum for principal stress state. The parameter is employed to incorporate the load ratio
effects and is defined as [7]. To capture the effect of grain size on small crack growth,
we employ the ratio of grain size to the reference size for each of the three materials in
this study, where is the reference grain size, is the specific grain size, and is a material
parameter [6].
3.2.4 Long Crack Growth Regime
The long crack growth stage of the MSF model usually follows classical linear elastic
fracture mechanics (LEFM) approaches [6]. The model approach used in this study uses only the
incubation and MSC/PSC regimes, like Jordon et al. [12], which has been shown capable of
characterizing cracks up to several millimeters in length [6]. Thus, the MSF model is essentially
used to predict the onset of surface crack initiation in structural components and therefore long
crack propagation is generally not considered.

12
4. Results and Discussion
4.1. Microstructure
The intermetallic particles were observed through optical microscopy of polished
specimens, and the images are shown in Figure 1. The intermetallic particles present in 7075-
T651 aluminum alloy are primarily either MgZn2, which appear very dark under an optical
microscope, or Fe-rich particles, which appear as an intermediate color between the MgZn2 and
the base material. From Agarwal et al. [25], the 6061 aluminum alloy shows the same color
tendencies with Mg2Si particles in place of the as the 7075 aluminum alloy. Particles stringers
were observed in the 7075 aluminum alloy in the direction of extrusion direction but were not
present in the 6061 aluminum alloy. Furthermore, the particle alignment in the 6061 aluminum
alloy exhibited no orientation preference relative to the extrusion direction. The particle sizes are
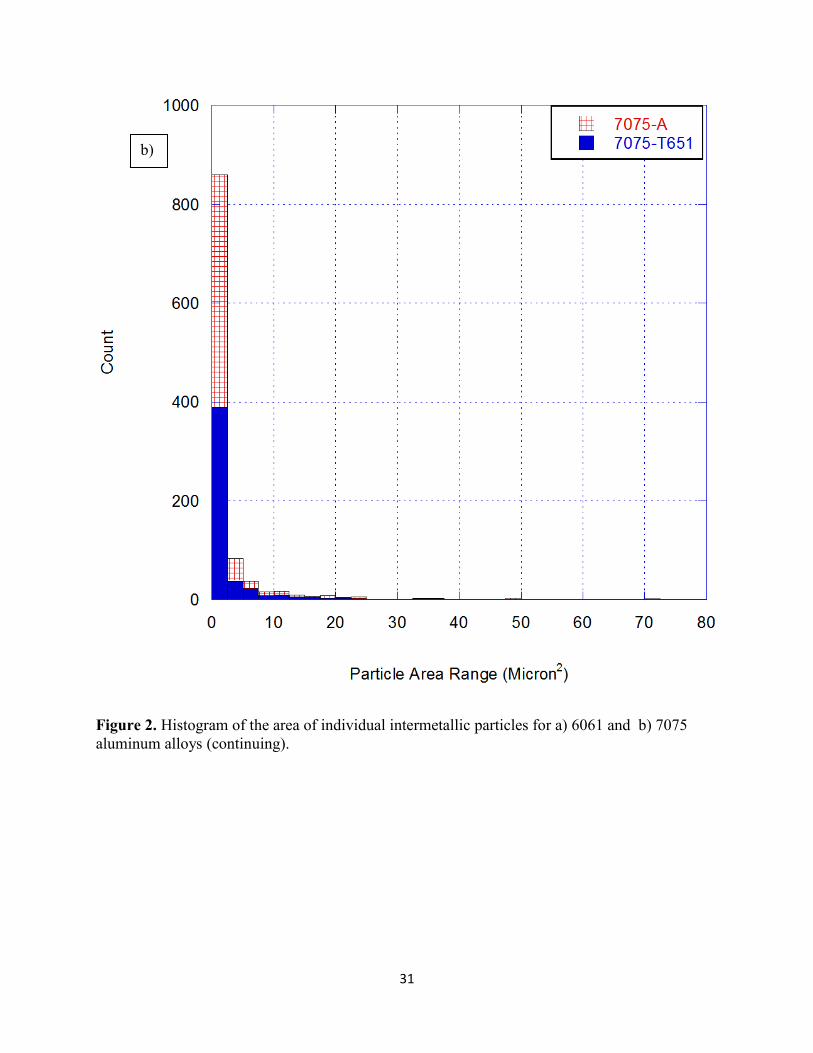
also shown graphically in the histogram, in Figure 2, which shows that the 7075 aluminum alloys
have more total particles, and the 6061 aluminum alloy has a higher concentration of larger
particles. In both materials, the high-temperature exposure increased the total number of particles
visible under 1000x optical magnification, and an increase in particle size was also observed. In
addition, a nominal intermetallic particle size and nearest neighbor distance were determined for
each of the materials, and since the Fe-rich particles are the typical crack initiation site in all of
these materials, the statistical bound of the particle size can be combined with the MSF model to
predict the scatter of the fatigue data. The etched granular structure for all four materials are

13
presented in Figure 3. The 6061-T6 aluminum alloy was found to have a grain size of around
75μm, and the 7075-T651 aluminum alloy was found to have a nominal grain size of 105μm.
4.2. Monotonic Stress-Strain Behavior
The monotonic tensile behavior of these aluminum alloys was examined and
characterized prior to fatigue testing. The monotonic tensile curves can be seen in Figure 4 with
the cyclic stress-strain curve. In comparing the peak-aged and heat-exposed specimens, the
elastic components are almost identical, with very little difference in elastic modulus, but both
6061-A and 7075-A aluminum alloys exhibit significant decreases in yield and ultimate strength.
Specifically, the yield strength decreased approximately 50% in the heat-effected specimens, and
the ultimate strength decreased by approximately 33%. These results compare closely to work by
Prietto et al. [3] where similar decreases in the strength of 6061aluminum alloy were observed,
including a loss of strength and decrease in hardness. This decrease in mechanical properties is
due to a thermal-resetting of the work-hardening present in the T6 and T651 tempers. This
conclusion is supported by comparison to the stabilized cyclic stress-strain curves, where the
7075-T651 shows no strain hardening, while the 6061-T6 shows appreciable strain-hardening at
higher strain amplitudes. However, the cyclic 6061-A more closely follows the monotonic 6061-
T6 curve, and the 7075-A curve shows significant strain hardening, although it does not
approach the monotonic level of 7075-T651. Table 1 shows the monotonic characterization of all
4 specimen sets, which indicates that both the 7075 aluminum alloys have a higher yield and
ultimate strength than the corresponding 6061 aluminum alloys.

14
4.3. Cyclic Stress-Strain Behavior
The strain-life experimental results are shown in Figure 5 along with the strain-based
modeling approach. The strain-life approach provides a good representation of the experimental
trends of both the peak-aged and heat degradation effects. The experimental results for both 6061
and 7075 aluminum alloys show similar trends, whereas during low cycle fatigue (LCF) no
appreciable difference was observed between the peak aged and heat-effected materials. This
lack of difference is due to an increase in ductility compensating for a loss in yield and ultimate
strength in the heat-effected aluminum alloy. However, in high cycle fatigue (HCF), however,
both materials show significant degradation in number of cycles to failure in the heat-exposed
aluminum alloys due to the lower yield and ultimate strengths when compared to the peak-aged
aluminum alloys. In the 6061-A at HCF, the plastic strain contribution is nearly twice as large as
in the T6 temper. By contrast, in the 7075 aluminum alloys, the T651 temper is almost
exclusively captured by the elastic portion of the strain life equation, while the annealed
condition shows a significant contribution of the plastic strain component above a strain
amplitude of 0.004. Table 2 shows a list of all specimens tested, including the specific strain-
levels tested at and cycles to failures.
In Figure 6, the hysteresis response from the first cycle is shown. The hysteresis loops
show a significantly larger amount of plasticity in the heat-exposed specimens as opposed to the
T6 specimens in both the 6061 aluminum alloy and T651 in the 7075 aluminum alloy. Figure 7
shows the cyclically stable hysteresis response, which illustrates that some plasticity is still
present at all strain amplitudes except for the 7075-T651 aluminum alloy. Note, the 6061-A and
7075-A do not achieve a cyclically stable state, so the cycle prior to load drop off was used in
plotting Figure 7. Figure 8 shows the stress amplitude versus number of cycles for the 6061 and

15
7075 aluminum alloys. From Figure 8b and 8d it is apparent that the cyclic hardening is most
pronounced in the 6061-A and 7075-A specimens, and is only present in the highest strain
amplitude tests in the 7075-T651. The difference between the peak aged and heat effected
materials is due to a thermal-resetting of the work hardening in the T6/T651 specimens during
the "annealing" process.
4.4. Fatigue Crack Initiation
In both materials, the dominant fatigue crack that lead to fracture was found to have
typically initiated and propagated through a flat area on the fracture surface. The fatigue cracks
were found to initiate at Fe-rich particles in both 6061-T6 and 7075-T651 aluminum alloys
similarly observed elsewhere [7-9,12,25]. Based on SEM analysis, the 6061-T6 aluminum alloys
was observed to fail primarily due to particle cracking and crack propagation similar to
observations reported by Agarwal et al. [25]. A representative fracture surface for the 6061-T6
aluminum alloy tested at 0.003 strain amplitude is shown in Figure 9 where the particle that
initiated the fatigue crack is outlined. Figure 10 shows a representative fracture surface from
6061-A tested at 0.007 strain amplitude. Typically, the initiation site revealed particles that are
larger than the statistical mean particle size. Additionally, particle de-bonding was observed
more frequently in the annealed aluminum alloy than the T6 version, likely due to the decrease in
yield/ultimate strength seen in the annealed aluminum alloy. Based on the particle size analysis
shown in Figure 2, this disparity in initiating particle size and the higher frequency of particle
clusters at initiation sites are likely due to the increase in the number of particles of all sizes in
6061-A compared to 6061-T6.

16
The 7075-T651 aluminum alloy was found to initiate cracks primarily at intermetallic
particle stringers through particle cracking similar to reported elsewhere [7-9,12]. A
representative initiation site for the 7075-T651 aluminum alloy is shown in Figure 11 for a
specimen tested at a strain amplitude of 0.0045. Several particles that all initiated cracks are
clearly illustrated on the top edge of the specimen. The most common mode of crack initiation
was particle cracking as reported by Xue et al. [7-9]. Similarly, Figure 12 shows a typical
initiation site for 7075-A tested at a strain amplitude of 0.007. It was observed that fatigue cracks
initiated at both particle clusters and individual particles due to particle cracking primarily.
However, some particle debonding was observed but not as frequently as in the 6061-A
aluminum alloy.
4.5. Fatigue Crack Growth
Figure 13 shows a representative image of the striations area approximately 0.05 mm
from the initiation location of a 6061-A specimen tested at a strain amplitude of 0.007. The
distance at which the striations were discernible from the initiating particle varied from 50 μm to
150 μm, and particularly with the 7075-T651, interactions between striations from multiple
initiation sites typically limited measurements outside of certain regions. The crack growth rate
is related to the width of the fatigue striations, and the correlation between the crack growth rate
and overall crack length is shown in Figure 14. Some scatter is observed in Figure 14, but the
crack growth rate suggests an upward trend as the crack propagates through the specimen. By
comparing the peak aged specimens to the heat-degraded samples, the crack growth rate
increased at a slower rate with respect to crack length in the peak aged specimens. Furthermore,
the peak aged aluminum alloy is more resistant to crack propagation for any given overall crack
length. Additionally, the scatter observed in the striation results plotted in Figure 14 is caused by

17
multiple factors, including low-angle grain boundaries and intermetallic particles impeding the
crack growth, but the overall increasing crack growth rate is observed. The difference in crack
growth rates between the peak aged and heat exposed aluminum alloys is most notably caused by
the decrease in yield and ultimate strength. This decrease in strength in turn decreased the crack
resistance of the heat-exposed materials.
4.6. Multistage Fatigue Model Correlations
Figure 15 shows the overall prediction of the MSF model for the 6061 and 7075
aluminum alloys, with the heat degradation accounted for through the use of material properties,
microstructure information, and the constant α from the incubation equation (8). The trends
observed in the experimental results are satisfactorily captured by the MSF model with the
relative weight of crack growth addressed. In the LCF regime, there is no appreciable
degradation from the heat exposure, as mentioned earlier due to the increased ductility that
compensated for the decrease in strength. In the HCF regime, however, the decreased ultimate
and yield stresses in the annealed specimens became more dominant, and so a significant gap in
fatigue performance is illustrated in both the experimental and modeling results.
The comparison of the results of the MSF modeling to the experimental results showed a
good correlation to the 6061 aluminum alloys. In fact, the MSF model captured the trend of the
6061-A exhibiting better fatigue performance than the T6 in the LCF regime. Likewise, the
model captured the experimental trend of the 6061-A exhibiting a degradation in the HCF
regime. Similar to the 6061 aluminum alloy, the MSF model showed good comparison to the
7075 aluminum alloy by capturing the degradation effect due to the heat exposure. The MSF

18
model parameters given in Table 4 are found suitable for the peak-aged and heat effected
materials.
The MSF model provides additional capability to discretize the total fatigue life into
components to further correlate the proportion of the life spent incubating the crack versus that
spent in the small crack growth phase, as shown in Figure 16. As expected in wrought materials,
in the LCF regime, small crack growth is more influential in all four materials, but the
percentage of the total life by crack incubation increases as the strain amplitude decreases until
crack incubation dominates the fatigue life in the HCF regime. For the 6061 aluminum alloys,
the contribution of small crack growth is a smaller percentage in the heat exposed material
compared to the T6 temper over the entire range of strain amplitudes tested. However, in 7075
aluminum alloy, the opposite was observed where the small crack contribution increased
significantly in the annealed compared to the T651. This is due to the difference in the ultimate
strength between the two aluminum alloys, resulting in more plasticity in the 6061 aluminum
alloy compared to the much lower observed plasticity in the 7075 aluminum alloy. The
incubation life is a lesser component at all strain levels of both the heat-degraded materials than
the peak aged materials for any given strain amplitude due to the relatively rapid increase in
crack growth rate with crack length present in the heat degraded materials. Additionally, the
resulting fit of the MSF model self-verifies the assumption that the long crack growth life can be
neglected.

19
5. Summary
Strain-controlled fatigue tests were conducted on 6061-T6 and 7075-T651 as well as both
materials after being thermally exposed for 1 hour at 1000ºF. The following conclusions are
reached:
1. Monotonic and strain-life fatigue tests were conducted, and the results were used to
characterize the material behavior under both monotonic and cyclic loading for 6061-T6,
6061-A, 7075-T651, and 7075-A.
2. Scanning electron microscope images were used to determine preferential crack initiation
sites at Fe-rich particles for the 6061 aluminum alloy and at Fe-rich particle clusters in
the 7075 aluminum alloy. Crack growth rates with respect to overall crack length were
also explored, and showed an increase in growth rate with crack length. Chemical (EDS)
analysis was performed on the particles that initiated fatigue cracks, and these results
showed that the particles are Fe-rich, similar to those found in literature [7-9].
3. Through the use of optical microscopy, statistics of particle size and nearest neighbor
distance were determined. The Fe-rich particles that were found to initiate cracks were
larger, on average, than the statistical particle size in the untested state.
4. By using microstructure results and mechanical properties, an MSF model was correlated
to the fatigue behavior of both the peak-aged and heat-degraded aluminum alloys. These
different heat-treatments were captured using one unique set of model constants, with

20
only the material constants and the small crack growth exponent updated for a given
material.

21
References
1. ASM International Handbook Committee, ASM Specialty Handbook: Aluminum and
Aluminum Alloys. Davis J.R., Ed., Materials Park: ASM International 1993.
2. Dorward R.C., and Bouvier C., A rationalization of factors affecting strength, ductility,
and toughness of AA6061-type Al-Si-Mg-(Cu) alloys. Mater. Sci. and Eng 1998; A254:
33-44.
3. Prietto M., Tsang M., Hernandez S. The effects of heat damage of aluminum 6061-T6
AM-2 mats and high-power run-up anchor. Engineering Failure Analysis 2011; 18:124-
137.
4. Mrówka-Nowotnik G. Influence of chemical composition variation and heat treatment on
microstructure and mechanical properties of 6XXX alloys. Archives of Material Science
and Engineering 2010; 46:2:98-107.
5. Tajally M, Emadoddin E. Mechanical and anisotropic behaviors of 7075 aluminum alloy
sheets. Materials and Design 2011; 32:1594-1599.
6. McDowell D.L., Gall K., Horstemeyer M.F., and Fan J. Microstructure-Based Fatigue
Modeling of Cast A356-T6 Alloy. Engineering Fracture Mechanics 2003; 70:49-80.
7. Xue Y., McDowell D.L., Horstemeyer M.L., Dale M.H., and Jordon J.B.. Microstructure-
based Multistage Fatigue Modeling of Aluminum Alloy 7075-T651. Engineering
Fracture Mechanics 2007; 74:17:2810-2823.
8. Xue, Y., El Kadiri, H., Horstemeyer, M.F., Jordon, J.B., Weiland, H., Micromechanisms
of Multistage Crack Growth in a High-Strength Aluminum Alloy, Acta Materialia 2007;
55(6):1975-1984.
9. Xue, Y., McDowell, D.L., Horstemeyer, M.F., Dale, M., Jordon, J.B., Microstructure-
based multistage fatigue modeling of aluminum alloy 7075-T651. Engineering Fracture
Mechanics 2007; 74:2810-2823.
10. Xue, Y, Horstemeyer, M.F McDowell, D, El Kadiri, H., and Fan, J., Microstructure-
based multistage fatigue modeling of a cast AE44 magnesium alloy. Int J. Fatigue 2007;
29:666–676.

22
11. Xue, Y., Pascu, A., Horstemeyer, M.F, Wang, L., Wang, P.T., Microporosity effects on
cyclic plasticity and fatigue of LENS(TM)-processed steel, Acta Materialia
2010;58(11):4029-4038.
12. Jordon, J.B., Horstemeyer,M.F., Bernard, J.D., Solanki, K., Berry, J.T. Damage
Characterization and Modeling of a 7075-T651 Aluminum Plate. Mat Sci Eng. A 2009;
527, 1-2:169-178.
13. Jordon, J.B., Horstemeyer,M.F., Yang, N. Major, J.F. Gall, K. Fan, J. McDowell, D.L.
Microstructural Inclusion Influence on Fatigue of a Cast A356 Aluminum Alloy,
Metallurgical and Materials Trans A 2010; 41(2):356-363.
14. Jordon J.B., Horstemeyer M.F., Yang N., Major J.F., Gall K., Fan J., McDowell D.L.
Microstructural Inclusion Influence on Fatigue of a Cast A356 Aluminum Alloy.
Metallurgical and Materials Trans A 2009; 41: 356-363.
15. Lugo M., Jordon J.B., Solanki K.N., Hector Jr. L.G., Bernard J.D., Luo A.A.,
Horstemeyer, M.F., Role of Different Material Processing Methods on the Fatigue
Behavior of AZ31 Magnesium Alloy. International Journal of Fatigue 2013 (Accepted).
16. Jordon, J.B., Horstemeyer, M.F., Solanki, K., Xue, Y., 2007. Damage and stress state
influence on the Bauschinger effect in aluminum alloys. Mechanics of Materials, 39:920-
931.
17. Annual Book of ASTM Standards. Metals test methods and analytical procedures. vol.
03.01. West Conshohocken, PA: ASTM; 2003.
18. Basquin O.H., The Exponential Law of Endurance Tests. Am. Soc. Testing Mater. Proc.
1910; 10: 625–630.
19. Dieter G.E.. Mechanical Metallurgy, Third Edition, McGraw-Hill 1986.
20. Bannantine J.A., Comer J.J., Handrock J.L., Fundamentals of Metal Fatigue. New Jersey:
Prentice Hall, 1997.
21. Stephens R.I., Fatemi A., Stephens R.R., Fuchs H.O., Metal Fatigue in Engineering. 2nd
ed. New York: John Wiley & Sons, 2001.
22. Jordon J.B., Gibson, J.B., Horstemeyer, M.F., Kadiri H.E., Baird, J.C., Luo A.A., Effect
of Twinning, Slip, and Inclusions on the fatigue anisotropy of extrusion-textured AZ61
magnesium alloy. Material Science and Engineering A 2011; 528(22): 6860-6871.
23. Gall K., Horstemeyer M.F., McDowell D.L., and Fan J. Finite Element Analysis of the
stress distributions Near Damaged Si Particles Clusters in Case Al-Si Alloys. Mechanics
of Materials 2000; 32:277-301.

23
24. Hayhurst D.R., Leckie D.L., McDowell, D.L. Damage growth under non-proportional
loading. ASTM STP 1985; 853: 553-558.
25. Agarwal H., Gokhale A.M., Graham S., Horstemeyer M.F. Void growth in 6061-
aluminum alloy under triaxial stress state, Material Science and Engineering 2003;
A341:35-42.

24
Table 1. Monotonic Properties of 6061-T6, 6061-A, 7075-T651, and 7075-A.
Property Extruded 6061-
T6
Extruded 6061 -
A
Extruded 7075-
T651
Extruded 7075-
A
Young's
Modulus
67.8 GPa 66.7 GPa 71.6 GPa 70.7 GPa
0.2% Yield
Strength
233 MPa 93.4MPa 538.6 MPa 209 MPa
Monotonic
Stress-Strain
Coefficient
(K)
178 MPa 337.58 MPa 631.5 MPa 756.7 MPa
Strain
Hardening
Exp. (n)
0.360 0.2234 0.0345 0.2326
U T S 320 MPa 223.5 MPa 665.8 MPa 497.7 MPa

25
Table 2. List of tested specimens, including cycles to failure and strain amplitude ( * indicates
runout).
Specimen Material Strain
Amplitude
(mm/mm)
Cycles to
Failure
Diameter (mm)
T-6-1 6061-T6 0.006 1326 6.29
T-6-2 6061-T6 0.005 2181 6.30
T-6-3 6061-T6 0.004 4551 6.32
T-6-4 6061-T6 0.003 25378 6.33
T-6-5 6061-T6 0.002 1873032* 6.31
T-6-6 6061-T6 0.006 720 6.30
T-6-7 6061-T6 0.006 995 6.22
T-6-8 6061-T6 0.003 42761 6.27
T-6-9 6061-T6 0.004 3750 6.28
T-6-10 6061-T6 0.005 1597 6.22
T-6-11 6061-T6 0.003 14538 6.32
T-6-12 6061-T6 0.003 22479 6.27
T-6-13 6061-T6 0.004 6535 6.29
T-6-14 6061-T6 0.005 2047 6.29
T-6-15 6061-T6 0.007 721 6.32
T-6-16 6061-T6 0.005 4622 6.35
T-6-17 6061-T6 0.005 2138 6.32
T-6-18 6061-T6 0.006 1024 6.36
T-6-19 6061-T6 0.004 5537 6.35
T-6-20 6061-T6 0.004 6699 6.39
T-6-21 6061-T6 TENSION TENSION
(0.001mm/mm/s)
6.39
T-6-22 6061-T6 0.006 1354 6.30
T-6-23 6061-T6 0.007 850 6.34
T-6-24 6061-T6 0.005 1241 6.36
T-6-25 6061-T6 0.003 70036 6.35
A-6-1 6061-A TENSION TENSION
(0.001mm/mm/s)
6.32
A-6-2 6061-A 0.007 1426 6.38
A-6-3 6061-A 0.005 1171 6.34
A-6-4 6061-A 0.006 1246 6.34
A-6-5 6061-A 0.006 2764 6.38
A-6-6 6061-A 0.005 893 6.34
A-6-7 6061-A 0.005 794 6.32
A-6-8 6061-A 0.007 1634 6.35
A-6-9 6061-A 0.003 13034 6.34
A-6-10 6061-A 0.004 5657 6.32
A-6-11 6061-A 0.004 6661 6.32
A-6-12 6061-A 0.003 11594 6.34
T-7-1 7075-T651 0.006 1024 6.36

26
T-7-2 7075-T651 0.004 22410 6.40
T-7-3 7075-T651 0.004 75142 6.38
T-7-4 7075-T651 0.006 8863 6.38
T-7-5 7075-T651 0.006 5890 6.35
T-7-6 7075-T651 0.005 7876 6.30
T-7-7 7075-T651 0.007 1252 6.29
T-7-8 7075-T651 0.007 2806 6.34
T-7-9 7075-T651 0.006 62360 6.31
T-7-10 7075-T651 0.005 15868 6.32
T-7-11 7075-T651 0.005 12260 6.30
T-7-12 7075-T651 0.006 3197 6.37
T-7-13 7075-T651 0.007 2411 6.32
T-7-14 7075-T651 0.0045 52825 6.34
T-7-15 7075-T651 0.004 96045 6.32
T-7-16 7075-T651 0.004 71234 6.33
T-7-17 7075-T651 0.004 165165 6.35
T-7-18 7075-T651 0.004 116568 6.33
T-7-19 7075-T651 0.0045 32642 6.35
T-7-20 7075-T651 0.0045 47341 6.33
T-7-21 7075-T651 0.003 2545805* 6.36
T-7-22 7075-T651 TENSION TENSION
(0.001mm/mm/s)
6.34
T-7-23 7075-T651 0.008 724 6.40
T-7-24 7075-T651 0.009 515 6.40
A-7-1 7075-A 0.007 1617 6.34
A-7-2 7075-A 0.006 2359 6.33
A-7-3 7075-A 0.005 5406 6.36
A-7-4 7075-A 0.004 10024 6.35
A-7-5 7075-A 0.003 49965 6.35
A-7-6 7075-A 0.007 1107 6.33
A-7-7 7075-A 0.006 1495 6.34
A-7-8 7075-A 0.005 6117 6.32
A-7-9 7075-A 0.004 21467 6.38
A-7-10 7075-A 0.003 61437 6.32
A-7-11 7075-A TENSION TENSION
(0.001mm/mm/s)
6.33

27
Table 3. Cyclic Properties of 6061-T6, 6061-A, 7075-T652, and 7075-A.
Property Extruded 6061-
T6
Extruded 6061
-A
Extruded 7075-
T651
Extruded 7075-
A
Cyclic Yield
Stress
270 MPa 180 MPa 532 MPa 274 MPa
Cyclic Stress
Strain Coefficient
(K')
502.8 MPa 238.6 MPa 792.8 MPa 457.5 MPa
Cyclic Strain
Hardening
Exponent (n')
0.0737 0.0353 0.0662 0.0826
Fatigue strength
coefficient, ( f')
705 MPa 240.12 MPa 952.3 MPa 601.1 MPa
Fatigue Strength
exponent (b)
-0.11 -0.029 -0.089 -0.091
Fatigue ductility
coefficient ( f')
2.40 2.24 0.182 25.7
Fatigue ductility
exponent (c)
-0.98 -0.86 -0.43 -1.1

28
Table 4. Multistage Fatigue (MSF) Model constants.
Constant 6061-
T6
6061-
A
7075-
T651
7075-
A
Description
Cra
ck I
ncu
bat
ion
Cm 0.3 0.3 0.3 0.3 Coefficient in Modified Coffin Manson Law (Eq. 8)
α -0.95 -0.65 -1.50 -0.90
Ductility exponent in Modified Coffin Manson Law
(Eq. 8)
q 4.7 4.7 4.7 4.7
Exponent in remote strain to local plastic shear strain (Eq. 9 &
10)
y1 100 100 100 100
Constant in remote strain to local plastic shear strain (Eq. 9 &
10)
y2 500 500 500 500
Linear constant in remote strain to local plastic shear strain
(Eq. 9 & 10)
ξ 2 2 2 2 Geometric factor in micromechanics study (Eq. 10)
r 0.3 0.3 0.3 0.3 Exponent in micromechanics study (Eq. 12)
ω 0.5 0.5 0.5 0.5 Omega (Eq. 14)
Sm
all
Cra
ck G
row
th
(MS
C/P
SC
)
Θ 0 0 0 0
Load path dependent and loading combination parameter (Eq.
14)
ζ 3.5 3.5 3.5 3.5 Exponent in Small crack growth (Eq. 14)
CI 500000 500000 500000 500000 HCF constant in small crack growth (Eq. 14)
CII 0.05 0.05 0.05 0.05 LCF constant in small crack growth (Eq. 14)
χ 0.35 0.35 0.35 0.35 Crack growth rate constant (Eq. 13)

29
Figure 1. The intermetallic particles of a) 6061-T6, b) 6061-A, c) 7075-T651, and d) 7075-A
aluminum alloys.

30
Figure 2. Histogram of the area of individual intermetallic particles for a) 6061 and b) 7075
aluminum alloys.
a)
31
Figure 2. Histogram of the area of individual intermetallic particles for a) 6061 and b) 7075
aluminum alloys (continuing).
b)

32
Figure 3. The etched microstructure of a) 6061-T6, b) 6061-A, c) 7075-T651, and d) 7075-A
aluminum alloys.

33
Figure 4. The monotonic and cyclic stress strain curves for a) 6061 and b)7075 aluminum alloys.
a)

34
Figure 4. The monotonic and cyclic stress strain curves for a) 6061 and b)7075 aluminum alloys
(continuing).
b)

35
Figure 5. The strain-life equation fits for a) 6061 and b) 7075 aluminum alloys.
a)

36
Figure 5. The strain-life equation fits for a) 6061 and b) 7075 aluminum alloys (continuing).
b)

37
Figure 6. The first cycle hysteresis loops for the a) 6061-T6, b) 6061-A, c) 7075-T651, and d)
7075-A aluminum alloys.
a)

38
Figure 6. The first cycle hysteresis loops for the a) 6061-T6, b) 6061-A, c) 7075-T651, and d)
7075-A aluminum alloys (continuing).
b)

39
Figure 6. The first cycle hysteresis loops for the a) 6061-T6, b) 6061-A, c) 7075-T651, and d)
7075-A aluminum alloys (continuing).
c)

40
Figure 6. The first cycle hysteresis loops for the a) 6061-T6, b) 6061-A, c) 7075-T651, and d)
7075-A aluminum alloys (continuing).
d)

41
Figure 7. Stabilized (mid-cycle) hysteresis cycles for a) 6061-T6, b) 6061-A, c) 7075-T651, and
d) 7075-A aluminum alloys.
a)

42
Figure 7. Stabilized (mid-cycle) hysteresis cycles for a) 6061-T6, b) 6061-A, c) 7075-T651, and
d) 7075-A aluminum alloys (continuing).
b)

43
Figure 7. Stabilized (mid-cycle) hysteresis cycles for a) 6061-T6, b) 6061-A, c) 7075-T651, and
d) 7075-A aluminum alloys (continuing).
c)

44
Figure 7. Stabilized (mid-cycle) hysteresis cycles for a) 6061-T6, b) 6061-A, c) 7075-T651, and
d) 7075-A aluminum alloys (continuing).
d)

45
Figure 8. Stress-amplitude evolution over the cycle of the fatigue test for a) 6061-T6, b) 6061-A,
c) 7075-T651, and d) 7075-A aluminum alloys.
a)

46
Figure 8. Stress-amplitude evolution over the cycle of the fatigue test for a) 6061-T6, b) 6061-A,
c) 7075-T651, and d) 7075-A aluminum alloys (continuing).
b)

47
Figure 8. Stress-amplitude evolution over the cycle of the fatigue test for a) 6061-T6, b) 6061-A,
c) 7075-T651, and d) 7075-A aluminum alloys (continuing).
c)

48
Figure 8. Stress-amplitude evolution over the cycle of the fatigue test for a) 6061-T6, b) 6061-A,
c) 7075-T651, and d) 7075-A aluminum alloys (continuing).
d)

49
Figure 9. The particle in the image of specimen T-6-5, tested at 0.003 strain amplitude, is typical
of the crack initiation sites found in the 6061-T6 aluminum alloy.

50
Figure 10. The particle in this image of specimen A-6-10, tested at 0.007 strain amplitude is
typical of the crack initiation sites in the 6061-A aluminum alloy, with clusters of particles that
are larger than those found in the 6061-T6 aluminum alloy.

51
Figure 11. The particle in this image of specimen T-7-20, tested at 0.0045 strain amplitude is
indicative of the initiation sites of 7075-T651 aluminum alloy. Almost exclusively the failures
occurred at particle clusters.

52
Figure 12. The particle in this image of specimen A-7-1 tested at 0.007 strain amplitude is one
of the typical modes of failure.

53
Figure 13. Fatigue striations were seen on most fracture surfaces on all materials represented by
these shown from specimen A-6-8, with the crack growth direction indicated by the arrow.

54
Figure 14. Compiled crack growth rates respective to overall crack length for a) the 6061
aluminum alloy and b) the 7075aluminum alloy.
a)

55
Figure 14. Compiled crack growth rates respective to overall crack length for a) the 6061
aluminum alloy and b) the 7075aluminum alloy (continuing).
b)

56
Figure 15. MSF model fit to the strain-controlled fatigue data in the peak-aged and heat-effected
states for a) 6061 and b) 7075 aluminum alloys.
a)

57
Figure 15. MSF model fit to the strain-controlled fatigue data in the peak-aged and heat-effected
states for a) 6061 and b) 7075 aluminum alloys (continuing).
b)

58
Figure 16. MSF fit of incubation and small crack growth for a) 6061-T6, b) 6061-A, c) 7075-
T651, and d) 7075-A aluminum alloys.
a)

59
Figure 16. MSF fit of incubation and small crack growth for a) 6061-T6, b) 6061-A, c) 7075-
T651, and d) 7075-A aluminum alloys (continuing).
b)

60
Figure 16. MSF fit of incubation and small crack growth for a) 6061-T6, b) 6061-A, c) 7075-
T651, and d) 7075-A aluminum alloys (continuing).
c)

61
Figure 16. MSF fit of incubation and small crack growth for a) 6061-T6, b) 6061-A, c) 7075-
T651, and d) 7075-A aluminum alloys (continuing).
d)


