Experimental Study of The Performance of a Solar Chimney ...
12
Journal of Mechanical Engineering Research and Developments ISSN: 1024-1752 CODEN: JERDFO Vol. 44, No. 7, pp. 340-351 Published Year 2021 340 Experimental Study of The Performance of a Solar Chimney Power Plant Model in Basrah City Qais A. Rishak, Hussien S. Sultan, Ihsan N. Jawad Department of Mechanical Engineering, College of Engineering, University of Basrah *Corresponding Author Email: [email protected], [email protected] [email protected] ABSTRACT Using renewable energy for power generation is fundamental for obtaining sustainable environment. The most available and widely used source of renewable energy is solar energy. The solar chimney power plant (SCPP) is one of the most important applications of renewable energy technologies for generating electrical energy from solar energy. Basrah city in Iraq is distinguished by a plentiful supply of solar radiation throughout the year, which encourages researchers to use solar energy in a variety of applications, particularly in the generation of electricity. The present article included an experimental study of the SCPP model within the climatic conditions of Basrah, Iraq, to evaluate the behaviour and performance of SCPP system. Many variables that affect the performance of the system are studied, such as solar radiation intensity, solar collector height and chimney height. The best and highest performance of the chimney is recorded experimentally at the height of the chimney and collector are 4.5m and 50mm respectively, where the velocity and available power are 2.5m/s and 57.6mW respectively. While the time at which the best system performance is achieved is between 11:00AM and 1:00PM. KEYWORDS renewable energy, sustainable, solar, chimney. INTRODUCTION An SCPP consists of three components the collector, the chimney and the power conversion power unit (turbine and generator) as shown in figure 1. It is a basic solar thermal power plant with a solar collector that is able to transform solar energy into thermal energy. In the second step, using a combination of a wind turbine and a generator, the produced thermal energy is transformed into kinetic energy in the chimney and eventually into electric energy. The solar radiation is absorbed by the collector and converted to thermal energy. The air inside the collector warms up and finally, with the natural warm air displacement, the thermal power is converted to electrical power by installing a turbine. Figure 1. General diagram of SCPP
Transcript of Experimental Study of The Performance of a Solar Chimney ...

Journal of Mechanical Engineering Research and Developments
ISSN: 1024-1752
CODEN: JERDFO
Vol. 44, No. 7, pp. 340-351 Published Year 2021
340
Experimental Study of The Performance of a Solar Chimney
Power Plant Model in Basrah City
Qais A. Rishak, Hussien S. Sultan, Ihsan N. Jawad
Department of Mechanical Engineering, College of Engineering, University of Basrah
*Corresponding Author Email: [email protected], [email protected]
ABSTRACT
Using renewable energy for power generation is fundamental for obtaining sustainable environment. The most
available and widely used source of renewable energy is solar energy. The solar chimney power plant (SCPP) is
one of the most important applications of renewable energy technologies for generating electrical energy from
solar energy. Basrah city in Iraq is distinguished by a plentiful supply of solar radiation throughout the year,
which encourages researchers to use solar energy in a variety of applications, particularly in the generation of
electricity. The present article included an experimental study of the SCPP model within the climatic conditions
of Basrah, Iraq, to evaluate the behaviour and performance of SCPP system. Many variables that affect the
performance of the system are studied, such as solar radiation intensity, solar collector height and chimney
height. The best and highest performance of the chimney is recorded experimentally at the height of the
chimney and collector are 4.5m and 50mm respectively, where the velocity and available power are 2.5m/s and
57.6mW respectively. While the time at which the best system performance is achieved is between 11:00AM
and 1:00PM.
KEYWORDS
renewable energy, sustainable, solar, chimney.
INTRODUCTION
An SCPP consists of three components the collector, the chimney and the power conversion power unit (turbine
and generator) as shown in figure 1. It is a basic solar thermal power plant with a solar collector that is able to
transform solar energy into thermal energy. In the second step, using a combination of a wind turbine and a
generator, the produced thermal energy is transformed into kinetic energy in the chimney and eventually into
electric energy. The solar radiation is absorbed by the collector and converted to thermal energy. The air inside
the collector warms up and finally, with the natural warm air displacement, the thermal power is converted to
electrical power by installing a turbine.
Figure 1. General diagram of SCPP

Experimental Study Of The Performance Of A Solar Chimney Power Plant Model In Basrah City
341
The first prototype tower was built in Manzanares in 1981, by the team of Professor Schlaich, Haaf et al., [1-2]
in Spain. It was worked from 1982 to 1989. The performance calculations for SCPP are important for estimation
the best dimensions, location and operating conditions. Perhaps one of the most disadvantages and limitations of
a solar chimney is its low efficiency. Therefore, many researchers have tried to address this defect. Therefore,
they began to modify and optimize the geometry of the collector and chimney to obtain improved airflow and
higher speed. From the studies presented by the researchers during the last 39 years between (1982-2021), it is
found that most of these studies were aimed at knowing and improving the performance SCPP by the variation
of the factors that affect the performance.
Hammadi [3] presented a mathematical model for studying the influence of several parameters on the SCPP
performance such as collector diameter, height and diameter of the chimney, solar radiation and wind velocity
according to Basrah climate conditions. Hannun et al. [4] presented a theoretical study to know the impact of the
shape of the collector base and also the effect of several storage materials on the SCPP performance. He
concluded that a circular collector base and black Pebble storage plate increase the output power of the solar
chimney. Hamdan [5] proposed a theoretical model for predicting the performance of an SCPP. This model
shows that, as the chimney height and diameter increase the exergy efficiency and power harvested also
increase.
Aja et al. [6] showed the influence of wind velocity and wind direction on the performance of solar chimney
facing toward south inclination then it was found that the wind velocity had more effect on convective heat loss
through the walls and the cover to the ambient. Koonsrisuk and Chitsomboon [7] proposed the use of
dimensionless variables to conduct the experimental study of flow in a small scale solar chimney power plant
for electricity generation. The similarity of the proposed dimensionless variables is confirmed by computing
fluid dynamics. Ali [8] proposed a model of the solar tower and studied the impact of the collector area,
chimney height, tower diameter and solar radiation on solar tower power output depending on Manzanares
model and climate conditions of Baghdad city in Iraq. He concluded that with the increase of these variables, the
output power of the solar chimney increases in varying proportions depending on the variable used.
Khalf [9] developed an SCPP model by using the air intake system at chimney outlet which working by the
wind to convert wind energy into useful energy. He concluded that this development in the model design led to
an increase in the value of the chimney velocity of the air inside the model, leading to increase the output power
of model about (10-15%). This study was conducted according to climatic conditions in Nasiriyah, Iraq.
Ghalamchi et al [10] designed a small model of an SCPP at Mehran University in Iran. They studied the effect
of the solar collector’s height on the performance of the solar chimney. They noticed that the power generated
doubles when the collector’s height is reduced in half. They also noticed that the highest air velocity within the
chimney was 1.30 m/s. Ayadi et al, [11] presented a widespread survey of the properties of an SCPP by
employing numerical and experiential method. Their study further confirmed that the collector roof elevation is
very principal on the enhancement of the SCPP performance.
In particular, results indicated an improvement in the generated power while reducing the collector roof
elevation. Abdelmohimen and Algarni [12] focused on the performance SCPP in six various places in Saudi
Arabia was investigated during the year. A numerical model was published with experimental data and used to
measure performance. The findings explain that an SCPP with an elevation of 194 m and a collector radius of
122 m can produce an average electric power per month of 56 kW in the city of Riyadh over a year. Ayadi, et al.
[13] introduced, a numerical and experimental study of the impact of the obstacles on the distributions of the
airflow in an SCPP is presented by using CFD Ansys software. Conclusions cleared that the produced power
lightly rises at putting obstacles at the collector output for the considered geometry and under the ambient
environmental conditions of the constructed geometry. Jawad et al [14] established a Matlab program with a
graphical user interface (GUI) code for studying the performance of an SCPP. The program gives the ability for
predicting the performance of SCPP for different geometry dimensions, ambient operating conditions and
locations. Also, this program is based on the solution of a mathematical model derived from the heat and mass
balance for the system components. The main objective of the present study is to design and construction a
Experimental Study Of The Performance Of A Solar Chimney Power Plant Model In Basrah City
342
small SCPP prototype in Basra city for performing experimental performance evaluation and knowing the real
behavior of this system.
Model design of SCPP
The model of SCPP is built and installed on the roof of a house which is located in Iraq, Basrah city, in Hai Al-
Jihad, which has the geographical location to be considered for the experimental work is Basrah city, which is
on latitude 47.78° N and longitude 30.468° E. The most important basic parameters of this model are listed in
table 1 and figure 2.
Solar Collector design
The solar collector is one of the main parts of the solar chimney and through it the solar radiation is transmitted.
The collector is designed in a horizontal flat circular shape with a radius of 1.5 m for this model. The roof of the
collector is covered with transparent glass with a thickness of 4 mm in the form of eight conical pieces. The
height of the collector for the first model is 50 mm from the ground and this height is changed to 90 mm to
study the effect of changing this height on the performance of the solar chimney. Regarding the collector
ground, for this model it is made of aluminium and coated with black paint to increase its heat emission as best
as possible, to heat the air under the roof of the collector. Also, a layer of insulation (foam) is placed under the
aluminium layer to reduce the heat losses. More details of the designed experimental model are shown in figure
2.
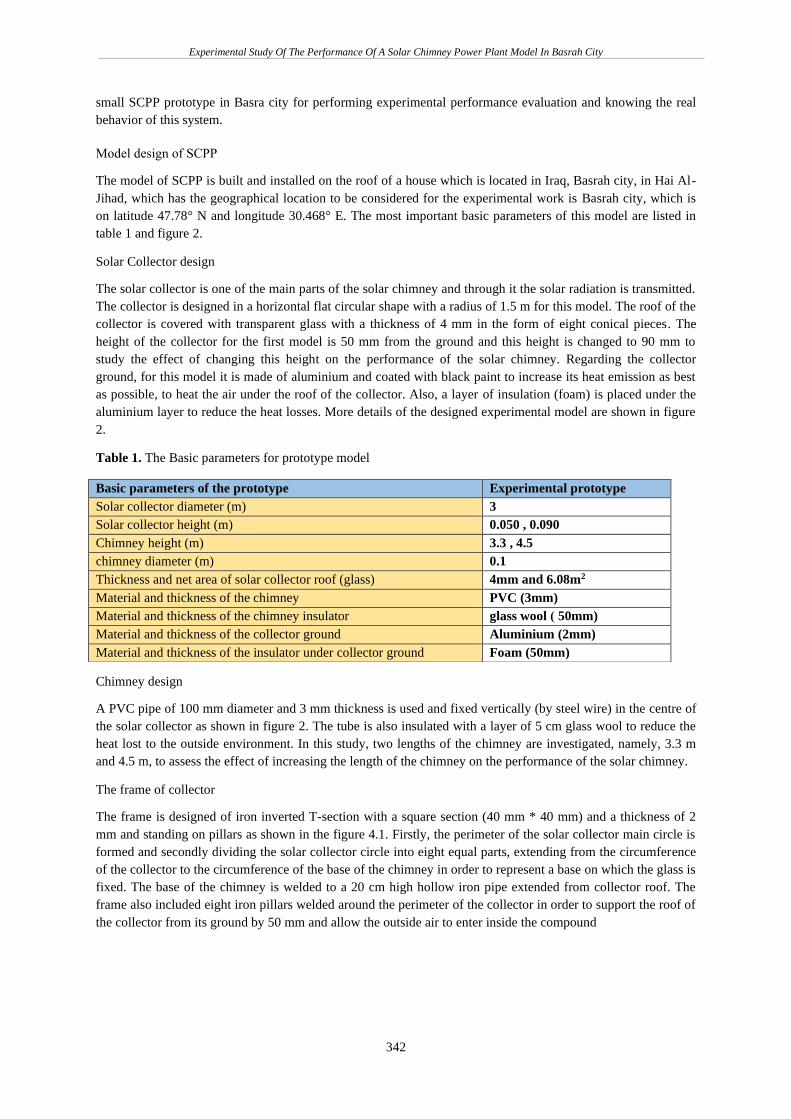
Table 1. The Basic parameters for prototype model
Chimney design
A PVC pipe of 100 mm diameter and 3 mm thickness is used and fixed vertically (by steel wire) in the centre of
the solar collector as shown in figure 2. The tube is also insulated with a layer of 5 cm glass wool to reduce the
heat lost to the outside environment. In this study, two lengths of the chimney are investigated, namely, 3.3 m
and 4.5 m, to assess the effect of increasing the length of the chimney on the performance of the solar chimney.
The frame of collector
The frame is designed of iron inverted T-section with a square section (40 mm * 40 mm) and a thickness of 2
mm and standing on pillars as shown in the figure 4.1. Firstly, the perimeter of the solar collector main circle is
formed and secondly dividing the solar collector circle into eight equal parts, extending from the circumference
of the collector to the circumference of the base of the chimney in order to represent a base on which the glass is
fixed. The base of the chimney is welded to a 20 cm high hollow iron pipe extended from collector roof. The
frame also included eight iron pillars welded around the perimeter of the collector in order to support the roof of
the collector from its ground by 50 mm and allow the outside air to enter inside the compound
Basic parameters of the prototype Experimental prototype
Solar collector diameter (m) 3
Solar collector height (m) 0.050 , 0.090
Chimney height (m) 3.3 , 4.5
chimney diameter (m) 0.1
Thickness and net area of solar collector roof (glass) 4mm and 6.08m2
Material and thickness of the chimney PVC (3mm)
Material and thickness of the chimney insulator glass wool ) 50mm)
Material and thickness of the collector ground Aluminium (2mm)
Material and thickness of the insulator under collector ground Foam (50mm)

Experimental Study Of The Performance Of A Solar Chimney Power Plant Model In Basrah City
343
Figure 2. Model of SCPP
Distribution of the temperature measuring points
Electronic temperature sensors are distributed in the designed solar chimney model by installing them in the
following location:
Chimney: Along the chimney, the temperature is measured at four points. These points have been uniformly
fixed in the centre of the chimney (as shown in the figure 2) to measure the temperature of the air flowing
through the chimney.
Solar collector: Three types of distributions of temperature measuring points, are used separately for the solar
collector. For the first type (distribution A), the measuring points are distributed for three concentric circles, in
each circle four measuring points are installed for the glass, collector ground, and air in the middle space
between the glass and the collector ground. The four measuring points are distributed equally on the
circumference of the concentric circles while the distribution of these circles are the same. In addition to
measure the temperature of the air entering the collector, four measuring points are installed around the
circumference of the collector in the mid-distance of collector height. Also, five measuring points are installed
on the bottom of the insulation layer between the ground plate and the earth. Four of those measuring points of
the insulation are fixed on the perimeter of the outer circle and the fifth in the centre of the collector. In this type
of distribution, 47 measuring points are used (as shown in the figure 3).
The second type of the distribution (distribution B) is illustrated in figure 4. It comprises 53 measuring points.
Four measuring points are fixed along the chimney (similar to distribution A). Nine measuring points are fixed
on the bottom of the insulation layer uniformly distributed on the circumference along the radial direction. The
remainder 40 points are distributed over two circles having 20 points for each one. Each circle includes four
points for glass and four points for ground and twelve points are installed along the air passage to measure its
temperature. These twelve points are uniformly distributed along the circumference and along the collector
height (z-direction). The diameter of each circle is shown in figure 4. The third type of distribution (distribution
C) is same as distribution B, except it has 61 points. The additional eight points are added along the collector
height. This because in this case, the collector height is greater than those of distribution A and B namely 90mm
(as shown in figure 5).

Experimental Study Of The Performance Of A Solar Chimney Power Plant Model In Basrah City
344
Figure 3. First type of distribution of temperature measuring points (Type A)
Figure 4. Second type of distribution of temperature measuring points (Type B)

Experimental Study Of The Performance Of A Solar Chimney Power Plant Model In Basrah City
345
Figure 5. Third type of distribution of temperature measuring points (Type C)
Collecting the data
The measurements are taken during the operation for the experimental model, where the ambient temperature
and relative humidity are measured, as well as the wind speed. The total solar radiation falling on the roof of the
solar collector is also measured in addition to the measurement of the air velocity in the chimney at a height of
1.5 m from the base of the chimney. The temperatures are also measured for the glass surface, collector and
insulator floor, as well as the air in the middle of the collector height. All these measurements are done for 10
hours every day (from 8:00AM until 5:00PM) from 25 June to 15 September during 2020.
In Table 2 some important characteristics of the instruments used in the experimental work are included.
Table 2. Characteristics of the instruments used in the experimental work
The name and model of the
device
Measured
quantity Resolution Accuracy Range
Response
period
Datalogging Solar Power
Meter TES-1333R Solar radiation
1 W/m2 ±10w/m2
1-2000
W/m2
0.4 s
Digital thermometer TPM-
10 Temperature 0.1°C ±1°C -10-120°C 2s
Digital anemometer AR826 Air velocity 0.1m/s ±3% ±
0.1dgts
0.1-45
m/s 0.6s
Mercury thermometer Ambient
temperature 1°C - -10-120°C -

Experimental Study Of The Performance Of A Solar Chimney Power Plant Model In Basrah City
346
RESULTS AND DISCUSSIONS
The results of this work are conducted experimentally on 20th of July 2020. The available power of the solar
chimney is based on the relation: [15]:
P = 0.5. ρ. A. V3 (1)
Where: ρ, A, V, air density (at location of velocity measurement), cross section area of chimney, and air
velocity inside the chimney, respectively.
The collected parameters are gathered in the following subsections.
Temperature distribution in chimney
For collector and chimney heights of 50mm and 3.3m respectively figure 6 shows the distribution of air
temperature inside the chimney. The temperature begins to gradually decrease with the height of the chimney,
reaching the lowest value at the exit of the chimney. This behaviour of the temperature distribution is almost
constant during the day. The air in the chimney inlet has the highest temperature due to its proximity of to the
ground of the heated collector. When moving upwards from the entrance to the chimney, the temperature drops
due to thermal losses through the wall and the outlet opening of the chimney.
Figure 6. Variation the air temperature distribution inside the chimney with time
Temperature distribution in collector
Figure 7 shows the temperature distribution of the collector ground, where this distribution changes with the
location of the measured points radially and azimuthally.
At morning, radially the points are located at the line between the northeast (NE) to southeast (SE) have the
greatest temperature than the points located at the line from southwest (SW) to northwest (NW) as shown in
figure 3. In the afternoon this behaviour changes are reversed. Points are located in a radius of 0.35 m have a
higher temperature than the points in the centre of the collector ground because of shading all the day.
Figure 7. Variation of temperature distribution for collector ground with radial and azimuth

Experimental Study Of The Performance Of A Solar Chimney Power Plant Model In Basrah City
347
Also, for figure 7, the temperature distribution is according to the first distribution of temperature measurement
points (Type A) as shown in Fig. 3 and at the height of collector and chimney are 50mm and 3.3 respectively.
Figure 8 shows the distribution of the temperature for the air inside the collector with the three dimensions
which are, radius (r), azimuth (θ) and collector height (z). These temperatures are for two values of the radius
(0.35m and 0.85m measured from centre), three values for the collector height (12.5mm, 25mm and 37.5mm)
and four values for the azimuth angle (θ-direction) which are (0o, 900, 180o and 270o). from this figure at r
=0.35m and r =0.85m, the temperature decreases with increasing the height from hot ground of the collector.
While the temperature increases with the increase of the azimuth angles less than 1800 and decreasing with
azimuth angles greater than 1800 due to the change of the solar location. Also, for constant collector height and
azimuth angle the temperature of the air increasing with decreasing radius due to in increase the amount of heat
collected with flowing toward the centre. For figure 8, the temperature distribution is according to the second
distribution of temperature measurement points (Type B) as shown in Fig. 4 and at the height of collector and
chimney are 50mm and 3.3 respectively.
Figure 8. Variation of temperature distribution for air inside the collector at Hco=50mm
Figure 9. Variation of temperature distribution for air inside the collector at HCO=90mm
Figure 9 shows the similar distribution of air temperature inside the collector but for the collector height is
90mm. the distribution with height are given for four points (18mm, 36mm, 54mm and 72mm). also, the
temperature decreasing with increasing the collector height, while the distribution for the radius and the azimuth
angle is almost similar to that explained in figure 8. For figure 9, the temperature distribution is according to the
third distribution of temperature measurement points (Type C) as shown in Fig. 5 and at the height of collector
and chimney are 90mm and 3.3 respectively.
Solar radiation measurement
Due to the importance of the incident solar radiation on the performance of the solar chimney, it has been
measured experimentally. The solar radiation falling on the collector ground is also measured by inserting the
radiation meter. Table 3 and 4 show the change in the values of solar radiation measured experimentally on the
20th day of July 2020 from 8:00 AM to 5:00 PM. According to Table 3, the measured data includes the solar

Experimental Study Of The Performance Of A Solar Chimney Power Plant Model In Basrah City
348
radiation falling on the surface of the dusty collector (I), the penetrating radiation falling on the unshaded region
of collector ground (I1), and the penetrating radiation falling on the shaded region of collector ground (I2) due to
the shade of the collector frame and chimney base.
The shaded ground area of the collector is about 14% of the total area of the collector ground, while the
remaining section is the unshaded collector ground area (86% of the total area of the collector ground). Also,
this table shows that the maximum values of radiation and the ratios (I1 / I), (I2 /I) are obtained between
11:00AM and 1:00PM o'clock, as well as the highest ratio (I1 / I) and (I2 /I). The average percentage of solar
radiation falling on the collector ground (0.86*I1 +0.14*I2)/I) is found to be 46.4%. This average percentage is
inversely proportional to the dust covering the collector roof (glass) and the rate of shading the collector ground.
To investigate the dust effect the data presented in table 3 are repeated for clean collector roof and depicted in
table 4. It is also found that the maximum values of radiation and (I1 / I), (I2 /I) ratios occurs at 11:00AM to
1:00PM. The average percentage of solar radiation falling on the collector ground (0.86*I1 +0.14*I2)/I) is found
to be 57.77%.
Depending on the results of Tables 3 and 4, the reasons for the decrease in the amount of solar radiation falling
on the collector ground can be explained by several reasons, the most important of which are:
(i) The reflected radiation from the surfaces.
(ii) The shading that is spread on the part of the base of the collector.
(iii) Accumulation of traces and dust on the roof of the solar collector (glass).
(iv) The angle of sun incidence, which changes during the daytime.
Table 3. Data of solar radiation falling on the collector roof dirty with dust
(0.86*I1 +0.14*I2)/I (%) I2 / I
(%)
I1 / I (%) I2
(W/m2)
I1
(W/m2)
I
(W/m2)
Time
38.24 9 43 62.55 298.85 695 8:00AM
46.12 10 52 89.5 465.4 895 9:00AM
51.56 12 58 124.8 603.2 1040 10:00AM
55.28 14 62 157.5 697.5 1125 11:00AM
56.24 15 63 174.9 734.58 1166 12:00PM
55.28 14 62 158.2 700.6 1130 1:00PM
50.84 13 57 130 570 1000 2:00PM
44.54 11 50 91.85 417.5 835 3:00PM
37.38 9 42 55.35 258.3 615 4:00PM
28.5 7 32 25.9 118.4 370 5:00PM
46.4 11.4 52.1 107 486.43 887.1 Average
Table 4. Data of solar radiation falling on the clean collector roof
(0.86*I1 +0.14*I2)/I (%) I2 / I
(%)
I1 / I (%) I2
(W/m2)
I1
(W/m2)
I
(W/m2)
Time
41.69 11 47 76.45 326.65 695 8:00AM
53.7 15 60 134.25 537 895 9:00AM
67.02 18 75 187.2 780 1040 10:00AM
73.32 20 82 225 922.5 1125 11:00AM
76.18 22 85 256.52 991.1 1166 12:00PM
74.32 21 83 237.3 937.9 1130 1:00PM
65.3 18 73 180 730 1000 2:00PM
52.7 14 59 116.9 492.65 835 3:00PM
40.96 10 46 61.5 282.9 615 4:00PM
30.36 8 34 29.6 125.8 370 5:00PM
57.55 15.7 64.4 150.74 612.65 887.1 Average

Experimental Study Of The Performance Of A Solar Chimney Power Plant Model In Basrah City
349
Temperature difference measurement
Figure 10 portrays the difference between the temp. at the entrance of the chimney and the ambient temperature
along the day for different collector and chimney heights. Generally, the maximum temperature. difference is
recorded of 11:00AM to 1:00PM. It is the observed from this figure, that the longer chimney and the shorter
height of the collector give the higher temp. difference. Also, decreasing the collector height increasing the
temperature difference due to decrease the mass flow of entering air. The maximum percentage increase in the
temperature. difference between 8:00AM and 1:00PM is about 2% for HCO = 50mm and HCH =4.5m.
Velocity variation inside the chimney
In figure 11, the trend of daily velocity variations for the same parameters of figure 10 is almost similar to that
of temp. distribution shown in figure 10. This is due to the correlated air velocity with the buoyancy force. The
percentage increase in the air velocity between 8:00AM and 1:00PM is about 1.08% for HCO = 50mm and HCH
=4.5m, while for HCO = 90mm and HCH =3.3m the percentage is about 0.88%.
Power variations
As given in equation 1, the available power is proportional with the cubic air velocity. The daily variations in
the available power with time is shown in figure 12. The figure demonstrates that, maximum available power
between 11:00AM and 1:00PM. The percentage increase of the available power between 8:00AM and 1:00PM
is about 3.97% for HCO = 50mm and HCH =4.5m, while for HCO = 90mm and HCH =3.3m the percentage is about
is about 3.28%. From the above figures (10,11 and 12), it is clearly evident that the time period that gives the
greatest power and velocity of the SCPP is between 11:00AM to 1:00PM during 20th of July. At height of
collector and chimney 50mm and 4.5 respectively, the greatest values are recorded for the speed and
temperature difference are 2.5m/s and 24C0, respectively, while the calculated available power is 57.6 mW as
shown in table 5.
Figure 10. Variation of temperature difference with time

Experimental Study Of The Performance Of A Solar Chimney Power Plant Model In Basrah City
350
Figure 11. Variation of air velocity in chimney with time
Figure 12. Variation of available power with time
Table 5. Parameters comparison among different height of collector and chimney
CONCLUSIONS
The main conclusions that can be obtained from this work are summarized as follows:
1- The best and highest performance of the chimney is recorded experimentally at the height of the chimney is
4.5m and the height of the collector is 50mm, where the velocity and power are 2.5m/s and 57.6mW
respectively. While the time at which the best system performance is achieved is between 11:00AM and
1:00PM.
2- By using a large number of temperature sensors, the behaviour of the temperature distribution in the SCPP
system is more accurate and visualized in the three dimensions.
Maximum available
power (mW)
Maximum
velocity (m/s)
Maximum air
temperature inside
collector(C0)
Chimney
height (m)
Collector
height (mm)
46 2.3 77 3.3 50
57.6 2.5 79 4.5 50
23.8 1.8 66 3.3 90
29.4 1.95 68 4.5 90

Experimental Study Of The Performance Of A Solar Chimney Power Plant Model In Basrah City
351
3- Experimentally, the percentage range of total radiation falling on the collector ground is 57.77% of the value
of radiation falling on the clean collector roof (glass) while, it is 46.4% of the value of radiation falling on
the dust collector roof. Also, the lowest losses of solar radiation falling on the collector obtained at the
midday, as well as when the collector's glass is clean.
4- Basarh city conditions are good for operating of SCPP.
REFERENCES
[1] W. Haaf, K. Friedrich, G. Mayr and J. Schlaich, “Solar Chimneys. Part 1: Principle and Construction of the
Pilot Plant in Manzanares”, International Journal of Solar Energy, Vol. 2, Issue 1, pp. 3-20, 1983.
[2] W. Haaf, K. Friedrich, G. Mayr and J. Schlaich,“Solar Chimneys, Part II: Preliminary Test Results From the
Manzanares Pilot Plant”, International Journal of Solar Energy 2, pp. 141–161, 1984.
[3] S. H. Hammadi, “Solar Chimney Power Plant in Basrah”, Basrah Journal for Engineering Sciences, Vol. 9,
Issue 1, pp. 1-8, 2009.
[4] R. M. Hannun, A. U. Adnan and G. A. Abd, “Prediction of Power Chimney Parameters Influenced the
Operation at Nassiriya City”, Thi-Qar University Journal for Engineering Sciences, Vol. 2, Issue 2, 2011.
[5] M. O. Hamdan, “Analysis of a solar chimney power plant in the Arabian Gulf region”, Renewable Energy,
Vol. 36, No. 10, pp. 2593-2598, 2011.
[6] O. C. Aja, H. H. Al-Kayiem and Z. A. Abdul Karim, “Experimental investigation of the effect of wind speed
and wind direction on a solar chimney power plant”, 8th International Conference on Urban Regeneration
and Sustainability, Putrajaya, Malaysia, 2013.
[7] A. Koonsrisuk and T. Chitsomboon, “Accuracy of theoretical models in the prediction of solar chimney
performance”, Solar Energy, Vol. 83, Issue 10, pp. 1764-1771, 2009.
[8] M. H. Ali, “Analysis Study of Solar Tower Power Plant and Its Configuration Effects on Its Performance in
Iraq (Baghdad City)”, Modern Applied Science; Vol. 7, No. 4, 2013.
[9] M.H. Khalf , ” Modeling of hybrid solar-wind power chimney” , M.Sc. thesis, University of Basrah,
Mechanical Engineering Department, Basrah, 2014.
[10] Ghalamchia, M., Kasaeian A. Ghalamchia M., “Experimental study of geometrical and climate effects on
the performance of a small solar chimney”, Renewable and Sustainable Energy Reviews, 43, pp. 425–431,
2015.
[11] A. Ayadi, A. Bouabidi, Z. Driss, , , M.S. Abid, “Experimental and numerical analysis of the collector roof
height effect on the solar chimney performance'', Renewable Energy, , 115: pp. 649-662, 2018.
[12] M. A. H., Abdelmohimen, S. A. Algarni, ''Numerical investigation of solar chimney power plants
performance for Saudi Arabia weather conditions'', Sustainable Cities and Society, Vol. 38, pp. 1–8, 2018.
[13] A. Ayadi, Z. Driss, M. S. Abid , “The impact of placing obstacles on the distribution of the airflow inside a
solar chimney” , Environ Prog Sustainable Energy, 39:e13379, 2020.
[14] I. N. Jawad, Q. A. Rishack, H. S. Sultan, “Matlab graphical user interface (GUI)) code for solar tower
power plant performance calculations” , Basrah Journal for Engineering Sciences, Vol. 21, No. 1, (2021), 8-
14, No. 1, pp, 8-14, 2021.
[15] FP. Incropera, DP. DeWitt, TL.Bergman, AS. Lavine. Introduce to heat transfer.4th
ed.NewYork:Wiley;1934.

![Improvement of thermal performance of a solar chimney based on a passive solar … · 2020-01-02 · solar chimney. Amongst them, the PCM-based solar chimney [8] has also been considered](https://static.fdocuments.net/doc/165x107/5e5a5015c4c7cf5c163eb194/improvement-of-thermal-performance-of-a-solar-chimney-based-on-a-passive-solar-2020-01-02.jpg)