Experimental Study and Numerical Modelling of Lithium-ion ...
253
Experimental Study and Numerical Modelling of Lithium-ion Battery Thermal Runaway Behaviour Mohamad Syazarudin Bin Md Said Supervisor: Dr Yajue Wu A thesis submitted to the Department of Chemical and Biological Engineering, The University of Sheffield, for the Degree of Doctor of Philosophy (PhD) February 2018
Transcript of Experimental Study and Numerical Modelling of Lithium-ion ...

Experimental Study and Numerical
Modelling of Lithium-ion Battery Thermal
Runaway Behaviour
Mohamad Syazarudin Bin Md Said
Supervisor: Dr Yajue Wu
A thesis submitted to the Department of Chemical and Biological
Engineering, The University of Sheffield, for the Degree of Doctor of
Philosophy (PhD)
February 2018

i
Abstract
Thermal runaway has been identified as the prevalent failure mode of lithium-ion
batteries, which is in most cases, is instigated by applications outside the
manufacturer specifications. The intricate exothermic reactions by reactive battery
components during thermal runaway are usually accompanied by the release of
toxic and flammable gases, which in turn are susceptible to fire and explosion upon
exposure to ignition source.
Due to its extensive availability and direct association with our daily life, precise
appraisal of the risk involved is imperative. The proliferation of the applications
into high-voltage large-capacity emerging areas such as electrified vehicles and
stationary energy storage necessitates the understanding of the hazard behaviour at
large scale.
The study is aimed at developing a numerical model to predict thermal runaway
hazard in a large-capacity battery module. The battery chosen for this study is a
cylindrical lithium-ion with lithium cobalt oxide cathode and graphite anode. The
model was developed based on thermal kinetic information of the pertinent
exothermic reactions as compiled from literature. Battery thermal runaway
behaviours under thermally abusive situations and impact-induced short-circuit
were predicted. The simulation results indicate that thermal runaway temperature
for a full-charged battery falls within the range of 162 oC – 175
oC. The induction
time and severity of thermal runaway depend on the ambient temperature and the
rate of heating process. As the exothermic reactions involved are heat-activated, the
temperature of the environment needs to be sufficiently high with considerable
amount of exposure period to overcome the activation energy. Prolonged exposure
to 150 oC and below will not result in thermal runaway. Impact-induced short-
circuit, on the other hand, inflicts an immediate failure which in turn results in surge
of the battery temperature.
The thermal kinetic model was further expanded to include heat transfer modelling
to simulate the propagation of thermal runaway in a battery module comprised of
nine identical batteries. Two cases were developed where the effects of the location

ii
of failure initiation on thermal runaway propagation were examined. In both cases,
thermal runaway propagation was not observed.
Experimental programme was conducted to support and subsequently validate the
numerical model. The batteries were tested under both adiabatic and non-adiabatic
conditions using Accelerating Rate Calorimeter and oven respectively. The
experimental results indicate that thermal runaway temperature for a full-charged
battery falls within the range of 163 oC – 183
oC. The experimental results indicate
that the thermal kinetic model was able to predict thermal runaway temperature as
reflected by the agreeable value between both numerical modelling and
experimental work, validating the model as a reliable tool for simulation of thermal
runaway.
In addition, it was discovered from the experimental tests that the effect of battery
electrical capacity on battery thermal runaway is profound. Battery with higher
electrical capacity demonstrated a higher tendency to experience thermal runaway
with shorter induction time and resulted with a more energetic response, as
indicated by higher maximum temperature rise. The effects of increasing the battery
mass and total capacity on thermal runaway features were further investigated. Two
batteries packed together were more inclined to suffer thermal runaway, as reflected
by the shorter induction time. The presence of parallel electrical connection that
doubled the total capacity further accelerated thermal runaway in the two batteries.
Destructive impact tests were conducted to simulate the loss of mechanical integrity
of the battery structure that might result in internal short-circuit. The impact
resulted in immediate energetic thermal runaway and led to a sustained fire. As
measured by thermal camera, the impact caused the ejected battery content to reach
845 oC due to the massive short-circuit. Despite exhibiting a violent response, the
heat transfer process to the surrounding batteries was not sufficient to cause thermal
runaway propagation in a battery module.

iii
Acknowledgement
I would like to sincerely express my gratitude to my supervisor; Dr Yajue Wu for
her guidance and kind assistance throughout my study. Her continuous supervision
and insightful suggestions are crucial for the completion of the research work.
I would like to thank the technical staff of the Department of Chemical and
Biological Engineering in Buxton Laboratory, Mr David Palmer for being kind and
helpful in constructing the experimental rig and providing important technical
assistance.
Also, I would like to express my appreciation to Dr Denis Cumming and my
colleague Muhammed Abdul Mun’im for their kind assistance with the thermal
imaging and high-definition photography.
Special thanks to Peter Bugryniec for his kind assistance and support with the
Accelerating Rate Calorimeter.
Finally, I would like to thank Ministry of Higher Education Malaysia and
University Putra Malaysia for funding this study, and my family and friends for
their support and encouragement.

iv
Abstract i
Acknowledgement iii
List of Figures ix
List of Tables xiv
Abbreviations xvi
Nomenclatures xviii
Chemical Compounds xxiii
Chapter 1: Introduction 1
1.1 Background 1
1.1.1 History of Battery Development 1
1.1.2 Fire and Explosion Incidents Associated with Batteries 4
1.1.3 Potential Fire Hazard in Battery Triggers the Recall of Consumer
Electronic Products 7
1.1.4 Thermal Runaway in LIB Leads to Fire and Explosion 8
1.1.5 Current Techniques in Evaluating LIB Thermal Runaway Hazard 9
1.1.5.1 Experimental Characterisation of Battery Thermal Runaway 10
1.1.5.2 Modelling of Thermal Reaction Kinetics for Thermal Runaway
Simulation 11
1.2 Scope and Objectives of the Research 12
1.3 Research Approach 13
1.4 Layout of the Thesis 14
Chapter 2: General Review of Battery and the Associated Safety Hazards 15
2.1 Classification of Battery 15
2.1.1 Primary and Secondary Battery 16
2.1.2 Main Components of a Battery 17
2.1.3 Redox Process in Battery during Reversible Chemical-Electrical Energy
Conversion 18
2.1.4 Capacity and Voltage of Battery 19
2.2 Terminology in Battery Operation 20
2.3 High Voltage and Large Capacity Battery Pack 23
2.3.1 Integration of Individual Cells in Battery System for High Voltage and
Large Capacity Applications 23
2.3.2 Hierarchy in High Voltage and Large Capacity Battery System 24
2.4 Types of Battery Chemistry Available 25

v
2.5 High Voltage Lithium-Ion Battery (LIB) 26
2.5.1 Various Chemistries of Lithium-Ion Battery 28
2.5.2 Lithium Ion Exchange during Reversible Chemical-Electrical Energy
Conversion in Lithium-Ion Battery 31
2.6 Fire and Explosion Hazard of Lithium-Ion Battery 32
2.6.1 Source of Fire and Explosion Hazard of Lithium-Ion Battery 32
2.6.2 Hazard Consequence Classification of Battery Safety Tests 34
2.7 Thermal Runaway as Mechanism of Lithium-Ion Battery Failure 35
2.7.1 Initiation of Thermal Runaway by Abusive Conditions and the
Propagation in a Battery Pack 35
2.7.2 Heat Generation and Dissipation in Battery during Thermal Runaway 37
2.7.3 Heat-Induced Exothermic Reactions during Thermal Runaway 38
2.7.3.1 Solid Electrolyte Interphase (SEI) Decomposition 39
2.7.3.2 Reaction between Negative Active Materials and Electrolyte 42
2.7.3.3 Fluorinated Binder Reactions 43
2.7.3.4 Electrolyte Decomposition 43
2.7.3.5 Positive Active Material Decomposition 44
2.8 Summary 46
Chapter 3: Literature Review of Evaluation Techniques of Battery Hazards 47
3.1 Experimental Investigation of LIB Hazard 48
3.1.1 Hazard Evaluation of LIB under Abusive Environments 48
3.1.1.1 Overcharge 52
3.1.1.2 Crush 53
3.1.1.3 Oven Test 53
3.1.1.4 Nail Penetration 54
3.1.1.5 Short-circuit 55
3.1.2 Study of Thermal Runaway Characteristics in LIB 56
3.1.2.1 Accelerating Rate Calorimetry (ARC) 59
3.1.2.2 VSP2 Adiabatic Calorimeter 62
3.1.2.3 C80 Microcalorimeter 63
3.1.2.4 Combustion Chamber 64
3.1.2.5 Heatable Reactor 65
3.1.2.6 Confinement Apparatus 66
3.1.3 Study of LIB Fire Characteristics during Fire Events 67

vi
3.1.3.1 Single Burning Item 71
3.1.3.2 Tewarson Calorimeter 71
3.1.3.3 Cone Calorimeter 72
3.1.3.4 Full-Scale Burning Apparatus 73
3.1.3.5 Fire Calorimeter 73
3.2 Modelling of Battery Thermal Runaway 74
3.2.1 Calorimetry and Kinetic Study 74
3.2.2 Thermal Analysis of Battery Active Materials and Thermal Reaction
Kinetic Modelling 76
3.3 Simulation of Battery Thermal Behaviour during Failure by Modelling
Thermal Reaction Kinetics of Battery Components 79
3.4 Thermal Runaway Propagation in Large Scale Battery Pack 83
3.4.1 Heat Transfer from Faulty Cell to Adjacent Cells Leads to Cascade
Failure in Battery Modules 84
3.4.2 Factors Affecting Thermal Runaway Propagation in Battery Modules 86
3.4.2.1 Thermal Properties of Cell Interstitial Medium 86
3.4.2.2 Electrical Connection 87
3.4.2.3 Contact Surface Area 88
3.4.2.4 Miscellaneous 89
3.5 Summary 90
Chapter 4: Development of a Numerical Model for Simulation of Lithium-ion
Battery Thermal Runaway 91
4.1 Battery Specifications 92
4.2 Battery Physical and Thermal Properties 92
4.3 Development of Thermal Runaway Model 93
4.3.1 Assumptions Made in Thermal Runaway Model Development 93
4.3.2 Heat Source Term 93
4.3.3 Thermal Kinetic Parameters of Thermal Runaway Reactions 94
4.3.4 Governing Equations 95
4.3.5 Modelling of Thermal Decomposition Kinetics 97
4.3.5.1 Solid electrolyte interface (SEI) breakdown 97
4.3.5.2 Reaction between anode and solvent 98
4.3.5.3 Electrolyte decomposition 98
4.3.5.4 Cathode breakdown 99

vii
4.4 Development of Thermal Runaway Propagation Model 100
4.5 Calculation Algorithm of Thermal Runaway Profile 104
4.5.1 Thermal Runaway at Constant High Ambient Temperature 104
4.5.2 Thermal Runaway at Constant Heating Rate 105
4.5.3 Thermal Runaway by Impact-Induced Short-Circuit 106
4.5.4 Thermal Runaway Propagation in a Battery Module 107
4.6 Simulation Results and Discussion 108
4.6.1 Thermal Runaway at Constant High Ambient Temperature 108
4.6.2 Thermal Runaway at Constant Heating Rate 116
4.6.3 Thermal Runaway by Impact-Induced Short-Circuit 124
4.6.4 Thermal Runaway Propagation in a Battery Module 130
4.6.4.1 Initiation of Thermal Runaway in the Middle Cell 130
4.6.4.2 Initiation of Thermal Runaway in Cell 1 135
4.6.4.3 Discussion on the Effect of Thermal Runaway Initiation Location on
Thermal Runaway Propagation 140
4.7 Summary 141
Chapter 5: Experimental Characterisation of Lithium-ion Battery Thermal Runaway
142
5.1 Materials 142
5.2 Experimental Programme 143
5.2.1 Experimental Characterisation of Battery Discharge Curve 143
5.2.1.1 Experimental Rig 144
5.2.1.2 Experimental Procedures 144
5.2.2 Experimental Characterisation of Battery Thermal Runaway Using Oven
Heating 145
5.2.2.1 Experimental Rig 145
5.2.2.2 Experimental Procedures 147
5.2.3 Experimental Characterisation of Battery Thermal Runaway Using
Accelerating Rate Calorimeter 148
5.2.3.1 Experimental Rig 148
5.2.3.2 Experimental Procedures: Heat-Wait-Seek Method 151
5.2.4 Experimental Characterisation of Impact-Induced Battery Thermal
Runaway 153
5.2.4.1 Experimental Rig 153

viii
5.2.4.2 Experimental Procedures 157
5.3 Results and Discussion 158
5.3.1 Results of Characterisation of Battery Discharge Curve 158
5.3.2 Results of Battery Thermal Runaway Characterisation Using Oven 160
5.3.2.1 Results of Oven Test 1 for Full-Charged Single Cell 160
5.3.2.2 Results of Oven Test 2 for Two Full-Charged Cells Not Electrically
Connected 163
5.3.2.3 Results of Oven Test 3 for Two Full-Charged Cells Connected in
Parallel 166
5.3.2.4 Results of Oven Test 4 for Half-Charged Single Cell 169
5.3.2.5 Results of Oven Test 5 for Zero-Charged Single Cell 172
5.3.3 Results of Battery Thermal Runaway Characterisation Using Accelerating
Rate Calorimeter (ARC) 174
5.3.3.1 Results of ARC Test 1 for Single Full-Charged Cell 174
5.3.3.2 Results of ARC Test 2 for Two Full-Charged Cells 176
5.3.3.3 Results of ARC Test 3 for Single Half-Charged Cell 178
5.3.3.4 Results of ARC Test 4 for Single Zero-Charged Cell 180
5.3.4 Results of Impact-Initiated Battery Thermal Runaway 182
5.3.4.1 Results of Impact Test 1 for Full-Charged Single Cell 182
5.3.4.2 Results of Impact Test 2 for Full-Charged Single Cell 187
5.3.4.3 Results of Impact Test 3 for Full-Charged 9 Cells Battery Module
194
5.4 Summary 198
Chapter 6: Discussions of the Experimental Results and Validation of the
Numerical Models 199
6.1 Modelling of Thermal Reaction Kinetics for Simulation of Battery Thermal
Runaway 199
6.2 Experimental Validation of Thermal Runaway Model 203
6.3 Thermal Runaway of Impact-Induced Short-Circuit 210
6.4 Summary 212
Chapter 7: Conclusions 213
References 218
Appendix I: Numerical Model Direct Verification 228

ix
List of Figures Figure 1.1 Forecast for global battery demand in three main sectors.
Adapted from Randall (2017). 3
Figure 1.2 Forecast of the lithium-ion battery price (Randall, 2017). 4
Figure 2.1 Discharge process (left) and charge process (right) of a cell.
Adapted from Linden (2001). 18
Figure 2.2 Schematic diagram of typical configuration of cells in a
battery system for various applications. Adapted from
Doughty and Pesaran (2012).
23
Figure 2.3 The relationship between cell, module, pack and system. 24
Figure 2.4 Comparison of volumetric and gravimetric energy density of
common rechargeable batteries. Adapted from Väyrynen and
Salminen (2012).
27
Figure 2.5 Electrons and lithium ions move back and forth between the
electrodes during charging and discharge processes. Adapted
from Nishi (2001).
31
Figure 2.6 Semonov plot for thermal runaway. Adapted from Wang et
al. (2012). 37
Figure 3.1 Schematic drawing of the adiabatic calorimeter. Adapted
from Richard and Dahn (1999a). 59
Figure 3.2 Algorithm of ARC operation. Adapted from dos Santos et al.
(2014). 61
Figure 3.3 Two electrical connection designs (a) branched and (b)
serpentine. Adapted from Lopez et al. (2015b). 88
Figure 4.1 3x3-matrix battery module assembled from nine unit of
cylindrical cells. 100
Figure 4.2 Thermal nodes in the battery matrix. 100
Figure 4.3 Thermal resistance network for heat transfer modelling. 101
Figure 4.4 Heat transfer resistance network within the module. 102
Figure 4.5 Heat transfer resistance network within the cylindrical cell. 103
Figure 4.6 Calculation algorithm for solving thermal runaway profile at
constant high temperature.
104
Figure 4.7 Calculation algorithm for solving thermal runaway profile at
constant heating rate.
105
Figure 4.8 Calculation algorithm for solving thermal runaway profile
during short-circuit.
106
Figure 4.9 Temporal profile of the battery temperature during thermal
abuse by constant high ambient temperature: (a) 150 (b) 155
and (c) 160 oC.
109
Figure 4.10 Rate of temperature increase profiles during thermal abuse
by constant high ambient temperature.
110
Figure 4.11 The rate of heat generation by exothermic reactions at
battery components at ambient temperature of (a) 150 oC (b)
155 oC and (c) 160
oC.
111

x
Figure 4.12 Total rate of heat generation by chemical reactions at
abusive temperature of 155 oC and (b) breakdown of the heat
sources to its individual reactions.
113
Figure 4.13 The progress of reaction (a) SEI (b) anode (c) electrolyte (d)
cathode and (e) secondary SEI thickness, at different abusive
temperatures.
115
Figure 4.14 Battery temperature profile under continuously increasing
ambient temperature at the rate of (a) 1 oC/min (b) 1.5
oC/min and (c) 2
oC/min.
117
Figure 4.15 Rate of temperature increase profiles during thermal abuse
by constant heating rate.
118
Figure 4.16 The progress of reaction (a) SEI (b) anode (c) electrolyte (d)
cathode and (e) secondary SEI thickness, at varying heating
rates.
119
Figure 4.17 The rate of heat release by (a) SEI (b) anode (c) electrolyte
and (d) cathode reactions, during thermal abuse at heating
rate of 2 oC/min.
121
Figure 4.18 Total rate of heat generation in the battery at heating rate of
(a) 1 (b) 1.5 and (c) 2 oC/min.
123
Figure 4.19 Thermal runaway profile of a short-circuited battery. 125
Figure 4.20 Rate of temperature increase profile during short-circuit. 125
Figure 4.21 (a) Total rate of heat generation, which is a sum of heat
released from short-circuit and chemical reactions (b) heat
release rate by individual chemical reactions.
126
Figure 4.22 The progress of reaction (a) SEI (b) anode (c) electrolyte (d)
cathode and (e) secondary SEI thickness, during short-
circuit.
128
Figure 4.23 Total rate of heat generation in the battery during short-
circuit.
129
Figure 4.24 Thermal runaway initiation in the middle cell of the battery
module.
130
Figure 4.25 Temperature change of cells in the battery module. 131
Figure 4.26 The progress of reaction (a) SEI (b) anode (c) electrolyte (d)
cathode and (e) secondary SEI thickness, in Cell 5.
132
Figure 4.27 The progress of reaction (a) SEI (b) anode (c) electrolyte (d)
cathode and (e) secondary SEI thickness, in all other cells in
the battery module.
133
Figure 4.28 Rate of heat generation in the battery module. 134
Figure 4.29 Thermal runaway initiation in the first cell of the battery
module.
135
Figure 4.30 Temperature of cells in the battery module. 136
Figure 4.31 The progress of reaction (a) SEI (b) anode (c) electrolyte (d)
cathode and (e) secondary SEI thickness, in Cell 1.
137

xi
Figure 4.32 The progress of reaction (a) SEI (b) anode (c) electrolyte (d)
cathode and (e) secondary SEI thickness, in all other cells in
the battery module.
138
Figure 4.33 Total rate of heat generation in the battery module. 139
Figure 5.1 18650 cylindrical lithium-ion cell used in the experimental
work.
142
Figure 5.2 Maccor Series 4000. 144
Figure 5.3 Current profile at different stages of test procedures. 145
Figure 5.4 Schematic of the oven test experimental arrangement and
thermocouple location.
146
Figure 5.5 Cylindrical vessel with sample holder inside. 149
Figure 5.6 Blast box of the EV+ ARC. 150
Figure 5.7 Battery with thermocouple attached being suspended in the
aluminium frame for the test.
151
Figure 5.8 Algorithm of the ARC operation under Heat-Wait-Search
mode.
152
Figure 5.9 Schematic of the impact test experimental setup. 153
Figure 5.10 The assembly for destructive impact test of single battery 154
Figure 5.11 Arrangement of thermocouples for the single battery test.
The grey circles represent hollow steel cylinders.
155
Figure 5.12 Arrangement of thermocouples for the 9-cells battery
module test. Thermal runaway is induced in the middle
battery as marked in red.
156
Figure 5.13 Cell voltage at different stages of test procedures. 158
Figure 5.14 Voltage-capacity curve during discharge cycle. 158
Figure 5.15 Temperature profiles from oven heating of a single full-
charged battery.
161
Figure 5.16 Remnant of single full-charged battery after the oven test. 162
Figure 5.17 Temperature profiles from oven heating of two unconnected
full-charged batteries.
164
Figure 5.18 Aftermath of two-cell thermal runaway. 165
Figure 5.19 Temperature profiles from oven heating of two full-charged
batteries connected in parallel.
167
Figure 5.20 Aftermath of thermal runaway of two full-charged batteries
connected in parallel.
168
Figure 5.21 Temperature profiles from oven heating of single half-
charged battery.
170
Figure 5.22 Temperature overshoot in the ceramic pots. 171
Figure 5.23 Remnant of half-charged battery after the oven test. 171
Figure 5.24 Remnant of the drained battery after the oven test. 172
Figure 5.25 Temperature profiles from oven heating of single zero-
charged battery.
173

xii
Figure 5.26 Temperature of single full-charged battery from ARC test. 175
Figure 5.27 Self-heating rate of single full-charged battery from ARC
test.
175
Figure 5.28 Temperature of two full-charged batteries from ARC test. 177
Figure 5.29 Self-heating rate of two full-charged batteries from ARC
test.
177
Figure 5.30 Temperature of single half-charged battery from ARC test. 179
Figure 5.31 Self-heating rate of single half-charged battery from ARC
test.
179
Figure 5.32 Temperature of single zero-charged battery from ARC test. 181
Figure 5.33 Self-heating rate of single zero-charged battery from ARC
test.
181
Figure 5.34 Thermocouple measurement during the first impact test. 183
Figure 5.35 Fire sparks and smoke plume were observed after an attempt
was made to dislodge the rod from the indented battery.
184
Figure 5.36 Fierce burning of the ejected gases. 184
Figure 5.37 Expulsion of hot battery contents and release of smoke in
between the flames.
185
Figure 5.38 Thermography of the battery temperature before flame
eruption.
185
Figure 5.39 Thermography of the flame and ejected battery content
temperature in the first impact test.
186
Figure 5.40 Thermography of the ejected battery content and the
surrounding flames temperature.
187
Figure 5.41 Thermocouple measurement during the second impact test. 188
Figure 5.42 Screenshots corresponding to 1 to 6 seconds after the
indentation showing the development of fire from the impact
test.
189
Figure 5.43 Screenshots corresponding to 7 to 12 seconds after the
indentation showing the development of fire from the impact
test.
190
Figure 5.44 Screenshots corresponding to 13 to 18 seconds after the
indentation showing the development of fire from the impact
test.
191
Figure 5.45 Screenshots corresponding to 19 to 24 seconds after the
indentation showing the development of fire from the impact
test.
192
Figure 5.46 Screenshots corresponding to 25 to 30 seconds after the
indentation showing the development of fire from the impact
test.
193
Figure 5.47 Temperature profiles in the battery assembly. 195
Figure 5.48 Fire sparks were produced after the impact. 196
Figure 5.49 The cylinder was engulfed in fire. 196

xiii
Figure 5.50 Thermography of the battery module after flame
extinguished.
197
Figure 6.1 Rate of battery temperature change during prolonged
exposure to constant high temperature. Thermal runaway
points are marked in red.
200
Figure 6.2 Rate of battery temperature change at constant heating rate.
Thermal runaway points are marked in red.
201
Figure 6.3 Full-charged battery thermal runaway characteristics from
oven tests.
205
Figure 6.4 Rate of battery temperature change during oven tests. 205
Figure 6.5 Battery thermal runaway characteristics at varying charge
states from ARC tests.
208
Figure 6.6 Battery self-heating rate at varying electrical capacity and
mass.
208

xiv
List of Tables Table 1.1 List of fire and explosion incidents associated with batteries. 5
Table 2.1 Main components of widely available batteries (Levy and
Bro, 1994).
25
Table 2.2 Electrodes materials and voltage range of various lithium-
ion cells
29
Table 2.3 LIBs used in current electric cars (Lu et al., 2013a). 30
Table 2.4 Description of hazard level according to various institutions
as compiled by Ribiere et al. (2012).
34
Table 3.1 Evaluation techniques of thermal, mechanical and electrical
abuse tolerance. Adapted from Biensan et al. (1999) and
Tobishima and Yamaki (1999).
49
Table 3.2 Summary of some prevalent assessments of abuse behaviour
conducted by researchers.
50
Table 3.3 Examples of battery thermal runaway hazard appraisal
conducted by researchers using purpose-built equipment.
56
Table 3.4 Examples of some battery fire hazard evaluation conducted
by researchers.
70
Table 3.5 Reaction models that are usually applied to describe thermal
decomposition of solids (MacNeil and Dahn, 2001).
75
Table 3.6 Examples of modelling work based on kinetic study of
battery active materials as reported in literature.
80
Table 3.7 Some of the works reported in literature pertaining to
thermal runaway propagation.
85
Table 4.1 Cell specifications. 92
Table 4.2 Battery physical parameters for thermal runaway modelling. 92
Table 4.3 Thermal kinetic parameters of thermal decomposition
reactions required for thermal runaway modelling.
94
Table 4.4 Description of all thermal resistances within the individual
cell and battery module.
103
Table 4.5 Total heat release and heat release rate under thermally
abusive environments.
112
Table 4.6 Total heat release and heat release rate under continuously
changing thermal environments.
122
Table 4.7 Total heat release and heat release rate during short-circuit. 129
Table 5.1 Battery specifications. 143
Table 5.2 Arrangement of the thermocouples during oven tests. 147
Table 5.3 Oven test experimental conditions. 148

xv
Table 5.4 Technical descriptions of thermocouples used in the
calorimeter.
149
Table 5.5 ARC setting. 152
Table 5.6 ARC test experimental conditions. 152
Table 5.7 Coordinate of thermocouples for single battery test. 155
Table 5.8 Coordinate of thermocouples for 9-cells test. 156
Table 5.9 Destructive impact test experimental conditions. 157
Table 5.10 Thermal runaway characteristics of single full-charged
battery from ARC test.
174
Table 5.11 Thermal runaway characteristics of two full-charged
batteries from ARC test.
176
Table 5.12 Thermal runaway characteristics of single half-charged
battery from ARC test.
178
Table 5.13 Thermal runaway characteristics of single zero-charged
battery from ARC test.
180
Table 5.14 Summary of fire development in the impact test. 187
Table 6.1 Summary of thermal runaway characteristics of a single full-
charged lithium-ion battery from numerical modelling.
202
Table 6.2 Summary of battery thermal runaway characteristics from
experimental programmes.
203
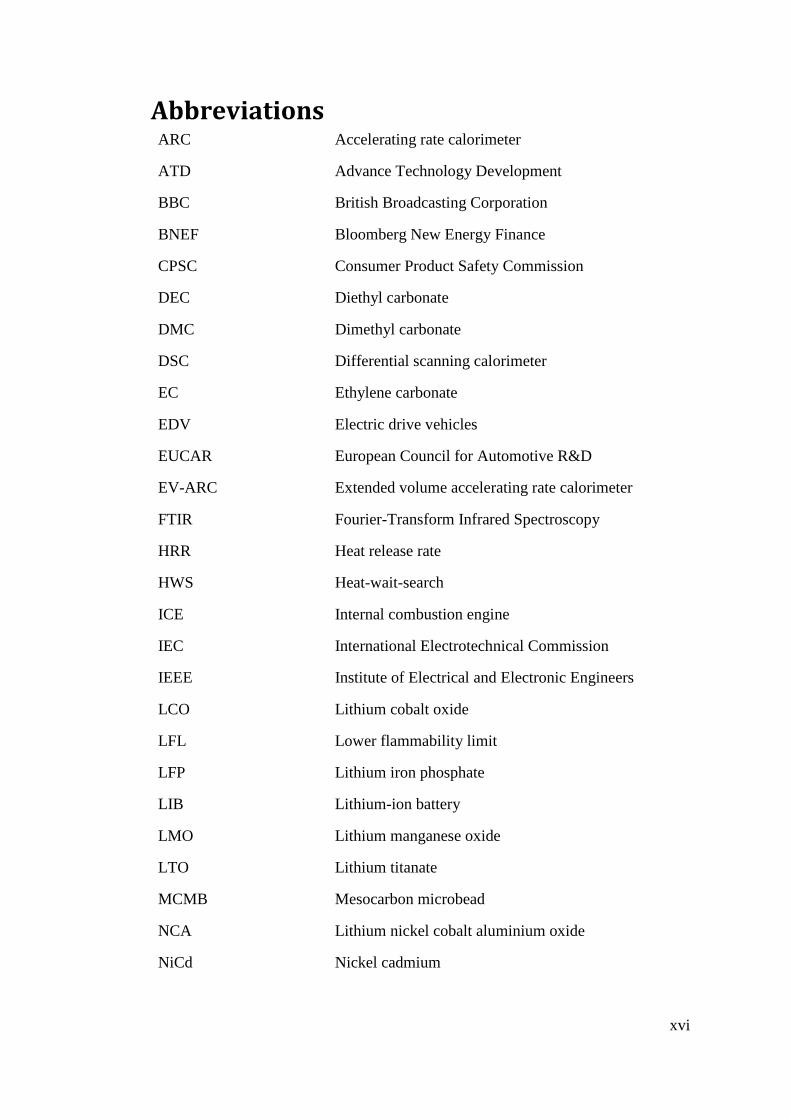
xvi
Abbreviations ARC Accelerating rate calorimeter
ATD Advance Technology Development
BBC British Broadcasting Corporation
BNEF Bloomberg New Energy Finance
CPSC Consumer Product Safety Commission
DEC Diethyl carbonate
DMC Dimethyl carbonate
DSC Differential scanning calorimeter
EC Ethylene carbonate
EDV Electric drive vehicles
EUCAR European Council for Automotive R&D
EV-ARC Extended volume accelerating rate calorimeter
FTIR Fourier-Transform Infrared Spectroscopy
HRR Heat release rate
HWS Heat-wait-search
ICE Internal combustion engine
IEC International Electrotechnical Commission
IEEE Institute of Electrical and Electronic Engineers
LCO Lithium cobalt oxide
LFL Lower flammability limit
LFP Lithium iron phosphate
LIB Lithium-ion battery
LMO Lithium manganese oxide
LTO Lithium titanate
MCMB Mesocarbon microbead
NCA Lithium nickel cobalt aluminium oxide
NiCd Nickel cadmium

xvii
NiMH Nickel metal hydride
NMC Lithium nickel manganese
OCV Open circuit voltage
PC Polycarbonate
PCC Phase change composite
PCM Phase change material
PHRR Peak heat release rate
PVDF Polyvinylidene fluoride
QRA Quantitative risk assessment
REA Renewable Energy Association
SAE Society of Automotive Engineers
SBI Single burning item
SEI Solid electrolyte interphase
SOC State of charge
TGA Thermogravimetric analysis
THC Total hydrocarbons
TNT Trinitrotoluene
UL Underwriter Laboratories
VC Vinylene carbonate
VSP2 Vent sizing package 2

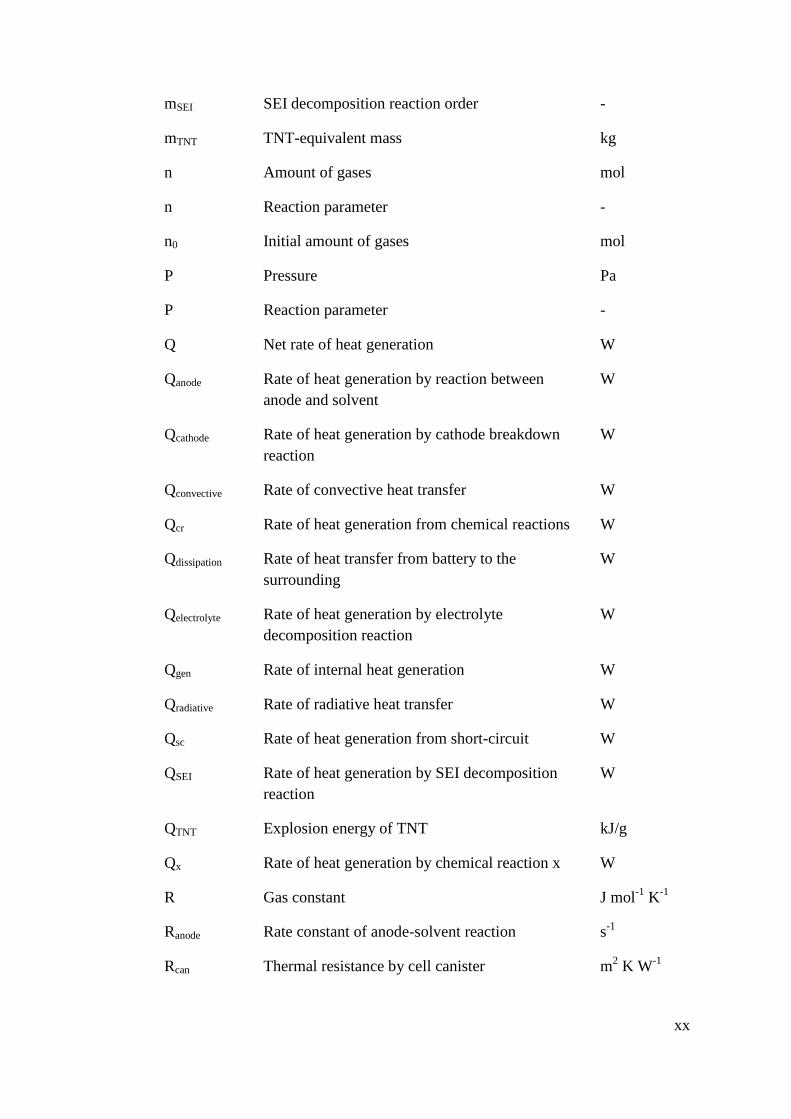
xviii
Nomenclatures mO2
Final oxygen mass flowrate kg/s
mO2
0 Initial oxygen mass flowrate kg/s
me Mass flowrate of combustion products kg/s
mfuel Mass flowrate of combusted materials kg/s
q Heat release rate W
∆Hanode Anode-solvent reaction enthalpy J/kg
∆Hbattery Total heat released by battery kJ
∆Hc Heat of combustion J/kg
∆Hcathode Cathode breakdown reaction enthalpy J/kg
∆Helectrolyte Electrolyte decomposition reaction enthalpy J/kg
∆Hoxygen Heat of combustion of oxygen J/kg
∆HSEI SEI decomposition reaction enthalpy J/kg
∆Hx Reaction enthalpy J/kg
∆Hsc Amount of electrical energy discharged during
short-circuit
J
∆t Duration of short-circuit s
A Frequency factor s-1
A Surface area for heat exchange m2
a Specific area of the sample m2/g
a0 Constant of proportionality m2/g
Aanode Frequency factor of anode-solvent reaction s-1
Acathode Frequency factor of cathode breakdown reaction s-1
Aelectrolyte Frequency factor of electrolyte decomposition
reaction
s-1
ASEI Frequency factor of SEI decomposition reaction s-1

xix
C Battery capacity Ah
canode Dimensionless amount of lithium intercalated
within the carbon negative electrode
-
celectrolyte Dimensionless concentration of electrolyte -
Ci Capacity of the ith cell -
CN Rated battery capacity Ah
Cp Specific heat capacity J/kg.K
Cp air Specific heat capacity of air J/kg.K
cSEI Dimensionless amount of lithium-containing
meta-stable species in the SEI
-
cx Normalised reactant x concentration -
Ea Activation energy J/mol
Eanode Activation energy of anode-solvent reaction J/mol
Ecathode Activation energy of cathode decomposition
reaction
J/mol
Eelectrolyte Activation energy of electrolyte decomposition
reaction
J/mol
ESEI Activation energy of SEI decomposition reaction J/mol
h Heat transfer coefficient W/m2.K
I Current A
k Rate of reaction s-1
kB Boltzmann’s constant m2
kg s-2
k-1
Kg Explosion severity Pa.m/s
M Mass kg
m Reaction order -
manode Anode-solvent reaction order -
mcathode Cathode breakdown reaction order -
melectrolyte Electrolyte decomposition reaction order -
xx
mSEI SEI decomposition reaction order -
mTNT TNT-equivalent mass kg
n Amount of gases mol
n Reaction parameter -
n0 Initial amount of gases mol
P Pressure Pa
P Reaction parameter -
Q Net rate of heat generation W
Qanode Rate of heat generation by reaction between
anode and solvent
W
Qcathode Rate of heat generation by cathode breakdown
reaction
W
Qconvective Rate of convective heat transfer W
Qcr Rate of heat generation from chemical reactions W
Qdissipation Rate of heat transfer from battery to the
surrounding
W
Qelectrolyte Rate of heat generation by electrolyte
decomposition reaction
W
Qgen Rate of internal heat generation W
Qradiative Rate of radiative heat transfer W
Qsc Rate of heat generation from short-circuit W
QSEI Rate of heat generation by SEI decomposition
reaction
W
QTNT Explosion energy of TNT kJ/g
Qx Rate of heat generation by chemical reaction x W
R Gas constant J mol-1
K-1
Ranode Rate constant of anode-solvent reaction s-1
Rcan Thermal resistance by cell canister m2 K W
-1

xxi
Rcathode Rate constant of cathode breakdown reaction s-1
Relectrolyte Rate constant of electrolyte decomposition
reaction
s-1
Rh Thermal resistance by convective heat transfer m2 K W
-1
Rjr Thermal resistance by jellyroll m2 K W
-1
RSEI Rate constant of SEI decomposition reaction s-1
SOC0 Initial value of SOC -
SOCi SOC of the ith cell -
SOCM SOC of the battery module -
T Temperature K
t Time s
t0 Initial time s
Tamb Ambient temperature K
V Battery voltage V
V Chamber volume m3
Wanode Mass of carbon in anode kg
Wcathode Mass of cathode kg
Welectrolyte Mass of electrolyte kg
Wx Mass of reactant x kg
xf Dimensionless amount of lithium content in the
metastable SEI
-
xi Dimensionless amount of lithium intercalated
within the carbon anode
-
z Dimensionless thickness of SEI layer -
z0 Dimensionless initial thickness of SEI layer -
α Dimensionless fractional degree of conversion -
α Extent of cathode decomposition reaction -

xxii
β Parameter of autocatalysis -
ε Battery surface emissivity -
η Coulombic efficiency -
σ Stefan-Boltzmann constant W/m2K
4
χ Empirical mass of TNT -
𝜏 Time at the point of short-circuit s

xxiii
Chemical Compounds (CH2OCO2Li)2 Lithium ethylene dicarbonate
C Carbon
C2H4 Ethylene
C2H6 Ethane
C2HF Fluoroacetylene
C3H4O3 Ethylene carbonate
C3H6 Propene
C3H6O3 Dimethyl carbonate
C4H6O3 Propylene carbonate
CH2CF2 Vinylidene difluoride
CH4 Methane
CO Carbon monoxide
Co Cobalt
CO2 Carbon dioxide
Co3O4 Cobalt (II, III) oxide
CoO Cobalt oxide
CoO2 Cobalt (II) peroxide
F2 Fluorine
H2 Hydrogen
H2O Water
HCl Hydrochloric
HCN Hydrogen cyanide
HF Hydrogen fluoride
Li Lithium
Li(Ni0.45Mn0.45Co0.10)O2 Lithium nickel manganese cobalt oxide
Li(Ni0.50Mn0.25Co0.25)O2 Lithium nickel manganese cobalt oxide
Li1.1(Ni1/3Co1/3Mn1/3)0.9O2 Lithium nickel manganese cobalt oxide

xxiv
Li2CO3 Lithium carbonate
Li4Ti5O12 Lithium titanate
LiCoO2 Lithium cobalt oxide
LiCoxNiyMnzO2 Lithium cobalt nickel manganese oxide
LiF Lithium fluoride
LiFePO4 Lithium iron phosphate
LiMn2O4 Lithium manganese oxide
LiMn3/2Ni1/2O4 Lithium manganese nickel oxide
LiNi0.80Co0.15Al0.05O2 Lithium nickel cobalt aluminium oxide
LiNi0.85Co0.15O2 Lithium nickel cobalt oxide
LiNiCoAlO2 Lithium nickel cobalt aluminium oxide
LiNiCoMnO2 Lithium nickel manganese cobalt oxide
LiNiCoO2 Lithium nickel cobalt oxide
LiNixCoyMnzO2 Lithium nickel manganese cobalt oxide
LiPF6 Lithium hexafluorophosphate
Lix(Ni0.80Co0.15Al0.05)O2 Lithium nickel cobalt aluminium oxide
LixC6 Lithiated carbon
NO Nitric oxide
NOx Nitrogen oxides
O2 Oxygen
PF5 Phosphorus pentafluoride
POF2(OH) Difltmrophosphoric
POF3 Phosphoryl fluoride
SO2 Sulfur dioxide
SOx Sulfur oxides

Chapter 1 Introduction
1
Chapter 1: Introduction
1.1 Background
1.1.1 History of Battery Development
It has been postulated that batteries were invented around 200 B.C. Nowadays,
batteries are widely available and play an important role in our daily chores. The
use of portable electronic devices and equipment in various areas such as the
military, medicine, education, entertainment, aviation and the automotive industry
is made possible by the presence of batteries.
In nineteenth and early twentieth centuries, various galvanic pairs were proposed,
with nickel cadmium (NiCd), nickel metal hydride (NiMH) and lead acid being the
most popular rechargeable batteries. Nowadays, lithium-ion battery (LIB) is
substituting conventional batteries in the market. Their superior electrical energy
content, long life cycle and low self-discharge properties are highly desirable,
which render them as prospective candidates for large-scale and high-capacity
applications such as electric vehicles and grid energy storage.
Many battery development projects aim at providing longer runtime for electronic
devices, and extending driving range for electric drive vehicles (EDV), which can
be achieved by enhancing the energy content (Doughty and Roth, 2012). The
demand for compact and lightweight yet powerful batteries has driven the rapid
development of LIB. It is reported that the enhancement of specific energy in LIB is
occurring at approximately 28% every year. It is projected that future LIB will have
30% - 50% higher energy within the next few years (Doughty and Pesaran, 2012).
The rising interest in renewable and sustainable energy resources incite the
application of electrochemical energy storage into large-scale and high-capacity
energy storage sectors. Many countries around the world are investing in alternative
renewable energy resources, particularly wind and solar power energy plants, which
are the most established technologies in this field (Scrosati and Garche, 2010, Wang
Chapter 1 Introduction
2
et al., 2012). These renewable resources are however, intermittent in nature and
continual disruption in supply is expected. Therefore, measures to secure the quality
and availability of the power supply is necessary, which can be achieved by using
batteries (Vetter and Rohr, 2014). The utilisation of sustainable and renewable
energy resources requires a good energy storing system with the ability of
discharging the energy upon demand. According to the Renewable Energy
Association, as of 2015, 19 out of 32 of the installed energy storage plants in the
United Kingdom use batteries for energy storage purposes, where 12 of the projects
are based on lithium-ion battery technology. The capacity of the battery-based
plants ranges from 5 kW to 50 MW (R.E.A., 2015).
Sustainability issues such as insecurity of fossil fuel supply and emission of
greenhouse gases expand the application of batteries into the automotive sector. The
transportation sector has been reported to be the main contributor to carbon dioxide
emission, which is produced from the combustion process of fossil fuels in the
internal combustion engine (ICE) of vehicles. The problem can be alleviated by
introducing zero or controlled-emission vehicles, and shifts from conventional
vehicles to hybrid and electric vehicles. This course of action will directly reduce
the dependence on fossil fuels and consequently diminish the emission of
greenhouse gases and criteria pollutants (Bandhauer et al., 2011). The vigorous
development of electric drive vehicles relies on the advancement of battery
technology, which is the energy carrier in electrified vehicles (Sato, 2001).
The projection made by Bloomberg for battery demand in next few years is shown
in Figure 1.1. The demand from consumer electronics and stationary energy storage
is expected to increase gradually. The demand from the automotive sector, on the
other hand, exhibits an exponential behaviour and within five years, the highest
demand will come from this sector due to the electrification of passenger vehicles.

Chapter 1 Introduction
3
Figure 1.1: Forecast of global battery demand in three main sectors. Adapted from
Randall (2017).
The cost of LIB used to be very high, which was close to $1000 per kWh as
reported by Väyrynen and Salminen (2012). Market analysis by Bloomberg New
Energy Finance (BNEF) reported a 35 percent plunge in LIB prices in 2015 and a
22 percent drop in 2016. According to their projection, the price will decrease
another 15 to 20 percent in 2017 (Randall, 2017, Randall, 2016). The forecast of the
price range for LIB within next few years, as made by Bloomberg, is presented in
Figure 1.2.

Chapter 1 Introduction
4
Figure 1.2: Forecast of the lithium-ion battery price (Randall, 2017).
The decrease in the LIB price will in turn reduce the price of electric vehicles. The
team projected that the price of electric vehicles will be as competitive as their
conventional internal-combustion vehicle counterparts by 2022. Currently, the
battery constitutes the largest cost in electric vehicles. The drop in battery cost will
make the price of electric cars more affordable and consequently boost market
demand.
1.1.2 Fire and Explosion Incidents Associated with Batteries
For the purposes of accident prevention and mitigation of catastrophic failure,
batteries are equipped with safety mechanisms at three different stages: cell
hardware, system hardware and system software (Lisbona and Snee, 2011).
Satisfactory abuse tolerances can be achieved by disposing a substantial amount and
typically excessive safety devices (Kim et al., 2007).
Despite the multi-layer safety mechanisms, in addition to the improved inherent
safety characteristic of batteries, undesirable incidents are still inevitable. Some of
the cases involve profoundly reliable aviation field (Freed, 2014, Wald, 2014,
BBCnews, 2013). This situation raises the concern about the safety of this widely
available electrochemical energy storage system. In some events, gas was vented
(Freed, 2014) and dense smoke was observed (Wald, 2014).

Chapter 1 Introduction
5
Fire and explosion incidents in relation to batteries, despite being infrequent, have
been reported by the media. The recurrence of mishaps tarnishes the reputation of
battery manufacturers and taints consumer confidence, which potentially leads to
market loss and product withdrawal. Table 1.1 presents some of the fire and
explosion incidents associated with batteries that hit automotive, recycling,
consumer electronics and aviation sectors.
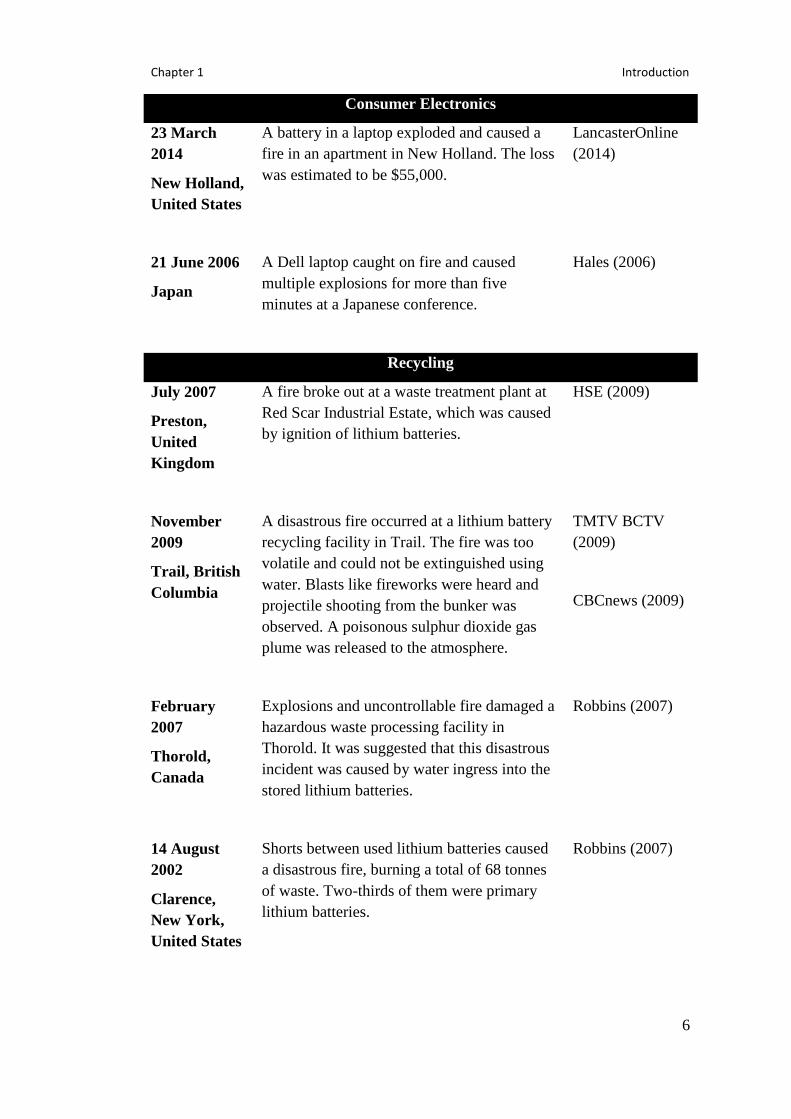
Table 1.1: List of fire and explosion incidents associated with batteries.
Date /
Location
Description Reference
Aviation
January 2014
Tokyo, Japan
Gas was vented and released from a battery
on a Boeing 787 plane parked in Tokyo.
Freed (2014)
July 2011
Incheon,
South Korea
Freight aircraft of Asiana Airlines crashed
into the sea due to the igniting lithium
batteries, killing two pilots.
Brett (2011)
3 September
2010
Dubai, United
Arab
Emirates
Freight aircraft of the United Parcel Service
crashed near Dubai killing two pilots due to
fire on-board. The large quantity of lithium
batteries in the cargo was the source of the
fire.
Lowy (2010)
Garthwaite (2011)
7 January
2013
Boston,
United States
Heavy smoke and fire were found coming
from the front auxiliary power unit battery
case in a Boeing 787. Two distinct flames
with an approximate length of three inches
were observed and loud hissing sound was
heard. Attempt to extinguish the flames using
dry chemical fire extinguisher was deemed
unsuccessful.
Wald (2014)
BBCnews (2013)
Lowy and Freed
(2013)
Chapter 1 Introduction
6
Consumer Electronics
23 March
2014
New Holland,
United States
A battery in a laptop exploded and caused a
fire in an apartment in New Holland. The loss
was estimated to be $55,000.
LancasterOnline
(2014)
21 June 2006
Japan
A Dell laptop caught on fire and caused
multiple explosions for more than five
minutes at a Japanese conference.
Hales (2006)
Recycling
July 2007
Preston,
United
Kingdom
A fire broke out at a waste treatment plant at
Red Scar Industrial Estate, which was caused
by ignition of lithium batteries.
HSE (2009)
November
2009
Trail, British
Columbia
A disastrous fire occurred at a lithium battery
recycling facility in Trail. The fire was too
volatile and could not be extinguished using
water. Blasts like fireworks were heard and
projectile shooting from the bunker was
observed. A poisonous sulphur dioxide gas
plume was released to the atmosphere.
TMTV BCTV
(2009)
CBCnews (2009)
February
2007
Thorold,
Canada
Explosions and uncontrollable fire damaged a
hazardous waste processing facility in
Thorold. It was suggested that this disastrous
incident was caused by water ingress into the
stored lithium batteries.
Robbins (2007)
14 August
2002
Clarence,
New York,
United States
Shorts between used lithium batteries caused
a disastrous fire, burning a total of 68 tonnes
of waste. Two-thirds of them were primary
lithium batteries.
Robbins (2007)
Chapter 1 Introduction
7
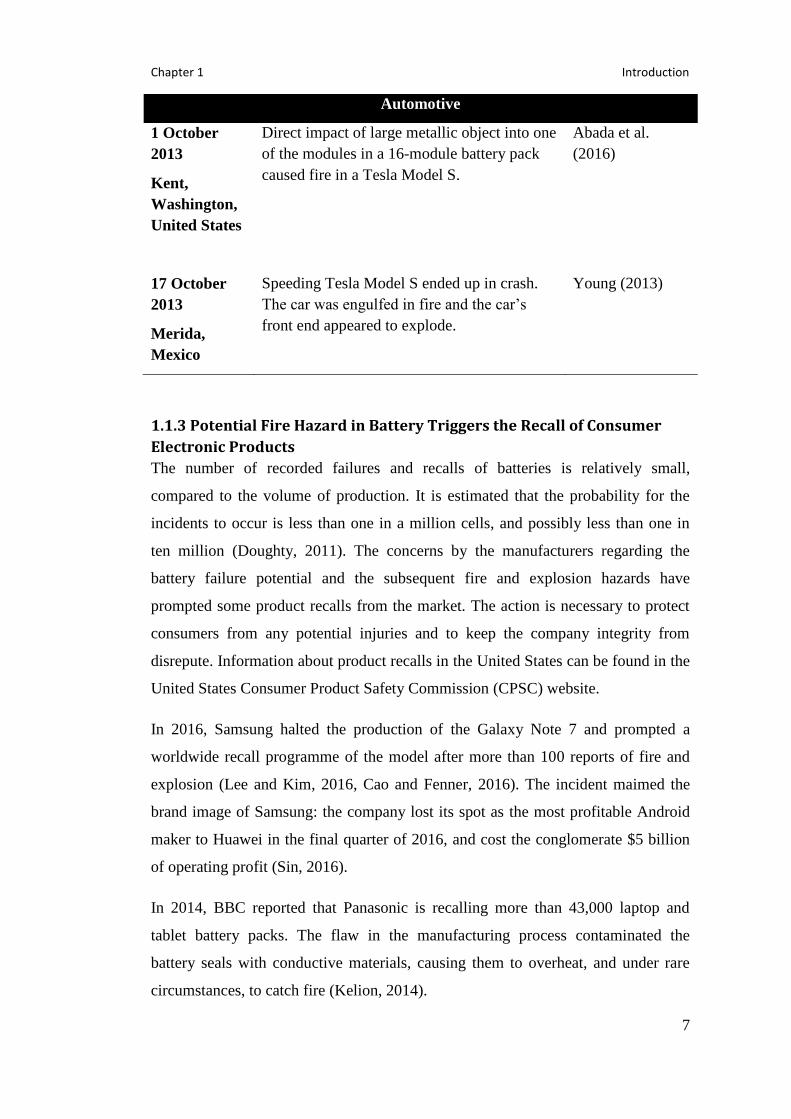
Automotive
1 October
2013
Kent,
Washington,
United States
Direct impact of large metallic object into one
of the modules in a 16-module battery pack
caused fire in a Tesla Model S.
Abada et al.
(2016)
17 October
2013
Merida,
Mexico
Speeding Tesla Model S ended up in crash.
The car was engulfed in fire and the car’s
front end appeared to explode.
Young (2013)
1.1.3 Potential Fire Hazard in Battery Triggers the Recall of Consumer
Electronic Products
The number of recorded failures and recalls of batteries is relatively small,
compared to the volume of production. It is estimated that the probability for the
incidents to occur is less than one in a million cells, and possibly less than one in
ten million (Doughty, 2011). The concerns by the manufacturers regarding the
battery failure potential and the subsequent fire and explosion hazards have
prompted some product recalls from the market. The action is necessary to protect
consumers from any potential injuries and to keep the company integrity from
disrepute. Information about product recalls in the United States can be found in the
United States Consumer Product Safety Commission (CPSC) website.
In 2016, Samsung halted the production of the Galaxy Note 7 and prompted a
worldwide recall programme of the model after more than 100 reports of fire and
explosion (Lee and Kim, 2016, Cao and Fenner, 2016). The incident maimed the
brand image of Samsung: the company lost its spot as the most profitable Android
maker to Huawei in the final quarter of 2016, and cost the conglomerate $5 billion
of operating profit (Sin, 2016).
In 2014, BBC reported that Panasonic is recalling more than 43,000 laptop and
tablet battery packs. The flaw in the manufacturing process contaminated the
battery seals with conductive materials, causing them to overheat, and under rare
circumstances, to catch fire (Kelion, 2014).

Chapter 1 Introduction
8
1.1.4 Thermal Runaway in LIB Leads to Fire and Explosion
Most of the disastrous incidents related to LIB are caused by thermal runaway,
which has been reported to be the common failure mode. This situation raises the
interest in understanding the underlying causes and exploring the prospective
techniques to alleviate the problem (Torabi and Esfahanian, 2011). Thermal
runaway is triggered by abusive environments such as charging and discharging
beyond the specified limit, high temperature operation and subjection to physical
impact, which potentially entails induced internal short-circuit (Kim et al., 2008).
Abuse tolerance is a daunting technical barrier for LIB as it is related to safety
issues. Upon abuse - mechanically, electrically or thermally, the battery exhibits an
anomalous temperature hike, which could potentially lead to disastrous shatter of
the battery structure (Venugopal, 2001). Additional energy from overcharge activity
and external heating exposure is expected to aggravate the severity of thermal
runaway consequences (Larsson and Mellander, 2014).
The heat generated from the operation of LIB outside the stability window will
induce the heat-activated exothermic reactions inside the battery, which in turn will
generate a high amount of heat. The increase in temperature due to exothermic
reactions accelerates the reaction kinetics and leads to further temperature rise
(Golubkov et al., 2014). In some reactions, the heat is released alongside the
emission of flammable and toxic gases. Gases venting is an expected phenomenon
during thermal runaway, which is an engineered safety mechanism to prevent
internal pressure build up inside the battery beyond its mechanical integrity and
consequently lead to catastrophic rupture of the cell casing. High temperature from
battery thermal runaway may ignite the flammable gases and combustible part of
the battery components, resulting in fire. The vented gases may accumulate within
any confined space or enclosure, and under extreme event, the ignition of the
accumulated gases may cause explosion.
Higher capacity LIBs inflict more severe consequences during thermal runaway.
This is demonstrated by higher energy release by LIBs at higher electrical energy
content during induced failure as measured by Lyon and Walters (2016). The
impact is expected to be even worse for large scale applications such as automotive
and stationary energy storage since a copious amount of batteries with enormous
capacity and high voltage are packed together in a single enclosure.

Chapter 1 Introduction
9
Even though the LIBs produced are of high reliability, which is less than one
incident per one million, the number is still very high, especially for the automotive
sector. A big number of cells in the energy pack leads to a dramatic increase of the
failure rate by almost 1000 times (Eshetu et al., 2013). In addition, the batteries
have to endure harsh conditions throughout their lifetime, where exposure to large
temperature variations, shock, vibration, as well as high levels of charge and
discharge is expected, which make them prone to suffer thermal runaway (Larsson
and Mellander, 2014, Doughty and Pesaran, 2012).
Failure of a single cell can lead to cascade failure and complete destruction of the
whole battery pack (Lamb et al., 2015, Feng et al., 2015a, Feng et al., 2015b,
Spotnitz et al., 2007, Lopez et al., 2015b). The heat generated from the defective
cell can propagate to the adjacent cells by convective, radiative and conductive heat
transport processes. The heat transferred from the hot cell will heat the
neighbouring cells gradually and eventually induce the heat-activated exothermic
reactions in those cells, leading to thermal runaway propagation.
1.1.5 Current Techniques in Evaluating LIB Thermal Runaway Hazard
The apprehension of the hazards involved hinders the use of LIBs in applications
with zero tolerance for a catastrophic failure. Due to this reason, a numerical
indicator of the associated hazard is imperative to provide baseline for
understanding the hazards involved and the subsequent safety assessment. In
conducting quantified risk assessment (QRA), the information pertaining
probability and consequence of the hazard is necessary. The odds of the incidents
are established from statistical data and the consequence is the numerical indicator
acquired from experimental evaluation or numerical modelling. The output from the
quantitative risk assessment can be utilised to establish credible fire and explosion
incidents related to battery for the subsequent emergency response and hazard
mitigation.

Chapter 1 Introduction
10
1.1.5.1 Experimental Characterisation of Battery Thermal Runaway
Failure behaviour and thermal hazards of LIBs have been studied by using purpose-
built equipment and subjecting them to abusive environments. LIBs are thermally,
mechanically and electrically subjected to off-nominal conditions to gain valuable
insight into the odds and severity of thermal runaway under various situations.
The oxygen depletion method is a well-established technique and has been used for
a long time to provide a numerical indicator of traditional fire hazard. The heat
release rate (HRR) is computed based on the Thornton principle, where the fire
behaviour is assumed to be directly proportional to the instantaneous rate of oxygen
consumption during combustion. This technique however, neglects the amount of
heat liberated from Joule heating during short-circuit that might add to total fire
hazard posed by LIBs (Ping et al., 2015, Larsson et al., 2014). Moreover, the fire
safety concern of LIBs stems from its components where a combination of highly
reactive electrodes and flammable organic electrolytes is present. The intrinsic
thermal instability of the metallic compounds that form the battery active materials
inflicts batteries to self-heat at high temperature, where in most cases, uncontrolled
heat release from high rate exothermic decomposition reactions will lead to thermal
runaway. In addition, decomposition reaction of positive active materials in the
oxidised state releases oxygen. This self-generated oxygen will interfere with the
oxygen quantifying process and subsequently reduce the value of measured
consumed oxygen (Chen et al., 2015).
Adiabatic calorimetry techniques such as Accelerating Rate Calorimeter (ARC) and
VSP2 Calorimeter have been used to explore thermal runaway behaviour of various
available lithium-ion battery chemistries under wide range of conditions. In
addition, custom-made test rigs are also built by researchers for this purpose.
Thermal hazard caused by the thermal instability of the active materials and other
components at elevated temperature can be well quantified by slowly inducing the
heat-activated exothermic reactions according to the heat-wait-search mode as
programmed in the calorimeter. In Vehicle Battery Safety Roadmap Guidance by
Doughty and Pesaran (2012), a comparison of chemical instability as measured in
self-heating profile by ARC of cylindrical lithium-ion cells fabricated from different
cathode materials was presented.

Chapter 1 Introduction
11
1.1.5.2 Modelling of Thermal Reaction Kinetics for Thermal Runaway
Simulation
The behaviour and response of lithium-ion batteries to thermal events can be
simulated by modelling thermal decomposition reaction kinetic parameters obtained
from thermal stability study of battery components. The breakdown or
decomposition of the active materials can be described by specific reaction model,
activation energy and pre-exponential factor, which are known as the kinetic triplet.
The kinetic study of the active materials that forms the basis for thermal modelling
of LIB full cell assembly is provided by Richard and Dahn (1999a) and MacNeil et
al. (2000).
In early work by Richard and Dahn (1999c), oven exposure and short-circuit
behaviour of LIB was simulated by exploiting thermal kinetic data from self-
heating reactions at anode. Later, Hatchard et al. (2001) included autocatalytic
exothermic reaction at cathode as part of the heat source term to the model
previously developed by Richard and Dahn (1999c). Kim et al. (2007) reproduced
work done by Hatchard et al. (2001) and included high temperature electrolyte
decomposition reaction that was previously left out. The model was expanded to be
three-dimensional using finite volume method to capture heat distribution within the
structure and to investigate the effect of battery dimensions. Most of the work
pertaining to battery kinetic modelling reported in literature refers to the kinetic
model and heat source established by the previously mentioned authors, with some
modification to the kinetic parameters to fit the battery chemistries under study.
The information obtained from thermal kinetic modelling enables researchers,
developers and manufacturers, among others, to predict the output of thermal
runaway without the necessity to perform dangerous, time-consuming and capital-
intensive abuse tests (Ping et al., 2014). It is a convenient way to gain insight of
unexplored conditions and thermal runaway triggering events, allowing
preventative measures to be prepared based on the information.

Chapter 1 Introduction
12
1.2 Scope and Objectives of the Research
At the moment, most of the works reported in the literature related to thermal
runaway study of lithium-ion batteries have been concentrated on the impacts and
failure consequences of a single cell. There are limited studies conducted to
quantify thermal runaway hazards of lithium-ion batteries beyond singular cell
level.
The application of the lithium-ion batteries which previously circulating and
contained around small scale electronics is now expanding into emerging markets
such as electromobility and stationary energy storage. This situation necessitates for
the understanding of the hazard involves in a large scale.
Therefore, this study is aimed at experimental investigation and numerical
simulation of thermal runaway behaviour of lithium-ion battery at both singular cell
and pack levels.
The objectives of this project include:
1. To identify thermal runaway hazards of lithium-ion battery
2. To establish the techniques of quantifying and characterising lithium-ion
battery thermal runaway hazards
3. To establish a thermal kinetic database of thermal decomposition reactions
of lithium-ion battery components
4. To develop a numerical model for simulation of lithium-ion battery thermal
runaway based on thermal decomposition model of battery components
5. To include heat transfer modelling in the thermal runaway model for
simulation of thermal runaway propagation in a battery module
6. To experimentally characterise lithium-ion battery thermal runaway and
validate the numerical model
7. To investigate lithium-ion battery thermal runaway behaviour during
impact-induced short-circuit
Chapter 1 Introduction
13
1.3 Research Approach The research work consists of both numerical modelling and experimental
validation. The cell chosen for this study is a 18650 cylindrical lithium-ion with
lithium cobalt oxide (LCO) cathode and graphite anode. Thermophysical and
kinetic parameters required for thermal runaway modelling are collected from
literature.
A numerical model of thermal runaway for a single high-capacity lithium-ion
battery is established by modelling the kinetics of thermal decomposition reactions
of the battery components. In this work, four thermal reactions are considered.
There are two reactions at anode, which are the breakdown of solid electrolyte
interphase (SEI), and anode-electrolyte reactions. Meanwhile, both cathode and
electrolyte have one reaction. Each of the reaction possesses characteristic thermal
decomposition reaction model and parameters. The numerical model is used to
predict thermal runaway behaviours of lithium-ion battery under constant high
temperature and constant heating rate conditions.
The rapid conversion of electrical energy into heat is incorporated into the thermal
kinetic model to simulate thermal runaway behaviour during impact-induced short-
circuit. Heat transfer modelling is further included in the short-circuit model to
simulate the propagation of thermal runaway in a battery module consists of nine
identical batteries.
Experimental programmes are conducted to validate the numerical model. The
characteristics of lithium-ion battery thermal runaway are experimentally
investigated by using Accelerating Rate Calorimeter and oven. The differences in
thermal runaway characteristics from these two approaches are compared. The
severity of thermal runaway at different battery capacity and mass is further studied.
In addition, destructive impact tests are done to validate the short-circuit model. The
propagation of thermal runaway in a 3x3-matrix battery module is examined.
Thermal imaging equipment is used to provide thermography of battery core and
flames developed during impact tests.

Chapter 1 Introduction
14
1.4 Layout of the Thesis Chapter 1 introduces the uprising trend in battery demand for consumer electronics
and sustainable renewable energy utilisation. Fire and explosion events associated
with batteries are presented, which provide the driving force and steer the direction
of this research. The aim and approach of this study are subsequently discussed.
Chapter 2 reviews the fundamental concept of battery used in electrochemical
energy storage device and the types of battery chemistry are presented. Safety
hazards and modes of battery failure that lead to thermal runaway are discussed.
Chapter 3 reviews the work done in experimental evaluation of battery hazard and
modelling of battery behaviour during failure. Thermal analysis and kinetic studies
of battery components are discussed as they provide the fundamental base for
numerical modelling of battery thermal runaway.
Chapter 4 describes the model developed in this study to simulate battery thermal
runaway during failure. Thermal runaway propagation in a battery module is
simulated by coupling thermal kinetic and heat transfer modelling.
Chapter 5 describes the experimental programme conducted to validate the model
developed in the previous chapter and to provide quantitative information of battery
thermal runaway hazards.
Chapter 6 discusses and compares the findings from both numerical modelling and
experimental validation work.
Chapter 7 concludes the work done in this thesis and future work for the next stage
of the research programme in this area is suggested.

Chapter 2 General review of battery and the associated safety hazards
15
Chapter 2: General Review of Battery and
the Associated Safety Hazards
This chapter is aimed at a literature review of the fundamentals of energy storage
technology using electrochemical cells, including the basic principle of battery
operation and battery chemistries that are widely available. The discussion
pertaining to battery safety hazards is highlighted on the rechargeable lithium-ion
technology and the concern of fire and explosion hazard in the lithium-ion battery is
elaborated. Conditions that lead to battery failure and result in hazardous
consequences are identified. Chemical reactions following the battery failure are
discussed.
2.1 Classification of Battery Batteries are energy storage devices based on electrochemical reactions. The
chemical energy content in the active materials is converted into electrical energy
through electrochemical oxidation-reduction (redox) reactions (Linden, 2001,
Väyrynen and Salminen, 2012). Even though there are various chemistries of
batteries available, they are all governed by the same fundamental concept to work.
Batteries can be optimised for either power or energy application. Batteries for
power application, such as automotive, are designed to deliver high amounts of
energy rapidly and therefore draining the energy content within a short time. On the
other hand, energy-optimised batteries can be found in computer and electronic
applications, where the electrochemical cell is expected to sustain the lifetime of
handheld devices (Larsson and Mellander, 2014).
Batteries are available in various geometries – cylindrical, coin and prismatic. The
geometry and dimension are governed by international standards, but custom
designs are also available for special purposes. Most of the cells are constructed in

Chapter 2 General review of battery and the associated safety hazards
16
accordance with International Electrotechnical Commission (IEC) Standard
CEI/IEC 61960. Cylindrical cells are often assigned a five-figure number where the
first two digits describe the cell diameter, and the rest represents the cell length in
tens of millimetres (Mikolajczak et al., 2011).
2.1.1 Primary and Secondary Battery
Batteries can be classified into two main groups according to their rechargeability
(Levy and Bro, 1994).
1. Primary battery
Primary batteries are not rechargeable and they are discarded once their
electrical charge has been spent. Partial charging is possible but this will
create hazardous conditions. Most of the primary batteries are the common
single-cell cylindrical and flat button batteries.
2. Secondary battery
Secondary batteries are rechargeable by supplying external power, which
will reverse the discharge process. There are two primary functions of
rechargeable batteries.
i. The secondary batteries are used essentially as primary batteries, but
with the enhanced ability to be recharged. The batteries are being
recharged after drained instead of being discarded. The vast amount of
this kind of batteries can be found in portable consumer electronics such
as mobile phones, digital cameras, tablets and so on.
ii. The secondary batteries are used as energy storing devices
(Rezvanizaniani et al., 2014). For this application, the batteries are
electrically connected to a main energy source. The system stores the
excess energy and discharges the energy deposit upon demand.

Chapter 2 General review of battery and the associated safety hazards
17
2.1.2 Main Components of a Battery
The three fundamental components of a cell are anode, cathode and electrolyte.
1. Anode
Anode, which is also known as negative active material, is the reducing fuel
electrode. It gives electrons to the external circuit during the redox reaction and
undergoes oxidation.
2. Cathode
Cathode, which is also known as positive active material, is the oxidising electrode.
It accepts electrons from the external circuit during the redox reaction and
undergoes reduction.
3. Electrolyte
Electrolyte provides the medium for charge transfer between anode and cathode
within the cell.

Chapter 2 General review of battery and the associated safety hazards
18
2.1.3 Redox Process in Battery during Reversible Chemical-Electrical
Energy Conversion
Figure 2.1 illustrates the operation of the cell during charge and discharge. Note that
the figure on the right does not apply to the primary cell.
Figure 2.1: Discharge (left) and charge (right) processes in a cell. Adapted from
Linden (2001).
During the discharge process (left), which is the conversion of the stored chemical
energy into electrical energy, the anode material is being oxidised, releasing
electrons that flow to, and accepted by cathode through the load. The cathode is
then being reduced. The cations and anions in the electrolyte flow to the cathode
and anode respectively and this ion flow, therefore, completes the electric circuit.
During the discharge cycle, the anode is negative, and the cathode is positive. The
discharge process is illustrated in Figure 2.1 (left).
Charging is a reverse to the discharge process. The process takes place with the
supply of external power where the electrical energy is converted into chemical
energy and stored in the battery. During the process, the current flows in the
opposite direction, from cathode to anode. While charging, the charge at anode and
cathode is reversed since it is determined by the reaction that occurs at the
electrode. The positive terminal is known as the anode, and the negative terminal is
known as the cathode. The charging process is depicted in Figure 2.1 (right).

Chapter 2 General review of battery and the associated safety hazards
19
2.1.4 Capacity and Voltage of Battery
The energy required to drive the electrons is provided by the cell voltage, which is a
measure of the tendency of donors to donate electrons and acceptors to accept
electrons. The cell voltage is the intrinsic property of active materials in the cell.
The amount of active materials in the cell determines its theoretical capacity,
expressed as the number of electrons takes part in the electrochemical reaction. The
theoretical capacity is expressed in Coulombs or Ampere-hours (Ah).
The theoretical energy of a cell is the maximum energy that can be delivered, a
product of cell theoretical capacity and voltage, and expressed in Watt-hours (Wh)
(Armand and Tarascon, 2008).
In practice, the real energy of the cell is much lower than the theoretical due to the
following reasons (Linden, 2001).
1. The battery requires many other non-reactive components such as current
collector, electrolyte, containers, seals and so on that contribute to the
volume and mass of the battery.
2. The battery is not normally discharged fully to zero volts and not charged
fully to the theoretical voltage. The former will lessen the delivered
capacity, and the latter will lower the average voltage.
3. In normal practice, the stoichiometry balance is not achieved. This situation
leads to the excess consumption of one of the active materials and thus
reduces the specific energy.

Chapter 2 General review of battery and the associated safety hazards
20
2.2 Terminology in Battery Operation This section defines some of the important terminology related to the battery
operation (MIT Electric Vehicle Team, 2008).
C-rate: A measure of the battery capacity discharge and recharge rate relative to
the battery maximum capacity. 1 C implies that the discharge rate will drain the
whole capacity of the battery in one hour. For a battery with a capacity of 2.6 Ah, 1
C will discharge the entire 2.6 A in one hour.
State of charge (SOC): An expression of the present battery capacity as a
percentage of maximum capacity. It is usually computed from current integration to
determine the change in battery capacity over time.
Terminal voltage: The voltage between positive and negative terminals with load
applied.
Open-circuit voltage (OCV): The voltage between positive and negative terminals
without any load applied.
Cut-off voltage: The minimum voltage allowed and taken as drained state of the
battery.
Nominal voltage: The normal voltage of a battery and usually used as a reference
voltage.
Capacity: The measure of electrical charge and expressed in Ampere-hours (Ah).
Energy: A measure of total Watt-hours (Wh) available when a battery is discharged
at a specified C-rate from 100 percent SOC to cut-off voltage.
Cycle life: The number of charge-discharge cycles of the battery during its lifespan.
Specific energy: Also known as the gravimetric energy. It is the energy per unit
mass and expressed in Wh/kg.
Specific power: The power of the battery per unit mass, expressed in W/kg.
Energy density: The energy of the battery per unit volume, expressed in Wh/L.
Power density: The power of the battery per unit volume, expressed in W/L.

Chapter 2 General review of battery and the associated safety hazards
21
Many works related to battery safety investigate the potential hazard at different
state of charge (SOC). Therefore, the concept of SOC will be discussed here. A
review on the methods to determine SOC has been done by Lu et al. (2013a).
The authors define the SOC as the ratio of the remaining charge of a battery to the
total available charge after being charged to the full capacity. The definition is
straightforward for single cell but complexity appears as we determine the SOC for
a battery module. A battery module with cells parallelly connected is conceptually a
high capacity single cell. Due to the self-balancing characteristic of the parallel
connection, determination of SOC for the battery module can be treated as for
single cell.
The SOC of battery module with series connection, on the other hand, can still be
estimated like a single cell. However, it is recommended to make a thorough
consideration due to the battery uniformity issue. Provided that the capacity and
SOC of each single cells in the battery module are known, the SOC of the module
can be calculated as follows.
SOCM= ∑ SOCiCi
∑ Ci
(Eq 2.1)
where SOCM is the SOC of the battery module, SOCi and Ci are the SOC and
capacity of the ith cell respectively. The real SOC of the battery module depends on
the real performance and efficiency of the balancing device.
The main challenge in determining SOC of battery module is the measurement or
precise estimation of the cell SOC. There are several techniques available for
estimation of cell SOC as reviewed by Lu et al. (2013a).
(1) Discharge test method
Despite providing the most reliable data, this method is time-consuming. The
procedure involves discharging the battery under controlled discharge rate and
temperature. This method is only suitable for research purpose since the battery is
fully drained after the discharge and therefore not appropriate for instantaneous
estimation of batteries SOC for battery management system (BMS) in vehicles.

Chapter 2 General review of battery and the associated safety hazards
22
(2) Ampere-hour integral (Coulomb counting) method
By using this method, SOC can be mathematically expressed as follows.
SOC = SOC0- 1
CN
∫ ηI dt
t
t0
(Eq 2.2)
where SOC0 is the initial value of SOC at time t0, CN (Ah) is the rated capacity, η is
the Coulombic efficiency, and I (A) is the current. The Coulombic efficiency is
taken as 1 during discharge and less than 1 while charging.
(3) Open circuit voltage method
Since the amount of lithium ions in the active materials is commensurate to the
open circuit voltage, it is therefore possible to determine SOC from this value. This
time-consuming method provides highly precise SOC estimation and involves
measuring open circuit voltage at balance state after adequate resting time. Some
battery chemistries exhibit hysteretic charge-discharge pattern. Therefore, a careful
consideration is necessary when using this technique.

Chapter 2 General review of battery and the associated safety hazards
23
2.3 High Voltage and Large Capacity Battery Pack In electrochemical energy storage system, the basic unit is the cell, even though the
term “battery” is commonly used. The application of batteries is specific; one
battery cannot fit all purposes (Väyrynen and Salminen, 2012).
2.3.1 Integration of Individual Cells in Battery System for High Voltage
and Large Capacity Applications
In large-scale applications such as automotive sector, the capacity provided by one
single cell is not sufficient to satisfy the high energy and power demand. Therefore,
it is necessary to build battery packs with a big amount of single cells packed and
connected together. A module is assembled by electrically connecting a number of
individual cells by either series or parallel or combination of both. A group of
modules can be connected and placed together in a single enclosure to form a pack.
Battery pack with battery management system, electronic control and other safety
mechanisms is known as a system.
The common assembly of cells into a battery system is shown in Figure 2.2.
Figure 2.2: Schematic diagram of typical configuration of cells in a battery system
for high voltage and large capacity applications. Adapted from Doughty and
Pesaran (2012).

Chapter 2 General review of battery and the associated safety hazards
24
2.3.2 Hierarchy in High Voltage and Large Capacity Battery System
The relationship between cell, module, pack and system is described in Figure 2.3,
as defined by Väyrynen and Salminen (2012).
Figure 2.3: The relationship between cell, module, pack and system.
The inter-cells connection in a module is determined according to the required
capacity and voltage. The series connection is implemented to achieve higher
voltage while the parallel connection is used to acquire higher capacity. In some
cases, cells are connected in both series and parallel in order to meet the voltage and
capacity requirement. The parallel connection offers better reliability and reduces
the impact of degraded cells.
The individual module is equipped with its own battery management system for
monitoring of thermal and electrical parameters of the cells. The module level
battery management system restricts the number of cells that can be assembled in a
module (Saw et al., 2016).
A battery pack is an assembly of battery modules, which is contained within a
metallic or plastic container (Saw et al., 2016). The demand for high energy density
pack leads to compact design of battery pack with narrow inter-cells spacing (Lopez
et al., 2015b).
System
Pack
Module
Cell
•Battery packs connected in either parallel or series
• Includes peripherals, battery management and cooling systems
•A group of modules connected in series and placed in a single enclosure
•A group of cells connected in series and / or parallel according to the desired capacity and voltage
•The most basic element of batteries

Chapter 2 General review of battery and the associated safety hazards
25
2.4 Types of Battery Chemistry Available Plenty galvanic pairs were proposed in the nineteenth and early twentieth centuries,
with nickel-cadmium and lead-acid appeared to be the most popular rechargeable
batteries (Armand and Tarascon, 2008). Table 2.1 presents some of extensively
used batteries and its associate fundamental components.
Table 2.1: Main components of widely available batteries (Levy and Bro, 1994).
Battery Anode Cathode Electrolyte
Zinc / Carbon
(Zn/C)
Zinc
Manganese
oxide
Carbon
Ammonium chloride
solutions
Zinc chloride
solutions
Silver / Zinc
(Zn/Ag2O)
Zinc
Silver oxide
Potassium hydroxide
solution
Dissolved zinc
oxides
Alkaline /
Manganese
(Zn/MnO2)
Zinc Manganese
oxide
Carbon
Potassium hydroxide
solution
Dissolved zinc
oxides
Lead-Acid
(Pb/PbO2)
Lead
Antimony
and / or
calcium
Lead dioxide
Various lead
salts
Concentrated
sulphuric acid
solution
Nickel / Cadmium
(NiOOH/Cd)
Cadmium
Hydrated
nickel oxide
embedded in a
porous nickel
matrix
Concentrated
potassium hydroxide
solution

Chapter 2 General review of battery and the associated safety hazards
26
Nickel / Metal
Hydride (NiOOH /
MH)
Metal
hydride
Hydrated
nickel oxide
embedded in a
porous nickel
matrix
Concentrated
potassium hydroxide
solution
Lithium Metallic
lithium
Manganese
dioxide
Lithium salt
dissolved in organic
solvents
Lithium-thionyl
chloride
Porous
carbon
material
Thionyl
chloride
Lithium
tetrachloroaluminate
Lithium-ion Lithiated
carbon
Lithium
transition
metal oxide
Lithium salt
dissolved in organic
solvents
2.5 High Voltage Lithium-Ion Battery (LIB) Most of the work reported in literature relating to battery safety is concentrated on
lithium-ion technology. Hence, the following discussion in this thesis is focussed on
lithium-ion battery (LIB), unless stated otherwise.
LIBs are substituting conventional batteries in the market such as NiMH, NiCd,
alkaline and lead-acid batteries, and becoming the prospective candidates as energy
carrier in electric vehicles and grid energy storage applications. They can offer high
voltage (3.6 V), nearly double the conventional batteries (1.2 – 2 V) and high
specific energy (240 Wh/kg), up to six times higher than lead-acid battery (40
Wh/kg) (Verma et al., 2010, Väyrynen and Salminen, 2012). In addition, the use of
LIB is desirable due to its long life cycle and low self-discharge properties (Jhu et
al., 2012). The superior energy content of LIB compared to other rechargeable
chemistries is illustrated in Figure 2.4.

Chapter 2 General review of battery and the associated safety hazards
27
Figure 2.4: Comparison of volumetric and gravimetric energy density of common
rechargeable batteries. Adapted from Väyrynen and Salminen (2012).
The high voltage offered by lithium-ion chemistries, which is three times higher
than the one offered by NiMH technology, is highly desirable since the number of
batteries required to meet the identical voltage requirement can be reduced to one-
third. Since cells are commonly connected in series where the failure of a single cell
could deactivate the entire module, the reduction in the number of cells in the
module entails tremendous improvement to the reliability of the system (Kim et al.,
2007).
The development of LIB is a vital milestone in the area of energy storage and
conversion (Aurbach et al., 1997). LIB is constructed from carbon anode and
transition metal oxide cathode (Doughty and Roth, 2012). Anode and cathode are
surrounded by electrolyte but they are electronically isolated by a separator to
prevent any internal short-circuit. The separator is semi-permeable to the electrolyte
so that the desired ionic conductivity is sustained (Linden, 2001).

Chapter 2 General review of battery and the associated safety hazards
28
2.5.1 Various Chemistries of Lithium-Ion Battery
Rapid development in LIB has been observed with various chemistries having been
introduced (Väyrynen and Salminen, 2012). An extensive review of the LIB
chemistries has been done by Yang et al. (2006). The first LIB invented is based on
lithium cobalt oxide cathode by Sony, which has been commercialised since 1991
and many other chemistries have been developed ever since (Väyrynen and
Salminen, 2012). Table 2.2 presents the active materials and voltage range of some
commercially available lithium-ion cells.

Chapter 2 General review of battery and the associated safety hazards
29
Table 2.2: Electrode materials and voltage range of various lithium-ion cells (Huria, 2012).
Chemistry Commercial
name
Cathode
material
Anode
material
Maximum
voltage
Nominal
voltage
Minimum
voltage
Lithium iron
phosphate
LFP LiFePO4 Carbon 3.65 3.3 2.5
Lithium cobalt
oxide
LCO
LiCoO2 Carbon 4.2 3.7 2.7
Lithium nickel
manganese
cobalt oxide
NMC LiNiMnCoO2 Carbon 4.2 3.6 3.0
Lithium
manganese oxide
LMO
Spinel
LiMn2O4 Carbon 4.2 3.7 2.75
Lithium nickel
cobalt
aluminium oxide
NCA LiNiCoAlO2 Carbon 4.2 3.6 3.0
Lithium titanate LTO LiCoO2 / LiFePO4 Li4Ti5O12 2.9 2.25 1.5

Chapter 2 General review of battery and the associated safety hazards
30
Some of the battery chemistries employed for commercial electric vehicles are
shown in Table 2.3, as compiled by Lu et al. (2013a).
Table 2.3: LIBs used in current electric cars (Lu et al., 2013a).
Vehicle Battery Supplier Cathode Anode
Nissan Leaf EV Automotive Energy
Supply (Nissan NEC
JV)
LiMn2O4 Carbon
Chevrolet Volt Compact Power
(subsidiary of LG
Chem)
LiMn2O4 Carbon
Renault Fluence Automotive Energy
Supply (Nissan NEC
JV)
LiMn2O4 Carbon
Tesla Roadster LiNi0.8Co0.15Al0.05O2 Carbon
Tesla Model S Panasonic Energy Nickel-type Carbon
BYD E6 BYD LiFePO4 Carbon
Subaru G4e Subaru Lithium-ion
Vanadium
Carbon
Honda Fit EV Toshiba Corporation LiCoxNiyMnzO2 Li4T5O12

Chapter 2 General review of battery and the associated safety hazards
31
2.5.2 Lithium Ion Exchange during Reversible Chemical-Electrical Energy
Conversion in Lithium-Ion Battery
Electrical work is done in the LIB by the exchange process of lithium ions between
anode and cathode that occurs through electrolyte. Upon charging with the supply
of external power, lithium ions and electrons will move from cathode to anode
through electrolyte and external circuit respectively and therefore complete the
electrical network. Ions and electrons flow in a quasi-reversible process with
insignificant change in the chemical structure of the cell components (Lyon and
Walters, 2016). The flow direction is reversed during discharge. The illustration of
this process is given in Figure 2.5. Due to the two-way movement of lithium ions
between anode and cathode, LIB is known as the rocking chair or the swing battery
(Wang et al., 2012).
Figure 2.5: Electrons and lithium ions move back and forth between the electrodes
during charging and discharge processes. Adapted from Nishi (2001).

Chapter 2 General review of battery and the associated safety hazards
32
For LIB with lithium cobalt oxide cathode, the electrochemical reactions at both
cathode and anode during normal operation are shown below. The reactions proceed
to the right hand side of the equations during charging and the processes are
reversed to the left during discharge.
Cathode: LiCoO2 ↔ xLi+ + Li1-xCoO2 + e (Eq 2.3)
Anode: xLi+ + e + 6C ↔ LixC6 (Eq 2.4)
The overall reaction can be expressed in the following equation.
LiCoO2 + 6C ↔ Li1-xCoO2 + LixC6 (Eq 2.5)
2.6 Fire and Explosion Hazard of Lithium-Ion Battery Safety is a crucial feature of any energy storage device, including batteries
(Doughty and Roth, 2012). In a review by Goodenough and Kim (2009), safety
issues have been identified as the primary challenge in LIB battery development.
Due to this reason, progressive development in safety technology is crucial (Ohsaki
et al., 2005). While safety mechanisms in the battery might be able to alleviate the
safety concerns, they might increase the manufacturing cost and reduce the energy
density of the battery.
2.6.1 Source of Fire and Explosion Hazard of Lithium-Ion Battery
As discussed by Larsson and Mellander (2012), the fire hazard in the battery system
is a combination of both exothermic reactions and normal fire from combustion of
combustible peripherals. This can be expressed as in Eq 2.6.
Battery fire hazard = exothermic reactions + combustible peripherals (Eq 2.6)
1. Exothermic reactions
Battery is constructed from highly reactive active materials and flammable
electrolyte. The reaction of the components with each other releases high
amounts of heat when initiated by abusive environments. Some of the
reactions are accelerated process and the oxygen required for the
combustion is self-produced within the batteries. Consequently, a fire
incident due to this problem is difficult to handle. A discussion about the

Chapter 2 General review of battery and the associated safety hazards
33
chemical reactions that take place in batteries during thermal runaway is
presented in Section 2.7.3. The first category fire can incite the second
category fire.
2. Fire of combustible peripherals
The second category of fire in the battery system is the traditional fire,
which means the fire acquires the oxygen from the environment to sustain
the combustion process. This kind of fire can be due to, for instances, fire in
plastics, cables and housing of the battery pack.
Batteries are constructed in a unique way where both fuel (anode) and oxidiser
(cathode) are placed together in a sealed container (Doughty, 2011). The fire safety
concern of LIBs stems from its components where a combination of highly reactive
electrodes and flammable organic electrolytes is present. In addition, there is an
immense amount of energy stored within the small device.
Under normal operation, the stored chemical energy within the electrochemical cell
is converted into electrical energy. However, if the fuel and oxidiser are allowed to
react in any undesirable ways, the energy deposit is descended to a high amount of
heat and accompanied by the release of toxic and flammable gases under the
process called thermal runaway. Thermal runaway is triggered by abusive
environments such as charging and discharging beyond the specified limit, high
temperature operation and subjection to physical impact, which potentially entails
induced internal short-circuit.
The heat generated from the operation of battery outside the stability window will
induce the chain of chemical reactions inside the battery, which in turn will generate
a high amount of heat. In some reactions, the heat is released concurrently with the
emission of flammable and toxic gases. Lu et al. (2013b) reported that the gases
generated could cause the pressure inside the cell to surge up to 120 bar.
Gases venting is an expected phenomenon during thermal runaway, which is an
engineered safety mechanism to prevent pressure build-up inside the battery beyond
its mechanical integrity and consequently lead to catastrophic rupture of the cell

Chapter 2 General review of battery and the associated safety hazards
34
casing. High temperature from battery thermal runaway may ignite the flammable
gases and combustible part of the battery components to result in fire. The vented
gases may accumulate within any confined space or enclosure, and under extreme
events, the ignition of the accumulated gases may cause explosion. A study by
Somandepalli et al. (2013) found that the explosion severity of vent gas from the
LIB was between those of methane and propane. The team predicted a more severe
consequence for overcharged cells.
2.6.2 Hazard Consequence Classification of Battery Safety Tests
The fire event from batteries abuse tests is considered as severe (rated as 5 to 6 out
of 7) according to hazards rating schemes developed by various organisations
(Ribiere et al., 2012). The description of the hazard level as outlined by European
Council for Automotive R&D (EUCAR), Society of Automotive Engineers (SAE)
and International Electrotechnical Commission (IEC) is presented in Table 2.4.
Table 2.4: Description of hazard level according to various institutions as compiled
by Ribiere et al. (2012).
Overall
hazard level
EUCAR
description
SAE J2464
description
IEC
description
Toxicity
issue
0 No effect No effect No effect
1 Passive
protection
activated
Passive
protection
activated
Deformation
2 Defect /
damage
Defect /
damage
Venting Yes
3 Leakage
(∆mass < 50%)
Minor leakage
/ venting
Leakage Yes
4 Venting
(∆mass ≥ 50%)
Minor leakage
/ venting
Leakage Yes
5 Fire or flame Rupture Rupture Yes
6 Rupture Fire or flame Fire Yes
7 Explosion Explosion Explosion Yes

Chapter 2 General review of battery and the associated safety hazards
35
2.7 Thermal Runaway as Mechanism of Lithium-Ion Battery
Failure The recorded failure and recall of LIB incidents are small in number, compared to
the production volume. It is estimated that the probability of the incidents is less
than one in a million cells, and possibly less than one in ten million (Doughty,
2011). Most of the reported battery failures are due to thermal runaway (Torabi and
Esfahanian, 2011). As previously mentioned, thermal runaway is triggered by
operating the battery beyond the design specifications and outside the narrow
thermal and electrical stability windows which leads to a surge in battery
temperature (Kim et al., 2008).
2.7.1 Initiation of Thermal Runaway by Abusive Conditions and the
Propagation in a Battery Pack
Abuse tolerance is a daunting technical barrier for batteries as it is related to safety
issues (Kim et al., 2007). Abusive conditions may lead to hazardous situations
especially for large systems, which is one of the main reasons deferring
commercialisation of LIBs in the transportation sector (Bandhauer et al., 2011).
In general, operating the batteries beyond the stability window leads to heat
generation and consequently triggers various chemical reactions in the batteries.
Additional energy supply from overcharging and external heating is expected to
exacerbate the severity of consequences during the undesirable rapid release of the
battery energy deposit (Larsson and Mellander, 2014). Heat and gas generation is a
typical response of batteries to abusive environments (Doughty and Roth, 2012).
Charging the batteries beyond the specified maximum voltage and vice versa causes
the excess and irreversible extraction of lithium ions from the active materials. This
process leads to permanent crystallographic change in both electrodes and results in
higher oxidation potential (Doughty and Roth, 2012). The process of lithium ion
removal gets harder at almost 100% overcharge due to the increasing cathode
resistance and cell impedance. The battery heats up due to the Joule effect and
consequently induces the heat-activated reactions (Ohsaki et al., 2005). The same
process takes place during short-circuit and thermal abuse. The heat releasing
reactions are initiated and being dragged further into thermal runaway by Joule

Chapter 2 General review of battery and the associated safety hazards
36
heating during short-circuit and external thermal energy supply during operation
under thermally abusive environments.
The failure of a single cell can lead to cascade failure and complete destruction of
the whole battery pack. The heat generated from the defective cell can propagate to
the adjacent cells by convective, radiative and conductive heat transport processes.
The thermal energy transferred from the hot cell will heat the neighbouring cells
gradually and eventually induce the heat-activated exothermic reactions in those
cells, leading to detrimental thermal runaway propagation.
Thermal runaway propagation in a battery module has been simulated in a model
developed by Spotnitz et al. (2007). The occurrence of the cascade failure in the
adjacent cells depends on the relative faulty cell position within the module and
heat transfer coefficient. This simulation, however, does not specify the initial mode
of failure that leads to this catastrophic event.
Even though there was no validation made for the model developed by Spotnitz et
al. (2007), thermal runaway propagation was observed by other researchers such as
Feng et al. (2015b) and Lamb et al. (2015). In both studies, thermal runaway was
initiated in a single cell by using mechanical nail penetration. Quantification of the
heat transfer process through the pole connector, battery shell and fire scorching has
been performed by Feng et al. (2015b). The analysis found that the heat transport
through the battery shell dominated the heat transfer process. Heat transport due to
fire scorching is negligible for thermal runaway propagation but may cause
significant damage to the accessories located above the battery module. The same
conclusion was drawn in the study by Lamb et al. (2015). The impact of large
contact surface between cells appears to be prominent for heat transfer process even
though electrical connection is impactful for cells with limited surface area.

Chapter 2 General review of battery and the associated safety hazards
37
2.7.2 Heat Generation and Dissipation in Battery during Thermal
Runaway
Battery is a small reactor that operates under different boundary and working
conditions and hosts several exothermic reactions. Battery safety is determined by
its operating and storage temperature. Battery thermal response to abusive
conditions depends on its ability to dissipate heat to the environment.
Poor heat dissipation to the surrounding, along with heat accumulation inside the
cells can further accelerate the exothermic reactions between the cell components
rather than the desirable electrochemical reactions, leading to detrimental event
thermal runaway. Once triggered, there is no way to deter the reactions, and the
reactions will proceed to completion.
The process of heat exchange in battery during thermal runaway is illustrated by
using Semonov plot in Figure 2.6.
Figure 2.6: Semonov plot for thermal runaway. Adapted from Wang et al. (2012).
Three different heat exchange situations are demonstrated in this discussion. Heat
dissipation to the surrounding is represented by three straight lines, Line 1, 2 and 3.
The heat dissipation process is assumed to comply with Newton’s law of cooling.
Meanwhile, the exponential Curve 4 denotes the heat input from external sources,

Chapter 2 General review of battery and the associated safety hazards
38
Joule heating and chemical reactions, assumed to comply with Arrhenius law
(Stull, 1977).
In order to provide sufficient cooling for the battery and consequently deterring
thermal runaway from occurring, the ambient temperature has to be sufficiently
low. This case is depicted in Line 1. The line intercepts Curve 4 at Point A and B
where Point A is a stable point. In case of temperature rise or drop, the system will
return to the stable point. Meanwhile, Point B is not stable. If the temperature
decreases, it will keep falling to reach the stable Point A. If the temperature gets
higher than Point B, thermal runaway is expected. In case of Line 2, the battery is
experiencing equal heat generation and heat dissipation at the temperature of no
return, TNR, which is marked by the tangential point C. Thermal control of the
battery temperature is not possible in case where ambient temperature is high to
bring about the cooling effect, as represented in Line 3.
2.7.3 Heat-Induced Exothermic Reactions during Thermal Runaway
As previously mentioned in Section 2.6.2, the fire hazard of LIB stems from its
components where a combination of highly reactive electrodes and flammable
organic electrolytes is present. Due to the complex nature of LIB assembly, there
might be numerous sources of heat and exothermic reactions during thermal
runaway. These reactions are heat-activated which are instigated by abusive
conditions.
According to Tobishima and Yamaki (1999), the heat release during thermal
runaway originates from the following exothermic reactions.
1. Positive and negative active materials thermal decomposition
2. Electrolyte thermal decomposition
3. Electrolyte reduction at anode
4. Electrolyte oxidation at cathode
5. Internal short-circuit due to the meltdown of separator

Chapter 2 General review of battery and the associated safety hazards
39
A review by Spotnitz and Franklin (2003) proposed the following heat releasing
reactions during abuse testing of LIB.
1. Breakdown of solid electrolyte interphase (SEI)
2. Reaction between intercalated lithium and electrolyte
3. Reaction between fluorinated binder and intercalated lithium
4. Breakdown of electrolyte
5. Decomposition of positive active materials
6. Reaction between metallic lithium, which is formed upon overcharged and
electrolyte
7. Reaction between binder and metallic lithium
8. Ohmic resistance, overpotential and entropy change from battery discharge
process
Wang et al. (2012) made an additional remark that the listed reactions may not
necessarily take place according to the proposed sequence. In fact, some of the
reactions are overlapped and difficult to categorise. One of the possible methods for
reaction detection is by measuring the heat flow by using calorimetry techniques.
This method, however, provides limited information about the species involved in
the reactions. Further component identification is necessary for postulation of the
chemical reaction mechanism.
Section 2.7.3 describes some of the fundamental reactions in LIB that can
potentially cause thermal runaway. The discussion is organised based on the battery
main components. The understanding of the reactions involved in thermal runaway
is important for improvement of LIB tolerance to abusive conditions (Doughty et
al., 2002).
2.7.3.1 Solid Electrolyte Interphase (SEI) Decomposition
The exfoliation of Solid Electrolyte Interphase (SEI) is the first exothermic reaction
that occurs during thermal runaway and was discovered by Richard and Dahn
(1999a). SEI is a surface film at anode, composed of a variety of salt and solvent
reduction products from the first charging process. SEI is made up of metastable
(ROCO2Li, ROLi, (CH2OCO2Li)2 and polymers) and stable (Li2CO3 and LiF)

Chapter 2 General review of battery and the associated safety hazards
40
components. Usually additives such as vinylene carbonate (VC) are added to
improve thermal stability of SEI and hence constitutes a portion of SEI composition
(Golubkov et al., 2015). The major component is (CH2OCO2Li)2, an outstanding
passivating agent, which is a reduction product of ethylene carbonate (EC)
(Aurbach et al., 1996).
SEI serves as an ionic conductor that allows the transport of lithium ions during the
intercalation and deintercalation processes. The film also works as an electronic
insulator that prevents further electrolyte decomposition at negative electrode as
certain thickness is achieved (Edström et al., 2006). SEI breakdown dictates the
thermal response in cell chemistries with little or no oxygen release (Doughty and
Roth, 2012).
The breakdown of SEI reaction was discovered by Richard and Dahn (1999a) as
they investigated the self-heating behaviour of mesocarbon microbead (MCMB) in
1M LiPF6/EC:DEC (1:2) at varying levels of lithiation using accelerating rate
calorimeter (ARC). Identical self-heating peaks were observed at 100 oC for all
samples irrespective of their degree of lithiation. The peaks appeared from depletion
of the reacting species and the subsequent decrease in the rate of self-heating after
the highest reaction rate was reached. The equal self-heating curve for all samples
indicated that lithium did not take part in the reaction during the peak heat release.
It was previously reported that the electrolyte breakdown occurred at 190 oC,
rendering the reaction to be crossed out from the potential reactions that could
possibly explain the observation.
The identical peaks implied that the observation was necessarily instigated by a
reactant that was present in approximately the same concentration in all anode
samples. Due to the constant concentration of SEI even at varying degree of
lithiation, the team proposed that the observation was attributed to the
decomposition of the SEI layer.
In separate works, Zhang et al. (1998) conducted a Differential Scanning
Calorimetry (DSC) test on LixC6 in LiPF6/EC:DMC (1:1) at different degree of
lithiation. Exothermic peaks with identical intensity were observed at approximately
130 oC regardless of the lithium content. The same trend was observed by Roth and

Chapter 2 General review of battery and the associated safety hazards
41
Nagasubramanian (2000) on anode of commercial LIB. The exothermic peaks of
both charged and partially charged cells were almost identical. In both studies, the
authors associated the observation with the breakdown of the passivation layer.
The SEI layer is unstable at high temperature. Physical penetration, overheating and
overcharge compel the SEI to decompose. The reaction is exothermic and takes
place at temperature between 90 oC and 120
oC.
According to Yang et al. (2006), the possible reaction mechanisms during the
breakdown are as follows.
(CH2OCO2Li)2 → Li2CO3 + C2H4 + CO2 + 0.5O2 (Eq 2.7)
2Li + (CH2OCO2Li)2 → 2Li2CO3 + C2H4 (Eq 2.8)
According to Richard and Dahn (1999a), the reaction proceeded at a higher
temperature to produce a higher self-heating rate while the pattern of identical peaks
observed previously remained unchanged. From the curve of ln dT/dt versus 1/T,
reaction kinetic of SEI breakdown was determined. The activation energy and the
frequency factor of the reaction are determined to be 1.4±10% eV and 1x10¹⁷
min-1
respectively.
As the samples stale, the SEI decomposition reaction abates. In a DSC test, Richard
and Dahn (1999a) detected a reduction in the intensity of the first exothermic peak
near 140 oC in a sample subjected to extended storage at 60
oC, which was not
observed in a fresh sample. The same pattern was observed by Roth and
Nagasubramanian (2000) on the carbon anode of the aged commercial cell. In both
studies, the investigators suggested that the ageing process causes partial conversion
of metastable SEI into stable species, which is held responsible for the reduced heat
intensity.

Chapter 2 General review of battery and the associated safety hazards
42
2.7.3.2 Reaction between Negative Active Materials and Electrolyte
The breakdown of the protective passivating layer exposes the anode surface to the
electrolytes and provides an opportunity for the two components to react (Abraham
et al., 2006). Electrolytes in LIB usually contain a combination of organic solvents
such as ethylene carbonate (EC), propylene carbonate (PC) and dimethyl carbonate
(DMC). The presence of different combinations of organic solvents inflicts a variety
of reaction products. Intercalated lithium reacts with EC, PC and DMC as follows
(Lopez et al., 2015a). All the listed reactions have Li2CO3 (one of the SEI
components) as a mutual product, in addition to the flammable hydrocarbons.
2Li + C3H4O3 (EC) → Li2CO3 + C2H4 (Eq 2.9)
2Li + C3H6O3 (DMC) → Li2CO3 + C2H6 (Eq 2.10)
2Li + C4H6O3 (PC) → Li2CO3 + C3H6 (Eq 2.11)
The amount of lithium content in the graphite has a profound effect on the
reactions. As observed by Wang et al. (2006), the reactions onset temperature
exhibited a falling pattern while the amount of heat generated demonstrated an
increment as the amount of intercalated lithium increased. In addition, the kinetic of
the reactions is determined by the structural form of the solvents in use. Interaction
between lithiated carbons and cyclic carbonates recorded a higher onset temperature
and a lower heat generation compared to linear carbonates. The strong binding
energy of covalent bond in cyclic carbonates entails higher temperature for the
reaction to be triggered (Wang et al., 2009). In both studies, the authors presented
activation energy and frequency factor of the reaction at each condition under
investigation. As concluded by Wang et al. (2011), the ratio of loading in the
electrolyte compositions has negligible impact on the reactions. Identical thermal
response was observed in all samples at elevated temperature.

Chapter 2 General review of battery and the associated safety hazards
43
2.7.3.3 Fluorinated Binder Reactions
The polyvinylidene fluoride (PVDF) binder is a component of both positive and
negative active materials, and can possibly contribute to thermal reactions in a cell.
The reaction between intercalated lithium and PVDF occurred at 300 oC (Biensan et
al., 1999).
Pasquier et al. (1998) proposed that lithium and fluorinated binder react according
to the following mechanisms, where LiF is the major inorganic product from the
reaction.
-CH2-CF2- + Li → LiF + -CH=CF- + 0.5H2 (Eq 2.12)
2Li + RF2 → 2LiF + 0.5R2 (Eq 2.13)
Thermal analysis by Maleki et al. (1999) and Biensan et al. (1999) found that the
reaction between fluorinated binder and lithium is exothermic. According to Roth
and Nagasubramanian (2000), higher amount of lithium content in the carbon anode
results in higher exotherm. Despite the findings by the investigators, simulation by
Spotnitz and Franklin (2003) concluded that the reaction between lithium and
fluorinated binder does not play an important role during thermal runaway since the
amount of heat liberated from the reaction is relatively low compared to other
reactions.
2.7.3.4 Electrolyte Decomposition
Electrolyte in LIBs is a blend of lithium salt, usually LiPF6 and organic solvents.
DSC scan of LiPF6 salt by Roth and Nagasubramanian (2000) indicated that the salt
decomposed at 195 oC. In a separate thermogravimetric analysis (TGA), it was
found that the mass loss pattern showed a good consistency with the heat flow
curve. There were no other thermal reactions observed above the melting point.
The decomposition of the LiPF6 is endothermic and takes place according to the
following mechanism.
LiPF6 → LiF + PF5 (Eq 2.14)

Chapter 2 General review of battery and the associated safety hazards
44
The produced PF5 can further react with water according to the following
mechanism.
PF5 + H2O → POF3 + 2HF (Eq 2.15)
The salt can react with water according to the following chain reactions (Larsson et
al., 2014).
LiPF6 + H2O → LiF + POF3 + 2HF (Eq 2.16)
POF3 + H2O → POF2(OH) + HF (Eq 2.17)
2.7.3.5 Positive Active Material Decomposition
A selection of positive active materials is available for LIBs. The materials are
chosen by manufacturers based on the materials electrochemical and safety
performance. The early-commercialised LIBs are based on lithium cobalt oxide
(LiCoO2). In general, the positive active material decomposes in the oxidised state
to produce oxygen. Excess lithium ions deintercalation from the cathode degrades
the electrode stability and consequently promotes oxygen release (Dahn et al.,
1994).
The decomposition reaction of the oxide-based cathode materials raises the safety
concern of the LIBs. The released oxygen can react exothermically with organic
materials within the cell, promoting combustion process and consequently leads to
fire. This reaction is the most energetic reaction during thermal runaway (Doughty
and Roth, 2012).
For the LiCoO2, the cathode decomposes according to the following mechanisms to
produce oxygen (Wang et al., 2012).
Li0.5CoO2 → 1
2LiCoO2+
1
6 Co3O4+
1
6O2 (Eq 2.18)
Co3O4 → 3CoO + 1
2O2 (Eq 2.19)
CoO2 → Co + O2 (Eq 2.20)

Chapter 2 General review of battery and the associated safety hazards
45
As reported by Roth and Nagasubramanian (2000), fresh LiCoO2 was inert.
However, LiCoO2 used for battery assembly exhibited a weak exothermic
behaviour over the temperature range of 250 oC and 350
oC, with reducing intensity
and higher onset temperature as the lithium content increased. The team concluded
that the lithium removal from the cathode increases the oxidation potential of the
electrode and consequently enhances solvent breakdown at the solvent / electrode
interface. Thus, thermal stability of the positive active material is not of great
concern at a discharged state.
Chapter 2 General review of battery and the associated safety hazards
46
2.8 Summary It has been identified that hazardous situations are initiated by operating the
batteries beyond the manufacturers’ specifications, leading to thermal runaway. The
heat generated from the abusive situations will induce a chain of chemical reactions
inside the battery, which in turn will generate a high amount of heat. In some
reactions, the heat is released concurrently with the emission of flammable and
toxic gases. High temperature from battery thermal runaway may ignite the
flammable gases and combustible parts of the battery components, resulting in fire.
The vented gases may accumulate within any confined space or enclosure, and
under extreme circumstances, the ignition of the accumulated gases may cause
explosion. The transfer of heat from the defective cell to the neighbouring cells will
eventually induce the heat-activated exothermic reactions in those cells, leading to
thermal runaway propagation and cascade failure of the whole battery pack.
In the next chapter, the work done to evaluate the fire and thermal runaway hazards
of lithium-ion battery will be reviewed.

Chapter 3 Literature review of evaluation techniques of battery hazards
47
Chapter 3: Literature Review of Evaluation
Techniques of Battery Hazards
The hazards posed by LIB have been discussed in Chapter 2. The conditions
inflicting catastrophic thermal runaway have been identified. As the applications of
LIB are ubiquitous and become increasingly important, precise appraisal of the
associated hazards is imperative for hazard quantification. The spur of lithium-ion
technology in emerging applications necessitates the understanding of the risk
involved.
Batteries are susceptible to standard safety evaluation before being allowed to enter
the market. The tests are developed with input from representatives from
consumers, authorities, manufacturers and academicians, and are governed by
international bodies such as Underwriter Laboratories (UL), Institute of Electrical
and Electronic Engineers (IEEE) and International Electrotechnical Commission
(IEC) (Mikolajczak et al., 2011, Biensan et al., 1999).
In this chapter, studies done to evaluate LIB thermal hazards are reviewed. The
discussion is organised into two main sections, which are experimental and
modelling. Due to the diverse nature of the available lithium-ion chemistries and
manufacturers that entails significant variation in battery energy and safety
performance, an attempt has been made to compile information on the batteries
used, particularly active materials, voltage and capacity.

Chapter 3 Literature review of evaluation techniques of battery hazards
48
3.1 Experimental Investigation of LIB Hazard Failure behaviour and thermal hazard of LIB have been studied by using purpose-
built equipment and subjecting to abusive environments. Batteries are subjected to
thermal, mechanical and electrical off-nominal conditions to gain valuable insight
into the probability and severity of thermal runaway under various situations. The
hazard of LIB has been studied at both component level and complete cell assembly
using various calorimeters.
3.1.1 Hazard Evaluation of LIB under Abusive Environments
Abuse tolerance is a daunting technical barrier for batteries as it is related to safety
issues. The operation of batteries outside the design specifications prompts cell
heating and concern arises as hazardous situations are created if the temperature
exceeds the critical point (von Sacken et al., 1994). Characterisation and evaluation
of battery components and full assemblies behaviour under abusive environments
are important to provide baseline information on safety and abuse tolerance of a
given cell chemistry (Doughty and Roth, 2012).
Abuse testing can be characterised into three main categories: thermal, mechanical,
and electrical (Biensan et al., 1999, Tobishima and Yamaki, 1999). Different
abusive environments result in different avenues to thermal runaway and distinctive
failure behaviour. Some examples of the evaluation techniques are shown in Table
3.1.

Chapter 3 Literature review of evaluation techniques of battery hazards
49
Table 3.1: Evaluation techniques of thermal, mechanical and electrical abuse
tolerance. Adapted from Biensan et al. (1999) and Tobishima and Yamaki (1999).
Category Evaluation techniques
Mechanical Crush
Vacuum
Nail penetration
Pressure
Vibration
Drop
Electrical Forced discharge
Abnormal voltage charging
Overcharging
Abnormal current charging
External short circuit
Thermal Oil bath
Fire exposure
Heating
Hot plate
High and low temperature
cycling
A survey by Spotnitz and Franklin (2003) identified five prevalent assessment
methods to evaluate abuse tolerance of lithium-ion cells.
(1) Short-circuit: A low resistance is connected across the terminals of the
battery.
(2) Nail penetration: A nail is forced through the battery at a specified speed.
This test is considered as a simulation to internal short-circuit in the cell,
which might be caused by defect in the manufacturing process.
(3) Oven: The battery is exposed to a higher temperature from some initial
temperature. This test ascertains the cell thermal stability.
(4) Crush: The battery is crushed by using a bar. This assessment is considered
as crucial and the survival of cell to this test is mandatory since there is no
electronic device can provide protection from crush.
(5) Overcharge: Current is forced through the cell up to some limiting voltage.

Chapter 3 Literature review of evaluation techniques of battery hazards
50
A summary of some abusive evaluation tests reported in literature is given in Table
3.2.
Table 3.2: Summary of some prevalent assessments of abuse behaviour conducted
by researchers.
Test Battery
specification
Active materials Reference
Overcharge
EiG ePLB-F007H
3.2 V, 7 Ah
EiG ePLB-F007A
3.2 V, 7 Ah
European Batteries
EBattery
3.2 V, 45 Ah
LiFePO4 cathode
and carbon anode
Larsson and
Mellander
(2014)
Prismatic battery
0.72 Ah
LiCoO2 cathode
and MCMB anode
Belov and
Yang (2008)
Prismatic battery
0.65 Ah
LiCoO2 cathode
and graphite anode
Ohsaki et al.
(2005)
Crush
ANR26650M1A
3.2 Ah
Saft MP 174565
4.8 Ah
LiFePO4 cathode
LiCoO2 cathode
Dubaniewicz
and DuCarme
(2014)
4.13 V, 0.720 Ah Details are not
made available by
authors
Tobishima and
Yamaki (1999)
Oven test 18650
4.3 V, 2.8 Ah
LiCoO2 cathode
and graphite anode
Lopez et al.
(2015a)
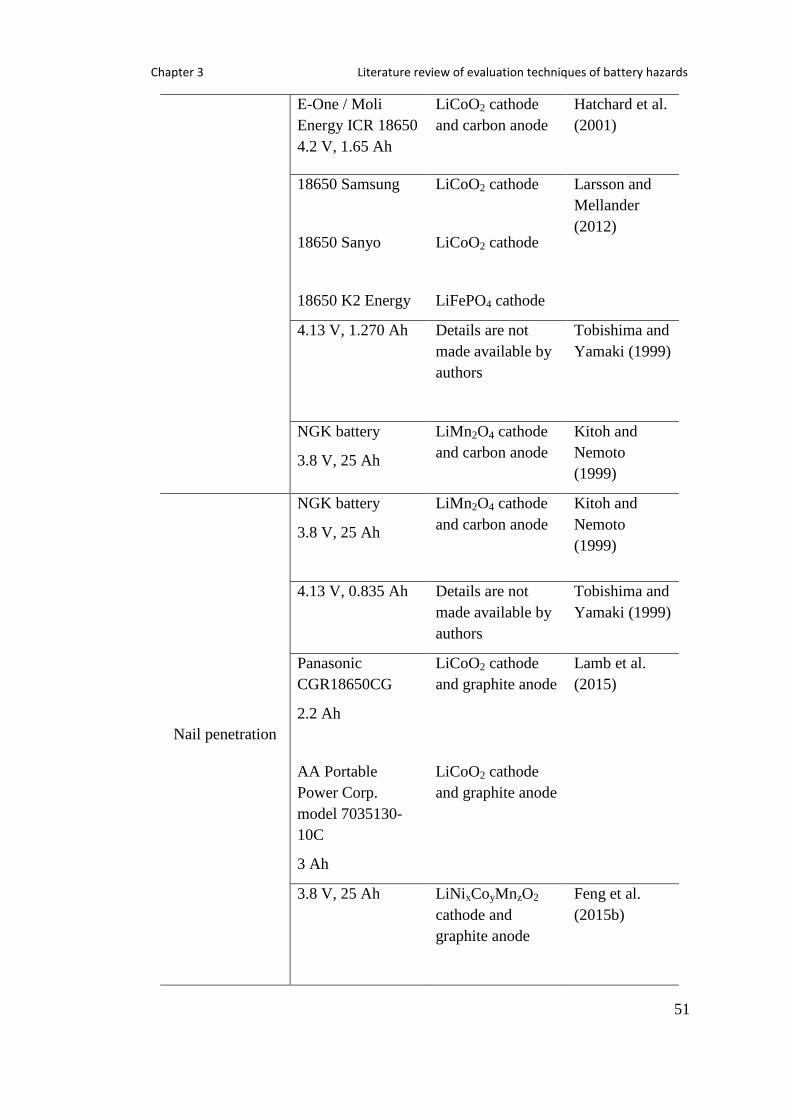
Chapter 3 Literature review of evaluation techniques of battery hazards
51
E-One / Moli
Energy ICR 18650
4.2 V, 1.65 Ah
LiCoO2 cathode
and carbon anode
Hatchard et al.
(2001)
18650 Samsung
18650 Sanyo
18650 K2 Energy
LiCoO2 cathode
LiCoO2 cathode
LiFePO4 cathode
Larsson and
Mellander
(2012)
4.13 V, 1.270 Ah Details are not
made available by
authors
Tobishima and
Yamaki (1999)
NGK battery
3.8 V, 25 Ah
LiMn2O4 cathode
and carbon anode
Kitoh and
Nemoto
(1999)
Nail penetration
NGK battery
3.8 V, 25 Ah
LiMn2O4 cathode
and carbon anode
Kitoh and
Nemoto
(1999)
4.13 V, 0.835 Ah Details are not
made available by
authors
Tobishima and
Yamaki (1999)
Panasonic
CGR18650CG
2.2 Ah
AA Portable
Power Corp.
model 7035130-
10C
3 Ah
LiCoO2 cathode
and graphite anode
LiCoO2 cathode
and graphite anode
Lamb et al.
(2015)
3.8 V, 25 Ah LiNixCoyMnzO2
cathode and
graphite anode
Feng et al.
(2015b)

Chapter 3 Literature review of evaluation techniques of battery hazards
52
Short circuit
4.1 V, 1.5 Ah LiCoO2 cathode
and graphite anode
Leising et al.
(2001)
NGK battery
3.8 V, 25 Ah
LiMn2O4 cathode
and carbon anode
Kitoh and
Nemoto
(1999)
3.1.1.1 Overcharge
As a foreseeable misuse that can possibly arise from failure of the charger or
electronic control, the understanding of potential hazards posed by overcharge is
important. In a study by Larsson and Mellander (2014), the overcharge behaviour of
high-power and high-energy LiFePO4 batteries produced by two different
manufacturers was compared. The high-energy and high-power batteries were
overcharged at 2 C and 10 C up to 15.3 V respectively. In general, all cells swelled
but no thermal runaway was observed. The cells temperature increased from room
temperature and reached a moderate temperature between 70 oC and 80
oC without
any incident, except for a battery from European Batteries that erupted in flames.
The fire observed was not reproduced in other batteries and the team believed that
the incident was due to the inherited defect from the manufacturing process.
Belov and Yang (2008) investigated the effect of applied current rate on battery
temperature. Thermal runaway occurred under all current rates and inflicted the
cells to shatter. The increase in applied current rate resulted in lower thermal
runaway onset temperature and higher heat generation.
Ohsaki et al. (2005) examined thermal development and gas emission in battery at
different state of overcharge. Hydrogen, carbon dioxide, ethane, carbon monoxide,
ethylene and methane gases were released from the overcharge reaction and the
amount of gases was proportional to the state of overcharge. Carbon monoxide
formed the major constituent of the emitted gases at cathode. On the other hand, the
biggest portion of the gases released at anode was hydrogen.

Chapter 3 Literature review of evaluation techniques of battery hazards
53
3.1.1.2 Crush
Loss of mechanical integrity of the battery structure is a contemplated problem that
might arise from heavy load and high impact. Thus, the study of battery response to
crush is important to provide an insight into the hazards involved in this situation.
Dubaniewicz and DuCarme (2014) conducted crush tests on LIBs in an explosion
containment chamber. The chamber was filled with 6.5% CH4-air to simulate the
hazardous conditions in a mining field. The batteries tested in their work were
composed of LiCoO2 and LiFePO4 cathode. The cells were crushed using flat plate
and plastic wedge and the severity of the failure inflicted by both methods was
compared.
LiCoO2 cell crushed using plastic wedge recorded a more perilous behaviour.
Thermal runaway inflicted the cell temperature to soar up to 427 oC. The ignition of
the chamber atmosphere by the crushed cells produced an overpressure up to 676
kPa. On the other hand, as for the LiCoO2 cell crushed using flat plate, thermal
runaway was not detected and ignition of the flammable atmosphere was not
observed. Crushed LiFePO4 cells using plastic wedge produced no chamber ignition
and the overpressure recorded a reading lower than 20 kPa.
Tobishima and Yamaki (1999) conducted a crush test using a 10 mm diameter bar,
halving the initial thickness of the batteries. The response of batteries to the
invasive test at different charge states was studied. No smoke was released for the
cell charged according to its specification. However, fire was observed for
overcharged cell.
3.1.1.3 Oven Test
Oven test is a standard evaluation technique to assess battery thermal instability at
high ambient temperature. The test provides important information such as
activation and maximum temperature of thermal runaway under the specified
environment. Lopez et al. (2015a) investigated the effect of different oven
temperatures on thermal runaway development in LIB. At temperature of 145 oC,
the battery temperature recorded a gradual increase and subsequently plateaued at
the oven temperature. No thermal runaway was observed. The occurrence of

Chapter 3 Literature review of evaluation techniques of battery hazards
54
thermal runaway at oven temperature of 150 and 155 oC caused the battery
temperature to surge and subsequently reduced to and sustained at the preset oven
temperature after the completion of the chain reactions. An increase in the oven
temperature resulted in a decrease in thermal runaway onset temperature. The same
pattern was observed in a work by Hatchard et al. (2001). In both studies, models
were developed to describe the thermal behaviour. Data provided by models
showed a good agreement with the experimental data and validated the models as a
reliable method for temperature prediction.
Larsson and Mellander (2012) examined thermal stability of commercial cylindrical
LIBs by continuously heating up the batteries from ambient temperature to the onset
of thermal runaway. Temperature spikes were recorded for Sanyo and Samsung
batteries and the batteries ignited due to the high reactivity of LiCoO2 cathode. On
the other hand, K2 Energy battery, which was based on LiFePO4 cathode, exhibited
a mild temperature increase.
Heating test performed by Tobishima and Yamaki (1999) on commercial LIBs
found that the batteries survived at 150 oC but smoked at 155
oC. In a separate study
by Kitoh and Nemoto (1999) at 130 oC, the battery temperature maintained at the
oven temperature for the first 80 minutes and increased to 190 oC thereafter.
Venting was observed, but no ignition. Approximately 40 minutes after the test
commenced, an abrupt rise in internal resistance was observed, which was inflicted
by short-circuit during separator meltdown.
3.1.1.4 Nail Penetration
The heat liberated from Joule heating during internal short-circuit can trigger heat-
activated exothermic reactions and consequently lead to thermal runaway.
Therefore, the nail penetration test is performed to simulate an internal short-circuit
and to provide an insight of the potential hazards involved during the undesirable
electrical conduction. Tobishima and Yamaki (1999) performed a nail test using a
nail with 2.5 mm diameter to investigate the effect of battery charge state on the
internal short-circuit. Smoke was released from the overcharged cells. Nevertheless,
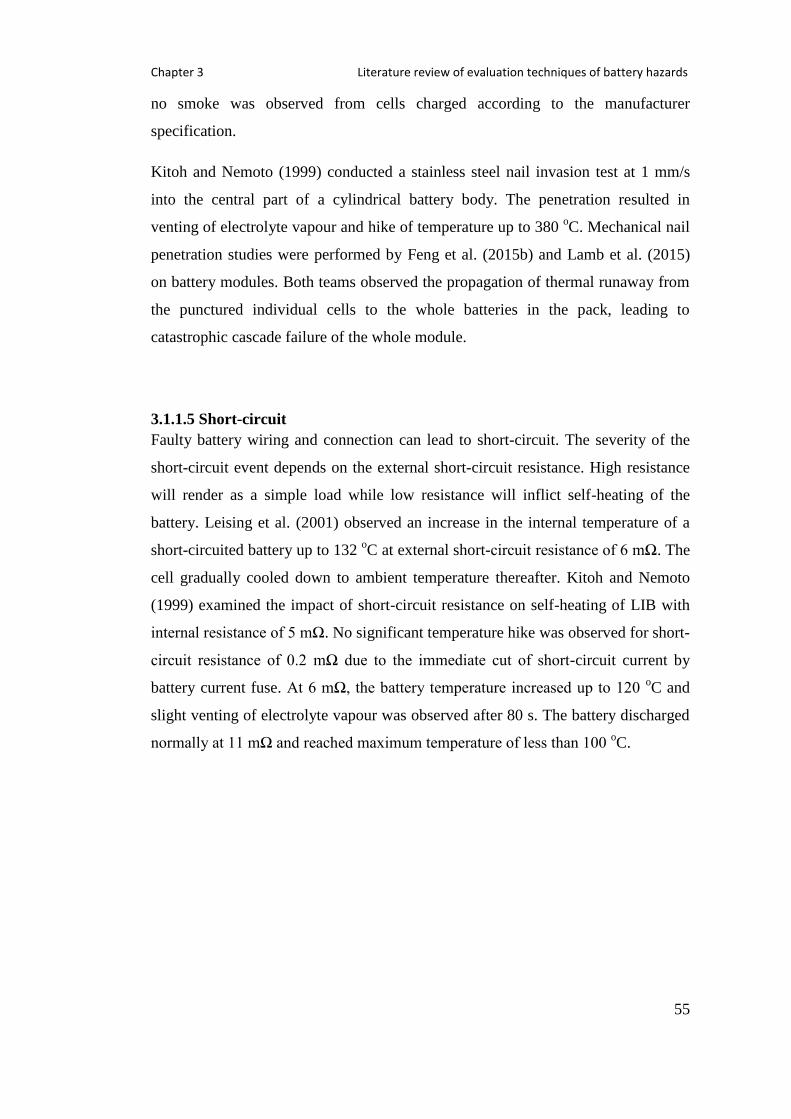
Chapter 3 Literature review of evaluation techniques of battery hazards
55
no smoke was observed from cells charged according to the manufacturer
specification.
Kitoh and Nemoto (1999) conducted a stainless steel nail invasion test at 1 mm/s
into the central part of a cylindrical battery body. The penetration resulted in
venting of electrolyte vapour and hike of temperature up to 380 oC. Mechanical nail
penetration studies were performed by Feng et al. (2015b) and Lamb et al. (2015)
on battery modules. Both teams observed the propagation of thermal runaway from
the punctured individual cells to the whole batteries in the pack, leading to
catastrophic cascade failure of the whole module.
3.1.1.5 Short-circuit
Faulty battery wiring and connection can lead to short-circuit. The severity of the
short-circuit event depends on the external short-circuit resistance. High resistance
will render as a simple load while low resistance will inflict self-heating of the
battery. Leising et al. (2001) observed an increase in the internal temperature of a
short-circuited battery up to 132 oC at external short-circuit resistance of 6 mΩ. The
cell gradually cooled down to ambient temperature thereafter. Kitoh and Nemoto
(1999) examined the impact of short-circuit resistance on self-heating of LIB with
internal resistance of 5 mΩ. No significant temperature hike was observed for short-
circuit resistance of 0.2 mΩ due to the immediate cut of short-circuit current by
battery current fuse. At 6 mΩ, the battery temperature increased up to 120 oC and
slight venting of electrolyte vapour was observed after 80 s. The battery discharged
normally at 11 mΩ and reached maximum temperature of less than 100 oC.

Chapter 3 Literature review of evaluation techniques of battery hazards
56
3.1.2 Study of Thermal Runaway Characteristics in LIB
As previously discussed, fire safety concerns of the LIB stem from its components
where a combination of energetic electrodes and flammable organic electrolytes is
present, which in turn entails the battery the ability to self-heat. Self-heating at high
temperature is an indicator of thermal instability. Calorimeters and reactors are used
to drive LIBs into thermal runaway and the resulting failure profiles are
comprehensively studied for safety assessment. Hazards originating from the
intrinsic reactivity and instability of battery components can be well quantified
using those methods. Some of the studies done as reported in literature is
summarised in Table 3.3.
Table 3.3: Examples of battery thermal runaway hazard appraisal conducted by
researchers using purpose-built equipment.
Equipment Battery Chemistry and Specifications Reference
Accelerating Rate
Calorimeter
LiCoO2 cathode and graphite anode
LiMn2O4 cathode and graphite anode
Mendoza-
Hernandez et al.
(2015)
LiNixCoyMnzO2 cathode and graphite
anode
25 Ah, 3.8 V
Feng et al. (2014)
Panasonic CGR18650E
2.55 Ah, 3.7 V
LiCoO2 cathode and graphite anode
Ishikawa et al.
(2012)
LiCoO2 cathode
Gen2 – LiNi0.80Co0.15Al0.05O2 cathode
Gen3 – Li1.1(Ni1/3Co1/3Mn1/3)0.9O2
cathode
LiMn2O4 cathode
LiFePO4 cathode
Doughty and
Pesaran (2012)

Chapter 3 Literature review of evaluation techniques of battery hazards
57
18650 Sony cell
LiCoO2 cathode and carbon anode
Gen 1 (Argonne National Laboratory
Design)
LiNi0.85Co0.15O2 cathode and graphite
anode
Gen 2 (Argonne National Laboratory
Design)
LiNi0.80Co0.15Al0.05O2 cathode and
graphite anode
Roth and Doughty
(2004)
VSP2 Adiabatic
Calorimeter
Sony SE US18650GR
LiCoO2 cathode
2.6 Ah, 3.7 V
Chen et al. (2016)
Sanyo UR18650F
LiCoO2 cathode
2.6 Ah, 3.7 V
Sony SE US18650GR
2.6 Ah, 3.7 V
Samsung ICR 18650-26D
LiCoO2 cathode
2.6 Ah, 3.7 V
LG LGDB218650
LiCoO2 cathode
2.6 Ah, 3.7 V
Jhu et al. (2011a)
LiCoO2 cathode
2.6 Ah, 4.2 V
LiNiCoMnO2
2 Ah, 4.2 V
Jhu et al. (2012)
18650 cell
LiFePO4 cathode
1.1 Ah, 3.3 V
Wen et al. (2012)

Chapter 3 Literature review of evaluation techniques of battery hazards
58
18650 cell
LiFePO4 cathode
18650 cell
LiCoO2 cathode
Lu et al. (2013b)
Sanyo UR18650FM
LiCoO2 cathode
Jhu et al. (2011b)
C80
Microcalorimeter
Self-assembled coin cells
LiCoO2 cathode and graphite anode
Ping et al. (2014)
Heatable reactor
LiFePO4 cathode and graphite anode
3.3 V, 1.1 Ah
Li(Ni0.45Mn0.45Co0.10)O2 cathode and
graphite anode
3.8 V, 1.5 Ah
LiCoO2 / Li(Ni0.50Mn0.25Co0.25)O2
cathode and graphite anode
3.8 V, 2.6 Ah
Golubkov et al.
(2014)
LiFePO4 cathode and graphite anode
1.1 Ah
Lix(Ni0.80Co0.15Al0.05)O2 cathode and
graphite anode
3.35 Ah
Golubkov et al.
(2015)
Confinement
apparatus
US14500 LiCoO2 cathode
0.58 Ah, 3.7 V
UR14500 LiCoO2 cathode
0.80 Ah, 3.7 V
LC14500 LiMn2O4 cathode
0.90 Ah, 3.6 V
IFR14500 LiFePO4 cathode
0.90 Ah, 3.2 V
Hsieh et al. (2014)

Chapter 3 Literature review of evaluation techniques of battery hazards
59
Combustion
chamber
LiCoO2 cathode and graphite anode
2.1 Ah
Somandepalli et al.
(2013)
LiCoO2 cathode
2.6 Ah
LiNiCoMn cathode
LiFePO4 cathode
Maloney (2016)
3.1.2.1 Accelerating Rate Calorimetry (ARC)
ARC is an adiabatic calorimeter used to evaluate the self-heating behaviour of
batteries at both component and full cell assembly levels. The small size of the
standard ARC restricts the work in safety evaluation of large format battery.
Recently an expanded version of ARC was introduced by Thermal Hazard
Technology, which is known as Extended Volume – ARC (EV-ARC). The new
equipment allows the study of hazards of large size batteries (Feng et al., 2014).
The concept of ARC is shown in Figure 3.1. A thermocouple is attached to the
sealed battery, which is placed within the calorimeter. A controller is programmed
to raise the temperature of the calorimeter to a preset temperature T. The battery
heats up due to the heat transport from the heating element. Once the battery
temperature approaches the preset temperature T, the temperature of the wall is
maintained at T-𝜀. The small value of 𝜀 renders the heat transfer from the battery to
the wall negligible and hence sustains the adiabaticity within the bomb.
Figure 3.1: Schematic drawing of the adiabatic calorimeter. Adapted from Richard
and Dahn (1999a).

Chapter 3 Literature review of evaluation techniques of battery hazards
60
The adiabatic self-heating rate of a battery can be measured as a function of time
and temperature. From the plots, the onset temperature and the maximum self-
heating rate of thermal runaway can be determined (Doughty, 2011). The width of
the peak during thermal runaway gives information about the enthalpy of the
reaction (Doughty and Roth, 2012).
ARC operates according to the heat-wait-search (HWS) mode which allows
determination of the onset temperature of the self-heating profile (Roth and
Doughty, 2004). In this mode, the ARC raises the temperature in discrete
predetermined steps. Each step raises the temperature and is followed by a waiting
period to allow thermal transients to decay and to achieve adiabatic thermal
equilibrium between the bomb and the calorimetric jacket (dos Santos et al., 2014).
The temperature is increased by another step and the process is repeated if the cell
temperature rise does not reach a threshold value, usually 0.02 oC/min.
If any exothermic reaction takes place, the battery temperature will increase.
Subsequently, the ARC shifts to the exotherm mode and the heating process is
stopped if the cell temperature increases at a rate equal to or above the threshold
value. In order to maintain the adiabaticity of the experimental operation during the
exotherm mode, the ARC temperature closely matches the cell temperature, even at
high heating rates. During normal operation, the ARC terminates an experiment if
the rate falls below the detection limit or endpoint temperature is reached. The
algorithm of ARC operation is illustrated in Figure 3.2.
The ARC experiment closely simulates a thermally abusive environment that
includes moderately high temperature for relatively long periods of time (Roth and
Doughty, 2004). One major disadvantage of ARC is that it is not suitable for
investigating endothermic reactions (Golubkov et al., 2014).

Chapter 3 Literature review of evaluation techniques of battery hazards
61
Figure 3.2: Algorithm of ARC operation. Adapted from dos Santos et al. (2014).
Mendoza-Hernandez et al. (2015) compared the effect of charge state on the self-
heating behaviour of two different battery chemistries using ARC. The onset of the
self-heating temperature decreased as the state of charge increased for LiCoO2-
based batteries. LiMn2O4-based batteries, on the other hand, did not display
significant dependency on the charge state. To conclude, LiCoO2 batteries are more
reactive and thermally unstable compared to LiMn2O4 as reflected by higher self-
heating rates at all states of charge.
Ishikawa et al. (2012) utilised ARC to examine characteristic of battery thermal
runaway at 87% SOC. An abrupt escalation in the battery internal resistance at high
temperature caused the open circuit voltage to drop suddenly.
Feng et al. (2014) used ARC to investigate thermal runaway feature of a large
format LIB. The battery internal temperature recorded a maximum temperature of
870 oC, which occurred after the collapse of the separator at 260
oC. The meltdown
of the separator led to internal short-circuit which in turn inflicted the descending of
the battery electrical energy into a massive amount of heat.
Roth and Doughty (2004) assessed the thermal abuse response of two advanced
battery chemistries developed by United States Department of Energy as part of the
Advanced Technology Development (ATD) Program and the findings were
compared with commercial Sony 18650 cells. In general, all batteries recorded a
higher self-heating rate at higher state of charge. Sony battery, which is based on

Chapter 3 Literature review of evaluation techniques of battery hazards
62
LiCoO2 cathode, demonstrated the highest thermal instability among the trio and its
behaviour at lower temperature is comparable to the Gen2 cells. An ageing process
renders the batteries more thermally stable as the batteries capacity gradually
deteriorates with time.
Doughty and Pesaran (2012) reported self-heating behaviour of LIBs and safety
performance of five different cathode materials was compared. LiCoO2 battery
recorded the lowest onset temperature, highest maximum self-heating rate and
widest temperature range, implying that this chemistry is the least thermally stable
compared to others.
3.1.2.2 VSP2 Adiabatic Calorimeter
The functions of this equipment are almost similar to ARC (Feng et al., 2014). This
equipment has been used by Jhu’s group for investigation of thermal and explosion
hazard of different LIBs under various conditions (Wen et al., 2012, Jhu et al.,
2012, Jhu et al., 2011b, Jhu et al., 2011a).
Chen et al. (2016) characterised thermal runaway features of LIBs at varying SOC
using VSP2 calorimeter. Half-charged and higher batteries demonstrated two
apparent phases during failure: (1) thermal runaway stage and (2) thermal explosion
stage. Activation energy and pre-exponential factor as per Arrhenius relationship at
both stages were determined. Temperature increment and the associated energy
release at both phases were established. The self-heating behaviour of Stage 1 was
mathematically reproduced by using the kinetic parameters and pseudo-zero order
reaction model with a reasonable agreement with the experimental data. TNT-
equivalent of the total heat released was determined according to the following
equation.
mTNT= χ ∆Hbattery
QTNT
1/3 (Eq 3.1)
where mTNT (g) is the TNT-equivalent mass, χ is the empirical mass of TNT,
∆Hbattery (kJ) is the total heat released by battery and QTNT (kJ/g) is the explosion
energy of TNT, usually taken as 4.602 kJ/g.

Chapter 3 Literature review of evaluation techniques of battery hazards
63
Jhu et al. (2011a) investigated thermal and self-heating profile of commercial 18650
cylindrical LIBs with LiCoO2 cathode produced by four worldwide consumer
battery producers at two different voltages. Activation energy and pre-exponential
factor of the failure process were established by using Arrhenius equation.
Jhu et al. (2012) replicated the same test procedures to compare different positive
active materials in commercial cylindrical LIBs while the voltage were kept
identical. The cathodes of concern were LiCoO2 and LiNiCoMnO2. LiCoO2
chemistry exhibited higher temperature and self-heating rate with lower onset
temperature. Activation energy and frequency factor of both chemistries were
calculated by Arrhenius relationship using the self-heating profiles.
Jhu et al. (2011b) compared thermal hazard of Sanyo batteries at half and full
charge. A battery with 100% SOC posed a bigger hazard as reflected by lower onset
temperature, and higher temperature and pressure profiles. Wen et al. (2012)
investigated thermal runaway features of full-charged and overcharged 18650
cylindrical LiFePO4 LIBs. Overcharged battery exhibited a more violent behaviour
during failure as reflected by lower onset temperature and higher temperature and
pressure profiles.
Lu et al. (2013b) examined thermal hazard features of LIB under full-charged and
storage state. The cells were composed of LiFePO4 and LiCoO2 cathode materials.
Thermal response was more reactive under full-charged condition for both
chemistries. Under both storage state and full-charged condition, violent response
was observed for LiCoO2 chemistry. The team calculated the TNT equivalent and
found that LIBs with LiCoO2 cathode poses a greater hazard than LiFePO4.
3.1.2.3 C80 Microcalorimeter
While some of the calorimetry instruments are unable to detect heat-absorbing
reactions, C80 Microcalorimeter comes with the ability to detect endothermic
reactions and thus providing information on instantaneous change of heat flow. The
detection of both heat releasing and absorbing reactions is better presented using
this equipment. The sensitivity of the machine is 0.1 µW and the adiabatic condition
sustains the constant temperature stability of the system with deviation of ±0.1 oC.

Chapter 3 Literature review of evaluation techniques of battery hazards
64
Ping et al. (2014) performed thermal analysis of in situ self-assembled coin cells
with varying mass of components using C80 Microcalorimeter. The heat flow
curves obtained from the test were mathematically deconvoluted to separate the
overlapping peaks. Kinetics of the individual peaks were determined and the
associated chemical reactions that took place were discussed.
3.1.2.4 Combustion Chamber
Somandepalli et al. (2013) investigated combustion characteristic of gases vented
by LIBs during thermal runaway. Composition of hydrogen, carbon monoxide,
carbon dioxide and various hydrocarbons at 50%, 100% and 150% SOC was
determined. The vented gas was subsequently ignited using a 100 J chemical ignitor
in a 20 L combustion chamber. The peak overpressure and the rate of pressure
change over a range of gas-air ratio were established. The explosion severity was
then calculated by using the following equation.
Kg= dP
dt V
13 (Eq 3.2)
where Kg (Pa.m/s) is the explosion severity, dP/dt (Pa/s) is the rate of pressure
change and V (m3) is the chamber volume.
The explosion severity of vented gas at 100% SOC is 65 m-bar/s, which is between
methane and propane. The team predicts a more severe consequence at overcharge
conditions.
Maloney (2016) quantified various gases emitted during thermal runaway. Volume
and concentration of gases released (total hydrocarbons, hydrogen and carbon
monoxide) were established at varying charge states and compared between three
batteries. Correlation between lower flammability limit (LFL) of gases released by
LiCoO2 cells and SOC was determined. The gases were ignited in a 21.7 L
combustion chamber to investigate the pressure rise from the combustion of gases
emitted by full-charged and half-charged batteries at varying gas-air ratio.

Chapter 3 Literature review of evaluation techniques of battery hazards
65
3.1.2.5 Heatable Reactor
Golubkov et al. (2014) built a custom-designed test rig to conduct unrestricted
thermal runaway experiments where heaters were used to induce thermal runaway
in the LIBs. The reactor was equipped with ten thermocouples for temperature
measurement of battery surface, sleeve heater and reactor interior. A pressure
transmitter was attached on top of the reactor to measure the reactor internal
pressure.
The team studied thermal stability of commercial lithium-ion batteries. Three
positive active materials were considered: LiFePO4, Li(Ni0.45Mn0.45Co0.10)O2 and a
blend of LiCoO2 and Li(Ni0.50Mn0.25Co0.25)O2. Thermal runaway of the batteries
was characterised by maximum, runaway and onset temperature. Three apparent
stages were observed: (1) heat up, (2) quasi-exponential and (3) rapid thermal
runaway. The amount of gases vented during thermal runaway was calculated
according to the ideal gas law.
n= PV
RT- n0 (Eq 3.3)
where n (mol) is the amount of gases, P (Pa) is the reactor internal pressure, R (J
mol-1
K-1
) is the gas constant and T (K) is the gas temperature, and n0 (mol) is the
initial amount of gases inside the reactor.
The cell with LiFePO4 demonstrated the least reactive response to thermal abuse,
and recorded the lowest temperature rise, self-heating rate and amount of gases
released while the blended cathode exhibited the most reactive response. The
release of H2, CO, CO2, CH4, C2H4 and C2H6 gases was detected using gas
chromatography technique. Possible chemical reactions leading to the gas
generation were discussed accordingly.
In another study, Golubkov et al. (2015) investigated the severity of thermal
runaway at varying SOC ranging from 0 to 150%. The study focused on LIBs with
LiFePO4 and Li(Ni0.45Mn0.45Co0.10)O2 cathode. The information on effect of SOC
on thermal runaway onset and maximum temperature was established. In addition,
the amount of vented gases and its composition at different SOC were determined.

Chapter 3 Literature review of evaluation techniques of battery hazards
66
3.1.2.6 Confinement Apparatus
Hsieh et al. (2014) constructed a custom-designed confinement equipment to
simulate pseudo-adiabatic condition. The equipment, with internal vessel volume of
100 mL, was equipped with pressure transducer and temperature detector to monitor
thermal runaway trajectory. Hsieh et al. (2014) compared thermal hazard
characteristics of commercial 14500 LIBs composed of three different cathode
materials: LiCoO2, LiFePO4 and LiMn2O4. LiCoO2 exhibited the most severe
behaviour as indicated by highest pressure and temperature profiles during failure,
followed by LiMn2O4 and LiFePO4.

Chapter 3 Literature review of evaluation techniques of battery hazards
67
3.1.3 Study of LIB Fire Characteristics during Fire Events
As part of safety management, a full appraisal of fire hazard caused by lithium-ion
technology is necessary. Fire occurrence is possible due to the presence of
combustible materials and flammable electrolytes as parts of the battery assembly,
in addition to the reactive electrode materials. Heat release rate (HRR), particularly
peak heat release rate (PHRR) is the utmost important parameter in fire safety
evaluation.
The advantage of using heat release rate as a quantitative indicator of fire hazard is
that the knowledge about chemical compositions and combustion chemistry of the
materials is not necessary (Biteau et al., 2008).
There are three methods to calculate the heat release rate.
1. Mass loss
The knowledge about the heat of combustion is necessary for this method. The main
challenge for this method is the uncertainty about the completion of the combustion
reaction. The heat release rate can be calculated as follows.
q = ∆Hc mfuel (Eq 3.4)
where q (W) is the heat release rate, ∆Hc (J/kg) is the heat of combustion and mfuel
(kg/s) is the mass flowrate of the combusted material.
2. Convective calorimetry
It is necessary to conduct energy balance in order to employ this method. The
knowledge about heat loss term is required. The heat release rate can be calculated
as follows.
q = me Cpair ∆T (Eq 3.5)
where q (W) is the heat release rate, me (kg/s) is the mass flow rate of combustion
products, Cpair (J/kg.K) is specific heat capacity of air and ∆T (K) is the change in
temperature.

Chapter 3 Literature review of evaluation techniques of battery hazards
68
3. Species based calorimetry
This technique is based on species concentration, and it is necessary to conduct
mass balance in a closed system in order to calculate the heat release rate. The most
prevalent technique is based on oxygen mass balance, which has been proven an
accurate technique for predicting the heat release rate of polymers, fuels and other
chemicals.
According to the Thornton principle, the amount of heat liberated during
combustion is proportionate to the amount of oxygen consumed during the process,
regardless of the materials or fuels combusted, where complete combustion of 1 kg
of oxygen will release 13.1 MJ heat. The cone calorimeter, also known as an
oxygen calorimeter is an example of equipment based on this principle. Based on
the oxygen depletion method, the heat release rate during any fire event can be
calculated by the following equation.
q = ∆Hoxygen (mO2
0 - mO2) (Eq 3.6)
where q (W) is the heat release rate, ∆Hoxygen (J/kg) is the heat of combustion of
oxygen, mO2
0 (kg/s) is the initial oxygen mass flow rate and mO2 (kg/s) is the final
oxygen mass flow rate. This equation however will overestimate the heat release
rate since most of the combustion process is not complete. A correction factor is
necessary to take into account the formation of soot and carbon monoxide.

Chapter 3 Literature review of evaluation techniques of battery hazards
69
Even though the measurement of heat release rate according to the oxygen
consumption method is a well-established and accepted technique in the fire
calorimetry field, Ping et al. (2015) and Larsson et al. (2014) pointed out that the
use of this method for quantifying fire hazards of LIBs will impose some
inaccuracies. In the event of battery fire, the melting or burning of the separator will
lead to short-circuit. The oxygen depletion method is unable to enumerate the
amount of thermal energy liberated from Joule heating. Moreover, as discussed in
Section 2.7.3.5, the decomposition reaction of positive active material in the
oxidised state releases oxygen. This self-generated oxygen will interfere with the
oxygen measurement process and subsequently reduce the value of measured
consumed oxygen.
Ribiere et al. (2012) estimated that the maximum amount of heat released by the
erratic electrical discharge is approximately one-tenth of the total energy hold by
full-charged batteries. They therefore concluded that the oxygen depletion
technique is acceptable for HRR estimation.
Work done by Chen et al. (2015) discovered that ignoring the effect of internally
generated oxygen introduced significant error. In their work, fire development of
LiCoO2 and LiFePO4 18650 cells were compared using fire calorimeter. Lower heat
release rate was observed for LiCoO2, implying safer or less reactive response to
fire, which is conflicting to previous studies. This observation can be explained by
the neglected additional internally self-generated oxygen gas at positive active
material. The team corrected the HRR computation by measuring the amount of
oxygen gas evolved and subsequently recalculated the associated HRR.
Some of the studies done related to fire hazard are shown in Table 3.4. The
experimental rigs used for fire hazard study might have varying names,
nevertheless, all the equipment in use principally comprises of two main
components, which are the sample ignition and gas detection systems.

Chapter 3 Literature review of evaluation techniques of battery hazards
70
Table 3.4: Examples of some battery fire hazard evaluation conducted by
researchers.
Reference Equipment Battery
Specification
Battery Active
Materials
Chen et al.
(2015)
Fire
Calorimeter
Samsung
ICR18650-26FM
Sony
US18650FT
LiCoO2 cathode
and graphite
anode
LiFePO4
cathode and
graphite anode
Ribiere et al.
(2012)
Tewarson
Calorimeter
Pouch
2.9 Ah, 4.1 V
LiMn2O4
cathode and
graphite anode
Larsson et al.
(2014)
Single
Burning Item
EiG ePLB-
F007A
35 Ah, 3.2 V
K2 LFP26650EV
28.8 Ah, 3.2 V
Lenovo laptop
battery pack
33.6 Ah, 3.7 V
LiFePO4
cathode and
carbon anode
LiFePO4
cathode and
carbon anode
LiCoO2 cathode
Fu et al. (2015) Cone
Calorimeter
Sanyo
UR18650FM
2.6 Ah
LiCoO2 cathode
and graphite
anode
Ping et al.
(2015)
Full-Scale
Burning
Apparatus
10 Ah
LiFePO4
cathode and
graphite anode

Chapter 3 Literature review of evaluation techniques of battery hazards
71
3.1.3.1 Single Burning Item
Larsson et al. (2014) studied the burning behaviour of LIB modules during fire
tests, comparing two types of positive active material: LiFePO4 (pouch) and cobalt-
based (laptop battery pack) using Single Burning Item (SBI). Batteries were ignited
using a propane burner. A gas analysis system was equipped to provide in situ
measurement of CO, CO2, HF, POF3 and O2 release.
HRR information of the fire event was established in compliance to oxygen
consumption method and was corrected for CO2 generation. HRR spikes were
observed in full-charged EiG modules. Broad HRR peak was observed for half-
charged and completely drained EiG modules with decreasing magnitude as the
SOC decreased. Higher amount of HF release was recorded at lower SOC.
Sprinkling water mist into the flame accelerated the rate of HF release while the
total emission remained unchanged.
3.1.3.2 Tewarson Calorimeter
In Tewarson calorimeter, batteries are ignited under controlled conditions at the
lower part of the equipment. Infrared heaters are used to apply external heat flux to
the combustion chamber, providing thermal aggression comparable to a fire event.
The fuel-deprived ignition method is desirable in such a way that there is no gas
release from the combusted fuel that otherwise will interfere with gases emitted by
the batteries under testing. Flammable gases produced from the batteries are ignited
using a pilot-flame located at 30 mm above the batteries. Combustion gases are
analysed in situ to measure the amount of total hydrocarbons (THC) by using flame
ionisation detector, oxygen by using paramagnetic analyser, soot by using optical
measurement and carbon dioxide and carbon monoxide by using Fourier-Transform
Infrared Spectroscopy (FTIR). Supplementary FTIR is used to give information on
standard toxic gases such as SOx, NOx, HCN, hydrogen halides and aldehydes
(Ribiere et al., 2012).
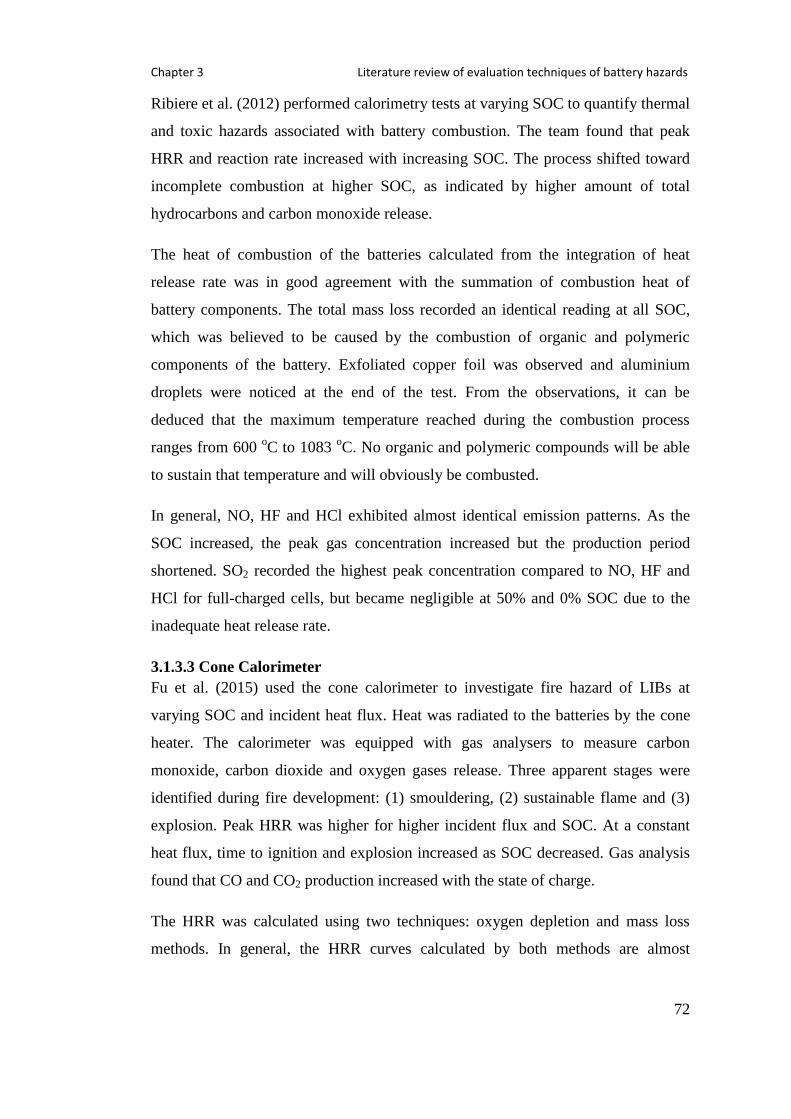
Chapter 3 Literature review of evaluation techniques of battery hazards
72
Ribiere et al. (2012) performed calorimetry tests at varying SOC to quantify thermal
and toxic hazards associated with battery combustion. The team found that peak
HRR and reaction rate increased with increasing SOC. The process shifted toward
incomplete combustion at higher SOC, as indicated by higher amount of total
hydrocarbons and carbon monoxide release.
The heat of combustion of the batteries calculated from the integration of heat
release rate was in good agreement with the summation of combustion heat of
battery components. The total mass loss recorded an identical reading at all SOC,
which was believed to be caused by the combustion of organic and polymeric
components of the battery. Exfoliated copper foil was observed and aluminium
droplets were noticed at the end of the test. From the observations, it can be
deduced that the maximum temperature reached during the combustion process
ranges from 600 oC to 1083
oC. No organic and polymeric compounds will be able
to sustain that temperature and will obviously be combusted.
In general, NO, HF and HCl exhibited almost identical emission patterns. As the
SOC increased, the peak gas concentration increased but the production period
shortened. SO2 recorded the highest peak concentration compared to NO, HF and
HCl for full-charged cells, but became negligible at 50% and 0% SOC due to the
inadequate heat release rate.
3.1.3.3 Cone Calorimeter
Fu et al. (2015) used the cone calorimeter to investigate fire hazard of LIBs at
varying SOC and incident heat flux. Heat was radiated to the batteries by the cone
heater. The calorimeter was equipped with gas analysers to measure carbon
monoxide, carbon dioxide and oxygen gases release. Three apparent stages were
identified during fire development: (1) smouldering, (2) sustainable flame and (3)
explosion. Peak HRR was higher for higher incident flux and SOC. At a constant
heat flux, time to ignition and explosion increased as SOC decreased. Gas analysis
found that CO and CO2 production increased with the state of charge.
The HRR was calculated using two techniques: oxygen depletion and mass loss
methods. In general, the HRR curves calculated by both methods are almost

Chapter 3 Literature review of evaluation techniques of battery hazards
73
identical with minor inconsistency. The biggest discrepancy between the two
methods was observed during transition from Stage 2 to Stage 3.
3.1.3.4 Full-Scale Burning Apparatus
A full-scale burning test was performed by Ping et al. (2015) on large format 50 Ah
LiFePO4 / graphite battery module. A 3 kW radiation heater was used to ignite the
batteries and a gas analysis system was equipped to provide in situ measurement of
CO, CO2 and O2 release.
A series of jet flames and stable combustion was observed, in addition to initial
battery expansion, and abatement and extinguishment of the flame at the end.
Moreover, three distinctive stages were observed from the mass loss profiles: (1)
thermal decomposition of the packaging, (2) fierce burning of the ejected gases and
(3) abatement and the subsequent fire extinguishment. The maximum flame
temperature reached 1500 oC in the region of 100 mm from the battery surface,
which imposed a serious fire hazard since the flame temperature was very high even
at a great distance.
3.1.3.5 Fire Calorimeter
Chen et al. (2015) used a fire calorimeter to observe fire development of LIBs at
varying SOC. Batteries were heated by using a 2 kW coiled electric heater. The rig
was equipped with gas analyser and electronic scale to measure the amount of gases
released and mass loss respectively.
Based on their analysis, the authors classified combustion phenomena of LIB into
four stages: (1) continuous and self-heating, (2) first flame ejection and stable
combustion, (3) second flame ejection and stable combustion and (4) flame
weakening and extinguish. Measurement of HRR was conducted according to the
oxygen consumption method and the value was corrected to take the amount of
oxygen liberated by cathode materials into account. The team calculated the amount
of oxygen released and assumed the quantity to be directly proportional to the SOC.
LiCoO2 battery posed a higher explosion risk than LiFePO4 as indicated by six-fold
higher of oxygen release amount.

Chapter 3 Literature review of evaluation techniques of battery hazards
74
3.2 Modelling of Battery Thermal Runaway Modelling is an important tool in research and development of batteries. A good
model allows the prediction of battery thermal behaviour under various operating
conditions without the necessity to conduct experimental works that are time-
consuming, resource intensive and dangerous, while providing a clear
understanding of the underlying fundamental processes. Calorimetry-based
simplified model is one of the possible approaches for this purpose. This technique
requires information from thermal analysis of the cell components, which are
characterised by reaction rate equations using Arrhenius expression (Doughty et al.,
2002). The common equipment employed for thermal and kinetic analysis of battery
components are accelerating rate calorimetry (ARC) and differential scanning
calorimetry (DSC).
3.2.1 Calorimetry and Kinetic Study
Extracting kinetic models during thermal analysis is a crucial stage in investigation
of chemical reactions. The models can serve for thermal hazard quantification and
the subsequent risk assessment. It is therefore important to extract precise models so
that the succeeding analysis is reliable (Kossoy and Koludarova, 1995).
The ARC is an adiabatic calorimeter specifically developed for the evaluation of
thermal hazard kinetic. The use of ARC enables determination of kinetic aspects of
temperature and pressure associated with chemical reactions and heat of reaction
(Townsend and Tou, 1980). The analysis of experimental results will provide
important parameters for kinetic modelling.
For a thermal-induced reaction, the reactant conversion into product can be
described by the following ordinary differential equation.
dα
dt = k(T) f(α) (Eq 3.7)
The rate constant k follows the Arrhenius relationship as follows.
k(T) = A e-EaRT (Eq 3.8)

Chapter 3 Literature review of evaluation techniques of battery hazards
75
where k (s-1
) is the reaction rate, α is the fractional degree of conversion, f(α) is the
reaction model, Ea (J/mol) is the reaction activation energy, t (s) is the time, R (J
mol-1
K-1
) is the gas constant, T (K) is the temperature and A (s-1
) is the frequency
factor.
Common reaction models employed for description of solid thermal composition is
presented in Table 3.5. The determination of the kinetic triplet, f(α), Ea and A is
crucial for accurate description of the reaction kinetic.
Table 3.5: Reaction models that are usually applied to describe thermal
decomposition of solids (MacNeil and Dahn, 2001).
Reaction
model
𝒅𝜶
𝒅𝒕=
𝒌𝜶𝒎(𝟏 − 𝜶)𝒏(− 𝐥𝐧(𝟏 − 𝜶))𝑷
m n P
One-
dimensional
diffusion
𝑘𝛼−1
-1 0 0
𝑘𝛼 1 0 0
Power law 𝑘𝛼
12 1/2 0 0
Power law 𝑘𝛼
23 2/3 0 0
Power law 𝑘𝛼
34 3/4 0 0
Zero order 𝑘 0 0 0
Contracting
cylinder 𝑘(1 − 𝛼)
12 0 0.5 0
Contracting
sphere 𝑘(1 − 𝛼)
23 0 2/3 0
First order (nth
order)
𝑘(1 − 𝛼) 0 1 0
Second order
(nth order)
𝑘(1 − 𝛼)2 0 2 0
Avrami-
Erofeev 𝑘(1 − 𝛼)(− ln(1 − 𝛼))
12 0 1 1/2

Chapter 3 Literature review of evaluation techniques of battery hazards
76
Avrami-
Erofeev 𝑘(1 − 𝛼)(− ln(1 − 𝛼))
23 0 1 2/3
Avrami-
Erofeev 𝑘(1 − 𝛼)(− ln(1 − 𝛼))
34 0 1 3/4
Autocatalytic 𝑘𝛼(1 − 𝛼) 1 1 0
Two-
dimensional
diffusion
𝑘(−ln (1 − 𝛼))−1 0 0 -1
Diffusion
controlled 𝑘(1 − (1 − 𝛼)
13)−1(1 − 𝛼)
23 - - -
Diffusion
controlled 𝑘((1 − 𝛼)
13 − 1)−1 - - -
In general, thermal decomposition of solid can be mathematically described by the
following universal equation.
dα
dt= k αm (1-α)
n (- ln(1-α) )P (Eq 3.9)
where α is the fractional degree of conversion, t (s) is the time, k (s-1
) is the rate
constant, m, n and P are the dimensionless reaction parameters.
The information pertaining to reaction model, activation energy and frequency
factor can be used to mathematically describe the reaction progress. The suitability
of the kinetic information for prediction of any parameter can be determined by
least square analysis (MacNeil and Dahn, 2001).
3.2.2 Thermal Analysis of Battery Active Materials and Thermal Reaction
Kinetic Modelling
Numerous works are reported in literature regarding the thermal stability analysis of
battery components using calorimetry technique. The study however is of
comparative nature and detailed kinetic fundamental analysis has been left out. The
works discussed in this section form the foundation for the simulation of battery
thermal behaviour, which will be discussed in Section 3.3.

Chapter 3 Literature review of evaluation techniques of battery hazards
77
Chemical reactions behind thermal runaway have been discussed in Section 2.7.3.
Early work in thermal reaction kinetic modelling of battery components was
pioneered by Richard and Dahn (1999b). A mathematical model was developed to
describe the conversion of metastable SEI to stable SEI and the sequential reaction
between lithium-intercalated anode and electrolyte by manipulating the kinetic data
obtained from ARC results in their previous work. The model was able to reproduce
the self-heating and heat flow profiles obtained from ARC and DSC measurement
respectively with reasonable accuracy. The kinetic study conducted by Richard and
Dahn (1999b) has become a primary reference in kinetic modelling for simulation
of battery behaviour under thermally or electrically abusive conditions.
The self-heating rate of anode material during the adiabatic ARC test can be
expressed as follows.
dT
dt=
∆HSEI
Cp
|dxf
dt| +
∆Hanode
Cp
|dxi
dt| (Eq 3.10)
where ∆HSEI (J/g) is the reaction enthalpy of SEI decomposition, ∆Hanode (J/g) is the
reaction enthalpy of secondary SEI formation, Cp (J/g.K) is the specific heat
capacity of the whole ARC sample, T (K) is the temperature, t (s) is the time, xf is
the fractional lithium content in the metastable SEI and xi is fractional amount of
lithium within the carbon anode.
xf is the lithium content in the metastable SEI and the temporal change of the
concentration during the conversion process to stable SEI can be expressed as
follows.
dxf
dt= -ASEI exp
-ESEIkBT xf
m (Eq 3.11)
where ASEI (min-1
) is the frequency factor, ESEI (eV) is the activation energy, m is
the reaction order for this reaction, T (K) is the temperature and kB is the Boltzmann
constant. ASEI is 1.25 x 10¹⁷
/min, ESEI is 1.4 eV and m is taken as 0.5.
xi is the amount of lithium intercalated within the carbon anode and the temporal
change of the concentration during the formation of secondary SEI can be expressed
as follows.
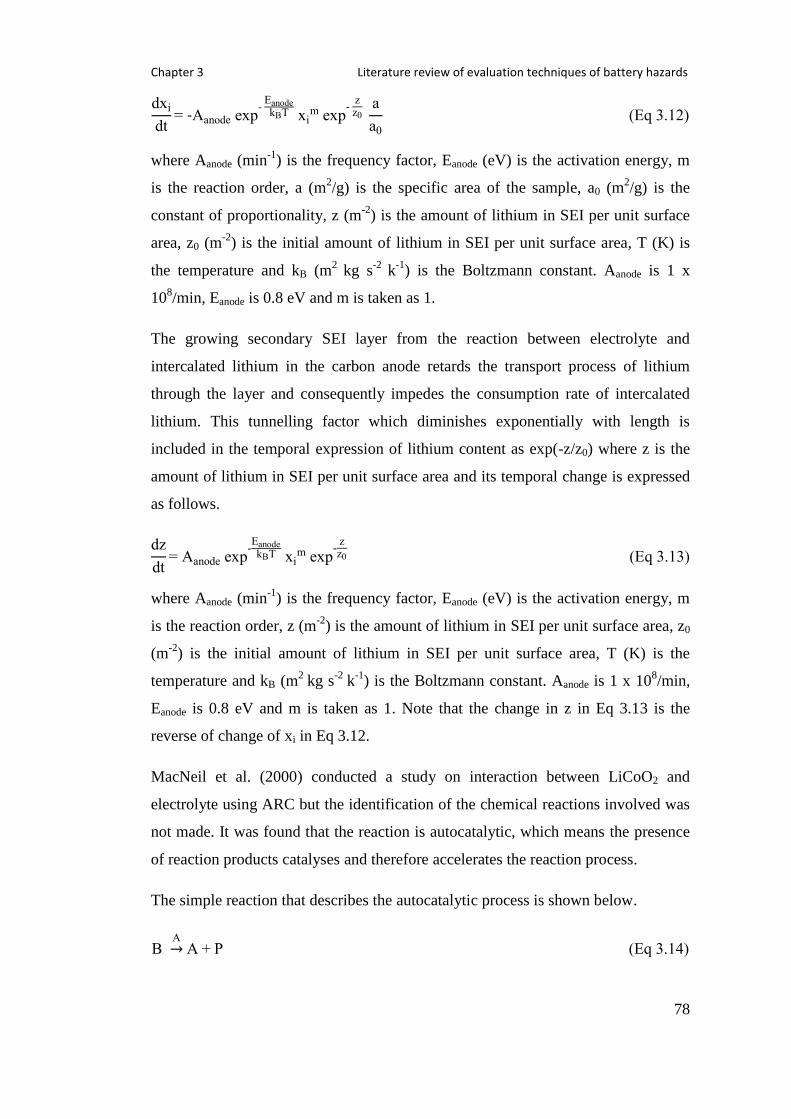
Chapter 3 Literature review of evaluation techniques of battery hazards
78
dxi
dt= -Aanode exp
- EanodekBT xi
m exp-
zz0
a
a0
(Eq 3.12)
where Aanode (min-1
) is the frequency factor, Eanode (eV) is the activation energy, m
is the reaction order, a (m2/g) is the specific area of the sample, a0 (m
2/g) is the
constant of proportionality, z (m-2
) is the amount of lithium in SEI per unit surface
area, z0 (m-2
) is the initial amount of lithium in SEI per unit surface area, T (K) is
the temperature and kB (m2
kg s-2
k-1
) is the Boltzmann constant. Aanode is 1 x
108/min, Eanode is 0.8 eV and m is taken as 1.
The growing secondary SEI layer from the reaction between electrolyte and
intercalated lithium in the carbon anode retards the transport process of lithium
through the layer and consequently impedes the consumption rate of intercalated
lithium. This tunnelling factor which diminishes exponentially with length is
included in the temporal expression of lithium content as exp(-z/z0) where z is the
amount of lithium in SEI per unit surface area and its temporal change is expressed
as follows.
dz
dt= Aanode exp
-EanodekBT xi
m exp-
zz0 (Eq 3.13)
where Aanode (min-1
) is the frequency factor, Eanode (eV) is the activation energy, m
is the reaction order, z (m-2
) is the amount of lithium in SEI per unit surface area, z0
(m-2
) is the initial amount of lithium in SEI per unit surface area, T (K) is the
temperature and kB (m2
kg s-2
k-1
) is the Boltzmann constant. Aanode is 1 x 10⁸/min,
Eanode is 0.8 eV and m is taken as 1. Note that the change in z in Eq 3.13 is the
reverse of change of xi in Eq 3.12.
MacNeil et al. (2000) conducted a study on interaction between LiCoO2 and
electrolyte using ARC but the identification of the chemical reactions involved was
not made. It was found that the reaction is autocatalytic, which means the presence
of reaction products catalyses and therefore accelerates the reaction process.
The simple reaction that describes the autocatalytic process is shown below.
B A→ A + P (Eq 3.14)

Chapter 3 Literature review of evaluation techniques of battery hazards
79
In this example, product A produced as the reaction progress accelerates the
reaction rate. The reaction rate is reduced as the amount of reactant B is depleted.
The differential equation that describes the autocatalytic process is shown as
follows.
dα
dt = k (1-α) (β+α) (Eq 3.15)
where β is the parameter of autocatalysis, k (s-1
) is the rate of reaction as expressed
according to Arrhenius equation, t (s) is the time and α is the dimensionless
fractional degree of conversion. A low value of β implies a strong autocatalytic
behaviour. Fine-tuning the kinetic parameters for curve-fitting purposes
demonstrated that a decrease in β would result in an increase in initial slope of the
self-heating behaviour, producing large curvature in the profile.
3.3 Simulation of Battery Thermal Behaviour during Failure by
Modelling Thermal Reaction Kinetics of Battery Components The temperature profile of LIBs under abusive conditions can be simulated by
utilising the kinetic data of the battery components while the details of the chemical
reactions involved remain unknown. A few models have been developed by
investigators to predict thermal behaviour of batteries during failure by modelling
the thermal decomposition reaction kinetic at component level. Some of the work is
compiled in Table 3.6.
Despite various chemical reactions studied during thermal runaway, most of the
developed models only consider reactions at active materials. The intricate nature of
the chemical reactions involved at battery components can be described by a single
thermal kinetic data set. The thermal kinetic study of the active materials that forms
the basis for battery thermal modelling has been described in Section 3.2.2.

Chapter 3 Literature review of evaluation techniques of battery hazards
80
Table 3.6: Examples of modelling work based on kinetic study of battery active
materials as reported in literature.
Reference Battery Specifications Battery Active
Materials
Richard and Dahn
(1999c)
Cylindrical IMR18650
provided by NEC Moli
Energy
1.35 Ah, 4.2 V
LiMn2O4 cathode
Hatchard et al. (2001) Cylindrical 18650
provided by E-One /
Moli Energy
1.65 Ah, 4.2 V
LiCoO2 cathode and
graphite anode
Kim et al. (2007) Cylindrical 18650
Cylindrical 50900
Graphite anode and
LiCoO2 cathode
Graphite anode and
LiCoO2 cathode
Feng et al. (2015a) 25 Ah, 3.8 V LiNixCoyMnzO2
cathode and graphite
anode
Lee et al. (2015) Cylindrical 2.5 Ah
Prismatic 2.43 Ah
Polymer 3.43 Ah
Graphite anode and
LiNiCoAlO2 cathode
Graphite anode and
LiCoO2 cathode
Graphite anode and
LiCoO2 cathode
Coman et al. (2016) 3.8 V, 2.6 Ah
LiCoO2 /
Li(Ni0.50Mn0.25Co0.25)O2
cathode and graphite
anode
Lopez et al. (2015a) Cylindrical 18650
(2.8 Ah, 4.3 V)
Prismatic
(5.3 Ah, 4.2 V)
Graphite anode and
LiCoO2 cathode
Graphite anode and
LiMn3/2Ni1/2O4 cathode

Chapter 3 Literature review of evaluation techniques of battery hazards
81
Spotnitz and Franklin
(2003)
Not available LiMn2O4 cathode
LiNiCoO2 cathode
Kim et al. (2014) Cylindrical 18650
LEV50
Graphite anode and
LiCoO2 cathode
Graphite anode and
LiCoO2 cathode
Richard and Dahn (1999c) simulated thermal behaviour of NEC Moli Energy LIB
under constant high temperature and short-circuit conditions. The team considered
heat source from SEI breakdown and new SEI formation reactions in their work.
The result was in good agreement with the experimental data.
Hatchard et al. (2001) developed a one-dimensional model to simulate battery
temperature profile under constant temperature thermal abuse testing. The team
considered heat generation from SEI decomposition and included anode and
cathode interactions with solvent as part of the battery heat sources. The model
required detail information on the thermophysical properties and thermal reaction
kinetics of the battery active materials. In addition, the developed model can capture
the effect of surface emissivity, geometry, cathode material and anode surface area
on battery thermal profile. The model managed to predict quantitative and
qualitative behaviour of battery under high temperature thermal abuse, with some
discrepancies.
According to the authors, the deviation in the predicted thermal runaway onset time
was caused by ignoring the Joule-Thompson effect during electrolyte vapour release
through the safety vent in the model development work. Meanwhile, the authors
provided two explanations for the discrepancy in the maximum temperature
reached. First, the kinetic parameters of the reactions at cathode used in the model,
which has been reported by MacNeil et al. (2000) are incomplete, where only the
first exothermic peak has been modelled and included in the simulation. Second,
high temperature exothermic decompositions have not been included.
Kim et al. (2007) expanded the work done by Hatchard et al. (2001) into three-
dimension using the finite volume method and included the high temperature

Chapter 3 Literature review of evaluation techniques of battery hazards
82
electrolyte decomposition reaction in the model. Thermal mass-specific heating
rates of the chemical reactions at different oven temperatures were explored. The
heat distribution within the structure was captured and the effect of battery
dimension was investigated. In addition, the team simulated an induced localised
heating event to study the propagation of thermal abuse reaction inside a cylindrical
cell with 50 mm diameter and 90 mm height. Kim’s group acknowledged extensive
computer resources as the main hurdle for three-dimensional modelling. No
experimental validation was provided.
Spotnitz and Franklin (2003) developed a model to predict battery thermal
behaviour during oven, overcharge, short-circuit, crush and nail tests. The
chemistries of concern were lithium-ion with LiMn2O4 and LiNiCoO2 cathode. The
simulation predicted temperature profile of the battery and the amount of heat
generated from various chemical reactions. No experimental validation was
provided.
While most of the modelling work utilises kinetic information reported by Hatchard
et al. (2001), a group of researchers from Samsung SDI Co. Ltd. presented their
own kinetic parameters for simulation of self-heating behaviour and thermal profile
of three different LIBs (Lee et al., 2015). The modelling of self-heating profile
dropped the electrolyte reaction from part of the heat source during thermal
runaway, but included for simulation of high temperature exposure. The model
managed to reproduce the experimental profiles with good agreement.
Feng et al. (2015a) developed a model to describe thermal profile of a large format
LIB during short-circuit. The abrupt rise in battery temperature during separator
meltdown at 260oC was described as exponential. The rate of heat release by each
heat source at different time and temperature was studied. The model was expanded
to include heat transfer modelling in order to simulate thermal runaway propagation
in a battery module. The simulation results were in good agreement with the
experimental data.
Lopez et al. (2015a) simulated LIB thermal behaviour during abuse by constant
power heating at ambient temperature and constant elevated ambient temperature.
The effect of inclusion of electrolyte decomposition reaction in the modelling was

Chapter 3 Literature review of evaluation techniques of battery hazards
83
studied. It was found that the inclusion was not necessary for conventional oven
test, but for constant power heating, ignoring the reaction produced significant
deviation from the experimental data.
Coman et al. (2016) included the effect of electrolyte venting and battery content
expulsion in their thermal runaway model to describe the failure behaviour of
cylindrical LIB under adiabatic-like condition. The authors combined the modelling
of exothermic reactions that lead to thermal runaway as reported by Kim et al.
(2007) and isentropic flow equations. Their model was validated against
experimental work by Golubkov et al. (2014).
Kim et al. (2014) compared thermal runaway features of large format prismatic and
18650 cylindrical LIBs. The onset of thermal runaway was delayed in the
cylindrical with lower peak temperature due to the larger surface area-to-volume
ratio, compared to the large format prismatic battery. No experimental validation
was provided.
3.4 Thermal Runaway Propagation in Large Scale Battery Pack Studies on the hazards of LIBs have been concentrated on the detrimental
consequences of failure of individual cells. The trend is driven by the current
practice where vast amount of LIBs are usually found in small-scale applications. In
this situation, the probability for abusive conditions is low. In case of failure, the
impact is minor and the consequences would not reach beyond the devices and the
end-users.
Superior energy characteristics of LIBs make them a potential candidate for large-
scale applications such as electromobility and stationary energy storage.
Insufficiency of single cells to meet the high-energy demand requires the assembly
of battery packs. The integration of single cells into large capacity and high voltage
battery pack has been discussed in Section 2.3. Vast amount of single cells are
electrically connected by either series or parallel, or combination of both according
to the desired capacity and voltage, and packed together in a single enclosure.

Chapter 3 Literature review of evaluation techniques of battery hazards
84
This situation necessitates for the understanding of the hazards posed by the large
battery assembly during failure. The potential of cascade failure and thermal
runaway propagation inflicted by a single cell in a battery pack should not be
disregarded. The heat transfer process from the cell undergoing thermal runaway
causes the temperature of the adjacent cells to increase and consequently triggering
cell-to-cell chain reactions.
3.4.1 Heat Transfer from Faulty Cell to Adjacent Cells Leads to Cascade
Failure in Battery Modules
The compact design of the battery pack, with less than 1 mm available inter-cells
spacing, is driven by the demand for high energy density battery pack. This design,
while meeting the high energy density requirement, nevertheless provides a
favourable network for heat transport process. The heat transferred from the hot cell
will heat the neighbouring cells gradually and eventually induce the heat-activated
exothermic reactions in the neighbouring cells, leading to detrimental thermal
runaway propagation.
Previous work by Jhu et al. (2011a) discovered that a single cylindrical cell can
reach up to 900 oC during thermal runaway. The massive amount of heat associated
with the high temperature hike can be transferred to the nearby cells by three modes
of heat transport (Kim and Pesaran, 2007).
1. Radiation: heat is transferred at long distance from the defective cell through
electromagnetic wave emission or absorption at cell surfaces.
2. Convection: heat is transferred from the hot cell by bulk motion of heat
transfer medium.
3. Conduction: heat is diffused from the hot spot through solid medium such as
electric connector.
In addition, the expelled hot content carries a significant amount of thermal energy
that may promote thermal runaway propagation to the surrounding cells. The erratic
hot content ejection and the subsequent combustion of the flammable content make
thermal runaway propagation hardly predictable due to the intricate nature of the
heat quantification process (Wilke et al., 2017).

Chapter 3 Literature review of evaluation techniques of battery hazards
85
Despite potential catastrophic aftermath of cascade failure inflicted by thermal
runaway propagation, systematic study in this area is still scarce, irrespective of the
failure initiation modes. Some of the studies as reported in literature are compiled in
Table 3.7.
Table 3.7: Some of the works reported in literature pertaining to thermal runaway
propagation.
Reference Battery
Specification
Battery Active
Materials
Failure Initiation
Technique
Spotnitz et al.
(2007)
Hypothetic Hypothetic Hypothetic
Lopez et al.
(2015b)
Cylindrical 18650
(2.8 Ah, 4.35 V)
Pouch
(5.3 Ah, 4.2 V)
Not made
available by
authors
Heating
Lamb et al.
(2015)
Panasonic
CGR18650CG
2.2 Ah
AA Portable
Power Corp
7035130-10C
3.0 Ah pouch
LiCoO2 cathode
and graphite anode
LiCoO2 cathode
and graphite anode
Nail penetration
Feng et al.
(2015b)
25 Ah, 3.8 V
LiNixCoyMnzO2
cathode and
graphite anode
Nail penetration

Chapter 3 Literature review of evaluation techniques of battery hazards
86
Feng et al.
(2015a)
25 Ah, 3.8 V
LiNixCoyMnzO2
cathode and
graphite anode
Nail penetration
Wilke et al.
(2017)
18650 cylindrical
(2.85 Ah, 3.62 V)
LiNixCoyMnzO2
cathode and
graphite anode
Nail penetration
Feng et al.
(2016)
25 Ah, 3.8 V
LiNixCoyMnzO2
cathode and
graphite anode
Nail penetration
3.4.2 Factors Affecting Thermal Runaway Propagation in Battery Modules
3.4.2.1 Thermal Properties of Cell Interstitial Medium
Initial work in thermal runaway propagation was pioneered by Spotnitz et al.
(2007). A model was developed to investigate the effect of heat transfer coefficient
and the relative position of the defective cell on propagation of thermal runaway in
a laptop battery pack comprised of eight cylindrical 18650 cells. The model was
developed based on the assumption that the rate of temperature rise caused by
thermal runaway followed the standard normal curve and the initial mode of failure
that lead to this catastrophic event was not specified. The simulation indicated that
thermal runaway could propagate from the affected cell to the neighbouring cells,
inducing exothermic reactions in the surrounding cells and leading to a detrimental
cascade failure. In addition, it was found that heat transfer coefficients and close
proximity of the neighbouring cells to the faulty cell had significant impact on the
spread of thermal runaway. No experimental validation was performed to support
the model.
Wilke et al. (2017) demonstrated that a considerable level of safety improvement
can be achieved by embedding phase change composite (PCC) material around
individual cells in a battery module. The large amount of heat generated by short-
circuit was absorbed as latent heat during phase transition of the PCC material from

Chapter 3 Literature review of evaluation techniques of battery hazards
87
solid to liquid, preventing the cell temperature from soaring to a dangerous level
and consequently deterring thermal runaway from destructing the whole pack.
3.4.2.2 Electrical Connection
For a configuration with limited physical contact such as triangular matrix
constructed from cylindrical 18650 cells, the electrical connection plays a vital role
in spreading thermal runaway to the neighbouring cells. The effect of electrical
connection on thermal runaway propagation has been studied by Lamb et al. (2015).
For a small triangular battery module fully connected in series, it was discovered
that thermal runaway was not observed in any other cells than the induced cell. Fire
was observed due to the burning of the leaked electrolyte. At the end of the test, the
battery pack remained undamaged. The initiation of thermal runaway in the cell
generated massive amounts of thermal energy but the heat transport process was
retarded by the significant air gap between the cells. The inadequate heat transfer to
the neighbouring cells will not be able to trigger the exothermic reactions in the
cells and subsequently arrest thermal runaway from propagating.
While the module geometry remained unchanged, the module constructed in full
parallel recorded a violent behaviour. The failure rapidly propagated to the adjacent
cells and consequently consumed the whole module. The faulty cell triggered the
chain electrolyte venting and leaking, which was subsequently being ignited, and
instigated a sustained flame.
The significant difference in the battery module failure behaviour was brought by
the different electrical connections. The series configuration provides limited
electrical pathway to the cells directly attached to before and after the trigger cell. A
rupture in the bus bar will in turn disconnect the cells. On the other hand, parallel
electrical connection provides multiple pathways for current flow out of the trigger
cell. At the point of failure initiation process, nail penetration induces short-circuit
in the trigger cell and subsequently inflicts electrical shorting throughout the whole
module.

Chapter 3 Literature review of evaluation techniques of battery hazards
88
In a different study, Lopez et al. (2015b) investigated the effect of inter-cell
connection design on thermal runaway propagation. Figure 3.3 illustrates the two
different tab configurations explored in the study.
Figure 3.3: Two electrical connection designs (a) branched and (b) serpentine.
Adapted from Lopez et al. (2015b).
The effect is pronounced, where serpentine configuration exhibited a more violent
behaviour during thermal runaway propagation. Higher maximum temperature was
recorded and electrical energy from all cells was completely drained, as indicated
by zero open circuit voltage at the end of the tests.
3.4.2.3 Contact Surface Area
In geometries where contact surface area is abundant, a massive amount of heat
generated by batteries experiencing thermal runaway is transferred through the
inter-cells contact surface. Lamb et al. (2015) observed rapid propagation of
thermal runaway in a battery module comprised of stacked pouch cells. Varying the
inter-cells electrical connection appeared to have minimum impact on the severity
and reactivity of thermal runaway spread. Thermal runaway propagated serially
from the triggered cell, leading to total consumption of the whole module. A good
thermal contact over the largest surface area promoted the heat transfer process
from the defective cell to its neighbours.
Heat dissipation got more difficult as thermal runaway propagated throughout the
module, inflicted an increase in maximum temperature of the cells. This observation
reflects that assigning more cells in a single module not only increases the energy
involved in the mishap, but also aggravates the severity of the failure. It was
observed that initiation of thermal runaway in the middle cell produced a more
rapid thermal runaway propagation and led to quick complete destruction of the

Chapter 3 Literature review of evaluation techniques of battery hazards
89
whole battery module, compared to the end cell due to the shorter thermal pathway
for heat transfer.
Feng et al. (2015b) investigated thermal runaway propagation in a large format
prismatic battery module. In general, the development of battery temperature within
the module demonstrated the same pattern as observed by Lamb et al. (2015). Heat-
activated exothermic reactions in the neighbouring cells were induced by gradual
heating caused by the heat transfer from the hot cell. Upon separator meltdown at
260 oC, a surge in temperature was observed due to short-circuit, where the stored
electrical energy was descended to thermal energy.
A model was developed by Feng et al. (2015a) in a separate work to simulate the
propagation pattern by combining chemical reactions and heat transfer modelling.
The model was developed based on assumption that the only way that the adjacent
cells were brought into thermal runaway was by transfer of heat through the battery
largest surface area. All components that contributed to thermal resistance were
taken into account. The developed model was in good agreement with the
experimental data. The work was further expanded into three-dimensions using the
finite volume method by Feng et al. (2016). The structure was however assumed to
be homogeneous blocks of solid where detailed components that made the battery
have been left out. Empirical equations were introduced to describe the heat release
caused by exothermic reactions that led to thermal runaway.
3.4.2.4 Miscellaneous
In a large format battery module, multiple pathways for heat transfer that may lead
to thermal runaway propagation are available. Quantification of the heat transfer
process through the pole connector, battery shell and fire scorching has been
performed by Feng et al. (2015b). The analysis found that the heat transport through
the battery shell dominated the heat transfer process. Heat transport due to fire
scorching was negligible for thermal runaway propagation but may cause
significant damage on the accessories located above the battery module. The same
conclusion was drawn in the study by Lamb et al. (2015). Large contact surface
between cells dominated the heat transfer process even though electrical connection
appeared to be impactful for cells with limited surface area.

Chapter 3 Literature review of evaluation techniques of battery hazards
90
3.5 Summary A review on the technique of evaluation of lithium-ion battery hazards was
conducted. Batteries are subjected to thermal, mechanical and electrical off-nominal
conditions to gain valuable insight into the probability and severity of thermal
runaway under various situations. The five most common techniques are short-
circuit, overcharge, nail penetration, crush and oven heating.
In addition, custom-designed and purpose-built equipment is used to quantify
thermal runaway and fire hazards stem from intrinsic reactivity of the cell
components and combustible materials of the battery assembly. Some of the tools
are based on oxygen depletion method that come with various names, nevertheless,
all the equipment in use principally comprises of two main components, which are
the sample ignition and gas detection systems.
Moreover, a number of calorimeters and reactors are used to drive LIBs into
thermal runaway and the resulting failure profiles are comprehensively studied for
safety assessment. Hazards originating from the intrinsic reactivity and instability of
battery components can be well quantified using those methods.
Most of the works reported in literature related to evaluation of lithium-ion battery
hazards are concentrated on the impact and aftermath of failure of a single cell. A
comparison between the available lithium-ion chemistries indicates that LiCoO2
batteries produce the most severe consequences during failure. The failure
behaviour gets more violent at higher SOC due to the higher electrical energy
content.
The kinetic study of thermal decomposition of the reactive electrodes and
flammable electrolyte was discussed. Thermal runaway of lithium-ion battery can
be simulated by modelling the thermal kinetics of the pertinent chemical reactions.
A further inclusion of heat transfer modelling with the thermal kinetic model allows
the simulation of thermal runaway propagation in a battery pack.

Chapter 4 Numerical modelling
91
Chapter 4: Development of a Numerical
Model for Simulation of Lithium-ion Battery
Thermal Runaway
Hazards of lithium-ion batteries have been discussed in the previous chapters.
Thermal runaway has been identified as the prevalent failure mode of lithium-ion
batteries, which is in most cases, is instigated by applications outside the
manufacturer specifications. Current techniques for battery hazard assessment and
evaluation have been presented. It is imperative to have a reliable model for
prediction of battery thermal runaway hazard due to the capital-intensive and time-
consuming nature of experimental assessment. This chapter describes the
development of thermal runaway model for cylindrical lithium-ion battery with
lithium cobalt oxide cathode and graphite anode. A prediction of battery thermal
runaway behaviour under thermally abusive environments and impact-induced
short-circuit is presented.
In addition, the model is further expanded to simulate the propagation of thermal
runaway in a battery module consists of nine cylindrical cells. There are two major
steps involved: (1) establishing the thermal kinetic modelling of reactions involved
during thermal runaway in a single cell, and (2) coupling the thermal runaway
model of the single cell with heat transfer modelling.

Chapter 4 Numerical modelling
92
4.1 Battery Specifications
The study attempts to develop a model to simulate thermal behaviour of cylindrical
18650 LIB under abusive environments. The specifications of the battery are
presented in Table 4.1.
Table 4.1: Cell specifications.
Specification Value
Form Factor Cylindrical 18650
Diameter (mm) 18
Length (mm) 65
Nominal voltage (V) 3.7
Maximum voltage (V) 4.2
Minimum voltage (V) 2.8
Chemistry Lithium cobalt oxide
cathode
Graphite anode
4.2 Battery Physical and Thermal Properties Thermal properties of the cell canister and volumetric mass of the battery
components as collected from literature are presented in Table 4.2.
Table 4.2: Battery physical parameters for thermal runaway modelling.
Property Value Reference
Total mass, M (kg) 0.048 Measured
Specific heat capacity, Cp
(J/kg.K)
830 Hatchard et al. (2001)
Volumetric mass of cathode
(kg/m3)
1.221 x 10³ Kim et al. (2007)
Volumetric mass of anode
(kg/m3)
6.104 x 10² Kim et al. (2007)
Volumetric mass of
electrolyte (kg/m3)
4.069 x 10² Kim et al. (2007)
Thermal emissivity, ε 0.8 Hatchard et al. (2001)

Chapter 4 Numerical modelling
93
4.3 Development of Thermal Runaway Model
4.3.1 Assumptions Made in Thermal Runaway Model Development
1. The battery is composed of jellyroll active materials packed inside the
cylindrical stainless steel casing.
2. The heat leads to thermal runaway originates from exothermic reactions in
the active materials and electrolyte.
3. Thermal runaway reactions occur at the centre of the battery.
4. The amount of heat liberated by Joule heating during short-circuit is
negligible for high temperature abuse tests.
5. The combustion of the flammable electrolyte and any combustible materials
is not considered.
6. The heat is dissipated to the surrounding by convective and radiative heat
transfer.
7. The Joule-Thompson cooling effect instigated by venting of gases and
expulsion of battery content is not considered.
8. The heat is transmitted from the defective cell to the neighbouring cells by
conduction and convection.
9. Thermal conductivity of the heat conducting materials is isotropic and
constant. The battery specific heat capacity remains constant at any
temperature.
10. The battery temperature is uniform and any temperature gradient is
neglected. The low Biot number of 0.0179 as reported by Hatchard et al.
(2001) warrants the use of lumped thermal model.
4.3.2 Heat Source Term
In this work, heat sources from active materials and electrolyte are considered,
totalling to four exothermic reactions. There are two reactions at anode, which are
the breakdown of solid electrolyte interphase (SEI), and anode-electrolyte reaction.
Meanwhile, both cathode and electrolyte have one reaction. Each of the reaction
possesses characteristic decomposition reaction model and parameters. The thermal
decomposition kinetics of the battery components for thermal runaway modelling
which are collected from literature are listed in Table 4.3.
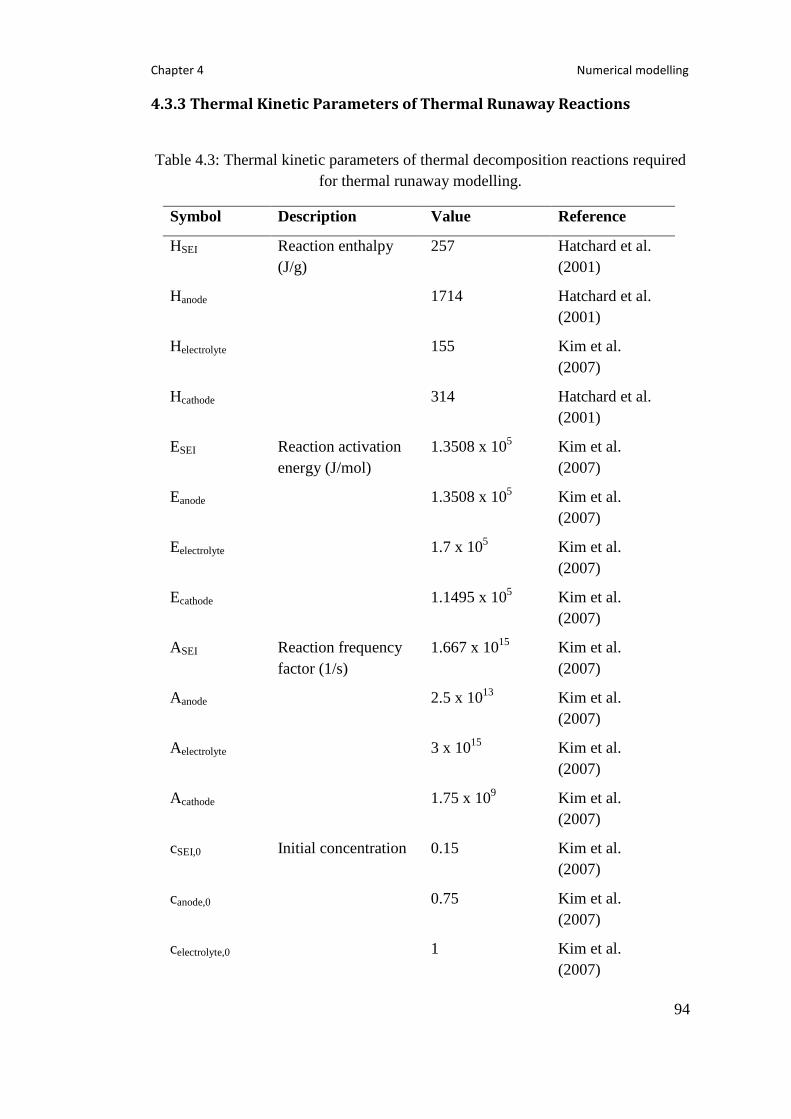
Chapter 4 Numerical modelling
94
4.3.3 Thermal Kinetic Parameters of Thermal Runaway Reactions
Table 4.3: Thermal kinetic parameters of thermal decomposition reactions required
for thermal runaway modelling.
Symbol Description Value Reference
HSEI Reaction enthalpy
(J/g)
257 Hatchard et al.
(2001)
Hanode 1714 Hatchard et al.
(2001)
Helectrolyte 155 Kim et al.
(2007)
Hcathode 314 Hatchard et al.
(2001)
ESEI Reaction activation
energy (J/mol)
1.3508 x 10⁵ Kim et al.
(2007)
Eanode 1.3508 x 10⁵ Kim et al.
(2007)
Eelectrolyte 1.7 x 10⁵ Kim et al.
(2007)
Ecathode 1.1495 x 10⁵ Kim et al.
(2007)
ASEI Reaction frequency
factor (1/s)
1.667 x 10¹⁵
Kim et al.
(2007)
Aanode 2.5 x 10¹³
Kim et al.
(2007)
Aelectrolyte 3 x 10¹⁵
Kim et al.
(2007)
Acathode 1.75 x 10⁹ Kim et al.
(2007)
cSEI,0 Initial concentration 0.15 Kim et al.
(2007)
canode,0 0.75 Kim et al.
(2007)
celectrolyte,0 1 Kim et al.
(2007)

Chapter 4 Numerical modelling
95
α,0 0.04 Kim et al.
(2007)
z0 0.033 Kim et al.
(2007)
mSEI Reaction order 1 Kim et al.
(2007)
manode 1 Kim et al.
(2007)
melectrolyte 1 Kim et al.
(2007)
mcathode 1 Kim et al.
(2007)
4.3.4 Governing Equations
In a lumped thermal model, the rate of temperature change in the battery can be
expressed as in Eq 4.1.
dT(t)
dt=
Q(t)
MCp
(Eq 4.1)
where T (K) is the battery temperature, t (s) is the time, Q (W) is the net rate of heat
generation, M (kg) is the mass and Cp (J/kg.K) is the battery specific heat capacity.
The rate of battery temperature change is directly proportional to the battery internal
heat accumulation, which is a balance between self-generated and dissipated heat.
The net rate of heat generation is expressed in Eq 4.2, where Qgen is the rate of
internal heat generation and Qdissipation is the rate of heat transferred from battery to
the surrounding.
Q(t) = Qgen
(t) - Qdissipation
(t) (Eq 4.2)
The Qdissipation term in Eq 4.2 is the rate of heat dissipation to the environment due to
the convective and radiative heat transfer, as presented in Eq 4.3. The rate of heat
dissipation can be calculated using Eq 4.3.
Qdissipation
(t) = Qradiative
(t) + Qconvective
(t) (Eq 4.3)

Chapter 4 Numerical modelling
96
The rate of convective heat transfer is given in Eq 4.4.
Qconvective
(t) = h A (T(t)-Tamb(t)) (Eq 4.4)
where h (W/m2.K) is the heat transfer coefficient, A (m
2) is the surface area for heat
exchange, T (K) is the instantaneous battery temperature, t (s) is the time, and Tamb
(K) is the ambient temperature.
The rate of radiative heat transfer is given in Eq 4.5.
Qradiative
(t) = ε σ A(T(t)4 - Tamb(t)4) (Eq 4.5)
where ε is the battery surface emissivity, σ (W/m2K
4) is the Stefan-Boltzmann
constant, A (m2) is the surface area for heat exchange, T (K) is the instantaneous
battery temperature and Tamb (K) is the ambient temperature.
The rate of internal heat generation is expressed in Eq 4.6, which is a sum of rate of
heat generation from chemical reactions, Qcr and short-circuit, Qsc.
Qgen
(t) = Qcr
(t) + Qsc
(t) (Eq 4.6)
Qsc in Eq 4.6 is the rate of heat generation from short-circuit and can be expressed
as in Eq 4.7 (Feng et al., 2015a).
Qsc
(t) = 1
∆t [∆Hsc- ∫ Q
sc(τ) dτ
t
0
] (Eq 4.7)
where ∆t (s) is the duration of short-circuit, ∆Hsc (J) is the amount of electrical
energy discharged into heat during short-circuit, t (s) is the instantaneous time and 𝜏
(s) is the time at the point of short-circuit.
The amount of heat generated from rapid discharge of electrical energy during
short-circuit can be calculated using Eq 4.8 (Feng et al., 2015a).
∆Hsc = CV (Eq 4.8)
where C (Ah) is the battery capacity and V (V) is the battery voltage.
Qcr in Eq 4.6 is the total rate of heat generation from chemical reactions instigated
by thermal instability of the battery components as expressed in 4.9.

Chapter 4 Numerical modelling
97
Qcr
= QSEI
+ Qanode
+ Qelectrolyte
+ Qcathode
(Eq 4.9)
The rate of heat generation by each chemical reaction is proportionate to the rate of
reactant consumption. In general, the rate of heat generation from the exothermic
reactions can be expressed as in Eq 4.10.
Qx(t)= ∆Hx Wx
dcx(t)
dt (Eq 4.10)
where ∆Hx (J/kg) is the reaction enthalpy, Wx (kg) is the mass of the reactant and cx
is the normalised reactant concentration.
The thermal decomposition models of the reactions involved in thermal runaway
are described in the following section.
4.3.5 Modelling of Thermal Decomposition Kinetics
4.3.5.1 Solid electrolyte interface (SEI) breakdown
As described by Richard and Dahn (1999a), the reaction is first-order and the rate
constant of this reaction can be expressed as in Eq 4.11.
RSEI = ASEI exp [-ESEI
RT] cSEI
mSEI (Eq 4.11)
The rate of change in reacting species content during the reaction is presented in Eq
4.12.
dcSEI
dt = -RSEI (Eq 4.12)
The rate of heat evolution from the reaction can be calculated using Eq 4.13.
QSEI
= ∆HSEI Wanode RSEI (Eq 4.13)
where RSEI (s-1
) is the rate constant of SEI decomposition reaction, ∆HSEI (J/kg) is
the reaction enthalpy, ASEI (s-1
) and ESEI (J/mol) are frequency factor and activation
energy respectively, R (J/K.mol) is the gas constant, T (K) is the battery
temperature, mSEI is the reaction order, Wanode (kg) is the mass of carbon in anode,
and cSEI is the dimensionless amount of lithium-containing meta-stable species in
the SEI.

Chapter 4 Numerical modelling
98
4.3.5.2 Reaction between anode and solvent
The reaction between the solvent and the intercalated lithium within the anode will
eventually form a secondary SEI layer. As described by Richard and Dahn (1999b),
the reaction is first-order and the rate constant of this reaction can be expressed as
in Eq 4.14.
Ranode= Aanode exp [-Eanode
RT] exp [-
z
z0
] canodemanode (Eq 4.14)
The rate of depletion in reacting species content during the reaction is presented in
Eq 4.15.
dcanode
dt= -Ranode (Eq 4.15)
z is the SEI layer thickness and its temporal change is expressed in Eq 4.16.
dz
dt= Ranode (Eq 4.16)
The rate of heat evolution from the reaction can be calculated using Eq 4.17.
Qanode
= ∆Hanode Wanode Ranode (Eq 4.17)
where Ranode (s-1
) is the rate constant of anode-solvent reaction, ∆Hanode (J/kg) is the
reaction enthalpy, Aanode (s-1
) and Eanode (J/mol) are frequency factor and activation
energy respectively, R (J/K.mol) is the gas constant, T (K) is the battery
temperature, manode is the reaction order, Wanode (kg) is the mass of carbon in anode,
z is the thickness of SEI layer, z0 is the initial thickness of SEI layer and canode is the
dimensionless amount of lithium intercalated within the carbon negative electrode.
4.3.5.3 Electrolyte decomposition
As described by Spotnitz and Franklin (2003), the reaction is first-order and the rate
constant of this reaction can be expressed as in Eq 4.18.
Relectrolyte= Aelectrolyte exp [-Eelectrolyte
RT] celectrolyte
melectrolyte (Eq 4.18)
The rate of reacting species consumption during the reaction is presented in Eq
4.19.

Chapter 4 Numerical modelling
99
dcelectrolyte
dt= -Relectrolyte (Eq 4.19)
The rate of heat evolution from the reaction can be calculated using Eq 4.20.
Qelectrolyte
= ∆Helectrolyte Welectrolyte Relectrolyte (Eq 4.20)
where ∆Helectrolyte (J/kg) is the reaction enthalpy, Aelectrolyte (s-1
) and Eelectrolyte
(J/mol) are frequency factor and activation energy respectively, R (J/K.mol) is the
gas constant, T (K) is the battery temperature, melectrolyte is the reaction order,
Welectrolyte (kg) is the mass of electrolyte and celectrolyte is the dimensionless
electrolyte concentration.
4.3.5.4 Cathode breakdown
Cathode breakdown is an auto-catalytic reaction (MacNeil et al., 2000). The rate
constant for the decomposition of positive active material reaction can be expressed
as in Eq 4.21.
Rcathode= Acathode exp [-Ecathode
RT] αmcathode (1-α)
mcathode (Eq 4.21)
The extent of the reaction is changing according to the following rate, as presented
in Eq 4.22.
dα
dt= Rcathode (Eq 4.22)
The rate of heat evolution from the reaction can be calculated using Eq 4.23.
Qcathode
= ∆Hcathode Wcathode Rcathode (Eq 4.23)
where ∆Hcathode (J/kg) is the reaction enthalpy, Acathode (s-1
) and Ecathode (J/mol) are
frequency factor and activation energy respectively, R (J/K.mol) is the gas
constant, T (K) is the battery temperature, mcathode is the reaction order, Wcathode
(kg) is mass of the cathode and α is the extent of cathode decomposition reaction.

Chapter 4 Numerical modelling
100
4.4 Development of Thermal Runaway Propagation Model For a battery module with a layout as in Figure 4.1, the associated thermal node
configuration and thermal resistance network are shown in Figure 4.2 and Figure
4.3 respectively.
Figure 4.1: 3x3-matrix battery module assembled from nine unit of cylindrical cells.
Figure 4.2: Thermal nodes in the battery matrix.

Chapter 4 Numerical modelling
101
Figure 4.3: Thermal resistance network for heat transfer modelling.
For thermal node T5, the Qdissipation
term in Eq 4.3 is further expanded as in Eq 4.24.
Qdissipation
(t)= ∑ Qdissipation,i
(t)
10
i=1
(Eq 4.24)
For thermal nodes T2, T4, T6 and T8, which are located directly adjacent to T5, the
Qdissipation
term in Eq 4.3 is further expanded as in Eq 4.25.
Qdissipation
(t)= ∑ Qdissipation,i
(t)
6
i=1
(Eq 4.25)
For T1, T3, T7 and T9 thermal nodes that are perpendicular to T5, the Qdissipation
is
expressed as in Eq 4.26.
Qdissipation
(t)= ∑ Qdissipation,i
(t)
7
i=7
(Eq 4.26)

Chapter 4 Numerical modelling
102
Each Qdissipation,i
term in Eq 4.24 - 4.26 can be calculated using Eq 4.27.
Qdissipation,i
=Ai Tn- Tn-1
Rtotal, i (Eq 4.27)
where Ai is the surface area for heat exchange, Rtotal, i is the total thermal resistance
in any direction i and Tn is temperature of thermal node n.
The thermal resistance network within the battery module and single battery is
illustrated in Figure 4.4 and Figure 4.5 respectively. The description and value of
each thermal resistance involved in the simulation is listed in Table 4.4.
Figure 4.4: Heat transfer resistance network within the module.

Chapter 4 Numerical modelling
103
Figure 4.5: Heat transfer resistance network within the cylindrical cell.
Table 4.4: Description of all thermal resistances within the individual cell and
battery module.
Thermal
Resistance
Description Thickness
(m)
Thermal
Conductivity
(W/m.K)
Heat
Transfer
Coefficient
(W/m2.K)
Reference
Rjr Jellyroll
(Axial)
(Radial)
0.0315
0.008
3.4 - Hatchard et
al. (2001)
Rcan Canister 0.001 14 - Hatchard et
al. (2001)
Rh Convective
heat transfer
resistance
- - 7.17 Hatchard et
al. (2001)
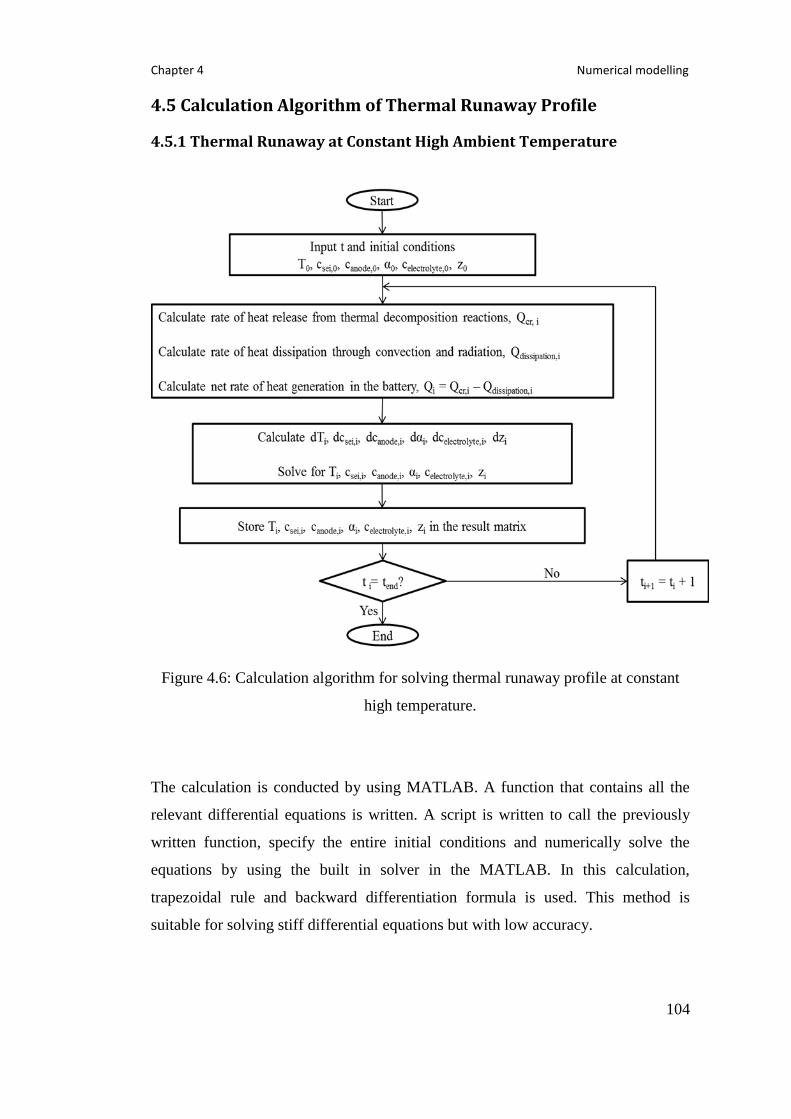
Chapter 4 Numerical modelling
104
4.5 Calculation Algorithm of Thermal Runaway Profile
4.5.1 Thermal Runaway at Constant High Ambient Temperature
Figure 4.6: Calculation algorithm for solving thermal runaway profile at constant
high temperature.
The calculation is conducted by using MATLAB. A function that contains all the
relevant differential equations is written. A script is written to call the previously
written function, specify the entire initial conditions and numerically solve the
equations by using the built in solver in the MATLAB. In this calculation,
trapezoidal rule and backward differentiation formula is used. This method is
suitable for solving stiff differential equations but with low accuracy.

Chapter 4 Numerical modelling
105
4.5.2 Thermal Runaway at Constant Heating Rate
Figure 4.7: Calculation algorithm for solving thermal runaway profile at constant
heating rate.
The calculation is conducted by using MATLAB. A function that contains all the
relevant differential equations is written. A script is written to call the previously
written function, specify the entire initial conditions and numerically solve the
equations by using the built in solver in the MATLAB. In this calculation,
trapezoidal rule and backward differentiation formula is used. This method is
suitable for solving stiff differential equations but with low accuracy.
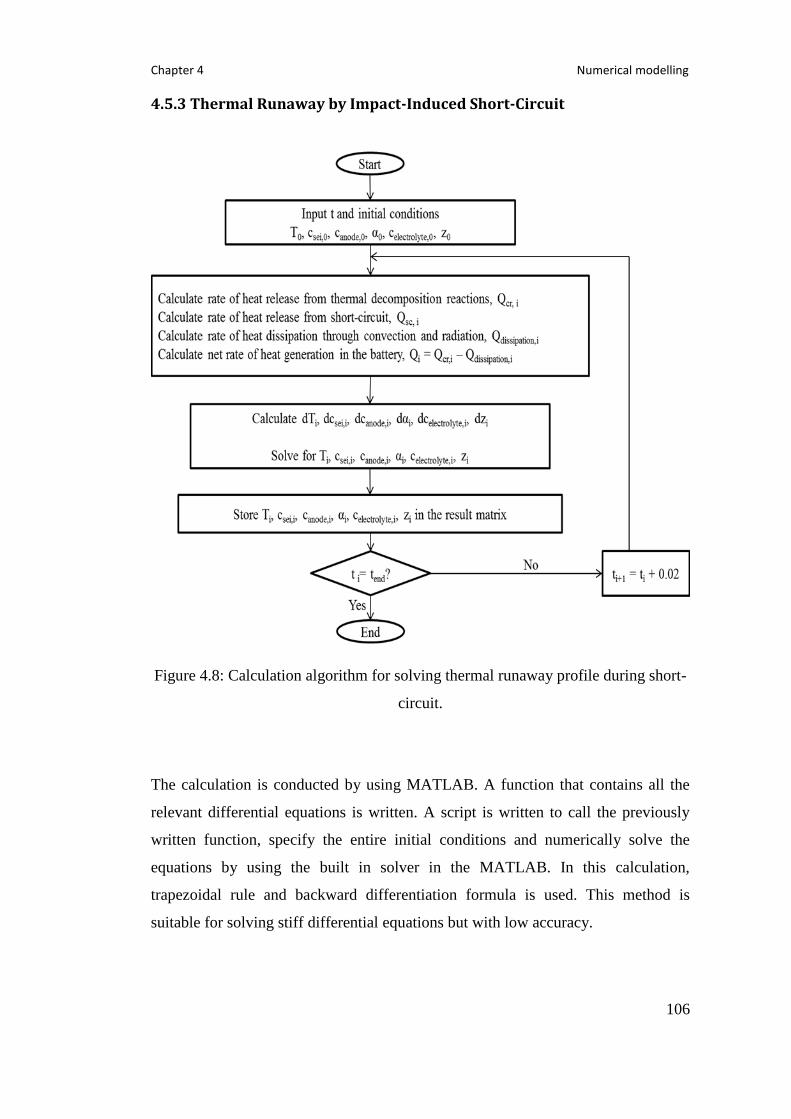
Chapter 4 Numerical modelling
106
4.5.3 Thermal Runaway by Impact-Induced Short-Circuit
Figure 4.8: Calculation algorithm for solving thermal runaway profile during short-
circuit.
The calculation is conducted by using MATLAB. A function that contains all the
relevant differential equations is written. A script is written to call the previously
written function, specify the entire initial conditions and numerically solve the
equations by using the built in solver in the MATLAB. In this calculation,
trapezoidal rule and backward differentiation formula is used. This method is
suitable for solving stiff differential equations but with low accuracy.

Chapter 4 Numerical modelling
107
4.5.4 Thermal Runaway Propagation in a Battery Module
The calculation process for the trigger cell follows the algorithm for solving thermal
runaway profile during short-circuit as summarised in Figure 4.8. For other
surrounding cells, the calculation of the temperature follows the algorithm for
solving thermal runaway profile at constant heating temperature as summarised in
Figure 4.6, but the ambient temperature is set to be at room temperature, which is
20 oC.
The calculation is conducted by using MATLAB. A function that contains all the
relevant differential equations is written. A script is written to call the previously
written function, specify the entire initial conditions and numerically solve the
equations by using the built in solver in the MATLAB. In this calculation,
trapezoidal rule is used. This method is suitable for solving stiff differential
equations but with low accuracy.

Chapter 4 Numerical modelling
108
4.6 Simulation Results and Discussion
4.6.1 Thermal Runaway at Constant High Ambient Temperature
A series of thermal abuse cases were developed at constant high ambient
temperature of 150 oC, 155
oC and 160
oC. The heat exchange processes between
the high ambient temperature and the battery occurred through convective and
radiative heat transfer modes. The simulated thermal profiles are presented in
Figure 4.9.
For low temperature thermal abuse test (150 oC), the condition did not lead to
battery thermal runaway. The battery temperature increased gradually to the
ambient temperature and no spike in temperature was observed. A small hump was
detected at 110 minutes and the battery temperature remained unchanged at ambient
temperature thereafter as the battery subsequently achieved thermal equilibrium
with the environment where the rate of heat dissipation is equal to the rate of heat
generation or supply.
At higher temperature, all the batteries suffered from thermal runaway and rapid
temperature development was recorded. The temperature of the battery increased
gradually to the ambient temperature before surged to higher than 200 oC. External
thermal energy supplied by the hot environment triggered the heat-activated
complex chemical reactions within the battery and caused the temperature to
increase. From the simulation, the peak battery temperature reached was higher at
higher ambient temperature. In addition, the battery recorded a narrower peak and a
shorter thermal runaway period at a higher ambient temperature due to the higher
rate of exothermic reactions and the associated heat release. Moreover, the battery
overshoots the ambient temperature and reaches thermal runaway at a quicker rate a
higher ambient temperature.
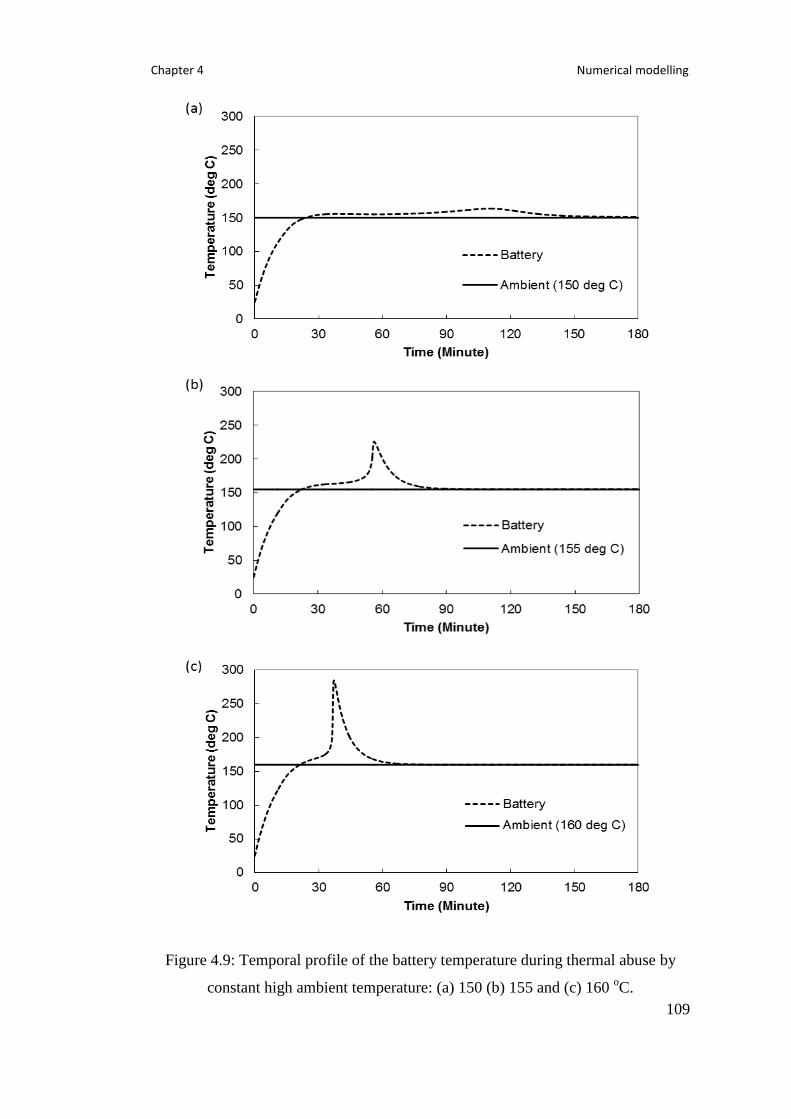
Chapter 4 Numerical modelling
109
Figure 4.9: Temporal profile of the battery temperature during thermal abuse by
constant high ambient temperature: (a) 150 (b) 155 and (c) 160 oC.

Chapter 4 Numerical modelling
110
Figure 4.10: Rate of temperature increase profiles during thermal abuse by constant
high ambient temperature.
Figure 4.10 presents the rate of temperature increase as the battery temperature
changes to decipher the heat exchange process that contributes to the battery
temperature increase. At lower temperature region prior to thermal runaway, the
rate of heat increase is curvy, demonstrating a downward trend as the temperature
increases which is due to the narrowing temperature difference between the battery
and the environment. The initial change is identical for all ambient temperatures but
the curves diverge as the temperature increases with higher rate is recorded for
higher ambient temperature. The increase in battery temperature is instigated by a
combination of self-generated heat by the reactive battery components and both
conductive and radiative heat transfer between the high temperature environment
and battery.
The point of thermal runaway is defined at the point of inflection between the
decreasing curve and projectile of temperature increase rate. As thermal runaway is
triggered, the amount of heat generated intensifies which leads to the peak of
temperature increase rate. This is subsequently followed by the decreasing rate
temperature rise until the maximum temperature is reached.

Chapter 4 Numerical modelling
111
Figure 4.11: The rate of heat generation by exothermic reactions at battery
components at ambient temperature of (a) 150 oC (b) 155
oC and (c) 160
oC.

Chapter 4 Numerical modelling
112
The total rate of heat generation due to the exothermic reactions during thermal
abuse is presented in Figure 4.11. The peak rate of heat generation increases while
the period gets shorter as the ambient temperature increases. The amount of heat
released by the chemical reactions can be obtained from area under the curve, which
is summarised in Table 4.5.
Table 4.5: Total heat release and heat release rate under thermally abusive
environments.
Temperature (oC) 150 155 160
Peak heat release rate (W) 1.3021 35.88 221.8
Total heat release (J) 5.52 x 10³ 6.24 x 10
3 7.73 x 10
3
Total heat release by SEI
reaction (J)
247.2 247.2 247.1
Total heat release by anode
reaction (J)
1.515 x 10³ 2.06 x 10
3 2.96 x 10
3
Total heat release by electrolyte
reaction (J)
0.174 69.95 663.6
Total heat release cathode
reaction (J)
3.758 x 10³ 3.86 x 10
3 3.86 x 10
3
In general, a higher abusive temperature results in higher peak heat release rate
(PHRR) and total heat release. The peak and spike in the rate of heat generation
observed is instigated by cathode breakdown. As depicted in Figure 4.8, at an
ambient temperature of 150 oC, the heat contribution by individual chemical
reactions can be detected clearly but the patterns become obscure at higher abusive
temperatures. The initial heat generation is caused by SEI breakdown, where the
amount of heat released by the reaction remains almost identical for all abusive
temperatures, followed by anode reaction and subsequently peaking by cathode
decomposition. The amount of heat liberated from cathode reaction records an
identical value at both 155 oC and 160
oC as the battery suffers from thermal
runaway. Meanwhile, the amount of heat generation by electrolyte decomposition is
initially negligible at 150 oC but escalates as the abusive temperature increases. A

Chapter 4 Numerical modelling
113
similar pattern can be observed for anode reaction but the increment is not that
abrupt.
At higher abusive temperatures that inflict thermal runaway, heat contribution by
individual chemical reactions is not apparent and difficult to distinguish due to the
domination by high rate heat generation of the cathode. To have a better illustration
and understanding on the contribution of the chemical reactions involved to thermal
runaway, the rate of heat generation for high-temperature study at 155 oC is
depicted in Figure 4.12.
Figure 4.12: (a) Total rate of heat generation by chemical reactions at abusive
temperature of 155 oC and (b) breakdown of the heat sources to its individual
reactions.

Chapter 4 Numerical modelling
114
The SEI decomposition plays an important role in thermal runaway, as this reaction
is the bottleneck to the failure. The film acts as a protective layer to prevent further
chemical reactions at the negative active material. SEI breakdown contributes the
largest amount of power generation during the initial stage of thermal runaway. At
higher temperature, cathode breakdown becomes the main heat source. The heat
contributed by electrolyte decomposition reaction is not significant in the low
temperature region but getting higher as the battery temperature increases.
The abuse temperature has a significant impact on the chemical reactions progress
during thermal runaway. Figure 4.13 illustrates the dynamic of the chemical
reaction progress at different temperatures. In general, the progress of the chemical
reactions is more energetic at higher temperatures. In all simulated cases, the SEI
decomposition reaction proceeds to completion. The same trend is observed for
cathode conversion and the reaction is approaching completion at the ambient
temperature of 150 oC.
In addition, the thermal energy supplied from 150 oC environment is not sufficient
to trigger the heat-induced high-temperature electrolyte decomposition reaction.
The reaction is fast that immediate depletion of the electrolyte concentration is
observed provided that the ambient temperature is sufficiently high. An abrupt
progress in the chemical reactions is observed in the spiking temperature region.
After the highest temperature is reached, SEI thickness and lithium content in anode
remain plateau, indicating a halt in the reaction progress.

Chapter 4 Numerical modelling
115
Figure 4.13: The progress of reaction (a) SEI (b) anode (c) electrolyte (d) cathode
and (e) secondary SEI thickness, at different abusive temperatures.

Chapter 4 Numerical modelling
116
4.6.2 Thermal Runaway at Constant Heating Rate
Thermal model for constant high ambient temperature is well reported in the
literature. In this section, we demonstrate how the modelling of chemical reactions
involved in thermal runaway can be used to simulate thermal profile of battery at
continuously changing environment. Three cases were developed at constant
thermal ramp of 1, 1.5 and 2 oC/minute up to the point where the battery
temperature exceeded the ambient temperature and the ambient temperature was
held constant thereafter. The simulated thermal profiles are presented in Figure
4.14.
In general, higher heating rate results in higher maximum temperature, less time to
overshoot the ambient temperature and higher rapid thermal runaway temperature.
The battery recorded a gradual temperature increase with widening temperature
gradient between the battery and the ambient temperature before subsequently
overshoot the ambient temperature due to the progressing local exothermic
reactions. The battery temperature soared to higher than 300 oC as thermal runaway
occurred and reduced to the ambient temperature thereafter. The battery
temperature remained unchanged at ambient temperature thereafter as the battery
subsequently achieved thermal equilibrium with the environment where the rate of
heat dissipation is equal to the rate of heat generation or supply.

Chapter 4 Numerical modelling
117
Figure 4.14: Battery temperature profile under continuously increasing ambient
temperature at the rate of (a) 1 oC/min (b) 1.5
oC/min and (c) 2
oC/min.

Chapter 4 Numerical modelling
118
Figure 4.15: Rate of temperature increase profiles during thermal abuse by constant
heating rate.
Figure 4.15 presents the rate of temperature increase as the battery temperature
changes to decipher the heat exchange process that contributes to the battery
temperature rise. At lower temperature region prior to thermal runaway, the rate of
heat increase is curvy, demonstrating an upward trend as the temperature increases
which is due to the widening temperature difference between the battery and the
environment. Higher rate of temperature increase is recorded for higher heating rate
and the curves converge as the temperature increases. The initial increase in battery
temperature is instigated by a combination of self-generated heat by the reactive
battery components and both conductive and radiative heat transfer between the
high ambient temperature and battery. In comparison to constant high ambient
temperature cases, wider projectile with higher peak is observed, reflecting higher
maximum temperature during thermal spike and rate of temperature increase
respectively.
The point of thermal runaway is defined at the point of inflection between the rising
curve and projectile of temperature increase rate. As thermal runaway is triggered,
the amount of heat generated intensifies which leads to peak of temperature increase
rate. This is subsequently followed by decreasing rate temperature rise until the
temperature spike is reached.

Chapter 4 Numerical modelling
119
Figure 4.16: The progress of reaction (a) SEI (b) anode (c) electrolyte (d) cathode
and (e) secondary SEI thickness, at varying heating rates.

Chapter 4 Numerical modelling
120
The heating rate has a significant impact on the progress of chemical reactions
during thermal runaway. Figure 4.16 illustrates the dynamic of the chemical
reaction progress at varying heating rates. In general, the progress of the chemical
reactions is more energetic at higher heating rate. In all simulated cases, all
reactions proceed to completion except for the anode and the subsequent secondary
SEI formation. An abrupt progress in the chemical reactions is observed at the
spiking temperature region where the reactions at cathode and electrolyte reach
immediate completion while anode is being consumed at a high rate.
The rate of heat generation by the chemical reactions at a heating rate of 2 oC/min is
presented in Figure 4.17 to illustrate their exothermicity nature and heat
contribution under constantly heated environment. The SEI, cathode and electrolyte
stop generating heat after the thermal spike due to the complete consumption of the
reactants, which in turn terminates the reactions entirely. The initial heat generation
is caused by SEI breakdown. The rate of heat generation by electrolyte, cathode and
anode peak at the thermal spike and the highest value is recorded by cathode. The
precipitous depletion of the electrolyte concentration during thermal runaway
entails a sharp spike in the rate of heat release. The reaction at anode continues to
release heat for a short period after the thermal spike since the thermal environment
cannot sustain the progress of the heat activated-reaction.

Chapter 4 Numerical modelling
121
Figure 4.17: The rate of heat release by (a) SEI (b) anode (c) electrolyte and (d)
cathode reactions, during thermal abuse at heating rate of 2 oC/min.

Chapter 4 Numerical modelling
122
A comparison of total rate of heat generation at varying heating rate is given in
Figure 4.18. The development in the rate of heat release is abrupt due to the
exponential behaviour of the reaction rate and the associated heat release. A glance
at the chart will only detect spike while the lower heat release rate that contribute to
the temperature change is left unseen. The spike is stretched at lower heating rate
with lower peak of heat release rate and gets narrower with higher peak as the
heating rate increases.
The amount of heat released by the chemical reactions under linearly heated
environment is summarised in Table 4.6.
Table 4.6: Total heat release and heat release rate under continuously changing
thermal environments.
Temperature increment rate
(oC/min)
1.0 1.5 2.0
Peak heat release rate (W) 289.1 680.4 1129.4
Total heat release (J) 7.83 x 10³ 8.14 x 10
3 8.27 x 10
3
Total heat release by SEI
reaction (J)
247.0 246.9 246.9
Total heat release by anode
reaction (J)
3.06 x 10³ 3.37 x 10
3 3.55 x 10
3
Total heat release by electrolyte
reaction (J)
663.5 664.1 579.5
Total heat release cathode
reaction (J)
3.85 x 10³ 3.86 x 10
3 3.90 x 10
3

Chapter 4 Numerical modelling
123
Figure 4.18: Total rate of heat generation in the battery at heating rate of (a) 1 (b)
1.5 and (c) 2 oC/min.

Chapter 4 Numerical modelling
124
4.6.3 Thermal Runaway by Impact-Induced Short-Circuit
In a literature survey by Spotnitz and Franklin (2003), it has been determined that
nail, short-circuit and crush are among the common methods used to assess abuse
tolerance of lithium-ion cells. In general, these three techniques share the same
feature. The battery releases a large amount of heat instantaneously upon failure,
which is essentially due to short-circuit. The model developed in this work, being
one-dimensional, is a rough approximation of a nail and crush test. The distribution
of the heat released from the nail penetration is treated to be instantaneous and
uniform in the plane perpendicular to the direction of nail penetration. In a real
situation, a local hotspot will form because the heat dissipation from the nail
puncture spot is not rapid. Three-dimensional modelling is necessary for better
consideration of thermal gradient within the battery geometry. In a work done by
Lamb and Orendorff (2014), the short-circuit induced by mechanical impact
instigated the peak temperature of the cylindrical LIB with LiCoO2 cathode to reach
between 99 to 662 oC. The battery energetic response to the mechanical impact
depends on the force and orientation of the impact, and the type of indentation used
in the evaluation.
Short-circuit, despite being a different mode of failure, shares some general feature
with thermal abuse behaviour. The simulated temperature profile for short-circuit is
shown in Figure 4.19. In both thermal abuse and short-circuit, two apparent stages
are observed. The surge and plunge patterns of the battery temporal behaviour due
to short-circuit are comparable to thermal abuse. However, the temperature
increment is not sharp and the temperature drop is gradual, as compared to the
thermal abuse profile.
Figure 4.20 presents the rate of temperature increase as the battery temperature
changes to decipher the heat exchange process that contributes to the battery
temperature development. In comparison to thermal abuse cases, thermal runaway
occurs straight away after the impact due to short-circuit. The initial temperature
increment is brought by the instantaneous discharge of stored chemical energy and
chemical reactions, which leads to thermal runaway. The chemical energy deposit
that supposed to be converted into electrical energy during normal operation is
descended as thermal energy instead via the Joule heating process.

Chapter 4 Numerical modelling
125
The point of inflection between the declining curve and projectile of temperature
increase rate marks the point when chemical energy becomes the dominant heat
source during thermal runaway. The rate of temperature increase intensifies at
higher temperature and plateaus at the intermediate temperature region. This is
subsequently followed by decreasing rate temperature rise until the maximum
temperature is reached.
Figure 4.19: Thermal runaway profile of a short-circuited battery.
Figure 4.20: Rate of temperature increase profile during short-circuit.

Chapter 4 Numerical modelling
126
To have a better illustration and understanding on the contribution of the chemical
reactions involved and short-circuit to thermal runaway, the rate of heat generation
of the respective sources is depicted in Figure 4.21.
Figure 4.21: (a) Total rate of heat generation, which is a sum of heat released from
short-circuit and chemical reactions (b) heat release rate by individual chemical
reactions.

Chapter 4 Numerical modelling
127
The heat generated in short-circuit case is contributed by a combination of both
electrical and chemical energy. At the low temperature region, the amount of heat
generated by chemical reactions is not significant where the initial heat generation
is dominated by short-circuit. As the battery temperature increases, the exothermic
reactions in the battery components proceed at a higher rate, which in turn enhance
the amount of heat generated and render the dominant heat source in the
intermediate temperature region.
The amount of reacting species depletes at high temperature that leads to reactions
completion. The situation reduces the amount of heat generated by chemical
reactions and makes short-circuit as the prevailing heat source at the high
temperature region. The initial heat generation by chemical reactions is dominated
by SEI breakdown. As most reactants are depleted as the battery temperature
increases, the highest heat release rate at the intermediate and high temperature
regions is contributed by the reaction at anode.
The progress of the individual reactions is presented in Figure 4.22. The intense
amount of heat generated by short-circuit induces SEI, cathode and electrolyte
reactions to completion within a short time. A sharp progress in the reactions is
observed as the battery reaches peak temperature, which leads to completion of
electrolyte and cathode reactions. SEI decomposition completes earlier since this
reaction is the bottleneck to thermal runaway. After the highest temperature is
reached, secondary SEI thickness and lithium content in anode remained plateau,
indicating a halt in the reaction progress.
Figure 4.23 presents the total rate of heat release during short-circuit. A spike is
observed as the battery temperature is sufficiently high to induce the heat-activated
chemical reactions in the battery components. The rate reduces dramatically after
complete depletion of most reacting species. Table 4.7 summaries the amount of
heat released by chemical reactions and the rapid discharge of electrical energy into
heat during short-circuit.

Chapter 4 Numerical modelling
128
Figure 4.22: The progress of reaction (a) SEI (b) anode (c) electrolyte (d) cathode
and (e) secondary SEI thickness, during short-circuit.
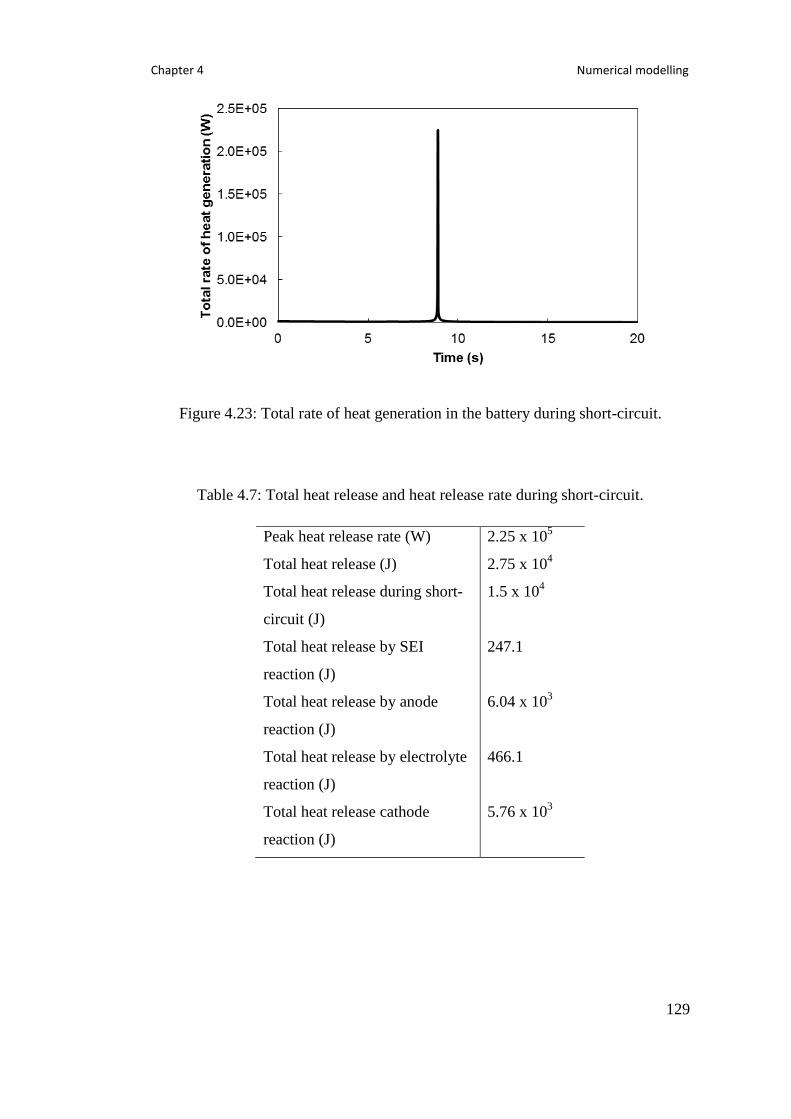
Chapter 4 Numerical modelling
129
Figure 4.23: Total rate of heat generation in the battery during short-circuit.
Table 4.7: Total heat release and heat release rate during short-circuit.
Peak heat release rate (W) 2.25 x 10⁵
Total heat release (J) 2.75 x 10⁴
Total heat release during short-
circuit (J)
1.5 x 10⁴
Total heat release by SEI
reaction (J)
247.1
Total heat release by anode
reaction (J)
6.04 x 10³
Total heat release by electrolyte
reaction (J)
466.1
Total heat release cathode
reaction (J)
5.76 x 10³

Chapter 4 Numerical modelling
130
4.6.4 Thermal Runaway Propagation in a Battery Module
The model in Section 4.6.3 was further expanded to include heat transfer modelling
in order to investigate the propagation of thermal runaway in a battery module with
3x3 matrix configuration consisted of 9 cylindrical cells. Two thermal runaway
propagation situations were developed at different positions of initial failure and the
severity of the associated thermal hazard was compared. The cases were developed
based on the assumption that the thermal runaway propagated from the initiated cell
to the other surrounding cells by heat transfer. The effect of electrical connector that
provides electrical pathway, which in turn might affect the propagation of thermal
runaway in the whole module, was not considered.
4.6.4.1 Initiation of Thermal Runaway in the Middle Cell
In the first case, thermal runaway was assumed to be initiated by impact-induced
short-circuit in Cell 5. The position of the failure initiation is marked in red, as
illustrated in Figure 4.24.
Figure 4.24: Thermal runaway initiation in the middle cell of the battery module.
The temperature development of the cells in the battery module is shown in Figure
4.25. Due to the symmetric nature of the 3x3 matrix configuration, all cells located
at diagonals of the initiated cell, which are Cell 1, 3, 7 and 9, recorded the same
temperature profile. In addition, identical temperature profiles can be observed for
all cells directly adjacent to the initiated cell, which are Cell 2, 4, 6 and 8.

Chapter 4 Numerical modelling
131
Figure 4.25: Temperature change of cells in the battery module.
The rapid heat release in the battery caused by short-circuit inflicts the temperature
of Cell 5 to soar up to 500 oC. In general, all neighbouring cells recorded a
temperature rise up to 100 oC. The close proximity and better surface contact of the
directly adjacent cells (Cell 2, 4, 6 and 8) to the initiated cell caused the temperature
to increase at a faster rate and reach a slightly higher peak compared to the cells
located at the diagonals (Cell 1, 3, 7 and 9) of the battery module. All cells
demonstrated an identical cooling profile after approximately 5 minutes of the
failure initiation in Cell 5. The rise of temperature in the surrounding cells could be
instigated by the heat transfer process from Cell 5, which might in turn induced the
heat-activated exothermic reactions in the neighbouring batteries.
In order to inspect whether the heat transfer process from the defective cell
managed to activate the exothermic reactions in the neighbouring cells, the progress
of the reactions in all cells is shown in Figure 4.26 and Figure 4.27. Due to the slow
progress of reactions in other cells compared to Cell 5, which might be difficult to
notice, the information is presented in two separate figures.

Chapter 4 Numerical modelling
132
Figure 4.26: The progress of reaction (a) SEI (b) anode (c) electrolyte (d) cathode
and (e) secondary SEI thickness, in Cell 5.

Chapter 4 Numerical modelling
133
Figure 4.27: The progress of reaction (a) SEI (b) anode (c) electrolyte (d) cathode
and (e) secondary SEI thickness, in all other cells in the battery module.

Chapter 4 Numerical modelling
134
The pattern of reaction progress in Cell 5 is almost identical as observed in Section
4.6.3 due to the same method of failure initiation. The reactions in cathode,
electrolyte and SEI are driven to completion in a short time span by the big amount
of heat generated from short-circuit. The insufficient amount of heat after the peak
temperature causes the reaction in anode and the subsequent secondary SEI layer
film formation to cease.
In general, for all other cells in the battery module, the chemical reactions recorded
a sluggish progress. A faster reaction progress can be observed for cells directly
adjacent to the Cell 5. No reaction occurred at electrolyte since the reaction is a high
temperature reaction. The progress of reactions in all neighbouring cells appears to
be insignificant, implying the absence of thermal runaway and the temperature rise
in the neighbouring cells is utterly caused by heat transfer from Cell 5.
Figure 4.28: Rate of heat generation in the battery module.
Figure 4.28 presents the total rate of heat release in the battery module, indicating a
peak of 167.1 kW. The heat generated in the module is sourced from a combination
of both short-circuit and chemical reactions. A spike is observed as the battery
temperature is sufficiently high to induce the heat-activated chemical reactions in
the battery components. The rate reduces subsequently after complete depletion of

Chapter 4 Numerical modelling
135
most reacting species. The total amount of heat liberated by this case, as calculated
from the integration of the curve is determined to be 24.5 kJ.
4.6.4.2 Initiation of Thermal Runaway in Cell 1
In the second case, thermal runaway was assumed to be initiated by impact-induced
short-circuit in Cell 1. The position of the failure initiation is marked in red, as
illustrated in Figure 4.29.
Figure 4.29: Thermal runaway initiation in the first cell of the battery module.
The temperature development of the cells in the battery module is shown in Figure
4.30. Due to the symmetric nature of the 3x3-matrix configuration, the following
cells would have an identical temperature profile:
(a) Cell 2 and Cell 4
(b) Cell 3 and Cell 7
(c) Cell 6 and Cell 8

Chapter 4 Numerical modelling
136
Figure 4.30: Temperature of cells in the battery module.
The rapid release of heat originating from conversion of electrical energy into
thermal energy during short-circuit caused the temperature of Cell 1 to soar up to
higher than 500 oC. In general, all neighbouring cells recorded a temperature rise up
to 100 oC. Compared to all other neighbouring cells in the module, Cell 2 and Cell 4
recorded a higher and faster temperature development due to their relative position
being directly adjacent to the defective cell. The temperature of all cells converged
after approximately 13 minutes and exhibited a similar cooling profile. The rise of
temperature in the surrounding cells could be instigated by the heat transfer process
from Cell 1, which might in turn induced the heat-activated exothermic reactions in
the neighbouring batteries. The progress of the reactions in all cells is shown in
Figure 4.31 and Figure 4.32.

Chapter 4 Numerical modelling
137
Figure 4.31: The progress of reaction (a) SEI (b) anode (c) electrolyte (d) cathode
and (e) secondary SEI thickness, in Cell 1.

Chapter 4 Numerical modelling
138
Figure 4.32: The progress of reaction (a) SEI (b) anode (c) electrolyte (d) cathode
and (e) secondary SEI thickness, in all other cells in the battery module.

Chapter 4 Numerical modelling
139
The pattern of reaction progress in Cell 1 is almost identical as observed in Section
4.6.3 and 4.6.4.2 due to the same method of failure initiation. The reactions in
cathode, electrolyte and SEI are driven to completion in a short time span by the big
amount of heat generated from short-circuit. Heat deficiency after the peak
temperature retards the reaction in anode and the subsequent secondary SEI layer
film formation.
In general, for all other cells in the battery module, the chemical reactions recorded
a sluggish progress. A faster reaction progress can be observed for cells directly
adjacent to the Cell 1. No reaction occurred at electrolyte since the reaction is a high
temperature reaction. The heat transferred from the defective cell to the surrounding
cells was not sufficient to induce thermal runaway propagation in the entire module.
Figure 4.33 presents the total rate of heat release in the battery module, with a peak
of 211.9 kW. The total amount of heat liberated by this case, as calculated from the
integration of the curve is determined to be 25.8 kJ.
Figure 4.33: Total rate of heat generation in the battery module.

Chapter 4 Numerical modelling
140
4.6.4.3 Discussion on the Effect of Thermal Runaway Initiation Location on
Thermal Runaway Propagation
Two cases were developed where the effect of the location of failure initiation on
thermal runaway propagation was investigated. In general, the simulated thermal
behaviour of the battery module is qualitatively in agreement with the simulation
work of Kim and Pesaran (2007) and experimental work of Wilke et al. (2017).
In both cases, thermal runaway propagation was not observed. Limited contact
surface area retards the heat transfer process and deters the propagation of thermal
runaway to the neighbouring cells. The small size of the cylindrical cells entails
high surface area-to-volume ratio that promotes heat dissipation to the surrounding
and prevents heat accumulation within the battery. A battery module consists of 9
cylindrical cells with 3x3 matrix configuration is a conductive thermal network. As
a result, the initiation of failure in the centre of the module (Cell 5) results in less
severe thermal runaway. The heat is conducted away from the defective cell
through the thermal network and is being distributed evenly within the module. This
situation in turn reduces the maximum rate of heat release and the subsequent peak
temperature with delayed thermal runaway time.
In case where the failure was initiated in the edge (Cell 1), the defective cell
recorded a higher and earlier peak rate of heat release and the ensuing temperature.
Heat transfer by convection from the defective cell to the surrounding is not
vigorous compared to conduction, which consequently slows down the heat
dissipation process.

Chapter 4 Numerical modelling
141
4.7 Summary A numerical model was developed by combining thermal decomposition kinetics of
battery components to simulate thermal runaway behaviour of high-capacity
lithium-ion battery during thermal abuse and short-circuits. In addition, the model
was further expanded to include heat transfer modelling to simulate thermal
runaway propagation in a battery module.
From the modelling work, the findings are summarised as follow.
1. The modelling of thermal decomposition kinetics of battery components
enables comprehensive understanding of relative contribution of the battery
components towards thermal runaway.
2. Cathode reaction has been identified as the most reactive reaction during
thermal runaway.
3. The consequence of battery thermal runaway is more severe at higher
ambient temperature and higher heating rate. The situation is indicated by
maximum temperature rise during thermal runaway.
4. The battery is more inclined towards thermal runaway at higher temperature
and higher heating rate. The situation is indicated by thermal runaway
induction time and time taken for the battery to overshoot ambient
temperature.
5. Under thermally abusive environments, for both constant high ambient
temperature and constant heating rate cases, thermal runaway does not occur
instantaneously. Considerable amount of time is necessary to induce thermal
runaway in the battery.
6. Impact-induced short-circuit, on the other hand, inflicts an immediate failure
which in turn results in surge of the battery temperature.
7. A higher peak heat release rate is observed during short-circuit due to the
combination of electrical and chemical energy that contributes to total
thermal hazard.
8. For a battery module consists of 9 cylindrical 18650 cells, thermal runaway
does not propagate. The small contact surface for the cylindrical geometry
deters the heat transfer from the defective cell to the neighbouring cells.

Chapter 5 Experimental characterisation of lithium-ion battery thermal runaway
142
Chapter 5: Experimental Characterisation of
Lithium-ion Battery Thermal Runaway
Numerical modelling of battery thermal runaway has been discussed in Chapter 4.
Battery thermal runaway under abusive conditions has been simulated by modelling
thermal decomposition kinetics of the reactions involved. A further inclusion of
heat transfer modelling in the numerical model allows the simulation of thermal
runaway propagation in the battery module. This chapter details the experimental
works done to validate and support the data obtained from numerical modelling.
5.1 Materials The batteries used in the experimental work, as shown in Figure 5.1, are cylindrical
with 18 mm diameter and 65 mm high. The specifications of the battery are
presented in Table 5.1. Nickel strips of 8 mm wide and 1 mm thick are used to
provide electrical connection, soldered at the terminals by SUNKO 788H spot
welder.
Figure 5.1: 18650 cylindrical lithium-ion cell used in the experimental work.

Chapter 5 Experimental characterisation of lithium-ion battery thermal runaway
143
Table 5.1: Battery specifications.
Specification Value
Form Factor Cylindrical 18650
Mass (g) 48
Rated capacity (Ah) 2.5
Nominal voltage (V) 3.7
Maximum voltage (V) 4.2
Minimum voltage (V) 2.8
Cathode Lithium cobalt oxide
Anode Graphite
5.2 Experimental Programme Four experimental programmes were conducted. First, the link between the battery
charge state and voltage was established. Second, battery thermal runaway under
non-adiabatic condition was characterised. Third, the features of thermal runaway
under adiabatic condition were investigated. Four, thermal runaway behaviour
during impact-induced short-circuit was explored.
5.2.1 Experimental Characterisation of Battery Discharge Curve
In the subsequent experimental programmes, the effects of state of charge on the
severity of thermal runaway hazard are investigated. This initial work aims to
establish the connection between the state of charge and the voltage of the cell. The
state of charge is an expression of the present battery capacity as a percentage of
maximum capacity, which cannot be measured instantaneously. Even though the
capacity is proportionate to the battery voltage, the relationship is not linear. The
discharge curve, which is a plot of voltage versus capacity, can serve as a guide to
determine the state of charge at any particular voltage and vice versa.

Chapter 5 Experimental characterisation of lithium-ion battery thermal runaway
144
5.2.1.1 Experimental Rig
The evaluation of the battery capacity was conducted by using fully automated and
computerised MACCOR Series 4000. The testing equipment consists of a test
cabinet, PC computer and test software. The test programme was coded using
BuildTest software and the outcome was processed using MIMSClient. The
equipment is shown in Figure 5.2.
Figure 5.2: Maccor Series 4000.
5.2.1.2 Experimental Procedures
The cell was left to rest for 6 hours to keep the temperature stabilised in the test
cabinet prior to the cycling process. At the beginning of the cycling process, the
battery was charged under constant current mode where the current was maintained
at 1.25 A until the cell reached 4.2 V. Next, the cell was charged under constant
voltage mode where the voltage was maintained at 4.2 V. After the completion of
the charging process, the cell was discharged under constant current mode where
the current was maintained at 1.25 A until the cell voltage dropped to 2.85 V.
Lastly, the charging process was repeated once again. The current profile during the
test procedures is presented in Figure 5.3.

Chapter 5 Experimental characterisation of lithium-ion battery thermal runaway
145
Figure 5.3: Current profile at different stages of test procedures.
5.2.2 Experimental Characterisation of Battery Thermal Runaway Using
Oven Heating
This work aims to characterise battery thermal runaway under non-adiabatic and
constant pressure conditions. Thermal runaway was induced by heating the battery
from room temperature in an oven up to a preset temperature of 190 oC. The effects
of varying battery mass and capacity on the severity of thermal runaway were
examined.
5.2.2.1 Experimental Rig
Oven
Under non-adiabatic condition, the tests were conducted in a natural convection
DRY-Line oven Model DL 53 supplied by VWR Collection. The oven is equipped
with an electronic control with a maximum preset operational temperature of 220
oC. The built-in oven temperature measurement has an accuracy of ±1
oC. The
chamber of the oven is rectangular; holding a volume of 53 L with dimensions of
401 mm x 330 mm x 401 mm.

Chapter 5 Experimental characterisation of lithium-ion battery thermal runaway
146
Sample Containment
The battery was contained inside two 100 ml oval flat-based ceramic pots and
placed inside a lid-covered stainless steel holder. This dual-layer sample holder was
necessary to contain any release from the battery from staining or damaging the
oven chamber. The thermal and chemical resistant ceramic pot is 2.1 mm thick with
55 mm high and top opening of 60 mm. The stainless steel holder is a hollow
cylinder with 70 mm diameter, 3 mm thick and 116 mm high, welded on the centre
of a solid steel cylinder with 166.4 mm diameter and 21.1 mm high.
The top of the cylinder was covered with a steel sheet with dimensions of 135 mm x
105 mm x 1.5 mm, and overlaid with a 722 g mild steel cylinder on top. The whole
sample containment was not completely sealed where the gases released throughout
the experimental procedures could escape and preventing pressure build up,
therefore this experimental arrangement can be classified as a constant pressure
system. The experimental setup and thermocouple position is shown in Figure 5.4.
Figure 5.4: Schematic of the oven test experimental arrangement and thermocouple
location.

Chapter 5 Experimental characterisation of lithium-ion battery thermal runaway
147
Temperature Measurement
For measuring the temperature, type-K Inconel sheathed thermocouples were used.
The data was recorded at a frequency of 1 Hz with a resolution of ±0.001 oC by
using Microlink 751 data logging interface and Windmill data acquisition software.
Five thermocouples were used in this experiment to measure the temperature at five
different points. Three thermocouples, T1, T2 and T3 were positioned inside the
ceramic pots to measure the temperature around the battery. Two thermocouples
were placed outside the cylindrical steel holder to record the temperature of oven
air, T4 and steel holder base, T5. The description of the thermocouple positions is
given in Table 5.2.
Table 5.2: Arrangement of the thermocouples during oven tests.
Thermocouple Description
T1 Battery positive terminal and vent
T2 Middle of the battery canister where reactive
electrodes and flammable electrolytes are
hosted
T3 Battery negative terminal
T4 Oven air temperature
T5 Sample container
5.2.2.2 Experimental Procedures
After complete placement of the battery and the thermocouples inside the oven
chamber, the oven was heated from room temperature to 190 oC, a sufficiently high
temperature for effective induction of thermal runaway. The oven was turned off
and the data logging was stopped after all temperature readings stabilised after the
completion of thermal runaway reactions. The details of the test programme and
battery conditions are given in Table 5.3.

Chapter 5 Experimental characterisation of lithium-ion battery thermal runaway
148
Table 5.3: Oven test experimental conditions.
Test Description State
of
charge
Number
of
battery
Total
capacity
(Ah)
Total
voltage
(V)
Total
mass
(g)
1 Full-charged single
cell
100 1 2.50 4.19 48
2 Two unconnected
full-charged cells
100 2 2.50 4.19 96
3 Two full-charged
cells connected in
parallel
100 2 5.00 4.23 96
4 Half-charged single
cell
50 1 1.25 3.74 48
5 Zero-charged single
cell
0 1 0 3.21 48
5.2.3 Experimental Characterisation of Battery Thermal Runaway Using
Accelerating Rate Calorimeter
This work aims to characterise battery thermal runaway under adiabatic and
constant volume conditions. Thermal runaway was induced in the battery by using
Accelerating Rate Calorimeter under Heat-Wait-Seek mode. The effects of varying
battery mass and capacity on the severity of thermal runaway were examined.
5.2.3.1 Experimental Rig
The evaluation of battery thermal hazard under adiabatic condition was conducted
using Extended Volume+ Accelerating Rate Calorimeter provided by Thermal
Hazard Technology. The testing equipment consists of a cylindrically-hollowed
rectangular chamber confined within a containment vessel, desktop computer and
computer software. The test programme was initialised using ARC-ES software and
the outcome was processed using ARCCAL PLUS (Thermal Hazard Technology,
2013).
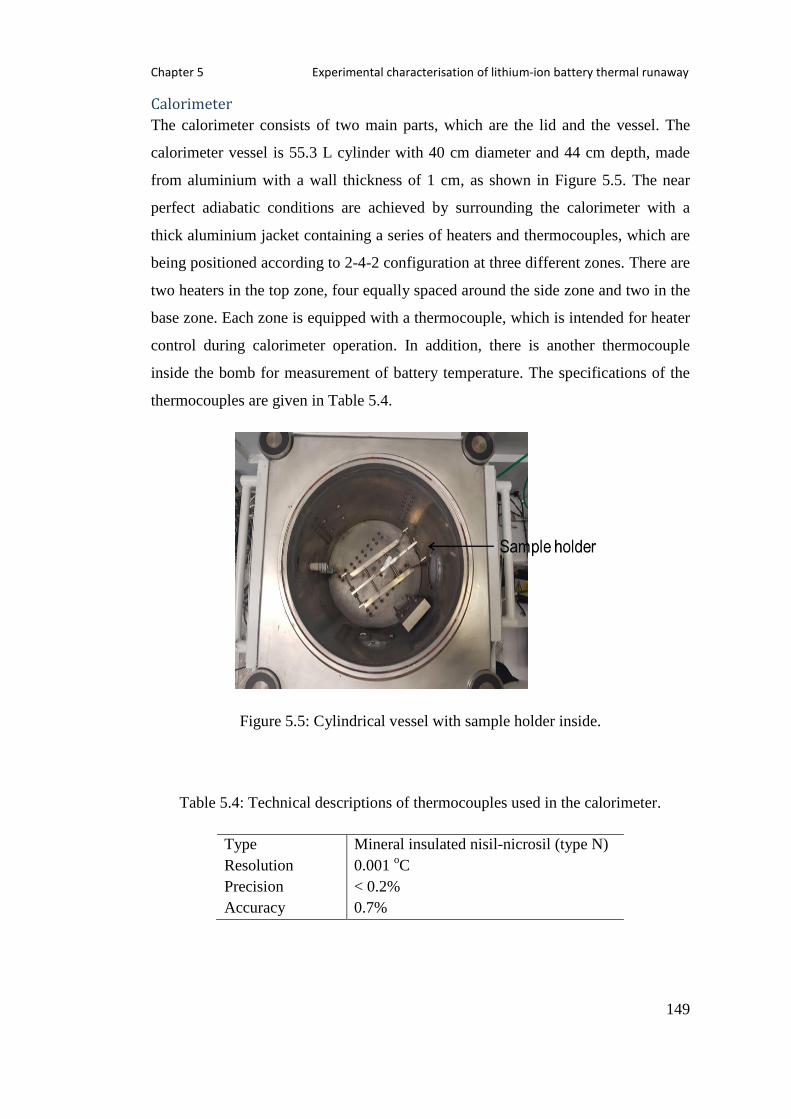
Chapter 5 Experimental characterisation of lithium-ion battery thermal runaway
149
Calorimeter
The calorimeter consists of two main parts, which are the lid and the vessel. The
calorimeter vessel is 55.3 L cylinder with 40 cm diameter and 44 cm depth, made
from aluminium with a wall thickness of 1 cm, as shown in Figure 5.5. The near
perfect adiabatic conditions are achieved by surrounding the calorimeter with a
thick aluminium jacket containing a series of heaters and thermocouples, which are
being positioned according to 2-4-2 configuration at three different zones. There are
two heaters in the top zone, four equally spaced around the side zone and two in the
base zone. Each zone is equipped with a thermocouple, which is intended for heater
control during calorimeter operation. In addition, there is another thermocouple
inside the bomb for measurement of battery temperature. The specifications of the
thermocouples are given in Table 5.4.
Figure 5.5: Cylindrical vessel with sample holder inside.
Table 5.4: Technical descriptions of thermocouples used in the calorimeter.
Type Mineral insulated nisil-nicrosil (type N)
Resolution 0.001 oC
Precision < 0.2%
Accuracy 0.7%

Chapter 5 Experimental characterisation of lithium-ion battery thermal runaway
150
In order to provide additional protection from flying shrapnel and open flames in
the event of fire and explosion, the calorimeter is further placed inside a
containment vessel. The steel blast box is 5 mm thick with dimensions of 163 cm x
113 cm x 105 cm. The blast box is equipped with a pair of lids on the top and a pair
of doors at the side, as shown in Figure 5.6. During the calorimeter operation, the
lids are electronically locked. Besides that, the doors and the lids are mechanically
locked using steel rods as part of additional safety features.
Figure 5.6: Blast box of the EV+ ARC.
A solenoid valve is installed at the back of the blast box. This valve controls the
compressed air flow during the gas purge and cooling procedure. In addition, there
is a vent at the side of the blast box, which is connected to the extraction system.
The opening of motorised flap during the gas extraction allows air from the lab to
flow into the blast box and assists the gas purging.
Sample Suspension
The heating process during the operation increases the temperature of the
calorimeter to some extent. In order to prevent the calorimeter surfaces from
conducting heat directly to the battery and interfere with the heating process, the
battery is thermally isolated from any direct contact with the calorimeter base and
sidewalls. An aluminium frame is used where the battery is suspended by using
glass fibre tape. The arrangement of the battery for the ARC test is shown in Figure
5.7.

Chapter 5 Experimental characterisation of lithium-ion battery thermal runaway
151
Figure 5.7: Battery with thermocouple attached being suspended in the aluminium
frame for the test.
5.2.3.2 Experimental Procedures: Heat-Wait-Seek Method
The experiment was conducted under the Heat-Wait-Seek (HWS) mode. The
battery was initially heated from the room temperature to the specified start
temperature, followed by the first waiting period. The temperature of the bomb and
the jacket heaters would reach thermal equilibrium and temperature difference
between the two would reach zero during the waiting period. After stable adiabatic
thermal environment was achieved, the calorimeter proceeded into the seek mode.
During this period, the rate of temperature change was calculated and compared
with the predetermined temperature rate sensitivity. If the rate of temperature
change, also known as the self-heating rate exceeded the threshold temperature rate
sensitivity during the seek period, the calorimeter would proceed into exotherm
mode. Otherwise, the heating process would continue to increase the battery
temperature with the predetermined temperature increment followed by another
waiting and searching sessions. The HWS procedure was repeated according to the
test programme until the self-heating rate reached the threshold temperature rate
sensitivity or the test programme was terminated as the end temperature was
reached. The cooling system was subsequently activated upon completion of the test
programme.

Chapter 5 Experimental characterisation of lithium-ion battery thermal runaway
152
The summary of the test procedures is illustrated in Figure 5.8. The setup for test
initialisation is summarised in Table 5.5. The details of the test programme and
battery conditions are given in Table 5.6.
Figure 5.8: Algorithm of the ARC operation under Heat-Wait-Search mode.
Table 5.5: ARC setting.
Start Temperature (oC) 50
End Temperature (oC) 315
Temperature Step (oC) 5
Temperature Rate Sensitivity (oC/minute) 0.02
Waiting Time (Minute) 60
Driver Heater Power (%) 20
Table 5.6: ARC test experimental conditions.
Test Description State
of
charge
(%)
Number
of
battery
Total
capacity
(Ah)
Total
voltage
(V)
Total
mass
(g)
1 Full-charged single cell 100 1 2.50 4.18 48
2 Two unconnected full-
charged cells
100 2 2.50 4.23 96
3 Half-charged single cell 50 1 1.25 3.69 48
4 Zero-charged single cell 0 1 0 3.23 48

Chapter 5 Experimental characterisation of lithium-ion battery thermal runaway
153
5.2.4 Experimental Characterisation of Impact-Induced Battery Thermal
Runaway
This work aims to characterise thermal runaway initiated by impact induction
method at ambient temperature. The effect of heat transfer in promoting thermal
runaway propagation in a battery module with a 3x3-matrix configuration was
investigated.
5.2.4.1 Experimental Rig
In this destructive test, high tensile rod is used to indent through the battery positive
terminal where the safety vent is located. The intrusion of the rod into the battery
canister causes both electrodes to collide with each other and consequently induces
internal short-circuit. The schematic of the experimental rig for the impact tests is
shown in Figure 5.9.
Figure 5.9: Schematic of the impact test experimental setup.

Chapter 5 Experimental characterisation of lithium-ion battery thermal runaway
154
The high tensile rod for the indentation is 28 mm long with 4 mm diameter,
produced by turning a high tensile grade 8.8 stainless steel bolt with an initial
diameter of 5 mm in a lathe machine. The cylinder where the rod is mounted has a
diameter of 51 mm and a length of 200 mm, made from mild steel. The steel
cylinder is welded to two linear motion bearings that are installed to two steel rods,
suspended at a high position by a string in the hook on top of the cylinder. As the
trigger string is pulled, the heavy cylinder will slide off the steel rods and indent the
battery with the mounted rod, triggering a short-circuit.
Sample Assembly
Tested batteries are held in place and gripped together with two adjustable steel
fixtures to form the 3x3-matrix assembly. The battery assembly is further secured
on a base made from Macor, a machinable thermal resistant glass-ceramic and
bolted on the experimental rig base, as shown in Figure 5.10.
Since the steel fixtures and the sample base are designed to grip 9 identical
cylindrical batteries, the single battery sample is assembled by positioning the
battery in the middle of the 3x3-matrix and surrounded with hollow steel cylinders
with identical dimensions to provide the necessary grip in the steel fixtures and
Macor base. During the pack test, all hollow steel cylinders are replaced with
batteries.
Figure 5.10: The assembly for destructive impact test of single battery.

Chapter 5 Experimental characterisation of lithium-ion battery thermal runaway
155
Temperature Measurement
All temperature measurements were conducted by using type-K Inconel sheathed
thermocouples. The data was recorded at a frequency of 1 Hz with a resolution of
±0.001 oC by using Microlink 751 data logging interface and Windmill data
acquisition software. The thermocouples were placed at the interstitial spaces in the
3x3-matrix assembly to avoid from obstructing the indentation during impact.
The coordinate of the thermocouples for single battery test is given in Table 5.7 and
illustrated in Figure 5.11. For the battery pack test, the coordinate of the
thermocouples is given in Table 5.8 and illustrated in Figure 5.12. Note that the
letter ‘D’ in the aforementioned tables and figures represents battery diameter.
Table 5.7: Coordinate of thermocouples for single battery test.
Thermocouple Position
T1 (2D, D)
T2 (D,D)
T3 (D, 2D)
T4 (2D, 2D)
Figure 5.11: Arrangement of thermocouples for the single battery test. The grey
circles represent hollow steel cylinders.

Chapter 5 Experimental characterisation of lithium-ion battery thermal runaway
156
Table 5.8: Coordinate of thermocouples for 9-cells test.
Thermocouple Position
T1 (2D, D)
T2 (D,D)
T3 (D, 2D)
T4 (2D, 2D)
T5 (0, D)
T6 (0, 2D)
Figure 5.12: Arrangement of thermocouples for the 9-cells battery module test.
Thermal runaway is induced in the middle battery as marked in red.
Visual Recording
Panasonic AG-AC90 Camcorder was used to record the experimental programme at
50 frames per second.
Thermal Imaging
FLIR SC650 thermal imaging camera was used to measure thermography of the
batteries during destructive impact tests at a frequency of 30 Hz.

Chapter 5 Experimental characterisation of lithium-ion battery thermal runaway
157
5.2.4.2 Experimental Procedures
Once the battery assembly is bolted in the test rig and the thermocouples are
secured in the intended positions, the trigger string is pulled. Temperature
measurement and visual recording are stopped once the flame extinguishes. The
details of the test programme and battery conditions for impact tests are given in
Table 5.9.
Table 5.9: Destructive impact test experimental conditions.
Test Description Number
of
battery
State of
charge
Capacity
(Ah)
Voltage
1 Full-charged single cell 1 100 2.50 4.2
2 Full-charged single cell 1 100 2.50 4.2
3 Nine full-charged cells
packed together in a
3x3 matrix assembly
9 100 2.50 4.2

Chapter 5 Experimental characterisation of lithium-ion battery thermal runaway
158
5.3 Results and Discussion
5.3.1 Results of Characterisation of Battery Discharge Curve
The battery voltage during the charge and discharge procedures is shown in Figure
5.13. The cell discharge curve is depicted in Figure 5.14.
Figure 5.13: Cell voltage at different stages of test procedures.
Figure 5.14: Voltage-capacity curve during discharge cycle.
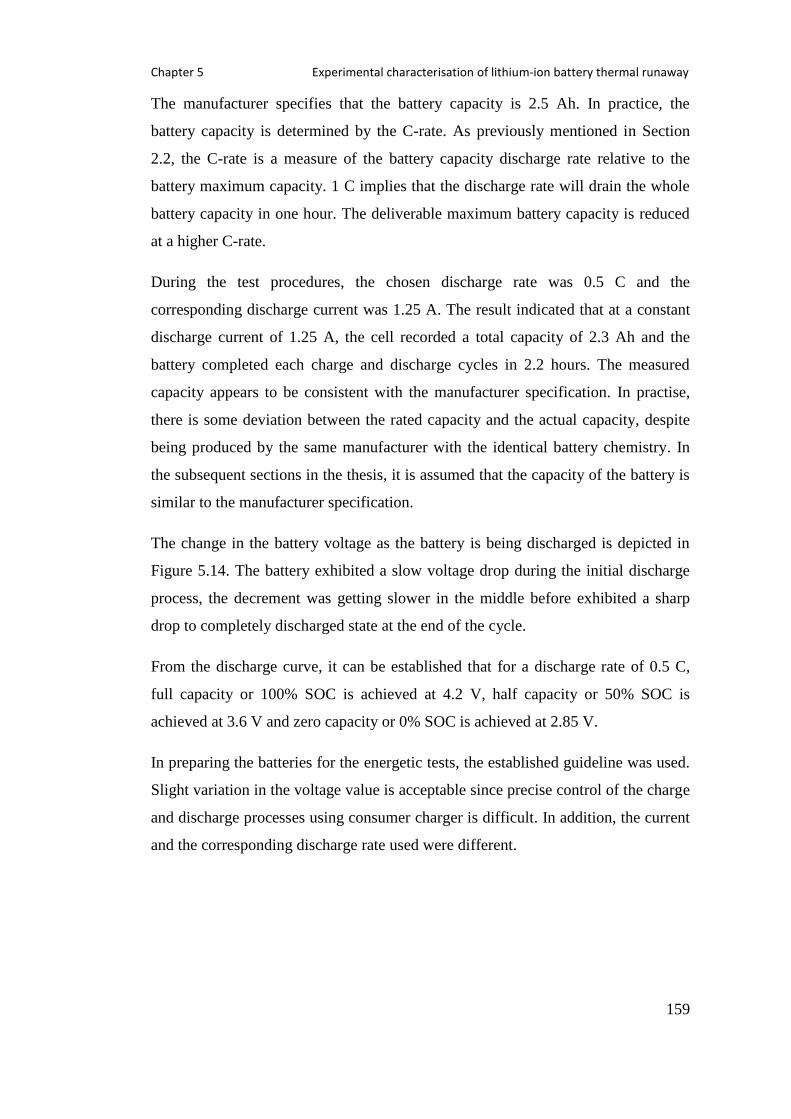
Chapter 5 Experimental characterisation of lithium-ion battery thermal runaway
159
The manufacturer specifies that the battery capacity is 2.5 Ah. In practice, the
battery capacity is determined by the C-rate. As previously mentioned in Section
2.2, the C-rate is a measure of the battery capacity discharge rate relative to the
battery maximum capacity. 1 C implies that the discharge rate will drain the whole
battery capacity in one hour. The deliverable maximum battery capacity is reduced
at a higher C-rate.
During the test procedures, the chosen discharge rate was 0.5 C and the
corresponding discharge current was 1.25 A. The result indicated that at a constant
discharge current of 1.25 A, the cell recorded a total capacity of 2.3 Ah and the
battery completed each charge and discharge cycles in 2.2 hours. The measured
capacity appears to be consistent with the manufacturer specification. In practise,
there is some deviation between the rated capacity and the actual capacity, despite
being produced by the same manufacturer with the identical battery chemistry. In
the subsequent sections in the thesis, it is assumed that the capacity of the battery is
similar to the manufacturer specification.
The change in the battery voltage as the battery is being discharged is depicted in
Figure 5.14. The battery exhibited a slow voltage drop during the initial discharge
process, the decrement was getting slower in the middle before exhibited a sharp
drop to completely discharged state at the end of the cycle.
From the discharge curve, it can be established that for a discharge rate of 0.5 C,
full capacity or 100% SOC is achieved at 4.2 V, half capacity or 50% SOC is
achieved at 3.6 V and zero capacity or 0% SOC is achieved at 2.85 V.
In preparing the batteries for the energetic tests, the established guideline was used.
Slight variation in the voltage value is acceptable since precise control of the charge
and discharge processes using consumer charger is difficult. In addition, the current
and the corresponding discharge rate used were different.

Chapter 5 Experimental characterisation of lithium-ion battery thermal runaway
160
5.3.2 Results of Battery Thermal Runaway Characterisation Using Oven
5.3.2.1 Results of Oven Test 1 for Full-Charged Single Cell
In this test, thermal runaway of a single battery at 100% SOC was characterised.
Under full-charged condition, the capacity and the voltage of the battery were 2.5
Ah and 4.19 V respectively. The findings are shown in Figure 5.15.
The oven air reached the preset temperature of 190 oC after 53 minutes and
subsequently increased to and remained at 195 oC thereafter. The presence of the
steel cylinder and ceramic pots around the battery provided a significant heat
transfer resistance for battery heating. The rise of battery temperature inside the
ceramic pot was delayed by 74 minutes and reached 182 oC after 127 minute. This
situation was subsequently followed by a violent thermal runaway, instigating
battery temperature inside the ceramic pots to spike to 738 oC. A close-up analysis
of temperature measurement around the battery showed that the highest temperature
was recorded at the battery central body, indicating that the chemical reactions are
the most intense at that particular position.
The intense heat release by battery thermal runaway was also detected outside the
steel holder as both thermocouples located outside recorded a soar in temperature to
higher than 200 oC. After the completion of thermal runaway reactions, the
temperature of the battery inside the ceramic pots reduced to the oven air
temperature and remained unchanged thereafter as the battery subsequently
achieved thermal equilibrium with the environment where the rate of heat
dissipation is equal to the rate of heat generation or supply.

Chapter 5 Experimental characterisation of lithium-ion battery thermal runaway
161
Figure 5.15: Temperature profiles from oven heating of a single full-charged
battery.

Chapter 5 Experimental characterisation of lithium-ion battery thermal runaway
162
Figure 5.16: Remnant of single full-charged battery after the oven test.
Figure 5.16 shows the aftermath of battery thermal runaway at 100% SOC. From
inspection of the residues, it can be seen that the mechanical integrity of the cell
canister remained intact. However, safety vent equipped on top of the canister was
detached which might be due to violent expulsion of battery contents. The sight of
aluminium current collector ash and the presence of unburnt copper current
collector in the residues indicated that the battery internal temperature reached a
point higher than 659 oC, which is the aluminium melting temperature but lower
than 1083 oC, which is the copper melting point. Temperature measurement around
the battery exterior recorded the highest temperature of 738 oC, which appears to be
consistent with the observation. The high temperature reached destroyed the
external wrap covering the canister exterior surface.

Chapter 5 Experimental characterisation of lithium-ion battery thermal runaway
163
5.3.2.2 Results of Oven Test 2 for Two Full-Charged Cells Not Electrically
Connected
In this test, thermal runaway of two batteries at 100% SOC was characterised,
which was aimed to investigate the effects of doubling the reactant mass. The
batteries were fastened together with a steel wire but they are not electrically
connected. Under this test condition, the batteries total voltage and capacity
remained the same as single battery, which were 4.19 V and 2.5 Ah respectively,
only the mass of batteries was doubled to 96 g. The findings are shown in Figure
5.17.
As shown by T1 – T3 in Figure 5.17, the increment of battery temperature is slower
in comparison to oven air and sample containment. The presence of multilayer
sample containment served as thermal resistance to the batteries and therefore
retarded the battery heating process. The catastrophic thermal runaway occurred as
the battery temperature reached 183 oC at 115 minute after the experiment
commenced where the temperature spiked to 783 oC. Despite the multilayer sample
containment, the abrupt heat release during thermal runaway can be detected
outside the containment as a surge in temperature was recorded in T4 and T5. All
temperature readings subsequently reduced to and remained at the oven preset
temperature after the completion of thermal runaway reactions.

Chapter 5 Experimental characterisation of lithium-ion battery thermal runaway
164
Figure 5.17: Temperature profiles from oven heating of two unconnected full-
charged batteries.
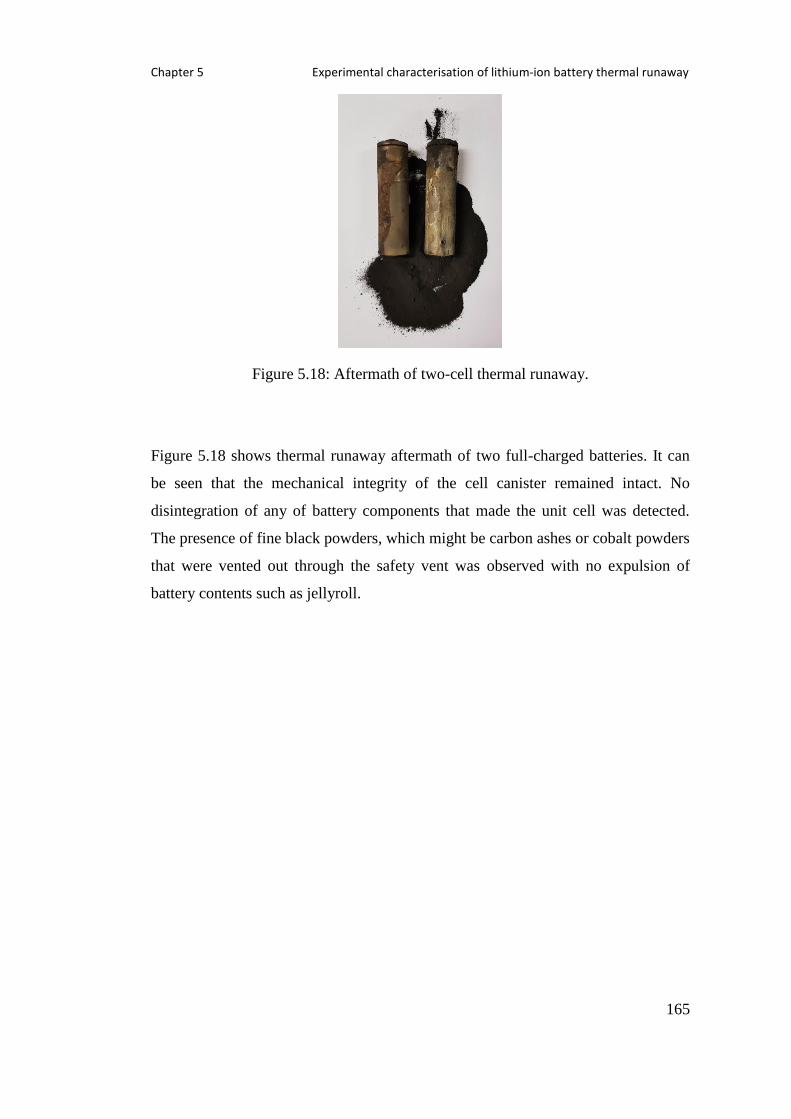
Chapter 5 Experimental characterisation of lithium-ion battery thermal runaway
165
Figure 5.18: Aftermath of two-cell thermal runaway.
Figure 5.18 shows thermal runaway aftermath of two full-charged batteries. It can
be seen that the mechanical integrity of the cell canister remained intact. No
disintegration of any of battery components that made the unit cell was detected.
The presence of fine black powders, which might be carbon ashes or cobalt powders
that were vented out through the safety vent was observed with no expulsion of
battery contents such as jellyroll.

Chapter 5 Experimental characterisation of lithium-ion battery thermal runaway
166
5.3.2.3 Results of Oven Test 3 for Two Full-Charged Cells Connected in
Parallel
In this test, thermal runaway of two batteries at 100% SOC was characterised,
which was aimed to investigate the effects of doubling the reactant mass and
electrical capacity. Nickel strips were used to connect the battery terminals and
form the intended parallel electrical connection. Under this test condition, the total
voltage remained the same as single cell, which was 4.23 V, but the capacity and
mass were doubled to 5.0 Ah and 96 g respectively. The outcomes of the test are
shown in Figure 5.19.
The thermocouple used to measure the temperature at point T1, which is around
battery positive terminal was damaged during the test. Hence, the reading was left
out. In general, the same qualitative features can be observed in the temperature
development. Thermal runaway was induced in the battery after 107 minute of
heating process. At that juncture, the temperature around the negative terminal
surged to 420 oC from 173
oC, while the battery central body recorded a rapid
increment from 197 oC up to 756
oC.
The presence of multilayer sample containment was not able to prevent the
thermocouples outside the sample containment from detecting the massive heat
release during thermal runaway. After the completion of thermal runaway reactions,
the temperature of the battery inside the ceramic pots reduced to the oven air
temperature and remained unchanged thereafter.

Chapter 5 Experimental characterisation of lithium-ion battery thermal runaway
167
Figure 5.19: Temperature profiles from oven heating of two full-charged batteries
connected in parallel.

Chapter 5 Experimental characterisation of lithium-ion battery thermal runaway
168
Figure 5.20: Aftermath of thermal runaway of two full-charged batteries connected
in parallel.
Figure 5.20 shows the aftermath of two full-charged batteries thermal runaway.
Black powder that heavily stained the battery canisters was observed, which might
be carbon ashes or cobalt powders that vented out during thermal runaway. Violent
venting of the battery contents during thermal runaway caused the nickel strip at the
positive terminals to break into two parts and disconnected the batteries while
maintaining the adhesion on the surface of the terminals. On the other hand, no
significant deformation was observed at the nickel strip at the battery negative
terminals. The mechanical integrity of the batteries remained intact and no
disintegration of any of battery components that made the unit cell was detected.

Chapter 5 Experimental characterisation of lithium-ion battery thermal runaway
169
5.3.2.4 Results of Oven Test 4 for Half-Charged Single Cell
In this test, thermal runaway of a single battery at 50% SOC was characterised.
Under half-charged condition, the battery has a capacity and a voltage of 1.25 Ah
and 3.74 V respectively. The findings are presented in Figure 5.21.
After approximately six hours of heating, no thermal runaway was observed. Quick
temperature drops were recorded inside the ceramic pot at 90 to 110 minutes, which
was caused by gradual gas venting that entailed cooling effect due to the Joule-
Thompson effect. At half-charge, the exothermic reactions that involved in thermal
runaway took place at a slow rate. The slow heat release caused the battery
temperature to overshoot the oven air temperature at 250 minute for a prolonged
period, which led to the presence of thermal hump. A close look into the thermal
hump is given in Figure 5.22. The temperature overshoot was too small to cause
temperature increment in the oven air and steel holder base.
Figure 5.23 shows the aftermath of half-charged cell after the oven test. Apart than
minor fragments that were collected from the cell holder, no ejection of battery
contents was observed. High oven chamber temperature caused the canister wrap to
melt and smudged the battery surface.

Chapter 5 Experimental characterisation of lithium-ion battery thermal runaway
170
Figure 5.21: Temperature profiles from oven heating of single half-charged battery.

Chapter 5 Experimental characterisation of lithium-ion battery thermal runaway
171
Figure 5.22: Temperature overshoot in the ceramic pots.
Figure 5.23: Remnant of half-charged battery after the oven test.

Chapter 5 Experimental characterisation of lithium-ion battery thermal runaway
172
5.3.2.5 Results of Oven Test 5 for Zero-Charged Single Cell
In this test, thermal runaway of a single battery at 0% SOC was characterised.
Under zero-charged condition, the battery has a capacity and a voltage of 0 Ah and
3.21 V respectively. The aftermath of the oven test is shown in Figure 5.24. The
recorded temperatures are presented in Figure 5.25.
Figure 5.24: Remnant of the drained battery after the oven test.
The venting of cell contents as part of the battery integral hazard mitigation caused
a temperature drop after 125 minutes. No thermal runaway was observed and the
experiment was terminated after no indicators or signs of exothermic reactions were
detected. The battery reached and plateaued at the oven air temperature as it reached
thermal equilibrium with the oven air temperature. As shown in Figure 5.24, no
significant blemish is spotted on the cell external canister.

Chapter 5 Experimental characterisation of lithium-ion battery thermal runaway
173
Figure 5.25: Temperature profiles from oven heating of single zero-charged battery.

Chapter 5 Experimental characterisation of lithium-ion battery thermal runaway
174
5.3.3 Results of Battery Thermal Runaway Characterisation Using
Accelerating Rate Calorimeter (ARC)
5.3.3.1 Results of ARC Test 1 for Single Full-Charged Cell
In this test, thermal runaway of a single battery at 100% SOC was characterised
using ARC. Under full-charged condition, the capacity and the voltage of the
battery were 2.5 Ah and 4.18 V respectively. Figure 5.26 presents the battery
temperature during the ARC test. The associated self-heating rate is depicted in
Figure 5.27. The key findings are summarised in Table 5.10.
Table 5.10: Thermal runaway characteristics of single full-charged battery from
ARC test.
Exotherm onset temperature (oC) 81.666
Exotherm onset time (Minute) 712.001
Thermal runaway temperature (oC) 163.070
Thermal runaway induction time (Minute) 2046.893
Maximum temperature (oC) 428.533
Maximum self-heating rate (oC/min) 8677.259

Chapter 5 Experimental characterisation of lithium-ion battery thermal runaway
175
Figure 5.26: Temperature of single full-charged battery from ARC test.
Figure 5.27: Self-heating rate of single full-charged battery from ARC test.

Chapter 5 Experimental characterisation of lithium-ion battery thermal runaway
176
5.3.3.2 Results of ARC Test 2 for Two Full-Charged Cells
In this test, thermal runaway of two batteries at 100% SOC was characterised using
ARC, which was aimed to investigate the effects of doubling the reactant mass. The
batteries were fastened together with a fibre glass tape and there was no electrical
connection present. Under this test condition, the batteries total voltage and capacity
remained the same as single battery, which were 4.23 V and 2.5 Ah respectively,
only the mass of batteries was doubled to 96 g. The recorded temperature is
presented in Figure 5.28. The associated self-heating rate is depicted in Figure 5.29.
The key findings are summarised in Table 5.11.
Table 5.11: Thermal runaway characteristics of two full-charged batteries from
ARC test.
Exotherm onset temperature (oC) 76.552
Exotherm onset time (Minute) 669.521
Thermal runaway temperature (oC) 134.116
Thermal runaway induction time (Minute) 1752.027
Maximum temperature (oC) 522.204
Maximum self-heating rate (oC/min) 1795.02

Chapter 5 Experimental characterisation of lithium-ion battery thermal runaway
177
Figure 5.28: Temperature of two full-charged batteries from ARC test.
Figure 5.29: Self-heating rate of two full-charged batteries from ARC test.

Chapter 5 Experimental characterisation of lithium-ion battery thermal runaway
178
5.3.3.3 Results of ARC Test 3 for Single Half-Charged Cell
In this test, thermal runaway of a single battery at 50% SOC was characterised.
Under half-charged condition, the battery has a capacity and a voltage of 1.25 Ah
and 3.69 V respectively. The recorded temperature is presented in Figure 5.30. The
associated self-heating rate is depicted in Figure 5.31. The key findings are
summarised in Table 5.12.
Table 5.12: Thermal runaway characteristics of single half-charged battery from
ARC test.
Exotherm onset temperature (oC) 101.534
Exotherm onset time (Minute) 1099.505
Thermal runaway temperature (oC) 207.033
Thermal runaway induction time (Minute) 2507.342
Maximum temperature (oC) 404.662
Maximum self-heating rate (oC/min) 3189.066

Chapter 5 Experimental characterisation of lithium-ion battery thermal runaway
179
Figure 5.30: Temperature of single half-charged battery from ARC test.
Figure 5.31: Self-heating rate of single half-charged battery from ARC test.

Chapter 5 Experimental characterisation of lithium-ion battery thermal runaway
180
5.3.3.4 Results of ARC Test 4 for Single Zero-Charged Cell
In this test, thermal runaway of a single battery at 0% SOC was characterised using
ARC. Under zero-charged condition, the battery has a capacity and a voltage of 0
Ah and 3.23 V respectively. The recorded temperature is presented in Figure 5.32.
The associated self-heating rate is depicted in Figure 5.33. The key findings are
summarised in Table 5.13.
Table 5.13: Thermal runaway characteristics of single zero-charged battery from
ARC test.
Exotherm onset temperature (oC) 91.377
Exotherm onset time (Minute) 827.001
Thermal runaway temperature (oC) Not observed
Thermal runaway induction time (Minute) Not observed
Maximum temperature (oC) 315.084
Maximum self-heating rate (oC/min) 0.696

Chapter 5 Experimental characterisation of lithium-ion battery thermal runaway
181
Figure 5.32: Temperature of single zero-charged battery from ARC test.
Figure 5.33: Self-heating rate of single zero-charged battery from ARC test.

Chapter 5 Experimental characterisation of lithium-ion battery thermal runaway
182
5.3.4 Results of Impact-Initiated Battery Thermal Runaway
5.3.4.1 Results of Impact Test 1 for Full-Charged Single Cell
The recorded temperature during the impact test on single battery is shown in
Figure 5.34. The failure caused by direct impact to the battery positive terminal
caused an almost immediate failure. Upon indented by the steel rod, the temperature
as recorded by thermocouples increased slightly from room temperature to 34 oC
and appeared to plateau for 9 seconds before surging to 250 oC. The temperature
dropped after completion of thermal runaway reactions.
The impact from the rod indentation was sufficient to damage the battery vent and
penetrate through the cell canister. However, the impact was inadequate to force
cathode and anode to collide with each other in the canister to cause a massive
short-circuit. Boiling electrolyte was observed gushing through the deformed vent
after the impact, indicating that heat was generated in the battery. An attempt to
move the rod from the deformed battery agitated the battery components and
resulted in collision between the electrodes. The heat generated from the massive
short-circuit ignited the flammable particles in the battery and produced fire sparks,
which was followed by fierce burning of the gases generated. Important events
during the fire development are shown in Figure 5.35 – Figure 5.37.
Thermography from the first impact test is shown in Figure 5.38 – 5.39. It is shown
that the battery temperature reached 81 oC prior to the flame eruption. At some
point during the test, the flame and the ejected battery content reached 521 oC.

Chapter 5 Experimental characterisation of lithium-ion battery thermal runaway
183
Figure 5.34: Thermocouple measurement during the first impact test.

Chapter 5 Experimental characterisation of lithium-ion battery thermal runaway
184
Figure 5.35: Fire sparks and smoke plume were observed after an attempt was made
to dislodge the rod from the indented battery.
Figure 5.36: Fierce burning of the ejected gases.
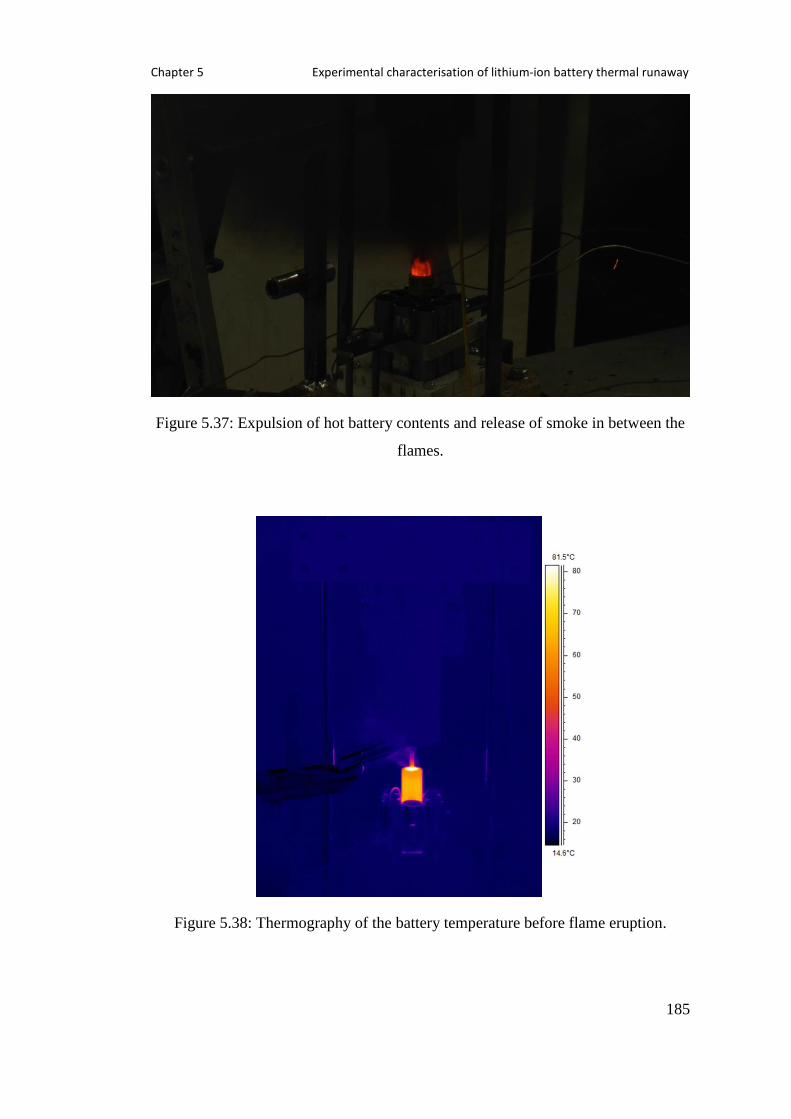
Chapter 5 Experimental characterisation of lithium-ion battery thermal runaway
185
Figure 5.37: Expulsion of hot battery contents and release of smoke in between the
flames.
Figure 5.38: Thermography of the battery temperature before flame eruption.
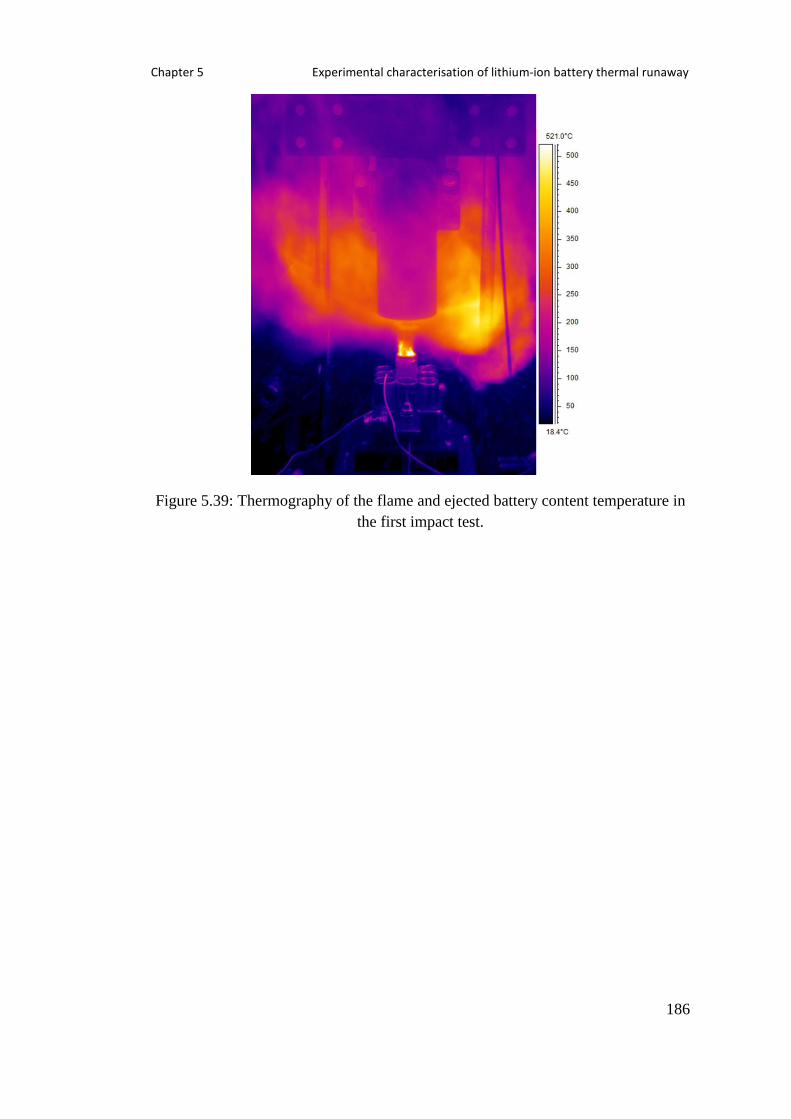
Chapter 5 Experimental characterisation of lithium-ion battery thermal runaway
186
Figure 5.39: Thermography of the flame and ejected battery content temperature in
the first impact test.

Chapter 5 Experimental characterisation of lithium-ion battery thermal runaway
187
5.3.4.2 Results of Impact Test 2 for Full-Charged Single Cell
This time, the impact caused an immediate destruction to the battery. The
temperature of the ejected battery content and the flames developed in the impact is
shown in thermography in Figure 5.40. The temperature as recorded by
thermocouples is shown in Figure 5.41.
The impact from the rod indentation was sufficient to damage the battery vent and
penetrate through the cell canister. In addition, the impact was adequate to force
cathode and anode to collide with each other in the canister and consequently leads
to a massive short-circuit. The developments of fire at every second after the impact
are shown in Figure 5.42 – Figure 5.46 and summarised in Table 5.14.
Table 5.14: Summary of fire development in the impact test.
Stage Time after impact (s) Description
1 1 Smoke plume
2 2 Fire sparks
3 3 – 5 Jet flames
4 6 – 8 Sustained flames
5 9 – 22 Flame weakening – orange flame
6 23 – 29 Flame weakening – blue flame
7 30 Flame extinguish
Figure 5.40: Thermography of the ejected battery content and the surrounding
flames temperature.

Chapter 5 Experimental characterisation of lithium-ion battery thermal runaway
188
Figure 5.41: Thermocouple measurement during the second impact test.

Chapter 5 Experimental characterisation of lithium-ion battery thermal runaway
189
Figure 5.42: Screenshots corresponding to 1 to 6 seconds after the indentation
showing the development of fire from the impact test.

Chapter 5 Experimental characterisation of lithium-ion battery thermal runaway
190
Figure 5.43: Screenshots corresponding to 7 to 12 seconds after the indentation
showing the development of fire from the impact test.

Chapter 5 Experimental characterisation of lithium-ion battery thermal runaway
191
Figure 5.44: Screenshots corresponding to 13 to 18 seconds after the indentation
showing the development of fire from the impact test.

Chapter 5 Experimental characterisation of lithium-ion battery thermal runaway
192
Figure 5.45: Screenshots corresponding to 19 to 24 seconds after the indentation
showing the development of fire from the impact test.

Chapter 5 Experimental characterisation of lithium-ion battery thermal runaway
193
Figure 5.46: Screenshots corresponding to 25 to 30 seconds after the indentation
showing the development of fire from the impact test.

Chapter 5 Experimental characterisation of lithium-ion battery thermal runaway
194
5.3.4.3 Results of Impact Test 3 for Full-Charged 9 Cells Battery Module
Impact tests on single battery have demonstrated a violent and energetic response to
the abusive situation. Fire sparks, sustained flames and expulsion of hot battery
contents were observed. In addition to conductive, convective and radiative heat
transfer processes from the hot cell canister, these fires could serve as heat transfer
agents and consequently promote thermal runaway to other batteries in the
assembly. Therefore, a test on a battery module was conducted to investigate the
propagation of thermal runaway from the induced battery to the neighbouring
batteries in the module.
The temperature during the test as recorded by thermocouples is shown in Figure
5.47. The impact caused an immediate destruction on the indented battery and led to
rapid temperature rise to higher than 260 oC. Temperature drop was recorded after
complete consumption of thermal runaway reactants. No significant differences
were observed in the recorded temperature in comparison to the single battery tests
conducted previously.
The initiation of thermal runaway in the indented cell generated a massive amount
of thermal energy but the heat transport process was retarded by the significant air
gap between the cells. The inadequate heat transfer to the neighbouring cells will
not be able to trigger the exothermic reactions in the cells and subsequently arrest
thermal runaway from propagating to other batteries in the assembly.
Important events during the fire development are shown in Figure 5.48 – Figure
5.49. Thermography of the battery module after the flame extinguished is shown in
Figure 5.50. At that point, the content of the impacted battery showed a temperature
of 548 oC while others maintained at room temperature, showing no sign of thermal
runaway propagation.

Chapter 5 Experimental characterisation of lithium-ion battery thermal runaway
195
Figure 5.47: Temperature profiles in the battery assembly.

Chapter 5 Experimental characterisation of lithium-ion battery thermal runaway
196
Figure 5.48: Fire sparks were produced after the impact.
Figure 5.49: The cylinder was engulfed in fire.

Chapter 5 Experimental characterisation of lithium-ion battery thermal runaway
197
Figure 5.50: Thermography of the battery module after flame extinguished.

Chapter 5 Experimental characterisation of lithium-ion battery thermal runaway
198
5.4 Summary Experimental works were conducted to characterise thermal runaway of lithium-ion
battery. Batteries were subjected to thermally abusive environments under both
adiabatic and non-adiabatic conditions and the kinetics of thermal runaway were
studied. In addition, destructive impact tests were conducted to investigate the
effect of mechanical impact on battery thermal runaway. The summary of the key
findings from the experimental works is given below.
1. During oven tests, only full-charged batteries suffered from thermal
runaway. The period of the heating process during oven test at a preset
temperature of 190 oC appeared to be insufficient to induce the heat-
activated exothermic reactions in batteries at SOC of 0% and 50%.
2. During the adiabatic test using ARC, all batteries, even the zero-charged
battery demonstrated a self-heating behaviour. The prolonged experimental
period was able to induce the heat-activated exothermic reactions in the
batteries.
3. Venting of the cell volatile contents was observed at a temperature range of
154 oC to 170
oC.
4. The mechanical integrity of the cell canister was able to withstand the
internal pressure. The equipped safety vent appeared to deliver the intended
purpose of protecting the canister from catastrophic rupture.
5. The effect of SOC on battery thermal runaway is profound, where battery
with higher SOC demonstrated a higher tendency to experience thermal
runaway, with shorter time span to induce the heat-activated exothermic
reactions and resulted with a more severe response, as indicated by the
maximum temperature achieved.
6. Impact-induced short-circuit inflicts an immediate failure which in turn
results in surge of the battery temperature and development of flame.
7. The battery temperature can reach higher than 800 oC during impact as
recorded by thermal imaging equipment. Despite showing a violent response
to abuse, propagation of thermal runaway in a battery module was not
observed.

Chapter 6 Discussions
199
Chapter 6: Discussions of the Experimental
Results and Validation of the Numerical
Models
Both experimental techniques and numerical modelling conducted in this research
work have been discussed in the preceding chapters. This chapter is aimed to
compare and discuss the findings from both methods and to evaluate the suitability
of the previously developed model for prediction of battery thermal runaway
temperature. There are three main parameters of thermal runaway as studied in both
numerical modelling and experimental validation:
1. Thermal runaway temperature
2. Thermal runaway induction time
3. Maximum temperature rise
The point of thermal runaway is defined at the inflection point in the rate of
temperature increase where the battery starts to experience a rising pattern in the
rate of temperature increase which reflecting accelerating reaction rates.
6.1 Modelling of Thermal Reaction Kinetics for Simulation of
Battery Thermal Runaway Thermal runaway hazard of lithium-ion battery originates from the reactive metallic
electrodes and the flammable electrolyte that form the cell components. These
components are thermally unstable at high temperature and involve in intricate
exothermic reactions that lead to thermal runaway. Each of the reactions possesses
their own characteristic kinetic parameters and decomposition model to
mathematically describe the progress of the reactions. A numerical model was
developed to simulate thermal runaway of lithium-ion batteries during failure by

Chapter 6 Discussions
200
combining the kinetics of the pertinent chemical reactions. The work was
concentrated on full-charged cylindrical lithium-ion battery with lithium cobalt
oxide cathode and graphite anode.
From the thermal kinetic model, a range of thermal runaway situations was
predicted. Three cases were developed to investigate thermal runaway
characteristics at high constant temperature of 150 oC, 155
oC and 160
oC, assuming
the battery was initially at room temperature. The simulation results indicate that
prolonged exposure to high constant temperature would induce thermal runaway.
However, the temperature needs to be sufficiently high to overcome the activation
energy of the heat-activated chemical reactions in the battery.
Figure 6.1: Rate of battery temperature change during prolonged exposure to
constant high temperature. Thermal runaway points are marked in red.
While thermal runaway was not induced in 150 oC case, a small temperature
overshoot was observed indicating the occurrence of local exothermic reactions at a
sluggish rate. Prolonged exposure to both 155 oC and 160
oC resulted in thermal
runaway, which was observed at 163 oC and 169
oC respectively. The increase in
temperature results in shorter induction time to overshoot the ambient temperature
and the subsequent thermal runaway. The temperature increment also led to a more
severe consequence, as reflected by a higher maximum temperature rise.

Chapter 6 Discussions
201
Figure 6.2: Rate of battery temperature change at constant heating rate. Thermal
runaway points are marked in red.
In addition, the effect of constant heating rate to the characteristics of thermal
runaway was further investigated. Three cases were developed at heating rates of 1,
1.5 and 2 oC/min. The simulation results show that the battery temperature
overshoots the ambient temperature at 164, 171 and 178 oC under linear heating rate
of 1, 1.5 and 2 oC/min respectively. In general, a higher heating rate results in
shorter time to exceed the ambient temperature. Thermal runaway temperature for
the 1 oC/min case can be determined clearly at 166
oC from the inflection point in
Under both constant temperature and constant heating conditions, the model
indicates that rapid thermal runaway is observed when significant progress in
cathode reaction is observed at a temperature higher than 160 oC. The cathode
reaction is the most energetic reaction during thermal runaway and will become the
dominant heat source once activated. The characteristics of a full-charged battery
thermal runaway as determined from numerical modelling are summarised in Table
6.1.

Chapter 6 Discussions
202
Table 6.1: Summary of thermal runaway characteristics of a single full-charged
lithium-ion battery from numerical modelling.
Condition Thermal
runaway
induction
time
(Minute)
Thermal
runaway
temperature
(oC)
Maximum
temperature
rise
(oC)
Constant temperature of 150 oC Not
observed
Not
observed
163.417
Constant temperature of 155 oC 35.500 162.992 225.708
Constant temperature of 160 oC 28.117 168.897 284.880
Constant heating rate of 1.0 oC/min 140.300 166.004 291.667
Constant heating rate of 1.5 oC/min 97.400 170.724 312.687
Constant heating rate of 2.0 oC/min 75.933 175.338 324.751

Chapter 6 Discussions
203
6.2 Experimental Validation of Thermal Runaway Model In order to validate the previously developed model, experimental programme was
conducted by using two different approaches. The study of thermal runaway
characteristics was performed under both adiabatic and non-adiabatic conditions by
using Accelerating Rate Calorimeter and oven respectively. The characteristics of
full-charged battery thermal runaway as determined from experimental programmes
are summarised in Table 6.2.
Table 6.2: Summary of battery thermal runaway characteristics from experimental
programmes.
Test Battery
capacity
(Ah)
SOC
(%)
Number
of
battery
Thermal
runaway
induction
time
(Minute)
Thermal
runaway
temperature
(oC)
Maximum
temperature
rise
(oC)
Oven 1 2.5 100 1 126.917 182.506 738.245
Oven 2 2.5 100 2 115.983 183.064 783.089
Oven 3 5.0 100 2 107.717 173.063 756.679
ARC 1 2.5 100 1 2046.893 163.070 428.533
ARC 2 2.5 100 2 1752.027 134.116 522.204
ARC 3 1.25 50 1 2507.342 207.033 404.662
ARC 4 0 0 1 Not
observed
Not
observed
315.084
In the first approach, a series of tests was performed on single batteries at varying
state of charge by using oven. As previously mentioned, battery thermal runaway
hazard originates from reactive metallic electrodes and flammable electrolytes that
form the battery main components. The effects of doubling the amount of these
reactants on thermal runaway characteristics were investigated by studying two full-
charged batteries. In addition, parallel electrical connection was further formed on
the two-full charged batteries to explore the effects of doubling the electrical
capacity.

Chapter 6 Discussions
204
The simulation indicates that to thermally induce rapid thermal runaway in a full-
charged cylindrical lithium-ion battery with lithium cobalt oxide cathode and
graphite anode, the ambient temperature needs to be at least 155 oC while the
occurrence of rapid thermal runaway will be at a higher temperature. Therefore, the
oven tests were conducted at 190 oC, a preset temperature way higher from the one
determined from the simulation to ensure effective induction of thermal runaway.
The oven used is not designed to contain any fire and explosion hazards caused by
battery thermal runaway and therefore cannot be left unattended. Due to the
limitation of the equipment available, the experimental programme needs to be
terminated at the end of the day to prevent any undesirable safety issues. The major
setback from this situation is that this technique hinders the study of thermal
runaway characteristics of half-charged and zero-charged batteries since prolonged
uninterrupted heating is required for this purpose.
At the end of the experimental programme, it was noticed that the weight-supported
lid covering the cylindrical steel holder was displaced; indicating its inability to
withstand the pressure build-up caused by the gases released during battery thermal
runaway. Nevertheless, no pressure measurement was conducted to quantify the
actual pressure within the sample holder. The release of the gases from the
containment arrangement relieved the internal pressure build-up. Hence, this
experimental arrangement can be considered as a constant pressure system.
Thermal runaway characteristics of full-charged batteries at varying mass and
capacity from oven tests are shown in Figure 6.3. The corresponding rate of
temperature change is depicted in Figure 6.4.

Chapter 6 Discussions
205
Figure 6.3: Full-charged battery thermal runaway characteristics from oven tests.
Figure 6.4: Rate of battery temperature change during oven tests.

Chapter 6 Discussions
206
Increasing the amount of battery which directly increased the amount of reactants
involved in thermal runaway reactions did result in the rise of the maximum
temperature reached. Thermal runaway of a single battery resulted in a maximum
temperature of 738 oC. The value increased to 783
oC as one more battery was
added to double the amount of reactants involved in thermal runaway. Two batteries
with parallel electrical connection that doubled both electrical capacity and reactant
mass resulted in a maximum temperature of 756 oC. Since the difference is not so
significant in comparison to the single battery, it can be concluded that the effects
of increasing the reactant mass on the maximum temperature rise are not apparent.
However, it should be noted that two batteries are more inclined towards thermal
runaway in comparison to the single battery. A single battery recorded a thermal
runaway induction time of 126.92 minute. The time is reduced by 8.6% to 115.98
minute as two batteries were present in the oven. The presence of parallel electrical
connection that increased the total capacity by 100% to 5.0 Ah resulted in a further
inclined towards thermal runaway by 15% to 107.72 minute.
In the second approach, Accelerating Rate Calorimeter (ARC) was used. The
calorimeter is well-sealed where the gases released from thermal runaway reactions
are confined within the chamber and consequently leads to pressure increase.
Hence, the experimental setup can be considered as a constant volume system. The
operation of ARC under Heat-Wait-Seek mode allows the detection of
exothermicity onset point and the subsequent enthalpy quantification.
Exothermicity onset point is the point where the battery temperature increase due to
the local reactions surpasses 0.02 oC/minute and the calorimeter shifts the operation
to exotherm mode. The presence of thick aluminium jackets with a series of heaters
and thermocouples around the calorimeter maintains the adiabaticity of the
calorimeter operation under exotherm mode.
The integrated safety features provided by the ARC allows unattended prolonged
experimental programme and which in turn permits thermal runaway
characterisation of half-charged and zero-charged lithium-ion batteries. As
previously mentioned in Section 5.2.3, the calorimeter is placed in a blast box to
provide additional protection from flying debris and open flames in case of fire and

Chapter 6 Discussions
207
explosion events. The blast box is electronically locked during operation that
prohibits any access and supported with mechanical locks at the doors and lids
using steel rods.
Thermal runaway characteristics of batteries at varying mass and capacity from
ARC tests are shown in Figure 6.5. The corresponding rate of battery temperature
change is shown in Figure 6.6. The effects of electrical capacity on battery thermal
runaway are profound, where battery with higher capacity demonstrated a higher
tendency to experience thermal runaway with shorter time span to induce the heat-
activated exothermic reactions. A further reduction in induction time is observed as
the amount of battery is doubled. A single full-charged battery recorded a thermal
runaway induction time of 2046.89 minute. The time is reduced by 14.4% to 1752.0
minute as two batteries were present in the ARC chamber. Meanwhile, reducing the
available battery capacity to half resulted in an increment of induction time by
22.5% to 2507.34 minute. As the battery capacity is further reduced to zero, no
thermal runaway was observed. The findings indicate that battery with less
electrical capacity is safer.

Chapter 6 Discussions
208
Figure 6.5: Battery thermal runaway characteristics at varying charge states from
ARC tests.
Figure 6.6: Battery self-heating rate at varying electrical capacity and mass.
Chapter 6 Discussions
209
The rate of temperature change as presented in Figure 6.6 gives a clear idea of the
kinetic and exothermicity of the reactions involved in thermal runaway. The pattern
of initial heating curves prior to self-generated heating and the subsequent exotherm
mode were almost identical for all batteries irrespective of the battery’s electrical
capacity or number of batteries. Zero-charged cell demonstrated a fluctuating self-
heating rate below 1 oC/min throughout the test programme. Meanwhile, other
batteries experienced an increasing self-heating rate at higher temperature and
exceeded 1 oC/min. Full-charged batteries, both single and two batteries recorded an
overlapped pattern up to 210 oC and subsequently diverged at higher temperature
where single-battery sample demonstrated a higher self-heating rate while two-
battery sample reached a higher maximum temperature at a lower self-heating rate.
Half-charged cell on the other hand recorded a lower self-heating rate compared to
full-charged cells but indicated an identical increasing pattern as the temperature
increased.
Even though thermal runaway was not observed in zero-charged cell, the battery
was able to progress into exotherm mode as the recorded self-heating surpassed the
predetermined temperature rate sensitivity. The local exothermic reactions in the
battery sample proceeded at a sluggish rate and released a small amount of thermal
energy that eventually increased the sample temperature slowly. The process of heat
release from the exothermic reactions, despite being slow, was sufficient to sustain
the calorimeter operation in exotherm mode up to the point of experiment
termination since the rate of temperature increment in the sample was higher than
the preset temperature rate sensitivity. The highest self-heating recorded was below
than 1 oC/min that occurred at temperature of 200
oC where a steep increase in the
temperature can be observed. The experimental programme was terminated as the
battery temperature reached 315 oC and was cooled down thereafter.

Chapter 6 Discussions
210
6.3 Thermal Runaway of Impact-Induced Short-Circuit The battery canister has an important role of hosting and protecting the active
materials that form the battery components. In the event of impact, a rupture in the
mechanical integrity of the battery canister will result in collision between the
positive and negative electrodes. The situation leads to a short-circuit where the
electrical energy content is converted into a massive amount of heat.
The failure induced by impact is immediate where a rapid temperature increment is
observed. In addition, the heat generated from short-circuit will induce and
accelerate the heat-activated exothermic reactions and further exacerbate the
situation. In some reactions, the release of heat is accompanied by the generation of
flammable gases. Even the first and bottleneck chemical reactions to thermal
runaway, the decomposition of solid electrolyte interphase (SEI) do produce
flammable gases. According to Yang et al. (2006), the reactions produce flammable
ethylene gases and proceed according to the following mechanisms.
(CH2OCO2Li)2 → Li2CO3 + C2H4 + CO2 + 0.5O2 (Eq 6.1)
2Li + (CH2OCO2Li)2 → 2Li2CO3 + C2H4 (Eq 6.2)
The rupture of SEI layer leaves the anode surface unprotected and exposed to
reactions with electrolyte. These reactions produce flammable gases such as
ethylene, ethane and propene. The mechanisms of the reactions between anode and
electrolytes as reported by Lopez et al. (2015a) are shown below.
2Li + C3H4O3 (EC) → Li2CO3 + C2H4 (Eq 6.3)
2Li + C3H6O3 (DMC) → Li2CO3 + C2H6 (Eq 6.4)
2Li + C4H6O3 (PC) → Li2CO3 + C3H6 (Eq 6.5)
The destructive impact tests were conducted to simulate the loss of mechanical
integrity of the battery structure. Since the tests were done in open air where the
oxygen was abundant, the outcome was devastating where fire was developed. The
massive amount of heat produced by short-circuit induced the generation of the
flammable gases and provided ignition source required for flame production.

Chapter 6 Discussions
211
In the destructive impact tests, thermocouples were used for temperature
measurement. It should be noted that thermocouples only provided measurement of
battery skin temperature while thermal runaway reactions occurred inside the cell
canister. The slow response of thermocouples renders this tool less suitable for
rapid temperature measurement as in the impact test. Despite being able to capture
the qualitative behaviour of temperature development during the impact and in good
agreement with the model developed previously, temperature measurement by using
thermocouples is far from accurate for representation of thermal runaway hazard
under this condition. The thermocouples were not placed near the flame since this
will obstruct the steel rod movement and the indentation process. Due to the
limitation of thermocouples for fast temperature recording, the measurement of
temperature was supported by using thermal imaging technique.
There are two main hazards from impact-induced short-circuit. The first hazard
originates from the reactive metallic electrodes that reached a very high temperature
as a result of short-circuit and thermal runaway. Thermography of the aftermath
showed that the battery content reached a temperature higher than 800 oC. The
second hazard is the flame erupted due to the ignition of flammable electrolytes and
combustible gases produced by battery components. As shown by thermography,
the flame temperature can be higher than 500 oC. Even though violent failure
behaviour was observed from the impact test, the large amount of heat was unable
to induce thermal runaway reactions in the neighbouring cells. Thermography
showed that all the surrounding cells remained at room temperature after the
impact.

Chapter 6 Discussions
212
6.4 Summary A comparison of the numerical modelling results and experimental validations was
conducted. The experimental results indicate that the numerical model was able to
predict thermal runaway temperature as reflected by the agreeable value between
both numerical modelling and experimental results, validating the model as a
reliable tool for simulation of thermal runaway.
The results from numerical model, and supported by the experimental works show
that considerable amount of time is required to induce thermal runaway by heating.
The exothermic reactions involved in thermal runaway are heat-activated where
considerable heating time is necessary for catastrophic failure to occur. Impact-
induced short-circuit, on the other hand, inflicts an immediate failure which in turn
results in surge of the battery temperature. The massive amount of heat generated
during short-circuit accelerates the production of flammable gases and subsequently
ignites the gases, leads to the flame eruption.
In addition, thermal runaway characteristics of lithium-ion batteries are dependent
on environmental temperature, heating rate and electrical capacity. The presence of
higher amount of electrical energy at higher capacity makes the reactive materials
thermally unstable as reflected by thermal runaway induction time and results in
severe response, as indicated by the maximum temperature achieved. The severity
is further intensified as the amount of reactants involved in thermal runaway
reactions is doubled in two batteries.

Chapter 7 Conclusions
213
Chapter 7: Conclusions
This chapter presents the conclusions drawn from this research project. The
limitations of the study are discussed and suggestions for further improvement for
the next stage of research programme in this area are made.
Conclusions
Thermal runaway is the common failure mode in lithium-ion batteries, with
the potential to cause fire and explosion.
Thermal runaway hazard of lithium-ion batteries stems from its components
where a combination of highly reactive electrodes and flammable organic
electrolytes is present.
There are multiple exothermic reactions during thermal runaway. All of
them are heat-activated where energetic or high temperature environments
are required to overcome the associated activation energy and therefore
induce the thermal reactions.
Cathode breakdown is the most energetic reaction during thermal runaway
with the highest rate of heat release. The reaction produces oxygen, which
may lead to the combustion of organic electrolyte in the battery.
Numerical Modelling of Thermal Runaway Behaviour
Thermal runaway model for a cylindrical lithium-ion battery with lithium
cobalt oxide cathode and graphite anode was developed. Battery thermal
runaway behaviour under thermally abusive conditions and impact-induced
short-circuit was predicted.
The modelling of the thermal kinetics of pertinent chemical reactions
enables comprehensive understanding of relative contribution of the battery
components towards thermal runaway.

Chapter 7 Conclusions
214
Under thermally abusive conditions, for both constant high ambient
temperature and constant heating rate cases, thermal runaway does not occur
instantaneously. Considerable amount of time is necessary to induce thermal
runaway in the battery.
Impact-induced short-circuit, on the other hand, inflicts an immediate failure
which in turn results in rapid increment of battery temperature.
Simulation results show that thermal runaway characteristics are dependent
on the heating temperature and heating rate. Higher heating temperature and
heating rate result in higher maximum temperature rise, higher thermal
runaway temperature and shorter induction time. The simulated results
indicate that thermal runaway temperature for a full-charged lithium-ion
battery falls within the range of 162 oC – 175
oC.
Thermal runaway model of the single cell was further expanded to include
heat transfer modelling to simulate the propagation of thermal runaway in a
battery pack consisted of 9 identical cylindrical cells. Two different failure
initiation locations were investigated, which both showed no thermal
runaway propagation.
Experimental Study of Thermal Runaway Characteristics
The numerical model was experimentally validated by using oven heating
and ARC. The experimental results indicate that thermal runaway
temperature for a full-charged battery falls within the range of 163 oC – 183
oC.
Oven test was able to capture thermal runaway characteristics of full-
charged batteries only. The short heating time of a few hours was
insufficient to induce thermal runaway in half-charged and zero-charged
batteries. Meanwhile, ARC was able to induce thermal runaway in half-
charged battery due to its longer heating process.
The effects of battery electrical capacity on battery thermal runaway are
profound, where battery with higher capacity demonstrated a higher
tendency to experience thermal runaway, with shorter time span to induce

Chapter 7 Conclusions
215
the heat-activated exothermic reactions and resulted with a more severe
response, as indicated by the maximum temperature rise.
In comparison to heating, thermal runaway induced by impact led to
immediate failure. The massive amount of heat produced by short-circuit
accelerated the generation of flammable gases and provided ignition source
required for flame production.
Validation of Numerical Model by Experimental Study
The experimental results indicate that the numerical model was able to
predict thermal runaway temperature as reflected by the agreeable value
between both numerical modelling and experimental work, validating the
model as a reliable tool for simulation of thermal runaway behaviour.

Chapter 7 Conclusions
216
Limitations and Suggested Future Works
Thermal decomposition kinetics pertaining to thermal runaway of lithium-
ion battery with lithium cobalt oxide cathode are well established with an
account of publications can be found in the scientific literature. A range of
chemistries of lithium-ion battery is available that entails significant
variation in the electrochemical properties and thermal stability that
determines its safety behaviour. Modelling of thermal decomposition
kinetics has been proven to be a flexible and convenient way for simulation
of thermal runaway and the subsequent hazard quantification. Therefore, it
would be beneficial to develop thermal kinetics of other lithium-ion battery
chemistries as well.
High capacity battery pack is usually constructed by electrically connecting
individual cells. The charge state of the individual cells is regulated to be
uniform throughout the battery pack by electronic control. An assembly of
batteries, even not at full-charged condition does lead to capacity increase.
Therefore, it is suggested to study how the hazard would change in a high
capacity battery pack under varying charge state.
A range of lithium-ion batteries is available with varying size and geometry,
which entails significant difference in surface area for heat transfer. Due to
this reason, it is recommended to study the effects of the cell geometry on
propagation of thermal runaway in a battery pack.
Venting of the cell volatile contents has been observed at 150 oC to 170
oC
during oven and ARC tests. As the cylindrical battery structure is hollow in
the middle with sufficient size for drilling which may facilitate the
placement of pressure line, it is recommended to measure the development
of pressure inside the cell canister to investigate the pressure of vent
activation.
The chamber of the ARC used in the adiabatic tests is a fixed-volume
closed-system and the gases released during the tests are contained within
the vessel. Therefore, it is suggested that the gases should be collected and
analysed to determine the toxicity and flammability of the gases released. In
addition, it is recommended to evaluate how the gas contents mutate at

Chapter 7 Conclusions
217
higher capacity and number of cells in the future. Also, the release of gases
in the system will lead to pressure increase. Thus, it is recommended to
measure the development of the pressure profile within the chamber.
The experimental study related to propagation of thermal runaway in a
battery pack has been conducted by inducing short-circuit and the
subsequent thermal runaway in a cell by nail penetration. Since there is a
range of abusive environments that can trigger thermal runaway, it is
suggested to diversify the failure initiation techniques to investigate its
effect on propagation of thermal runaway.
It was observed that the steel rod used in the impact test was stuck into the
battery body during the experiment. The rod was detached from the battery
upon violent flame eruption. This situation obstructed the flame from
developing to its maximum height. It is suggested that the retraction system
is improved in the future to prevent the rod from sticking inside the battery
and able to suspend the rod at a higher position so that full fire development
can be observed.

218
References Abada, S., Marlair, G., Lecocq, A., Petit, M., Sauvant-Moynot, V. & Huet, F. 2016.
Safety focused modeling of lithium-ion batteries: A review. Journal of
Power Sources, 306, 178-192.
Abraham, D. P., Roth, E. P., Kostecki, R., Mccarthy, K., Maclaren, S. & Doughty,
D. H. 2006. Diagnostic examination of thermally abused high-power
lithium-ion cells. Journal of Power Sources, 161, 648-657.
Armand, M. & Tarascon, J. M. 2008. Building better batteries. Nature, 451, 652-
657.
Aurbach, D., Levi, M. D., Levi, E. & Schechter, A. 1997. Failure and Stabilization
Mechanisms of Graphite Electrodes. J. Phys. Chem., B, 2195-2206.
Aurbach, D., Markovsky, B., Shechter, A. & Ein-Eli, Y. 1996. A Comparative
Study of Synthetic Graphite and Li Electrodes in Electrolyte Solutions
Based on Ethylene Carbonate-Dimethyl Carbonate Mixtures. J.
Electrochem. Soc., 143, 3809-3820.
Bandhauer, T. M., Garimella, S. & Fullerb, T. F. 2011. A Critical Review of
Thermal Issues in Lithium-Ion Batteries. Journal of The Electrochemical
Society, 158, R1-R25.
Bbcnews. 2013. Boeing 787 Dreamliner: NTSB details battery fire [Online].
Available: http://www.bbc.co.uk/news/business-21710577 [Accessed 29
April 2014].
Belov, D. & Yang, M.-H. 2008. Failure mechanism of Li-ion battery at overcharge
conditions. Journal of Solid State Electrochemistry, 12, 885-894.
Biensan, P., Simon, B., Pérès, J. P., De Guibert, A., Broussely, M., Bodet, J. M. &
Perton, F. 1999. On safety of lithium-ion cells. Journal of Power Sources,
81–82, 906-912.
Biteau, H., Steinhaus, T., Schemel, C., Simeoni, A., Marlair, G., Bal, N. & Torero,
J. L. 2008. Calculation Methods for the Heat Release Rate of Materials of
Unknown Composition. Fire Safety Science - Proceedings of the Ninth
International Symposium
University of Karlsruhe.
Brett, D. 2011. Another cargo aircraft carrying batteries crashes – off South Korea
[Online]. Available: http://www.airportwatch.org.uk/another-cargo-aircraft-
carrying-batteries-crashes-off-south-korea/ [Accessed 13 November 2014].
Cao, J. & Fenner, R. 2016. Samsung’s Lithium-Ion Battery Headache Gets Worse:
QuickTake Q&A [Online]. Bloomberg. Available:

219
https://www.bloomberg.com/news/articles/2016-09-18/quicktake-q-a-
samsung-and-its-lithium-ion-battery-headache [Accessed 22 January 2017].
Cbcnews. 2009. Trail battery-recycling fire leaves questions [Online]. Available:
http://www.cbc.ca/news/canada/british-columbia/trail-battery-recycling-fire-
leaves-questions-1.805780 [Accessed 31 May 2014].
Chen, M., Zhou, D., Chen, X., Zhang, W., Liu, J., Yuen, R. & Wang, J. 2015.
Investigation on the thermal hazards of 18650 lithium ion batteries by fire
calorimeter. Journal of Thermal Analysis and Calorimetry, 1-9.
Chen, W.-C., Wang, Y.-W. & Shu, C.-M. 2016. Adiabatic calorimetry test of the
reaction kinetics and self-heating model for 18650 Li-ion cells in various
states of charge. Journal of Power Sources, 318, 200-209.
Coman, P. T., Rayman, S. & White, R. E. 2016. A lumped model of venting during
thermal runaway in a cylindrical Lithium Cobalt Oxide lithium-ion cell.
Journal of Power Sources, 307, 56-62.
Cpsc. 2014. United States Consumer Product Safety Commission [Online].
Available: http://www.cpsc.gov/ [Accessed 13 April 2014 2014].
Dahn, J. R., Fuller, E. W., Obrovac, M. & Von Sacken, U. 1994. Thermal stability
of LixCoO2, LixNiO2 and λ-MnO2 and consequences for the safety of Li-
ion cells. Solid State Ionics, 69, 265-270.
Dos Santos, R. G., Vidal Vargas, J. A. & Trevisan, O. V. 2014. Thermal Analysis
and Combustion Kinetic of Heavy Oils and Their Asphaltene and Maltene
Fractions Using Accelerating Rate Calorimetry. Energy & Fuels, 28, 7140-
7148.
Doughty, D. & Roth, E. P. 2012. A General Discussion of Li Ion Battery Safety.
The Electrochemical Society Interface, 37 - 44.
Doughty, D. H. 2011. Battery Safety and Abuse Tolerance. In: DANIEL, C. &
BESENHARD, J. O. (eds.) Handbook of Battery Materials.
Doughty, D. H., Butler, P. C., Jungst, R. G. & Roth, E. P. 2002. Lithium battery
thermal models. Journal of Power Sources, 110, 357-363.
Doughty, D. H. & Pesaran, A. A. 2012. Vehicle Battery Safety Roadmap Guidance.
National Renewable Energy Laboratory.
Dubaniewicz, T. H. & Ducarme, J. P. 2014. Further study of the intrinsic safety of
internally shorted lithium and lithium-ion cells within methane-air. Journal
of Loss Prevention in the Process Industries, 32, 165-173.
Edström, K., Herstedt, M. & Abraham, D. P. 2006. A new look at the solid
electrolyte interphase on graphite anodes in Li-ion batteries. Journal of
Power Sources, 153, 380-384.
220
Eshetu, G. G., Grugeon, S., Laruelle, S., Boyanov, S., Lecocq, A., Bertrand, J.-P. &
Marlair, G. 2013. In-depth safety-focused analysis of solvents used in
electrolytes for large scale lithium ion batteries. Physical Chemistry
Chemical Physics, 15, 9145-9155.
Feng, X., Fang, M., He, X., Ouyang, M., Lu, L., Wang, H. & Zhang, M. 2014.
Thermal runaway features of large format prismatic lithium ion battery
using extended volume accelerating rate calorimetry. Journal of Power
Sources, 255, 294-301.
Feng, X., He, X., Ouyang, M., Lu, L., Wu, P., Kulp, C. & Prasser, S. 2015a.
Thermal runaway propagation model for designing a safer battery pack with
25 Ah LiNixCoyMnzO2 large format lithium ion battery. Applied Energy,
154, 74-91.
Feng, X., Lu, L., Ouyang, M., Li, J. & He, X. 2016. A 3D thermal runaway
propagation model for a large format lithium ion battery module. Energy,
115, 194-208.
Feng, X., Sun, J., Ouyang, M., Wang, F., He, X., Lu, L. & Peng, H. 2015b.
Characterization of penetration induced thermal runaway propagation
process within a large format lithium ion battery module. Journal of Power
Sources, 275, 261-273.
Freed, J. 2014. Boeing confirms new 787 battery incident [Online]. Available:
http://www.usatoday.com/story/todayinthesky/2014/01/15/boeing-confirms-
new-787-battery-incident/4494157/ [Accessed 31 May 2014].
Fu, Y., Lu, S., Li, K., Liu, C., Cheng, X. & Zhang, H. 2015. An experimental study
on burning behaviors of 18650 lithium ion batteries using a cone
calorimeter. Journal of Power Sources, 273, 216-222.
Garthwaite, J. 2011. Lithium Ion Batteries Faulted for Jet Crash [Online].
Available: https://gigaom.com/2011/04/04/lithium-ion-batteries-faulted-for-
jet-crash/ [Accessed 15 November 2014].
Golubkov, A. W., Fuchs, D., Wagner, J., Wiltsche, H., Stangl, C., Fauler, G.,
Voitic, G., Thaler, A. & Hacker, V. 2014. Thermal-runaway experiments on
consumer Li-ion batteries with metal-oxide and olivin-type cathodes. RSC
Advances, 4, 3633-3642.
Golubkov, A. W., Scheikl, S., Planteu, R., Voitic, G., Wiltsche, H., Stangl, C.,
Fauler, G., Thaler, A. & Hacker, V. 2015. Thermal runaway of commercial
18650 Li-ion batteries with LFP and NCA cathodes - impact of state of
charge and overcharge. RSC Advances, 5, 57171-57186.
Goodenough, J. B. & Kim, Y. 2009. Challenges for Rechargeable Li Batteries.
Chemistry of Materials, 22, 587-603.

221
Hales, P. 2006. Dell laptop explodes at Japanese conference [Online]. Available:
http://www.theinquirer.net/inquirer/news/1042700/dell-laptop-explodes-
japanese-conference [Accessed 24 May 2014].
Hatchard, T. D., Macneil, D. D., Basu, A. & Dahn, J. R. 2001. Thermal Model of
Cylindrical and Prismatic Lithium-Ion Cells. Journal of The
Electrochemical Society, 148, A755-A761.
Hse. 2009. Company fined £150,000 over major Preston chemical fire [Online].
Available: http://www.hse.gov.uk/press/2009/coinw001veolia09.htm
[Accessed 31 May 2014].
Hsieh, T.-Y., Duh, Y.-S. & Kao, C.-S. 2014. Evaluation of thermal hazard for
commercial 14500 lithium-ion batteries. Journal of Thermal Analysis and
Calorimetry, 116, 1491-1495.
Huria, T. 2012. Rechargeable lithium battery energy storage systems for vehicular
applications. Ph.D, Universita Di Pisa.
Ishikawa, H., Mendoza, O., Sone, Y. & Umeda, M. 2012. Study of thermal
deterioration of lithium-ion secondary cell using an accelerated rate
calorimeter (ARC) and AC impedance method. Journal of Power Sources,
198, 236-242.
Jhu, C.-Y., Wang, Y.-W., Shu, C.-M., Chang, J.-C. & Wu, H.-C. 2011a. Thermal
explosion hazards on 18650 lithium ion batteries with a VSP2 adiabatic
calorimeter. Journal of Hazardous Materials, 192, 99-107.
Jhu, C.-Y., Wang, Y.-W., Wen, C.-Y. & Shu, C.-M. 2012. Thermal runaway
potential of LiCoO2 and Li(Ni1/3Co1/3Mn1/3)O2 batteries determined with
adiabatic calorimetry methodology. Applied Energy, 100, 127-131.
Jhu, C. Y., Wang, Y. W., Wen, C. Y., Chiang, C. C. & Shu, C. M. 2011b. Self-
reactive rating of thermal runaway hazards on 18650 lithium-ion batteries.
Journal of Thermal Analysis and Calorimetry, 106, 159-163.
Kelion, L. 2014. Panasonic recalls laptop and tablet batteries. BBC News.
Kim, G.-H. & Pesaran, A. 2007. Analysis of Heat Dissipation in Li-Ion Cells &
Modules for Modeling of Thermal Runaway. The 3rd International
Symposium on Large Lithium Ion Battery Technology and Application. Long
Beach, California.
Kim, G.-H., Pesaran, A. & Smith, K. 2008. Thermal Abuse Modeling of Li-Ion
Cells and Propagation in Modules. The 4th International Symposium on
Large Lithium Ion Battery Technology and Application. Tampa, Florida.
Kim, G.-H., Pesaran, A. & Spotnitz, R. 2007. A three-dimensional thermal abuse
model for lithium-ion cells. Journal of Power Sources, 170, 476-489.

222
Kim, S. U., Albertus, P., Cook, D., Monroe, C. W. & Christensen, J. 2014.
Thermoelectrochemical simulations of performance and abuse in 50-Ah
automotive cells. Journal of Power Sources, 268, 625-633.
Kitoh, K. & Nemoto, H. 1999. 100 Wh Large size Li-ion batteries and safety tests.
Journal of Power Sources, 81–82, 887-890.
Kossoy, A. & Koludarova, E. 1995. Specific features of kinetics evaluation in
calorimetric studies of runaway reactions. Journal of Loss Prevention in the
Process Industries, 8, 229-235.
Lamb, J. & Orendorff, C. J. 2014. Evaluation of mechanical abuse techniques in
lithium ion batteries. Journal of Power Sources, 247, 189-196.
Lamb, J., Orendorff, C. J., Steele, L. a. M. & Spangler, S. W. 2015. Failure
propagation in multi-cell lithium ion batteries. Journal of Power Sources,
283, 517-523.
Lancasteronline. 2014. Exploding laptop battery sparks apartment fire in New
Holland [Online]. Available:
http://lancasteronline.com/news/local/exploding-laptop-battery-sparks-
apartment-fire-in-new-holland/article_ffbf110c-b2ea-11e3-9c1d-
0017a43b2370.html [Accessed 1 June 2014 2014].
Larsson, F., Andersson, P., Blomqvist, P., Lorén, A. & Mellander, B.-E. 2014.
Characteristics of lithium-ion batteries during fire tests. Journal of Power
Sources, 271, 414-420.
Larsson, F. & Mellander, B.-E. 2012. Energy storage system safety in electrified
vehicles. Poster presented at Second International Conference on Fires in
Vehicles. Chicago, USA.
Larsson, F. & Mellander, B.-E. 2014. Abuse by External Heating, Overcharge and
Short Circuiting of Commercial Lithium-Ion Battery Cells. Journal of The
Electrochemical Society, 161, A1611-A1617.
Lee, C. H., Bae, S. J. & Jang, M. 2015. A study on effect of lithium ion battery
design variables upon features of thermal-runaway using mathematical
model and simulation. Journal of Power Sources, 293, 498-510.
Lee, Y. & Kim, S. 2016. Samsung Kills Off Note 7 After Second Round of Battery
Fires [Online]. Available: https://www.bloomberg.com/news/articles/2016-
10-11/samsung-ends-production-of-note-7-after-global-recall-new-fires
[Accessed 22 January 2017].
Leising, R. A., Palazzo, M. J., Takeuchi, E. S. & Takeuchib, K. J. 2001. Abuse
Testing of Lithium-Ion Batteries Characterization of the Overcharge
Reaction of LiCoO2ÕGraphite Cells. Journal of The Electrochemical
Society, 148, A838-A844.
223
Levy, S. C. & Bro, P. 1994. Battery Hazards and Accident Prevention, Springer.
Linden, D. 2001. Basic Concepts. In: LINDEN, D. & REDDY, T. B. (eds.)
Linden’s Handbook of Batteries. Third ed.: McGraw Hill Professional,
Access Engineering.
Lisbona, D. & Snee, T. 2011. A review of hazards associated with primary lithium
and lithium-ion batteries. Process Safety and Environmental Protection, 89,
434-442.
Lopez, C. F., Jeevarajan, J. A. & Mukherjee, P. P. 2015a. Characterization of
Lithium-Ion Battery Thermal Abuse Behavior Using Experimental and
Computational Analysis. Journal of The Electrochemical Society, 162,
A2163-A2173.
Lopez, C. F., Jeevarajan, J. A. & Mukherjee, P. P. 2015b. Experimental Analysis of
Thermal Runaway and Propagation in Lithium-Ion Battery Modules.
Journal of The Electrochemical Society, 162, A1905-A1915.
Lowy, J. 2010. Hazard of lithium batteries on planes sparks debate [Online].
Available: http://www.nbcnews.com/id/39852461/ns/travel-news/t/hazard-
lithium-batteries-planes-sparks-debate/#.VGTV5_msVfA [Accessed 15
November 2014].
Lowy, J. & Freed, J. 2013. Boeing 787 battery fire was difficult to control through
intense smoke, documents show [Online]. Available:
http://www.huffingtonpost.ca/2013/03/07/boeing-787-battery-fire-
w_n_2831956.html?utm_hp_ref=canada-business [Accessed 5 May 2014].
Lu, L., Han, X., Li, J., Hua, J. & Ouyang, M. 2013a. A review on the key issues for
lithium-ion battery management in electric vehicles. Journal of Power
Sources, 226, 272-288.
Lu, T.-Y., Chiang, C.-C., Wu, S.-H., Chen, K.-C., Lin, S.-J., Wen, C.-Y. & Shu, C.-
M. 2013b. Thermal hazard evaluations of 18650 lithium-ion batteries by an
adiabatic calorimeter. Journal of Thermal Analysis and Calorimetry, 114,
1083-1088.
Lyon, R. E. & Walters, R. N. 2016. Energetics of lithium ion battery failure.
Journal of Hazardous Materials, 318, 164-172.
Macneil, D. D., Christensen, L., Landucci, J., Paulsen, J. M. & Dahn, J. R. 2000. An
Autocatalytic Mechanism for the Reaction of Li x CoO2 in Electrolyte at
Elevated Temperature. Journal of The Electrochemical Society, 147, 970-
979.
Macneil, D. D. & Dahn, J. R. 2001. Test of Reaction Kinetics Using Both
Differential Scanning and Accelerating Rate Calorimetries As Applied to
the Reaction of LixCoO2 in Non-aqueous Electrolyte. The Journal of
Physical Chemistry A, 105, 4430-4439.

224
Maleki, H., Deng, G., Anani, A. & Howard, J. 1999. Thermal Stability Studies of
Li-Ion Cells and Components. Journal of The Electrochemical Society, 146,
3224 - 3229.
Maloney, T. 2016. Lithium Battery Thermal Runaway Vent Gas Analysis. U.S.
Department of Transportation.
Mendoza-Hernandez, O. S., Ishikawa, H., Nishikawa, Y., Maruyama, Y. & Umeda,
M. 2015. Cathode material comparison of thermal runaway behavior of Li-
ion cells at different state of charges including over charge. Journal of
Power Sources, 280, 499-504.
Mikolajczak, C., Kahn, M., White, K. & Long, R. T. 2011. Lithium-Ion Batteries
Hazard and Use Assessment. Massachusetts, United States: Exponent
Failure Analysis Associates, Inc.
Mit Electric Vehicle Team. 2008. A Guide to Understanding Battery Specifications
[Online]. Available:
http://web.mit.edu/evt/summary_battery_specifications.pdf [Accessed 2
March 2015].
Nishi, Y. 2001. The development of lithium ion secondary batteries. The Chemical
Record, 1, 406-413.
Ohsaki, T., Kishi, T., Kuboki, T., Takami, N., Shimura, N., Sato, Y., Sekino, M. &
Satoh, A. 2005. Overcharge reaction of lithium-ion batteries. Journal of
Power Sources, 146, 97-100.
Pasquier, A. D., Disma, F., Bowmer, T., Gozdz, A. S., Amatucci, G. & Tarascon, J.-
M. 1998. Differential Scanning Calorimetry Study of the Reactivity of
Carbon Anodes in Plastic Li-Ion Batteries. J. Electrochem. Soc., 145, 472-
477.
Ping, P., Wang, Q., Huang, P., Li, K., Sun, J., Kong, D. & Chen, C. 2015. Study of
the fire behavior of high-energy lithium-ion batteries with full-scale burning
test. Journal of Power Sources, 285, 80-89.
Ping, P., Wang, Q., Huang, P., Sun, J. & Chen, C. 2014. Thermal behaviour
analysis of lithium-ion battery at elevated temperature using deconvolution
method. Applied Energy, 129, 261-273.
R.E.A. 2015. Energy Storage in the UK - An Overview. London: Renewable
Energy Association.
Randall, M. 2017. Tesla Flips the Switch on the Gigafactory [Online]. Bloomberg.
Available: https://www.bloomberg.com/news/articles/2017-01-04/tesla-
flips-the-switch-on-the-gigafactory?cmpid=socialflow-facebook-
business&utm_content=business&utm_campaign=socialflow-
organic&utm_source=facebook&utm_medium=social [Accessed 14 January
2017].
225
Randall, T. 2016. Here’s How Electric Cars Will Cause the Next Oil Crisis
[Online]. Bloomberg. Available: http://www.bloomberg.com/features/2016-
ev-oil-crisis/ [Accessed 1 March 2016].
Rezvanizaniani, S. M., Liu, Z., Chen, Y. & Lee, J. 2014. Review and recent
advances in battery health monitoring and prognostics technologies for
electric vehicle (EV) safety and mobility. Journal of Power Sources, 256,
110-124.
Ribiere, P., Grugeon, S., Morcrette, M., Boyanov, S., Laruelle, S. & Marlair, G.
2012. Investigation on the fire-induced hazards of Li-ion battery cells by fire
calorimetry. Energy & Environmental Science, 5, 5271-5280.
Richard, M. N. & Dahn, J. R. 1999a. Accelerating Rate Calorimetry Study on the
Thermal Stability of Lithium Intercalated Graphite in Electrolyte. Journal of
The Electrochemical Society, 146, 2068-2077.
Richard, M. N. & Dahn, J. R. 1999b. Accelerating Rate Calorimetry Study on the
Thermal Stability of Lithium Intercalated Graphite in Electrolyte. II.
Modeling the Results and Predicting Differential Scanning Calorimeter
Curves. Journal of The Electrochemical Society, 146, 2078-2084.
Richard, M. N. & Dahn, J. R. 1999c. Predicting electrical and thermal abuse
behaviours of practical lithium-ion cells from accelerating rate calorimeter
studies on small samples in electrolyte. Journal of Power Sources, 79, 135-
142.
Robbins, J. 2007. Clean Harbors continues to operate; Company says it has no
plans to reopen battery recycling operations in Thorold [Online]. Available:
http://www.wellandtribune.ca/2007/12/28/clean-harbors-continues-to-
operate-company-says-it-has-no-plans-to-reopen-battery-recycling-
operations-in-thorold [Accessed 18 April 2014].
Roth, E. P. & Doughty, D. H. 2004. Thermal abuse performance of high-power
18650 Li-ion cells. Journal of Power Sources, 128, 308-318.
Roth, E. P. & Nagasubramanian, G. 2000. Thermal Stability of Electrodes in
Lithium-Ion Cells. Sandia National Laboratories.
Sato, N. 2001. Thermal behavior analysis of lithium-ion batteries for electric and
hybrid vehicles. Journal of Power Sources, 99, 70-77.
Saw, L. H., Ye, Y. & Tay, A. a. O. 2016. Integration issues of lithium-ion battery
into electric vehicles battery pack. Journal of Cleaner Production, 113,
1032-1045.
Scrosati, B. & Garche, J. 2010. Lithium batteries: Status, prospects and future.
Journal of Power Sources, 195, 2419-2430.

226
Sin, B. 2016. Samsung Knew Note 7 Had A Dangerous Design, But Took The Risk
Anyway, Say Analysts [Online]. Forbes. Available:
http://www.forbes.com/sites/bensin/2016/12/04/samsung-knew-note-7-had-
a-dangerous-design-but-took-the-risk-anyway-say-
analysts/?utm_source=FBPAGE&utm_medium=social&utm_term=InstantA
rticle&utm_content=704236161&utm_campaign=sprinklrForbesMainFB#4
8aa5d664995 [Accessed 22 January 2017].
Somandepalli, V., Marr, K. C. & Horn, Q. 2013. Explosion Hazards Due to Failures
of Lithium-Ion Batteries. 9th Global Congress on Process Safety. Texas.
Spotnitz, R. & Franklin, J. 2003. Abuse behavior of high-power, lithium-ion cells.
Journal of Power Sources, 113, 81-100.
Spotnitz, R. M., Weaver, J., Yeduvaka, G., Doughty, D. H. & Roth, E. P. 2007.
Simulation of abuse tolerance of lithium-ion battery packs. Journal of
Power Sources, 163, 1080-1086.
Stull, D. R. 1977. Fundamentals of fire and explosion, New York, American
Institute of Chemical Engineers.
Thermal Hazard Technology 2013. The Accelerating Rate Calorimeter EV+ ARC
Operations Manual.
Tmtv Bctv 2009. Explosions and fire at battery recycling plant in Trail, BC - TMTV
News.
Tobishima, S.-I. & Yamaki, J.-I. 1999. A consideration of lithium cell safety.
Journal of Power Sources, 81–82, 882-886.
Torabi, F. & Esfahanian, V. 2011. Study of Thermal–Runaway in Batteries I.
Theoretical Study and Formulation. Journal of The Electrochemical Society,
158, A850-A858.
Townsend, D. I. & Tou, J. C. 1980. Thermal hazard evaluation by an accelerating
rate calorimeter. Thermochimica Acta, 37, 1-30.
Väyrynen, A. & Salminen, J. 2012. Lithium ion battery production. The Journal of
Chemical Thermodynamics, 46, 80-85.
Venugopal, G. 2001. Characterization of thermal cut-off mechanisms in prismatic
lithium-ion batteries. Journal of Power Sources, 101, 231-237.
Verma, P., Maire, P. & Novák, P. 2010. A review of the features and analyses of the
solid electrolyte interphase in Li-ion batteries. Electrochimica Acta, 55,
6332-6341.
Vetter, M. & Rohr, L. 2014. Lithium-Ion Batteries for Storage of Renewable
Energies and Electric Grid Backup. In: PISTOIA, G. (ed.) Lithium-Ion
Batteries: Advances and Applications. First ed. Amsterdam: Elsevier.

227
Von Sacken, U., Nodwell, E., Sundler, A. & Dahn, J. R. 1994. Comparative thermal
stability of carbon intercalation anodes and lithium metal anodes for
rechargeable lithium batteries. Solid State Ionics, 69, 284-290.
Wald, M. L. 2014. Safety Agency Says New Tests Are Needed on Boeing Battery.
New York Times, 2014 May 23.
Wang, Q., Ping, P., Sun, J. & Chen, C. 2011. The effect of mass ratio of electrolyte
and electrodes on the thermal stabilities of electrodes used in lithium ion
battery. Thermochimica Acta, 517, 16-23.
Wang, Q., Ping, P., Zhao, X., Chu, G., Sun, J. & Chen, C. 2012. Thermal runaway
caused fire and explosion of lithium ion battery. Journal of Power Sources,
208, 210-224.
Wang, Q., Sun, J. & Chen, C. 2009. Effects of solvents and salt on the thermal
stability of lithiated graphite used in lithium ion battery. Journal of
Hazardous Materials, 167, 1209-1214.
Wang, Q., Sun, J., Yao, X. & Chen, C. 2006. Thermal Behavior of Lithiated
Graphite with Electrolyte in Lithium-Ion Batteries. Journal of The
Electrochemical Society, 153, A329 - A333.
Wen, C.-Y., Jhu, C.-Y., Wang, Y.-W., Chiang, C.-C. & Shu, C.-M. 2012. Thermal
runaway features of 18650 lithium-ion batteries for LiFePO4 cathode
material by DSC and VSP2. Journal of Thermal Analysis and Calorimetry,
109, 1297-1302.
Wilke, S., Schweitzer, B., Khateeb, S. & Al-Hallaj, S. 2017. Preventing thermal
runaway propagation in lithium ion battery packs using a phase change
composite material: An experimental study. Journal of Power Sources, 340,
51-59.
Yang, H., Amiruddin, S., Bang, H. J., Sun, Y.-K. & Prakash, J. 2006. A Review of
Li-Ion Cell Chemistries and Their Potential Use in Hybrid Electric Vehicles.
Journal of Industrial and Engineering Chemistry, 12, 12-38.
Young, A. 2013. Watch This Video Of A Tesla Model S Fire In The City Of Merida,
Yucatan State, Mexico [Online]. International Business Times. Available:
http://www.ibtimes.com/watch-video-tesla-model-s-fire-city-merida-
yucatan-state-mexico-1444006 [Accessed 23 January 2017].
Zhang, Z., Fouchard, D. & Rea, J. R. 1998. Differential scanning calorimetry
material studies: implications for the safety of lithium-ion cells. Journal of
Power Sources, 70, 16-20.

228
Appendix I: Numerical Model Direct
Verification Direct verification of our model was conducted and compared against simulation
results by Kim et al. (2007) to ensure the consistency of the results produced.
Simulated temperature profile at constant temperature abuse of 150 oC and 155
oC
as reported by Kim et al. (2007).
Simulated temperature profile at constant temperature abuse of 150 oC and 155
oC
from our model.