Experimental Probability MODULE 12
32
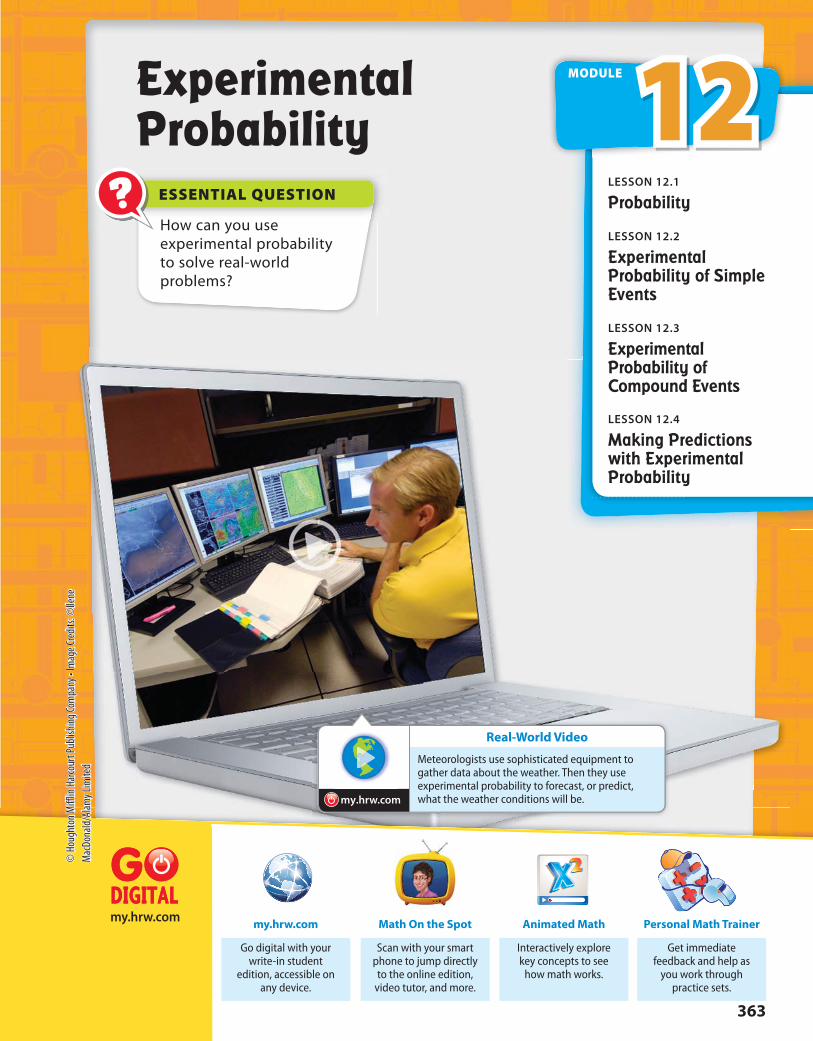
ESSENTIAL QUESTION ? Real-World Video my.hrw.com How can you use experimental probability to solve real-world problems? Experimental Probability Get immediate feedback and help as you work through practice sets. Personal Math Trainer Interactively explore key concepts to see how math works. Animated Math Go digital with your write-in student edition, accessible on any device. my.hrw.com Scan with your smart phone to jump directly to the online edition, video tutor, and more. Math On the Spot my.hrw.com 12 MODULE LESSON 12. 1 Probability LESSON 12. 2 Experimental Probability of Simple Events LESSON 12. 3 Experimental Probability of Compound Events LESSON 12. 4 Making Predictions with Experimental Probability Meteorologists use sophisticated equipment to gather data about the weather. Then they use experimental probability to forecast, or predict, what the weather conditions will be. 363 © Houghton Mifflin Harcourt Publishing Company • Image Credits: ©Ilene MacDonald/Alamy Limited
Transcript of Experimental Probability MODULE 12
ESSENTIAL QUESTION?
Real-World Video
my.hrw.com
How can you use experimental probability to solve real-world problems?
Experimental Probability
Get immediate feedback and help as
you work through practice sets.
Personal Math Trainer
Interactively explore key concepts to see
how math works.
Animated Math
Go digital with your write-in student
edition, accessible on any device.
my.hrw.com
Scan with your smart phone to jump directly to the online edition,
video tutor, and more.
Math On the Spotmy.hrw.com
12MODULE
LESSON 12.1
Probability
LESSON 12.2
Experimental Probability of Simple Events
LESSON 12.3
Experimental Probability of Compound Events
LESSON 12.4
Making Predictions with Experimental Probability
Meteorologists use sophisticated equipment to gather data about the weather. Then they use experimental probability to forecast, or predict, what the weather conditions will be.
363
© H
ough
ton
Miff
lin H
arco
urt P
ublis
hing
Com
pany
• Im
age
Cred
its: ©
Ilene
Mac
Dona
ld/A
lam
y Li
mite
d
Reading Start-Up
Active ReadingPyramid Before beginning the module, create a
rectangular pyramid to help you organize what you
learn. Label each side with one of the lesson titles
from this module. As you study each lesson, write
important ideas, such as vocabulary, properties, and
formulas, on the appropriate side.
VocabularyReview Words
✔ data (datos)
✔ observation (observación)✔ percent (porcentaje)
✔ ratio (razón)
Preview Words complement
(complemento)
compound event (suceso compuesto)
event (suceso)
experiment (experimento) experimental probability
(probabilidad experimental)
outcome (resultado)
probability (probabilidad)
simple event (suceso simple)
simulation (simulación)
trial (prueba)
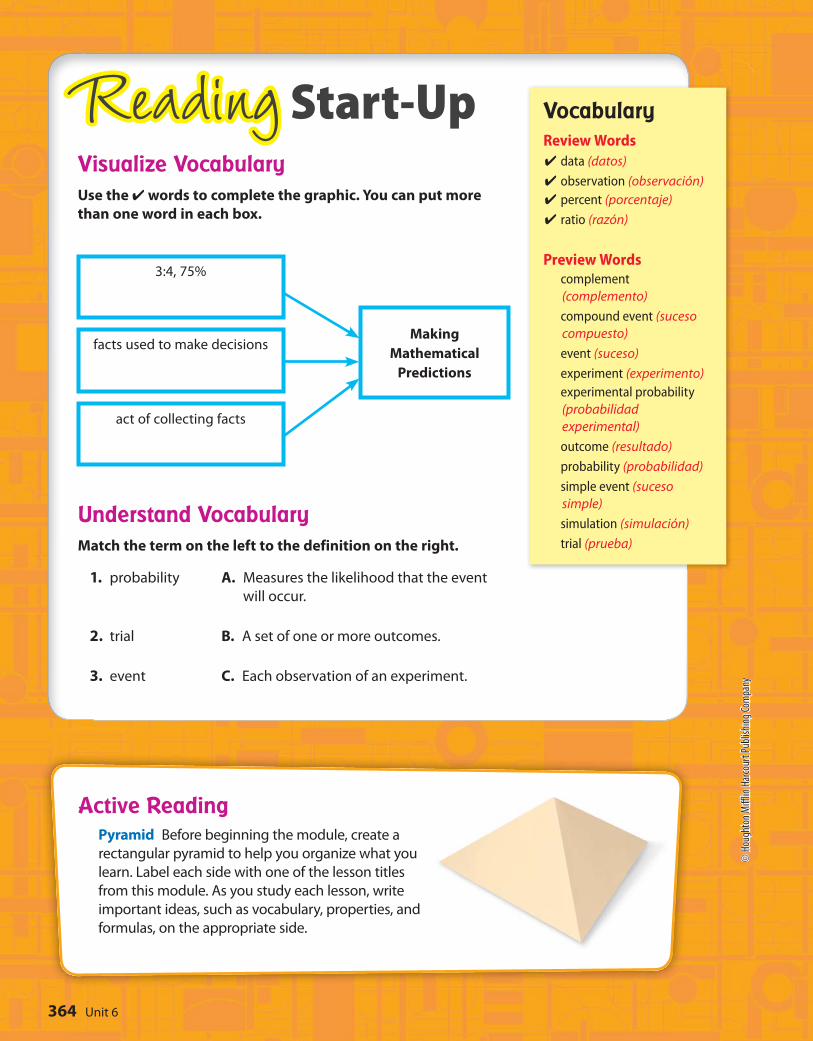
Visualize VocabularyUse the ✔ words to complete the graphic. You can put more
than one word in each box.
Understand VocabularyMatch the term on the left to the definition on the right.
1. probability A. Measures the likelihood that the event
will occur.
2. trial B. A set of one or more outcomes.
3. event C. Each observation of an experiment.
3:4, 75%
facts used to make decisions
act of collecting facts
Making
Mathematical
Predictions
Unit 6364
© H
ough
ton
Miff
lin H
arco
urt P
ublis
hing
Com
pany
YOUAre Ready?Personal
Math Trainer
Online Assessment and
Interventionmy.hrw.com
Complete these exercises to review skills you will need
for this module.
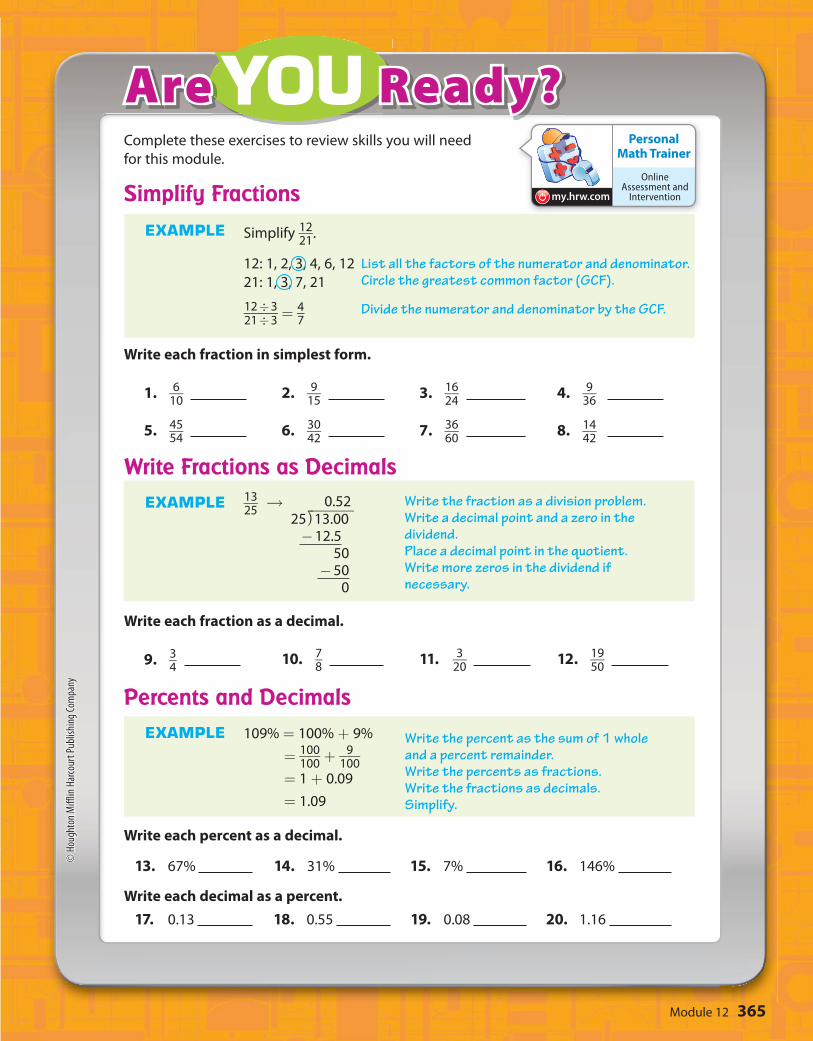
Simplify FractionsEXAMPLE Simplify 12
__ 21
.
12: 1, 2, 3, 4, 6, 12
21: 1, 3, 7, 21
12 ÷ 3 _____
21 ÷ 3 = 4 _
7
Write each fraction in simplest form.
1. 6 __ 10
2. 9 __ 15
3. 16 __
24 4. 9 __
36
5. 45 __
54 6. 30
__ 42
7. 36 __
60 8. 14
__ 42
Write Fractions as DecimalsEXAMPLE 13
__ 25
→
Write each fraction as a decimal.
9. 3 _ 4
10. 7 _ 8
11. 3 __ 20
12. 19 __
50
Percents and DecimalsEXAMPLE 109% = 100% + 9%
= 100 ___
100 + 9
___ 100
= 1 + 0.09
= 1.09
Write each percent as a decimal.
13. 67% 14. 31% 15. 7% 16. 146%
Write each decimal as a percent.
17. 0.13 18. 0.55 19. 0.08 20. 1.16
0.52 25 ⟌
⎯ 13.00 - 12.5 50 - 50 0
Write the percent as the sum of 1 whole and a percent remainder.Write the percents as fractions.Write the fractions as decimals.Simplify.
List all the factors of the numerator and denominator. Circle the greatest common factor (GCF).
Divide the numerator and denominator by the GCF.
Write the fraction as a division problem.Write a decimal point and a zero in the dividend.Place a decimal point in the quotient.Write more zeros in the dividend if necessary.
365Module 12
© H
ough
ton
Miff
lin H
arco
urt P
ublis
hing
Com
pany
YOUAre Ready? (cont'd)
Complete these exercises to review skills you will need for this module.
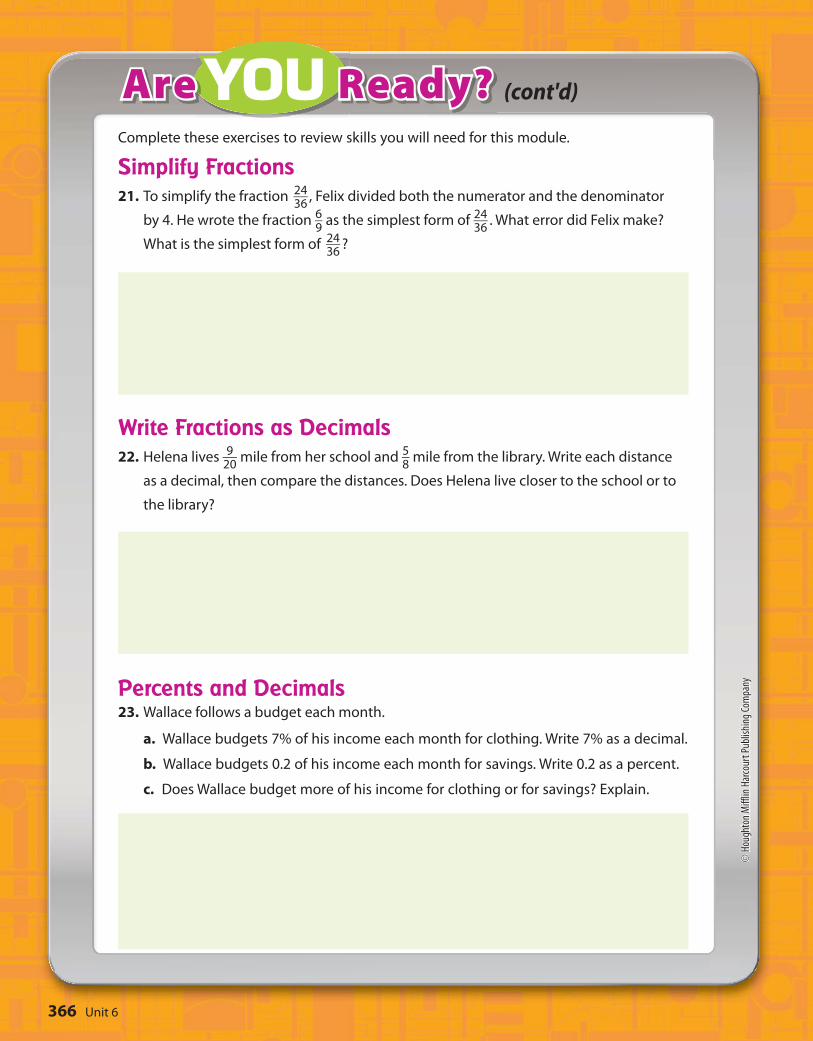
Simplify Fractions21. To simplify the fraction 24
__ 36
, Felix divided both the numerator and the denominator
by 4. He wrote the fraction 6 _ 9
as the simplest form of 24 __
36 . What error did Felix make?
What is the simplest form of 24 __
36 ?
Write Fractions as Decimals22. Helena lives 9 __
20 mile from her school and 5 _
8 mile from the library. Write each distance
as a decimal, then compare the distances. Does Helena live closer to the school or to
the library?
Percents and Decimals 23. Wallace follows a budget each month.
a. Wallace budgets 7% of his income each month for clothing. Write 7% as a decimal.
b. Wallace budgets 0.2 of his income each month for savings. Write 0.2 as a percent.
c. Does Wallace budget more of his income for clothing or for savings? Explain.
Unit 6366
© H
ough
ton
Miff
lin H
arco
urt P
ublis
hing
Com
pany
?
EXPLORE ACTIVITY
ESSENTIAL QUESTION
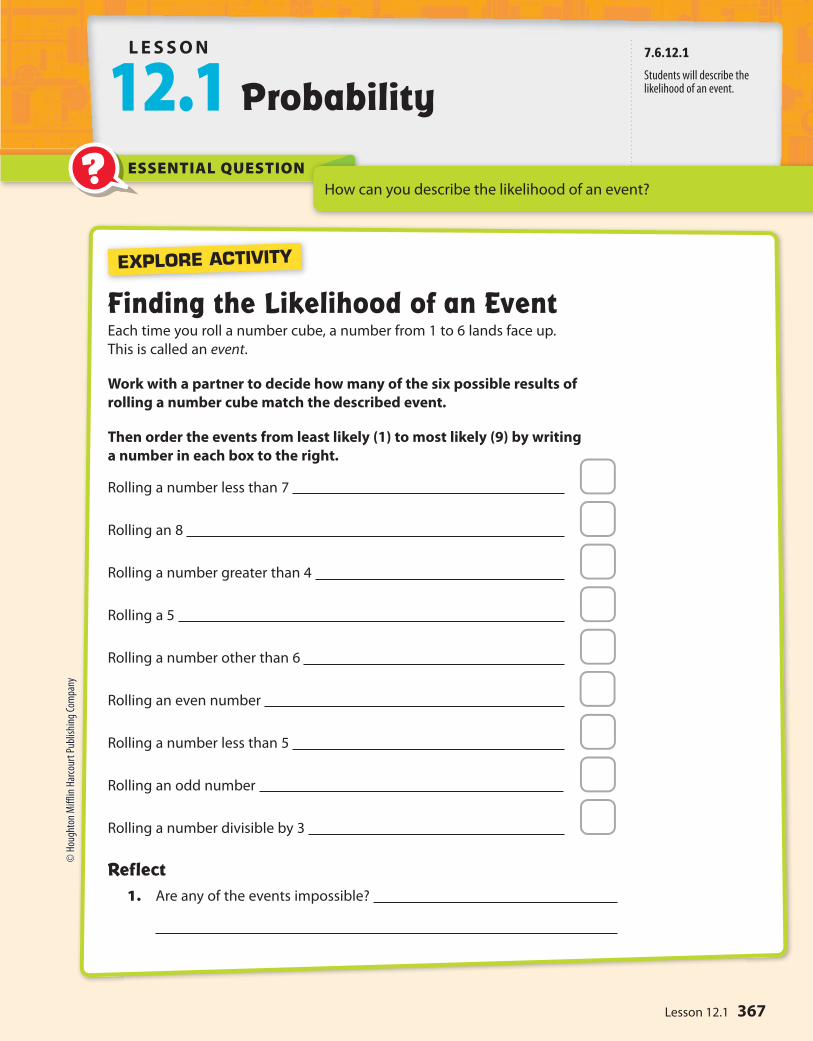
Finding the Likelihood of an EventEach time you roll a number cube, a number from 1 to 6 lands face up.
This is called an event.
Work with a partner to decide how many of the six possible results of
rolling a number cube match the described event.
Then order the events from least likely (1) to most likely (9) by writing
a number in each box to the right.
Rolling a number less than 7
Rolling an 8
Rolling a number greater than 4
Rolling a 5
Rolling a number other than 6
Rolling an even number
Rolling a number less than 5
Rolling an odd number
Rolling a number divisible by 3
Reflect1. Are any of the events impossible?
How can you describe the likelihood of an event?
L E S S O N
12.1 Probability
7.6.12.1
Students will describe the likelihood of an event.
367Lesson 12.1
© H
ough
ton
Miff
lin H
arco
urt P
ublis
hing
Com
pany

Math On the Spotmy.hrw.com
Describing EventsAn experiment is an activity involving chance in which results are observed.
Each observation of an experiment is a trial, and each result is an outcome.
A set of one or more outcomes is an event.
The probability of an event, written P(event), measures the likelihood that the
event will occur. Probability is a measure between 0 and 1 as shown on the
number line, and can be written as a fraction, a decimal, or a percent.
If the event is not likely to occur, the probability of the event is close to 0.
If an event is likely to occur, the event’s probability is closer to 1.
Tell whether each event is impossible, unlikely, as likely as not, likely, or
certain. Then, tell whether the probability is 0, close to 0, 1 _ 2
, close to 1, or 1.
You roll a six-sided number cube and
the number is 1 or greater.
This event is certain to happen.
Its probability is 1.
You roll two number cubes and the sum of the numbers is 3.
This event is unlikely to happen. Its probability is close to 0.
A bowl contains disks marked with the numbers 1 through 10. You close
your eyes and select a disk at random. You pick an odd number.
This event is as likely as not. The probability is 1 _ 2 .
A spinner has 8 equal sections marked
0 through 7. You spin and land on a
prime number.
This event is as likely as not. The probability is 1 _ 2 .
Reflect2. The probability of event A is 1 _
3 . The probability of event B is 1 _
4 . What can
you conclude about the two events?
EXAMPLE 1
A
B
C
D
Impossible Unlikely As likely as not Likely Certain
0
0
0% 50% 100%
0.5 1.0
1 _ 2
1
Is an event that is not certain an impossible
event? Explain.
Math TalkMathematical Processes
Because you can roll the numbers 1, 2, 3, 4, 5, and 6 on a number cube, there are 6 possible outcomes.
Remember that a prime number is a whole number greater than 1 and has exactly 2 divisors, 1 and itself.
Unit 6368
© H
ough
ton
Miff
lin H
arco
urt P
ublis
hing
Com
pany

Math On the Spot
my.hrw.com
Math Trainer
Online Assessment and Intervention
Personal
my.hrw.com
3. A hat contains pieces of paper marked with the numbers 1 through 16.
Tell whether picking an even number is impossible, unlikely, as likely as
not, likely, or certain. Tell whether the probability is 0, close to 0, 1 _ 2 , close
to 1, or 1.
YOUR TURN
Finding ProbabilityA sample space is the set of all possible
outcomes for an experiment. A sample space
can be small, such as the 2 outcomes when
a coin is flipped. Or a sample space can be
large, such as the possible number of Texas
Classic automobile license plates. Identifying
the sample space can help you calculate the
probability of an event.
What is the probability of rolling an even number on a standard
number cube?
Find the sample space for a standard number cube.
{1, 2, 3, 4, 5, 6}
Find the number of ways to roll an even number.
2, 4, 6
Find the probability of rolling an even number.
P(even) = number of ways to roll an even number
_____________________________ number of faces on a number cube
= 3 _ 6
= 1 _ 2
The probability of rolling an even number is 1 _ 2 .
EXAMPLEXAMPLE 2
STEP 1
STEP 2
STEP 3
Probability of An Event
P(event) = number of outcomes in the event ___________________________________ number of outcomes in the sample space
The event can occur 3 ways.
There are 6 possible outcomes.
Substitute values and simplify.
369Lesson 12.1
© H
ough
ton
Miff
lin H
arco
urt P
ublis
hing
Com
pany
Math On the Spotmy.hrw.com
Math Trainer
Online Assessment and Intervention
Personal
my.hrw.com
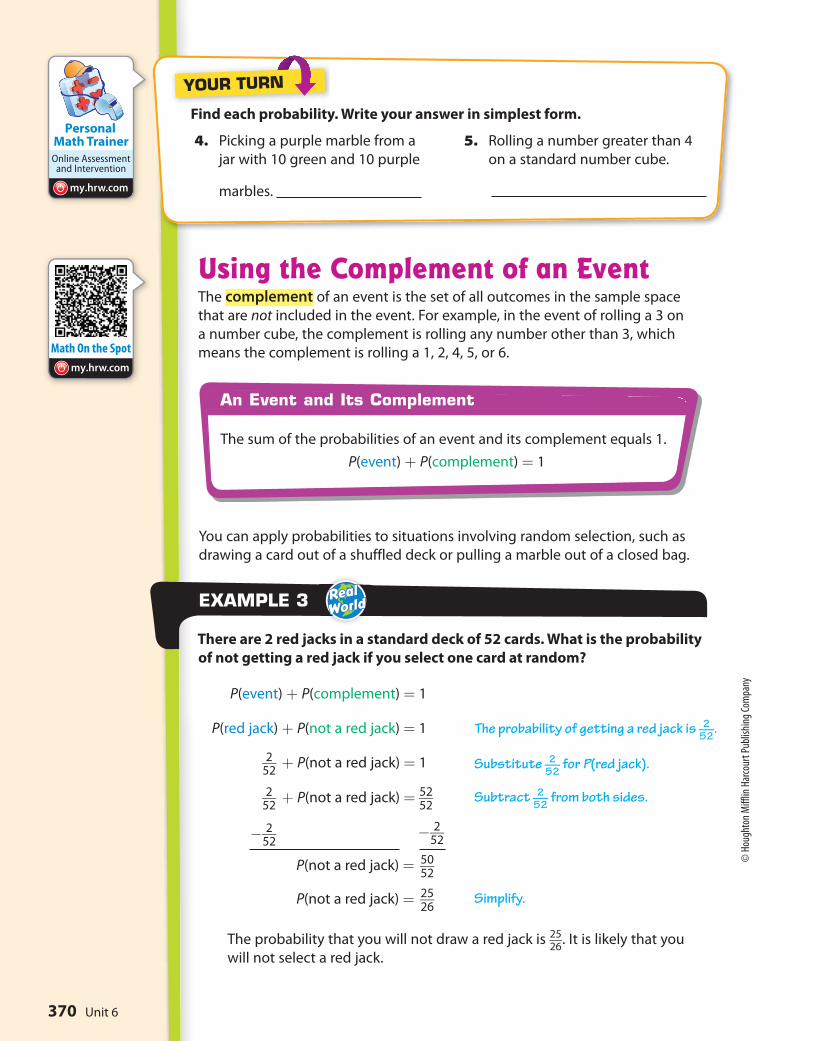
P(event) + P(complement) = 1
P(red jack) + P(not a red jack) = 1
2 __ 52
+ P(not a red jack) = 1
2 __ 52
+ P(not a red jack) = 52 __
52
- 2 __ 52
- 2 __ 52
P(not a red jack) = 50 __
52
P(not a red jack) = 25 __
26
The probability that you will not draw a red jack is 25 __
26 . It is likely that you
will not select a red jack.
Find each probability. Write your answer in simplest form.
YOUR TURN
Using the Complement of an EventThe complement of an event is the set of all outcomes in the sample space
that are not included in the event. For example, in the event of rolling a 3 on
a number cube, the complement is rolling any number other than 3, which
means the complement is rolling a 1, 2, 4, 5, or 6.
There are 2 red jacks in a standard deck of 52 cards. What is the probability
of not getting a red jack if you select one card at random?
EXAMPLE 3
4. Picking a purple marble from a
jar with 10 green and 10 purple
marbles.
5. Rolling a number greater than 4
on a standard number cube.
You can apply probabilities to situations involving random selection, such as
drawing a card out of a shuffled deck or pulling a marble out of a closed bag.
Substitute 2 ___
52 for P(red jack).
Subtract 2 ___
52 from both sides.
The probability of getting a red jack is 2 ___
52 .
An Event and Its Complement
The sum of the probabilities of an event and its complement equals 1.
P(event) + P(complement) = 1
Simplify.
Unit 6370
© H
ough
ton
Miff
lin H
arco
urt P
ublis
hing
Com
pany
Math Trainer
Online Assessment and Intervention
Personal
my.hrw.com
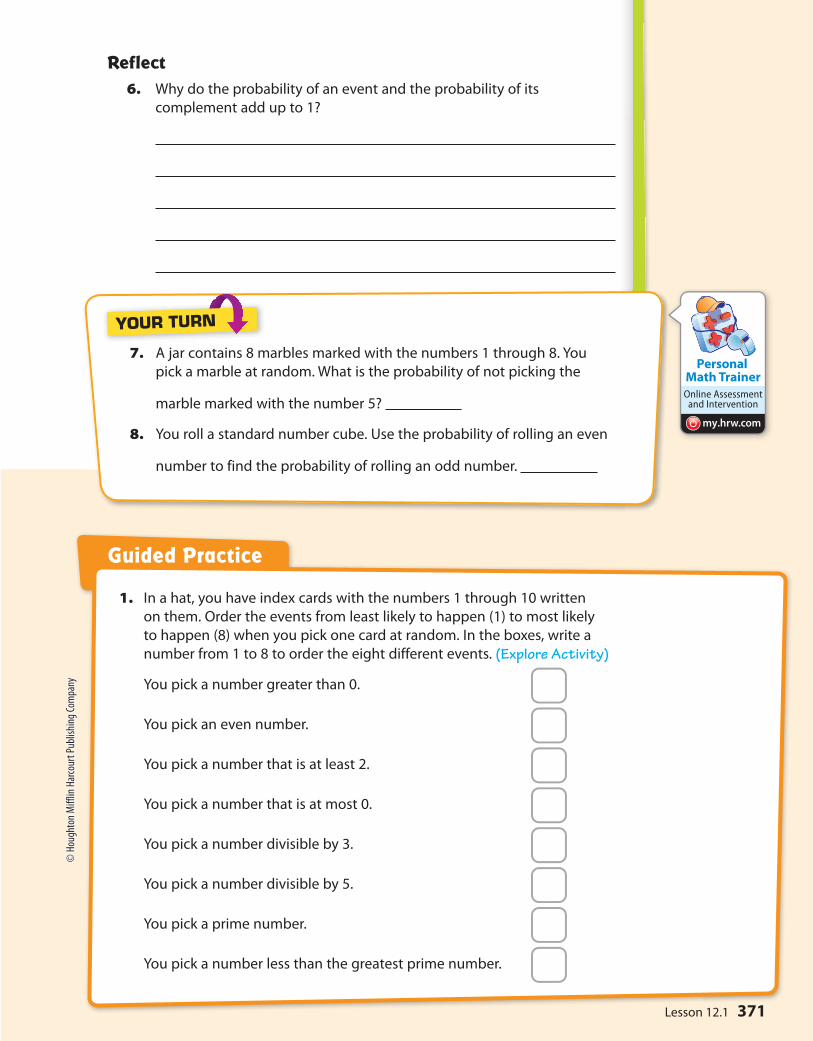
Reflect6. Why do the probability of an event and the probability of its
complement add up to 1?
7. A jar contains 8 marbles marked with the numbers 1 through 8. You
pick a marble at random. What is the probability of not picking the
marble marked with the number 5?
8. You roll a standard number cube. Use the probability of rolling an even
number to find the probability of rolling an odd number.
YOUR TURN
Guided Practice
1. In a hat, you have index cards with the numbers 1 through 10 written
on them. Order the events from least likely to happen (1) to most likely
to happen (8) when you pick one card at random. In the boxes, write a
number from 1 to 8 to order the eight different events. (Explore Activity)
You pick a number greater than 0.
You pick an even number.
You pick a number that is at least 2.
You pick a number that is at most 0.
You pick a number divisible by 3.
You pick a number divisible by 5.
You pick a prime number.
You pick a number less than the greatest prime number.
371Lesson 12.1
© H
ough
ton
Miff
lin H
arco
urt P
ublis
hing
Com
pany

Guided Practice
2. randomly picking a green card from a
standard deck of playing cards
3. randomly picking a red card from a standard
deck of playing cards
4. picking a number less than 15 from a jar
with papers labeled from 1 to 12
5. picking a number that is divisible by 5 from
a jar with papers labeled from 1 to 12
Find each probability. Write your answer in simplest form. (Example 2)
Use the complement to find each probability. (Example 3)
8. What is the probability of not rolling a 5 on
a standard number cube?
9. A spinner has 3 equal sections that are red,
white, and blue. What is the probability of
not landing on blue?
12. Describe an event that has a probability of 0% and an event that has a
probability of 100%.
ESSENTIAL QUESTION CHECK-IN??
10. A spinner has 5 equal sections marked 1
through 5. What is the probability of not
landing on 4?
11. There are 4 queens in a standard deck of 52
cards. You pick one card at random. What is
the probability of not picking a queen?
6. spinning a spinner that has 5 equal sections
marked 1 through 5 and landing on an even
number
7. picking a diamond from a standard deck of
playing cards which has 13 cards in each of
four suits: spades, hearts, diamonds and clubs
Determine whether each event is impossible, unlikely, as likely as not,
likely, or certain. Then, tell whether the probability is 0, close to 0, 1 _ 2
, close
to 1, or 1. (Example 1)
Unit 6372
© H
ough
ton
Miff
lin H
arco
urt P
ublis
hing
Com
pany
Personal Math Trainer
Online Assessment and
Interventionmy.hrw.com
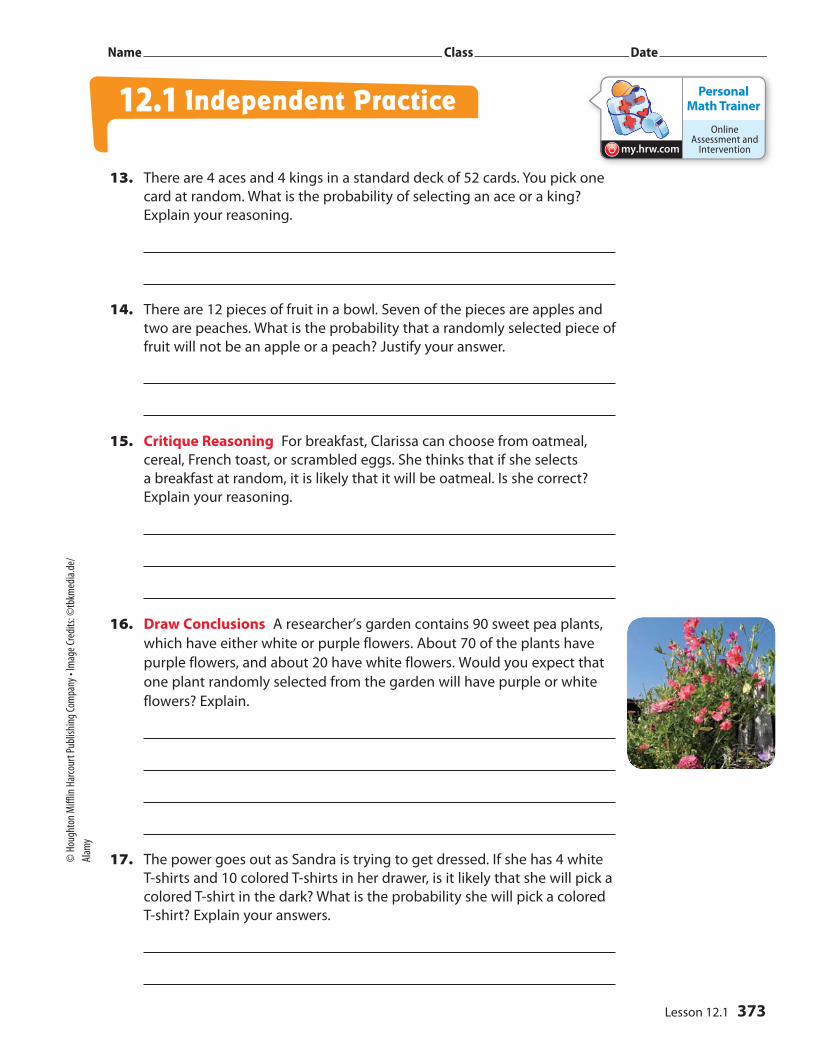
13. There are 4 aces and 4 kings in a standard deck of 52 cards. You pick one
card at random. What is the probability of selecting an ace or a king?
Explain your reasoning.
14. There are 12 pieces of fruit in a bowl. Seven of the pieces are apples and
two are peaches. What is the probability that a randomly selected piece of
fruit will not be an apple or a peach? Justify your answer.
15. Critique Reasoning For breakfast, Clarissa can choose from oatmeal,
cereal, French toast, or scrambled eggs. She thinks that if she selects
a breakfast at random, it is likely that it will be oatmeal. Is she correct?
Explain your reasoning.
16. Draw Conclusions A researcher’s garden contains 90 sweet pea plants,
which have either white or purple flowers. About 70 of the plants have
purple flowers, and about 20 have white flowers. Would you expect that
one plant randomly selected from the garden will have purple or white
flowers? Explain.
17. The power goes out as Sandra is trying to get dressed. If she has 4 white
T-shirts and 10 colored T-shirts in her drawer, is it likely that she will pick a
colored T-shirt in the dark? What is the probability she will pick a colored
T-shirt? Explain your answers.
Name Class Date
Independent Practice12.1
373Lesson 12.1
© H
ough
ton
Miff
lin H
arco
urt P
ublis
hing
Com
pany
• Im
age
Cred
its: ©
tbkm
edia
.de/
Alam
y

Work Area
18. James counts the hair colors of the 22 people in his class, including
himself. He finds that there are 4 people with blonde hair, 8 people with
brown hair, and 10 people with black hair. What is the probability that a
randomly chosen student in the class does not have red hair? Explain.
19. Persevere in Problem Solving A bag contains 8 blue coins and 6 red
coins. A coin is removed at random and replaced by three of the other color.
a. What is the probability that the removed coin is blue?
b. If the coin removed is blue, what is the probability of drawing a red
coin after three red coins are put in the bag to replace the blue one?
c. If the coin removed is red, what is the probability of drawing a red
coin after three blue coins are put in the bag to replace the red one?
20. Draw Conclusions Give an example of an event in which all of the
outcomes are not equally likely. Explain.
21. Critique Reasoning A box contains 150 black pens and 50 red pens.
Jose said the sum of the probability that a randomly selected pen will
not be black and the probability that the pen will not be red is 1. Explain
whether you agree.
22. Communicate Mathematical Ideas A spinner has 7 identical sections.
Two sections are blue, 1 is red, and 4 of the sections are green. Suppose
the probability of an event happening is 2 _ 7 . What does each number in the
ratio represent? What outcome matches this probability?
FOCUS ON HIGHER ORDER THINKING
Unit 6374
© H
ough
ton
Miff
lin H
arco
urt P
ublis
hing
Com
pany

? ESSENTIAL QUESTION
L E S S O N
12.2 Experimental Probability of Simple Events
Finding Experimental ProbabilityYou can toss a paper cup to demonstrate experimental probability.
Consider tossing a paper cup. Fill in the
Outcome column of the table with the three
different ways the cup could land.
Toss a paper cup twenty times. Record your
observations in the table.
Reflect1. Do the outcomes appear to be equally likely?
2. Describe the three outcomes using the words likely and unlikely.
3. Use the number of times each event occurred
to approximate the probability of each event.
4. Make a Prediction What do you think would
happen if you performed more trials?
5. What is the sum of the probabilities in 3?
A
B
How do you find the experimental probability of a simple event?
EXPLORE ACTIVITY
Outcome Number of Times
Outcome Experimental Probability
Open-end up
open-end up ___________
20 = _____
20
Open-end down open-end down
_____________ 20
= _____ 20
On its side
on its side _________ 20
= _____ 20
7.6.12.2
Students will find the experimental probability of a simple event.
375Lesson 12.2
© H
ough
ton
Miff
lin H
arco
urt P
ublis
hing
Com
pany
Math On the Spotmy.hrw.com
Animated Math
my.hrw.com
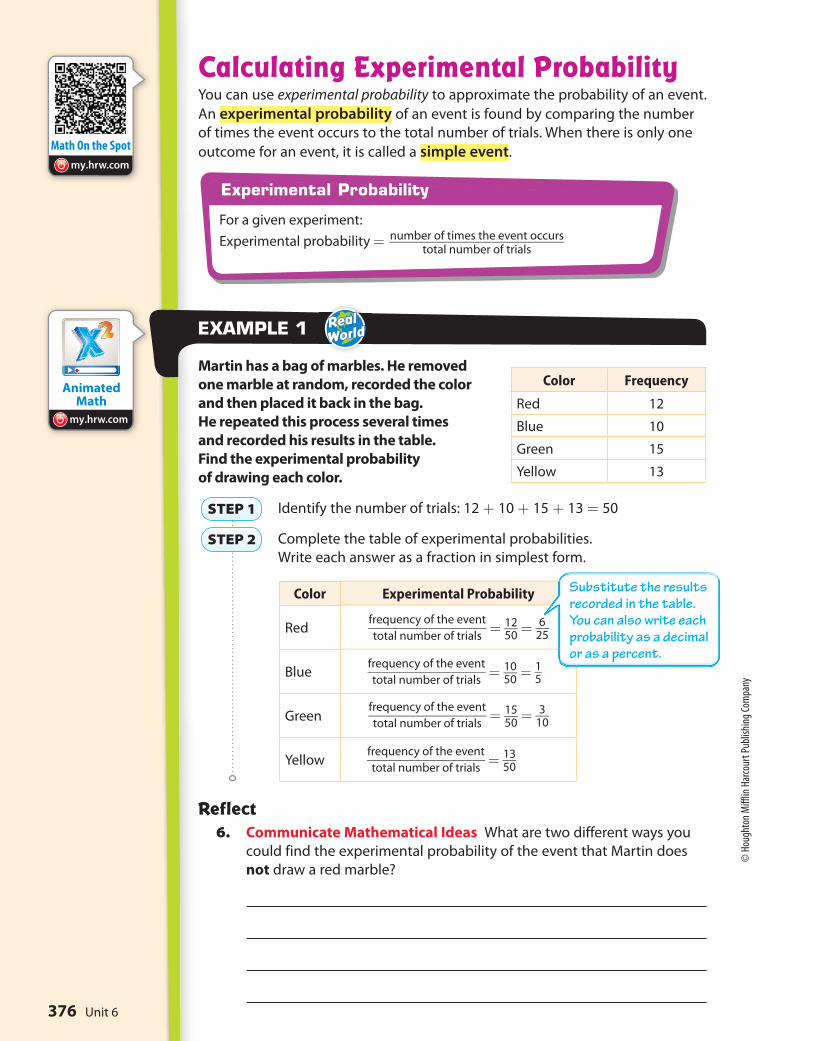
Calculating Experimental ProbabilityYou can use experimental probability to approximate the probability of an event.
An experimental probability of an event is found by comparing the number
of times the event occurs to the total number of trials. When there is only one
outcome for an event, it is called a simple event.
Martin has a bag of marbles. He removed
one marble at random, recorded the color
and then placed it back in the bag.
He repeated this process several times
and recorded his results in the table.
Find the experimental probability
of drawing each color.
Identify the number of trials: 12 + 10 + 15 + 13 = 50
Complete the table of experimental probabilities.
Write each answer as a fraction in simplest form.
Reflect6. Communicate Mathematical Ideas What are two different ways you
could find the experimental probability of the event that Martin does
not draw a red marble?
EXAMPLE 1
STEP 1
STEP 2
Color Frequency
Red 12
Blue 10
Green 15
Yellow 13
Color Experimental Probability
Red frequency of the event
_________________ total number of trials
= 12 __
50 = 6 __
25
Blue
frequency of the event
_________________ total number of trials
= 10 __
50 = 1 _
5
Green frequency of the event
_________________ total number of trials
= 15 __
50 = 3 __
10
Yellow
frequency of the event
_________________ total number of trials
= 13 __
50
Substitute the results recorded in the table. You can also write each probability as a decimal or as a percent.
Experimental Probability
For a given experiment:
Experimental probability = number of times the event occurs ________________________
total number of trials
Unit 6376
© H
ough
ton
Miff
lin H
arco
urt P
ublis
hing
Com
pany
My Notes
Math On the Spot
my.hrw.com
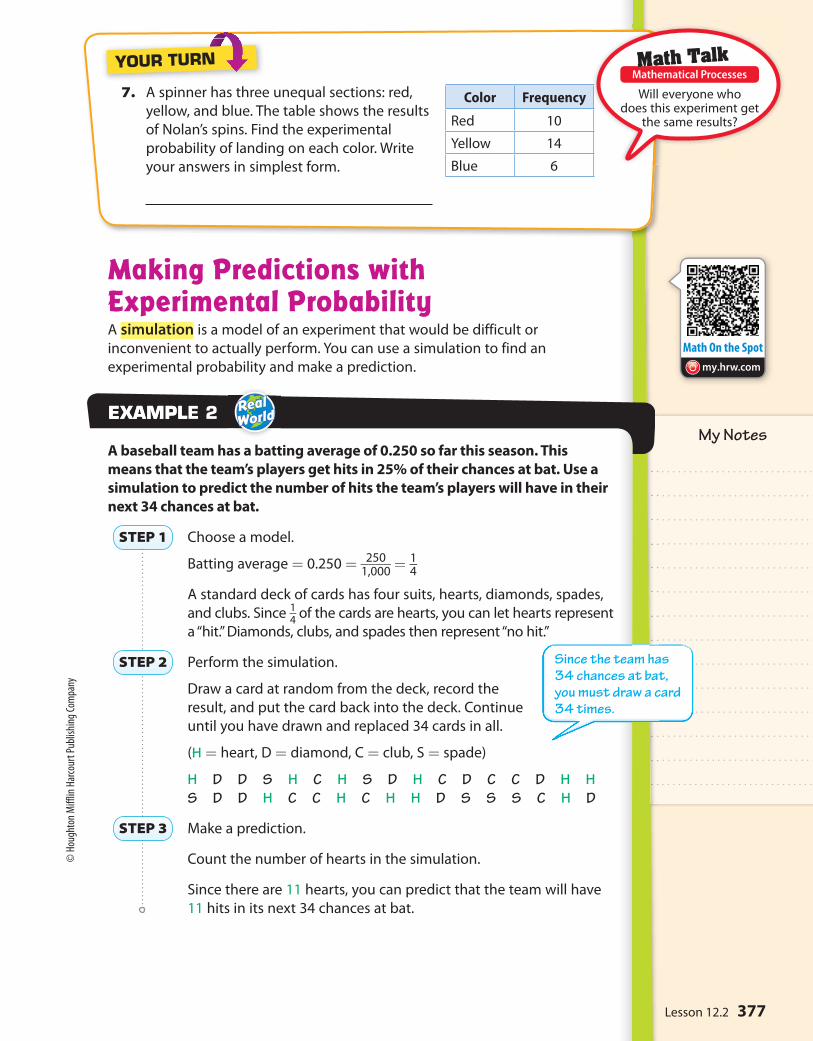
Making Predictions with Experimental Probability A simulation is a model of an experiment that would be difficult or
inconvenient to actually perform. You can use a simulation to find an
experimental probability and make a prediction.
A baseball team has a batting average of 0.250 so far this season. This
means that the team’s players get hits in 25% of their chances at bat. Use a
simulation to predict the number of hits the team’s players will have in their
next 34 chances at bat.
Choose a model.
Batting average = 0.250 = 250 ____
1,000 = 1 _
4
A standard deck of cards has four suits, hearts, diamonds, spades,
and clubs. Since 1 _ 4 of the cards are hearts, you can let hearts represent
a “hit.” Diamonds, clubs, and spades then represent “no hit.”
Perform the simulation.
Draw a card at random from the deck, record the
result, and put the card back into the deck. Continue
until you have drawn and replaced 34 cards in all.
(H = heart, D = diamond, C = club, S = spade)
H D D S H C H S D H C D C C D H H
S D D H C C H C H H D S S S C H D
Make a prediction.
Count the number of hearts in the simulation.
Since there are 11 hearts, you can predict that the team will have
11 hits in its next 34 chances at bat.
EXAMPLEXAMPLE 2
STEP 1
STEP 2
STEP 3
7. A spinner has three unequal sections: red,
yellow, and blue. The table shows the results
of Nolan’s spins. Find the experimental
probability of landing on each color. Write
your answers in simplest form.
YOUR TURN
Color Frequency
Red 10
Yellow 14
Blue 6
Will everyone who does this experiment get
the same results?
Math TalkMathematical Processes
Since the team has 34 chances at bat, you must draw a card 34 times.
377Lesson 12.2
© H
ough
ton
Miff
lin H
arco
urt P
ublis
hing
Com
pany

Math Trainer
Online Assessment and Intervention
Personal
my.hrw.com
8. A toy machine has equal numbers of red, white, and blue foam balls which
it releases at random. Ross wonders which color ball will be released next.
Describe how you could use a standard number cube to predict the answer.
YOUR TURN
Guided Practice
1. A spinner has four sections lettered A, B, C, and D. The table shows the
results of several spins. Find the experimental probability of spinning
each letter as a fraction in simplest form, a decimal, and a percent.
(Explore Activity and Example 1)
A: B:
C: D:
2. Rachel’s free-throw average for basketball is 60%. She wants to predict
how many times in the next 50 tries she will make a free throw. Describe
how she could use 10 index cards to predict the answer. (Example 2)
3. Essential Question Follow Up How do you find an experimental
probability of a simple event?
ESSENTIAL QUESTION CHECK-IN??
Letter A B C D
Frequency 14 7 11 8
Unit 6378
© H
ough
ton
Miff
lin H
arco
urt P
ublis
hing
Com
pany
Personal Math Trainer
Online Assessment and
Interventionmy.hrw.com
WIN
WIN
Anna
Meghan
Michael
Kate
Jon
Alisha
Cody
Gabe
Kaylee
Ryan
Kenna
Parker
Taylor
Shaw
Morgan
Bridget
Grace
Joel
Tessa
Leo
Name Class Date
Independent Practice12.2
4. Dree rolls a strike in 6 out of the 10 frames of bowling. What is the
experimental probability that Dree will roll a strike in the first frame of
the next game? Explain why a number cube would not be a good way to
simulate this situation.
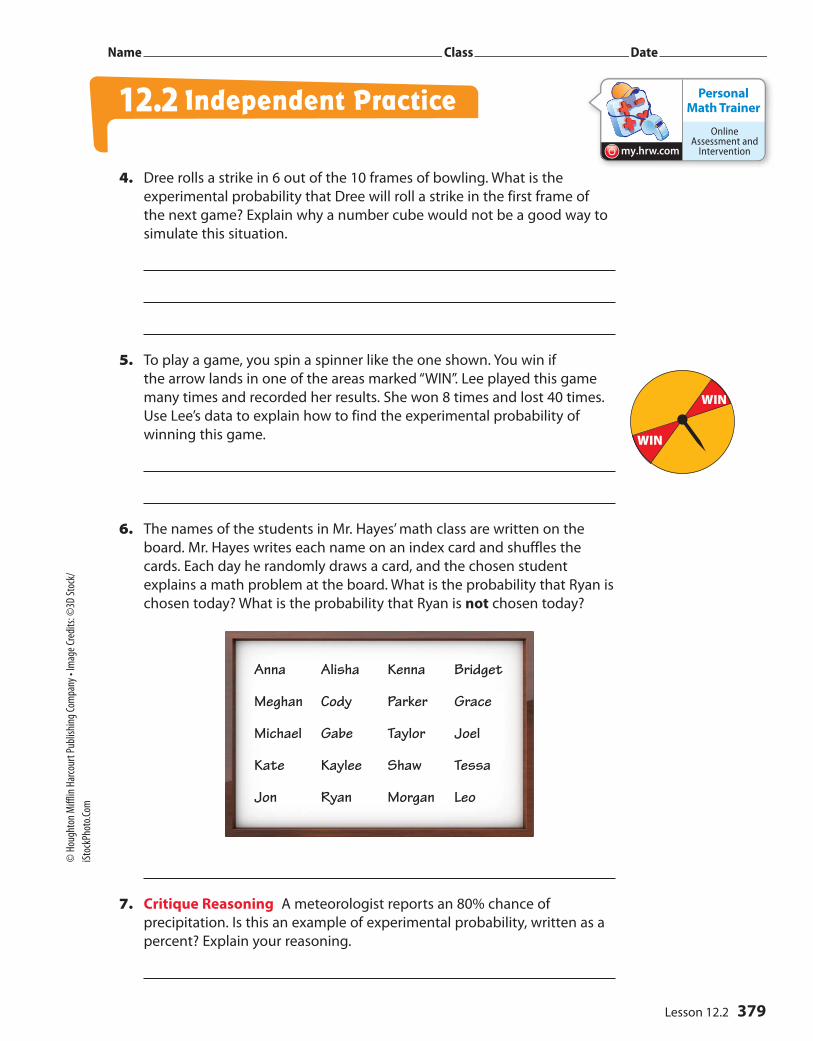
5. To play a game, you spin a spinner like the one shown. You win if
the arrow lands in one of the areas marked “WIN”. Lee played this game
many times and recorded her results. She won 8 times and lost 40 times.
Use Lee’s data to explain how to find the experimental probability of
winning this game.
6. The names of the students in Mr. Hayes’ math class are written on the
board. Mr. Hayes writes each name on an index card and shuffles the
cards. Each day he randomly draws a card, and the chosen student
explains a math problem at the board. What is the probability that Ryan is
chosen today? What is the probability that Ryan is not chosen today?
7. Critique Reasoning A meteorologist reports an 80% chance of
precipitation. Is this an example of experimental probability, written as a
percent? Explain your reasoning.
379Lesson 12.2
© H
ough
ton
Miff
lin H
arco
urt P
ublis
hing
Com
pany
• Im
age
Cred
its: ©
3D S
tock
/
iSto
ckPh
oto.
Com

Work Area
8. Mica and Joan are on the same softball team. Mica got 8 hits out of 48
times at bat, while Joan got 12 hits out of 40 times at bat. Who do you
think is more likely to get a hit her next time at bat? Explain.
9. Make a Prediction In tennis, Gabby serves an ace, a ball that can’t be
returned, 4 out of the 10 times she serves. What is the experimental
probability that Gabby will serve an ace in the first match of the next
game? Make a prediction about how many aces Gabby will have for the
next 40 serves. Justify your reasoning.
10. Represent Real-World Problems Patricia finds that the experimental
probability that her dog will want to go outside between 4 P.M. and 5 P.M. is 7 __
12 . About what percent of the time does her dog not want to go out
between 4 P.M. and 5 P.M.?
11. Explain the Error Talia tossed a penny many times. She got 40 heads
and 60 tails. She said the experimental probability of getting heads was
40 __
60 . Explain and correct her error.
12. Communicate Mathematical Ideas A high school has 438 students,
with about the same number of males as females. Describe a simulation
to predict how many of the first 50 students who leave school at the end
of the day are female.
13. Critical Thinking For a scavenger hunt, Chessa put one coin in each of
10 small boxes. Four coins are quarters, 4 are dimes, and 2 are nickels.
How could you simulate choosing one box at random? Would you use the
same simulation if you planned to put these coins in your pocket and
choose one? Explain your reasoning.
FOCUS ON HIGHER ORDER THINKING
Unit 6380
© H
ough
ton
Miff
lin H
arco
urt P
ublis
hing
Com
pany

?
EXPLORE ACTIVITY
ESSENTIAL QUESTIONHow do you find the experimental probability of a compound event?
Exploring Compound Probability A compound event is an event that includes two or more simple events, such
as flipping a coin and rolling a number cube. A compound event can include
events that depend on each other or are independent. Events are independent
if the occurrence of one event does not affect the probability of the other
event, such as flipping a coin and rolling a number cube.
What are the possible outcomes of flipping a coin once?
What are the possible outcomes of rolling a standard number cube once?
Complete the list for all possible outcomes for flipping a coin and
rolling a number cube.
H1, H2, , , , , T1, , , , ,
There are possible outcomes for this compound event.
Flip a coin and roll a number cube 50 times. Use tally marks to record
your results in the table.
1 2 3 4 5 6
H
T
Based on your data, which compound event had the greatest
experimental probability and what was it? The least experimental
probability?
Draw Conclusions Did you expect to have the same probability for
each possible combination of flips and rolls? Why or why not?
A
B
C
D
E
F
L E S S O N
12.3 Experimental Probability of Compound Events
7.6.12.3
Students will find the experimental probability of a compound event.
H1 would mean the coin landed on heads, and the number cube showed a 1.
381Lesson 12.3
© H
ough
ton
Miff
lin H
arco
urt P
ublis
hing
Com
pany

Math Trainer
Online Assessment and Intervention
Personal
my.hrw.com
Math On the Spotmy.hrw.com
Calculating Experimental Probability of Compound Events The experimental probability of a compound event can be found using recorded data.
A food trailer serves chicken and records the order size and sides on their
orders, as show in the table. What is the experimental probability that the
next order is for 3-pieces with cole slaw?
EXAMPLE 1
1. Drink sales for an afternoon at the
school carnival were recorded in
the table. What is the experimental
probability that the next drink is a
small cocoa?
YOUR TURN
Green Salad
Macaroni & Cheese
French Fries
Cole Slaw
2 pieces 33 22 52 35
3 pieces 13 55 65 55
Find the total number of trials, or orders.
33 + 22 + 52 + 35 + 13 + 55 + 65 + 55 = 330
Find the number of orders that are for 3 pieces with
cole slaw: 55.
Find the experimental probability.
P(3 piece + slaw) = number of 3 piece + slaw ___________________
total number of orders
= 55 ___
330
= 1 _ 6
The experimental probability that the next order is for 3 pieces
of chicken with cole slaw is 1 _ 6 .
STEP 1
STEP 2
STEP 3
Soda Water Cocoa
Small 77 98 60
Large 68 45 52
Javier said the total number of orders is 8 and not 330.
Is he correct? Explain.
Math TalkMathematical Processes
Substitute the values.
Simplify.
Unit 6382
© H
ough
ton
Miff
lin H
arco
urt P
ublis
hing
Com
pany
• Im
age
Cred
its: ©
Pete
r Tsa
i Pho
togr
aphy
/
Alam
y Im
ages
My Notes
Left Right
Straight
Math On the Spot
my.hrw.com
Using a Simulation to Make a PredictionYou can use a simulation or model of an experiment to find the experimental
probability of compound events.
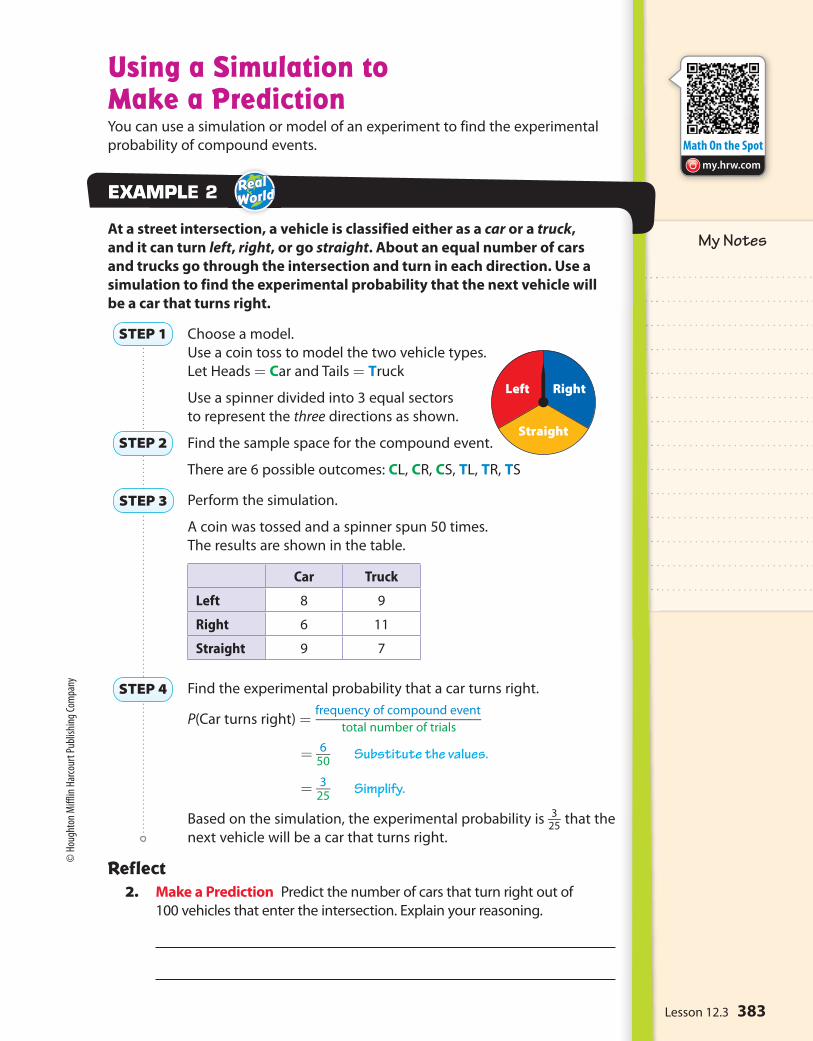
At a street intersection, a vehicle is classified either as a car or a truck,
and it can turn left, right, or go straight. About an equal number of cars
and trucks go through the intersection and turn in each direction. Use a
simulation to find the experimental probability that the next vehicle will
be a car that turns right.
Choose a model.
Use a coin toss to model the two vehicle types.
Let Heads = Car and Tails = Truck
Use a spinner divided into 3 equal sectors
to represent the three directions as shown.
Find the sample space for the compound event.
There are 6 possible outcomes: CL, CR, CS, TL, TR, TS
Perform the simulation.
A coin was tossed and a spinner spun 50 times.
The results are shown in the table.
Car Truck
Left 8 9
Right 6 11
Straight 9 7
Find the experimental probability that a car turns right.
P(Car turns right) = frequency of compound event ______________________
total number of trials
= 6 __ 50
= 3 __ 25
Based on the simulation, the experimental probability is 3 __ 25
that the
next vehicle will be a car that turns right.
Reflect2. Make a Prediction Predict the number of cars that turn right out of
100 vehicles that enter the intersection. Explain your reasoning.
EXAMPLEXAMPLE 2
STEP 1
STEP 2
STEP 3
STEP 4
Substitute the values.
Simplify.
383Lesson 12.3
© H
ough
ton
Miff
lin H
arco
urt P
ublis
hing
Com
pany
Math Trainer
Online Assessment and Intervention
Personal
my.hrw.com
yes no
Vacuum
Standard
C A R WASH
Deluxe
Superior
Silver Gold
12 in. 12 22
16 in. 16 8
20 in. 5 12
Guided Practice
1. A dentist has 400 male and female patients that range in ages from
10 years old to 50 years old and up as shown in the table. What is the
experimental probability that the next patient will be female and in the
age range 22–39? (Explore Activity and Example 1)
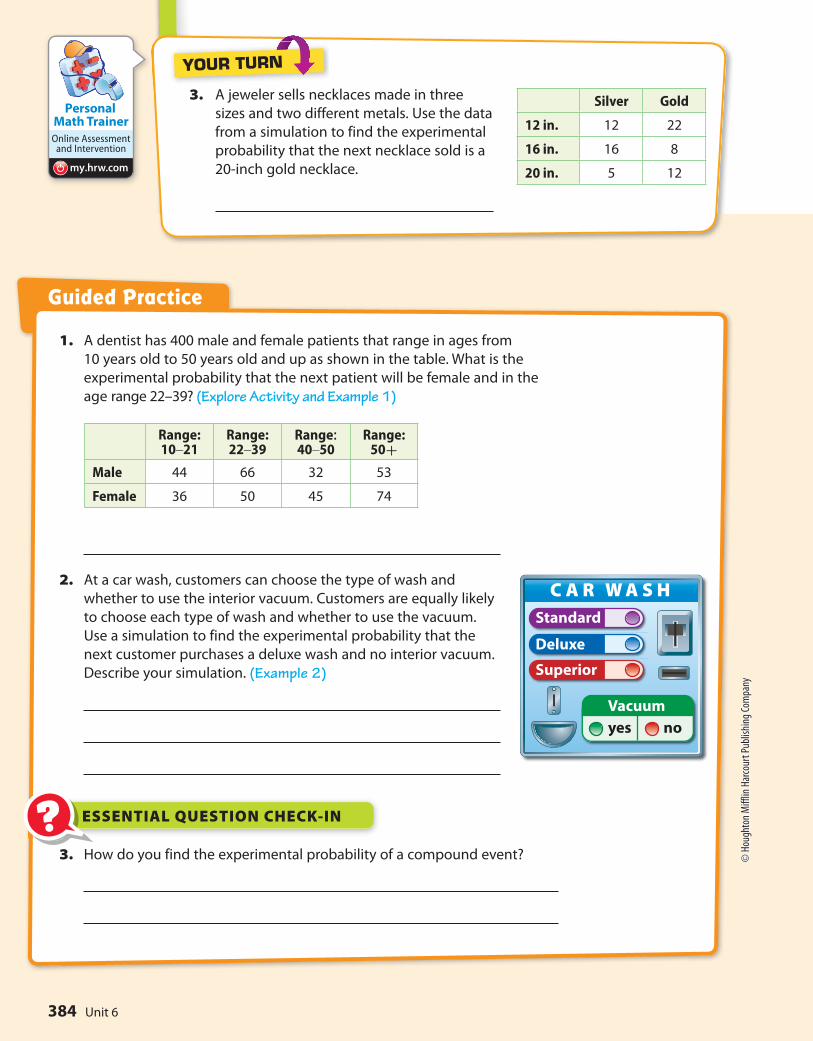
2. At a car wash, customers can choose the type of wash and
whether to use the interior vacuum. Customers are equally likely
to choose each type of wash and whether to use the vacuum.
Use a simulation to find the experimental probability that the
next customer purchases a deluxe wash and no interior vacuum.
Describe your simulation. (Example 2)
3. How do you find the experimental probability of a compound event?
ESSENTIAL QUESTION CHECK-IN??
3. A jeweler sells necklaces made in three
sizes and two different metals. Use the data
from a simulation to find the experimental
probability that the next necklace sold is a
20-inch gold necklace.
YOUR TURN
Range:10–21
Range:22–39
Range:40–50
Range:50+
Male 44 66 32 53
Female 36 50 45 74
Unit 6384
© H
ough
ton
Miff
lin H
arco
urt P
ublis
hing
Com
pany
Personal Math Trainer
Online Assessment and
Interventionmy.hrw.com
Name Class Date
4. Represent Real-World Problems For the same food trailer mentioned in
Example 1, explain how to find the experimental probability that the next
order is two pieces of chicken with a green salad.
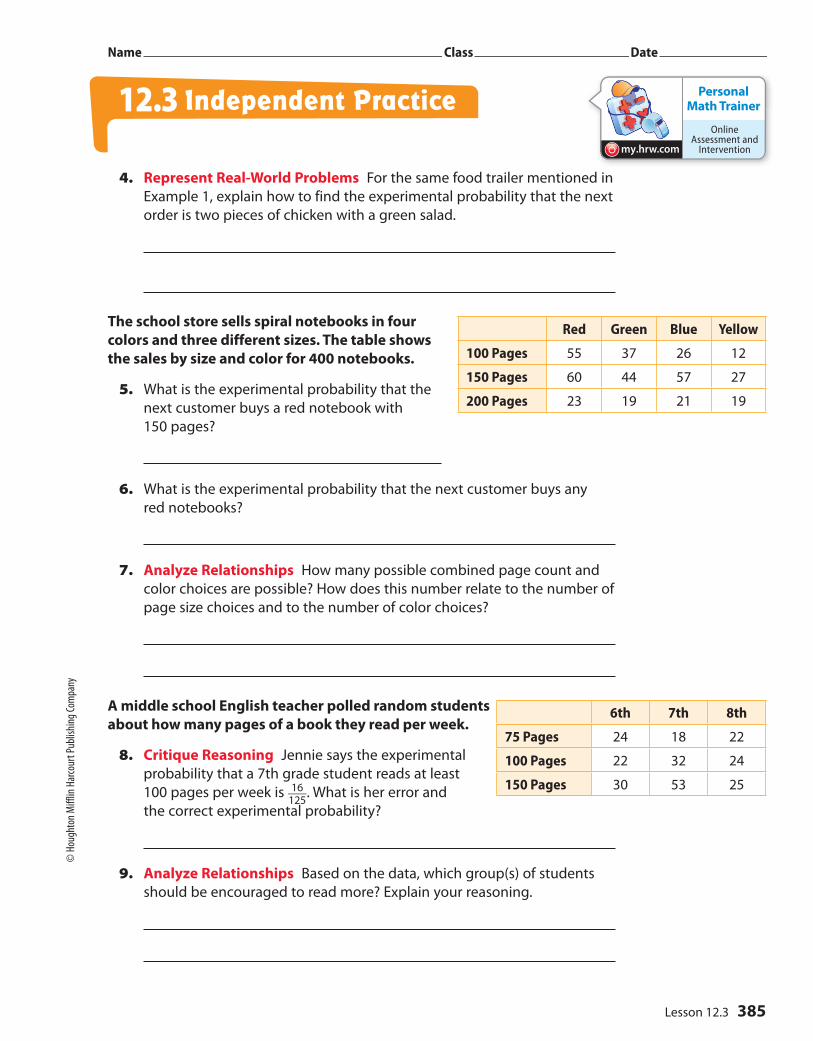
The school store sells spiral notebooks in four
colors and three different sizes. The table shows
the sales by size and color for 400 notebooks.
5. What is the experimental probability that the
next customer buys a red notebook with
150 pages?
6. What is the experimental probability that the next customer buys any
red notebooks?
7. Analyze Relationships How many possible combined page count and
color choices are possible? How does this number relate to the number of
page size choices and to the number of color choices?
A middle school English teacher polled random students
about how many pages of a book they read per week.
8. Critique Reasoning Jennie says the experimental
probability that a 7th grade student reads at least
100 pages per week is 16 ___
125 . What is her error and
the correct experimental probability?
9. Analyze Relationships Based on the data, which group(s) of students
should be encouraged to read more? Explain your reasoning.
Red Green Blue Yellow
100 Pages 55 37 26 12
150 Pages 60 44 57 27
200 Pages 23 19 21 19
6th 7th 8th
75 Pages 24 18 22
100 Pages 22 32 24
150 Pages 30 53 25
Independent Practice12.3
385Lesson 12.3
© H
ough
ton
Miff
lin H
arco
urt P
ublis
hing
Com
pany

Work Area
10. Make a Conjecture Would you expect the probability for the simple
event “rolling a 6” to be greater than or less than the probability of the
compound event “rolling a 6 and getting heads on a coin”? Explain.
11. Critique Reasoning Donald says he uses a standard number cube for
simulations that involve 2, 3, or 6 equal outcomes. Explain how Donald
can do this.
12. Draw Conclusions Data collected in a
mall recorded the shoe styles worn by
150 male and for 150 female customers.
What is the probability that the next
customer is male and has an open-toe
shoe (such as a sandal)? What is the probability that the next male customer
has an open-toe shoe? Are the two probabilities the same? Explain.
13. What If? Suppose you wanted to perform a simulation to model the
shoe style data shown in the table. Could you use two coins? Explain.
14. Represent Real-World Problems A middle school is made up of grades
6, 7, and 8, and has about the same number of male and female students
in each grade. Explain how to use a simulation to find the experimental
probability that the first 50 students who arrive at school are male and
7th graders.
FOCUS ON HIGHER ORDER THINKING
Male Female
Open toe 11 92
Closed toe 139 58
Unit 6386
© H
ough
ton
Miff
lin H
arco
urt P
ublis
hing
Com
pany
?
Math Trainer
Online Assessment and Intervention
Personal
my.hrw.com
Math On the Spot
my.hrw.com
ESSENTIAL QUESTION
Using Experimental Probability to Make a Prediction Scientists study data to make predictions. You can use probabilities to make
predictions in your daily life.
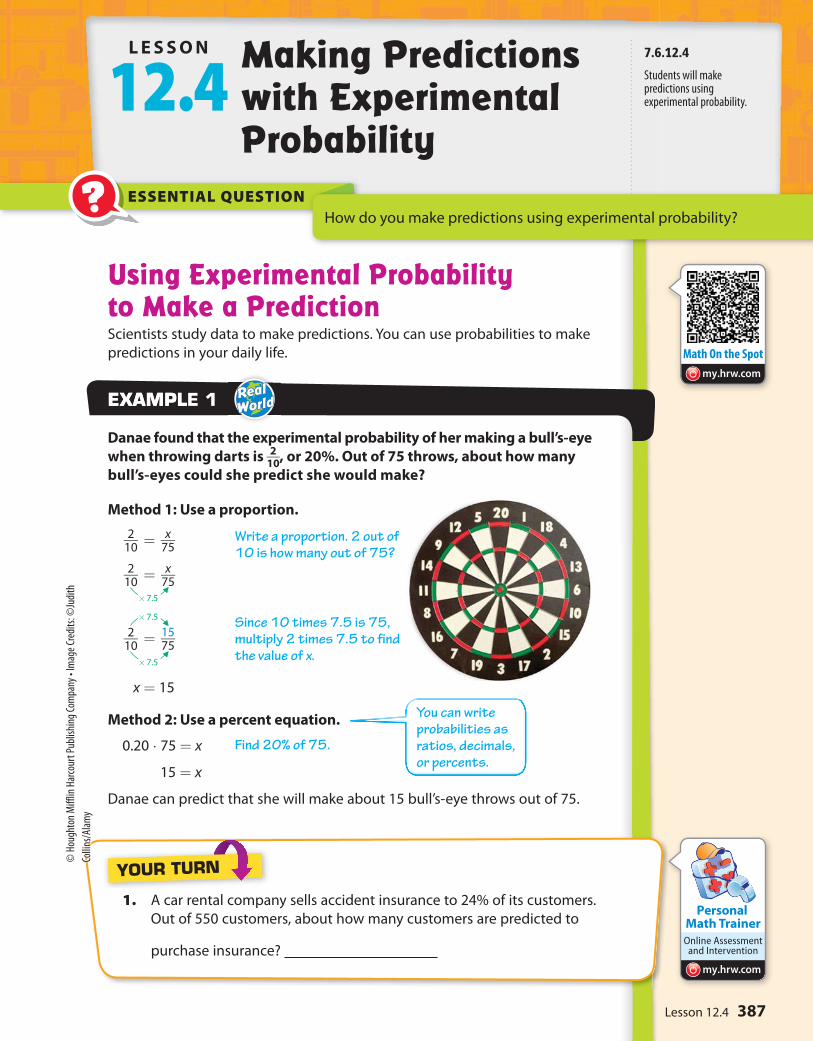
Danae found that the experimental probability of her making a bull’s-eye
when throwing darts is 2 __ 10
, or 20%. Out of 75 throws, about how many
bull’s-eyes could she predict she would make?
Method 1: Use a proportion.
Method 2: Use a percent equation.
Danae can predict that she will make about 15 bull’s-eye throws out of 75.
EXAMPLEXAMPLE 1
2 __ 10
= x __ 75
2 __ 10
= x __ 75
2 __ 10
= 15 __
75
x = 15
× 7.5
× 7.5
× 7.5
0.20 ⋅ 75 = x
15 = x
How do you make predictions using experimental probability?
1. A car rental company sells accident insurance to 24% of its customers.
Out of 550 customers, about how many customers are predicted to
purchase insurance?
YOUR TURN
L E S S O N
12.4 Making Predictions with Experimental Probability
7.6.12.4
Students will make predictions using experimental probability.
Write a proportion. 2 out of 10 is how many out of 75?
Find 20% of 75.
Since 10 times 7.5 is 75, multiply 2 times 7.5 to find the value of x.
You can write probabilities as ratios, decimals, or percents.
387Lesson 12.4
© H
ough
ton
Miff
lin H
arco
urt P
ublis
hing
Com
pany
• Im
age
Cred
its: ©
Judi
th
Colli
ns/A
lam
y

Math Trainer
Online Assessment and Intervention
Personal
my.hrw.com
Math On the Spotmy.hrw.com
Using Experimental Probability to Make a Qualitative PredictionA prediction is something you reasonably expect to happen in the future. A qualitative prediction helps you decide which situation is more likely in general.
A doctor’s office records data and concludes that, on average, 11% of patients
call to reschedule their appointments per week. The office manager predicts
that 23 appointments will be rescheduled out of the 240 total appointments
during next week. Explain whether the prediction is reasonable.
Method 1: Use a proportion.
Method 2: Use a percent equation.
The prediction of 23 is reasonable but a little low, because 23 is a little
less than 26.4.
EXAMPLE 2
11 ___
100 = x ___
240
11 ___
100 = x ___
240
11 ___
100 = 26.4
____ 240
x = 26.4
× 2.4
× 2.4
× 2.4
0.11 ⋅ 240 = x
26.4 = x
Reflect2. Does 26.4 make sense for the number of patients?
3. In emails to monthly readers of a newsletter 3% of the emails come back
undelivered. The editor predicts that if he sends out 12,372 emails, he will
receive 437 notices for undelivered email. Do you agree with his prediction?
Explain.
YOUR TURN
Write a proportion. 11 out of 100 is how many out of 240?
Find 11% of 240.
Solve for x.
Since 100 times 2.4 is 240, multiply 11 times 2.4 to find the value of x.
26.4 is the average number of patients that would call to reschedule.
Unit 6388
© H
ough
ton
Miff
lin H
arco
urt P
ublis
hing
Com
pany

My NotesFile Edit View Favorites Tools Help
Address http://www.movienews/onlinesurvey/
online surveyonline survey
Did you like the movie?Yes
72%
No
28%
Math On the Spot
my.hrw.com
Making a Quantitative PredictionYou can use proportional reasoning to make quantitative predictions and
compare options in real-world situations.
An online poll for a movie site shows
its polling results for a new movie. If a
newspaper surveys 150 people leaving
the movie, how many people can it
predict will like the movie based on
the online poll? Is the movie site’s claim
accurate if the newspaper has 104 people
say they like the movie?
Analyze Information
The answer is a prediction for how many people out of 150 will like the
movie based on the online poll. Also tell whether the 104 people that say
they like the movie is enough to support the movie site’s claim.
List the important information:
• The online poll says 72% of movie goers like the new movie.
• A newspaper surveys 150 people.
Formulate a Plan
Use a proportion to calculate 72% of the 150 people surveyed.
Justify and EvaluateJJuJuJuJu tststststifififififyyy y y anananandddd d EEEEEvvvv lalalalaluauauauattttteeeeSolve
72 ___
100 = x ___
150
72 ___
100 = x ___
150
72 ___
100 = 108
___ 150
x = 108
The newspaper can predict that 108 out of 150 people will say they like
the movie, based on the online poll.
Justify and Evaluate
Since 108 is close to 104, the newspaper survey and the online poll show
that about the same percent of people like the movie.
EXAMPLEXAMPLE 3 ProblemSolving
×1.5
×1.5
×1.5
Set up a proportion. 72 out of 100 is how many out of 150?
Since 100 times 1.5 is 150, multiply 72 times 1.5 to find the value of x.
389Lesson 12.4
© H
ough
ton
Miff
lin H
arco
urt P
ublis
hing
Com
pany
Math Trainer
Online Assessment and Intervention
Personal
my.hrw.com
Guided Practice
1. A baseball player reaches first base 30% of
the times he is at bat. Out of 50 times at bat,
about how many times will the player reach
first base? (Example 1)
2. The experimental probability that it will rain
on any given day in Houston, Texas, is about
15%. Out of 365 days, about how many days
can residents predict rain? (Example 1)
3. A catalog store has 6% of its orders returned
for a refund. The owner predicts that a new
candle will have 812 returns out of the 16,824
sold. Do you agree with this prediction?
Explain. (Example 2)
4. On a toy assembly line, 3% of the toys are found
to be defective. The quality control officer
predicts that 872 toys will be found defective
out of 24,850 toys made. Do you agree with this
prediction? Explain. (Example 2)
5. A light-rail service claims to be on time 98% of
the time. Jeanette takes the light-rail 40 times
one month, how many times can she predict
she will be on time? Is the light-rail’s claim
accurate if she is late 6 times? (Example 3)
6. On average, a college claims to accept
18% of its applicants. If the college has
5,000 applicants, predict how many will be
accepted. If 885 applicants are accepted, is
the college’s claim accurate? (Example 3)
4. On average, 24% of customers who buy shoes in a particular store buy two or
more pairs. One weekend, 350 customers purchased shoes. How many can be
predicted to buy two or more pairs? If 107 customers buy more than two pairs,
did more customers than normal buy two or more pairs?
YOUR TURN
7. How do you make predictions using experimental probability?
ESSENTIAL QUESTION CHECK-IN??
Unit 6390
© H
ough
ton
Miff
lin H
arco
urt P
ublis
hing
Com
pany

Personal Math Trainer
Online Assessment and
Interventionmy.hrw.com
Name Class Date
The table shows the number of students in a middle school
at the beginning of the year and the percentage that can be
expected to move out of the area by the end of the year.
8. How many 7th grade students are expected to move
by the end of the year? If 12 students actually moved,
did more or fewer 7th grade students move than expected?
Justify your answer.
9. Critique Reasoning The middle school will lose some of its funding if
50 or more students move away in any year. The principal claims he only
loses about 30 students a year. Do the values in the table support his
claim? Explain.
10. Represent Real-World Problems An airline knows that, on average,
the probability that a passenger will not show up for a flight is 6%.
If an airplane is fully booked and holds 300 passengers, how many seats
are expected to be empty? If the airline overbooked the flight by
10 passengers, about how many passengers are expected to show
up for the flight? Justify your answer.
11. Draw Conclusions In a doctor’s office, an average of 94% of the
clients pay on the day of the appointment. If the office has 600 clients
per month, how many are expected not to pay on the day of the
appointment? If 40 clients do not pay on the day of their appointment
in a month, did more or fewer than the average not pay?
6th 7th 8th
Number of Students
250 200 150
% Moves 2% 4% 8%
Independent Practice12.4
391Lesson 12.4
© H
ough
ton
Miff
lin H
arco
urt P
ublis
hing
Com
pany

Work Area
12. Counterexamples The soccer coach claimed that, on average, only 80%
of the team come to practice each day. The table shows the number of
students that came to practice for 8 days. If the team has 20 members,
how many team members should come to practice to uphold the coach’s
claim? Was the coach’s claim accurate? Explain your reasoning.
1 2 3 4 5 6 7 8
Number of Students
18 15 18 17 17 19 20 20
13. What’s the Error? Ronnie misses the school bus 1 out of every 30 school
days. He sets up the proportion 1 __ 30
= 180 ___ x to predict how many days he will
miss the bus in the 180-day school year. What is Ronnie’s error?
14. Persevere in Problem Solving A gas pump machine rejects 12% of
credit card transactions. If this is twice the normal rejection rate for a
normal gas pump, how many out of 500 credit cards transactions would a
normal gas pump machine reject?
15. Make Predictions An airline’s weekly flight data showed a 98% probability
of being on time. If this airline has 15,000 flights in a year, how many flights
would you predict to arrive on time? Explain whether you can use the data
to predict whether a specific flight with this airline will be on time.
16. Draw Conclusions An average response rate for a marketing letter is
4%, meaning that 4% of the people who receive the letter respond to it.
A company writes a new type of marketing letter, sends out 2,400 of
them, and gets 65 responses. Explain whether the new type of letter
would be considered to be a success.
FOCUS ON HIGHER ORDER THINKING
Unit 6392
© H
ough
ton
Miff
lin H
arco
urt P
ublis
hing
Com
pany
ReadyMath Trainer
Online Assessment and Intervention
Personal
my.hrw.com1
2
MODULE QUIZ
12.1 Probability
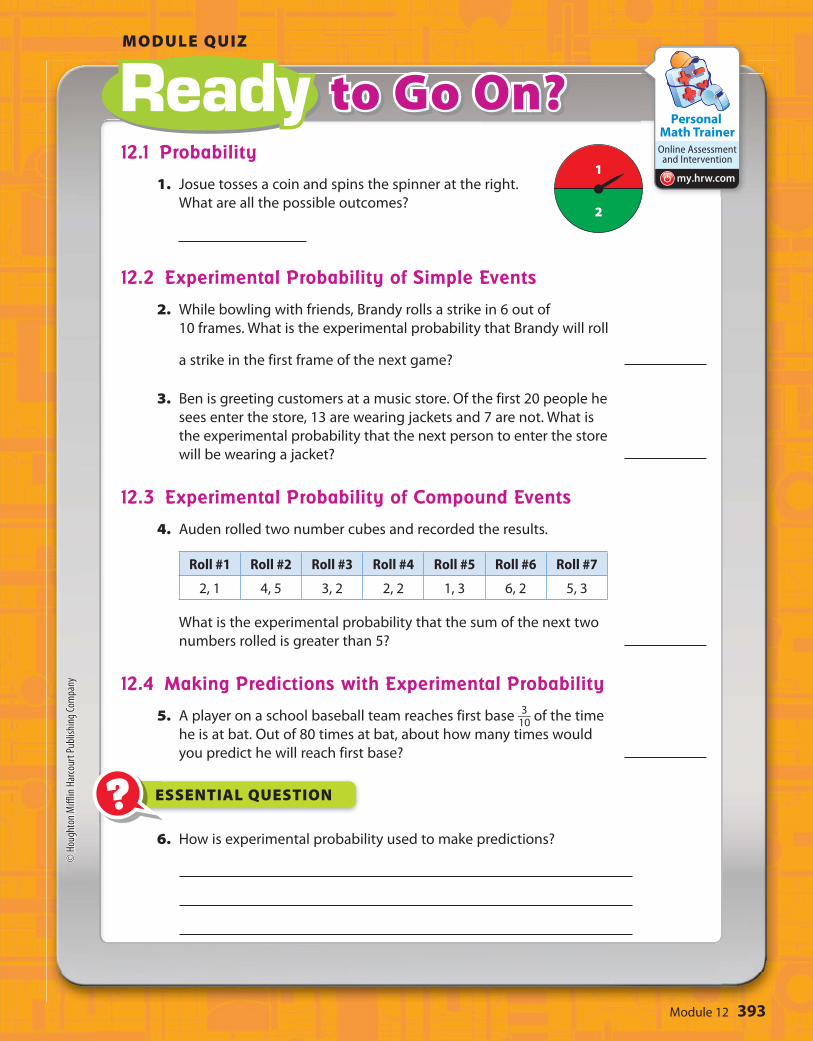
1. Josue tosses a coin and spins the spinner at the right.
What are all the possible outcomes?
12.2 Experimental Probability of Simple Events
2. While bowling with friends, Brandy rolls a strike in 6 out of
10 frames. What is the experimental probability that Brandy will roll
a strike in the first frame of the next game?
3. Ben is greeting customers at a music store. Of the first 20 people he
sees enter the store, 13 are wearing jackets and 7 are not. What is
the experimental probability that the next person to enter the store
will be wearing a jacket?
12.3 Experimental Probability of Compound Events
4. Auden rolled two number cubes and recorded the results.
Roll #1 Roll #2 Roll #3 Roll #4 Roll #5 Roll #6 Roll #7
2, 1 4, 5 3, 2 2, 2 1, 3 6, 2 5, 3
What is the experimental probability that the sum of the next two
numbers rolled is greater than 5?
12.4 Making Predictions with Experimental Probability
5. A player on a school baseball team reaches first base 3 __ 10
of the time
he is at bat. Out of 80 times at bat, about how many times would
you predict he will reach first base?
6. How is experimental probability used to make predictions?
ESSENTIAL QUESTION
393Module 12
© H
ough
ton
Miff
lin H
arco
urt P
ublis
hing
Com
pany
Personal Math Trainer
Online Assessment and
Interventionmy.hrw.com
MODULE 12 MIXED REVIEW
Selected Response
1. A frozen yogurt shop offers scoops in cake
cones, waffle cones, or cups. You can get
vanilla, chocolate, strawberry, pistachio, or
coffee flavored frozen yogurt. If you order
a single scoop, how many outcomes are in
the sample space?
A 3 C 8
B 5 D 15
2. A bag contains 7 purple beads, 4 blue
beads, and 4 pink beads. What is the
probability of not drawing a pink bead?
A 4 __ 15
C 8 __ 15
B 7 __ 15
D 11 __
15
3. During the month of June, Ava kept track
of the number of days she saw birds in
her garden. She saw birds on 18 days
of the month. What is the experimental
probability that she will see birds in her
garden on July 1?
A 1 __ 18
C 1 _ 2
B 2 _ 5
D 3 _ 5
4. A rectangle has a width of 4 inches and a
length of 6 inches. A similar rectangle has
a width of 12 inches. What is the length of
the similar rectangle?
A 8 inches C 14 inches
B 12 inches D 18 inches
5. The experimental probability of hearing
thunder on any given day in Ohio is 30%.
Out of 600 days, on about how many days
can Ohioans expect to hear thunder?
A 90 days C 210 days
B 180 days D 420 days
6. Isidro tossed two coins several times and
then recorded the results in the table below.
Toss 1 Toss 2 Toss 3 Toss 4 Toss 5
H; T T; T T; H H; T H; H
What is the experimental probability that both coins will land on the same side on Isidro’s next toss?
A 1 _ 5
C 3 _ 5
B 2 _ 5
D 4 _ 5
Mini-Task
7. Magdalena had a spinner that was evenly
divided into sections of red, blue, and
green. She spun the spinner and tossed a
coin several times. The table below shows
the results.
a. What are all the possible outcomes?
b. What experimental probability did
Magdalena find for spinning blue? Give
your answer as a fraction in simplest
form, as a decimal, and as a percent.
c. Out of 90 trials, how many times should
Magdalena predict she will spin green
while tossing tails?
Trial 1 Trial 2 Trial 3 Trial 4 Trial 5
blue; T green; T green; H red; T blue; H
Assessment Readiness
394 Unit 6
© H
ough
ton
Miff
lin H
arco
urt P
ublis
hing
Com
pany