Experimental investigation on the composite effect of ...
30
1 Experimental investigation on the composite effect of steel rebars and 1 macro fibers on the impact behavior of high performance self-compacting 2 concrete 3 Yining Ding a, , Dong Li a , Yulin Zhang b and Cecilia Azevedo b 4 a State Key Laboratory of Coastal and Offshore Engineering, Dalian University of Technology, 5 Dalian 116024, China 6 b Centre of Mathematics, University of Minho, Braga 4700-052, Portugal 7 Abstract:In this study, the impact behavior of ten types of high performance self-compacting 8 concrete (HPSCC) was explored using the drop-weight method. The HPSCC specimens were 9 reinforced with steel rebars and different fibers for comparison with plain concrete. The 10 reinforcement mechanism of the influences of steel rebars and different fibers on failure impact 11 energy was explained. The composite effects of hybrid use of steel rebars with different fibers on the 12 failure impact energy were also compared. The penetration depth for each mixture was analyzed. 13 Test results showed that the macro fibers could greatly improve the failure impact energy both in 14 plain and reinforcement concrete. Moreover, the toughness, penetration depth, stress redistribution 15 could be improved obviously due to the positive hybrid effect of rebars and macro fibers in 16 reinforced concrete. The statistical analysis technique was introduced to evaluate the experimental 17 data, and the goodness of fit tests showed that the distribution of the blow numbers to the first crack 18 and up to the final failure followed the two-parameter Weibull distribution. 19 Keywords: self-compacting concrete; impact behavior; drop-weight test; composite effect; Weibull 20 distribution 21 Corresponding author. Tel.: +86 411 84709756. E-mail address: [email protected] (Y. Ding).
Transcript of Experimental investigation on the composite effect of ...

1
Experimental investigation on the composite effect of steel rebars and 1
macro fibers on the impact behavior of high performance self-compacting 2
concrete 3
Yining Ding a,, Dong Li a, Yulin Zhang b and Cecilia Azevedo b 4
a State Key Laboratory of Coastal and Offshore Engineering, Dalian University of Technology, 5
Dalian 116024, China 6
bCentre of Mathematics, University of Minho, Braga 4700-052, Portugal 7
Abstract:In this study, the impact behavior of ten types of high performance self-compacting 8
concrete (HPSCC) was explored using the drop-weight method. The HPSCC specimens were 9
reinforced with steel rebars and different fibers for comparison with plain concrete. The 10
reinforcement mechanism of the influences of steel rebars and different fibers on failure impact 11
energy was explained. The composite effects of hybrid use of steel rebars with different fibers on the 12
failure impact energy were also compared. The penetration depth for each mixture was analyzed. 13
Test results showed that the macro fibers could greatly improve the failure impact energy both in 14
plain and reinforcement concrete. Moreover, the toughness, penetration depth, stress redistribution 15
could be improved obviously due to the positive hybrid effect of rebars and macro fibers in 16
reinforced concrete. The statistical analysis technique was introduced to evaluate the experimental 17
data, and the goodness of fit tests showed that the distribution of the blow numbers to the first crack 18
and up to the final failure followed the two-parameter Weibull distribution. 19
Keywords: self-compacting concrete; impact behavior; drop-weight test; composite effect; Weibull 20
distribution 21
Corresponding author. Tel.: +86 411 84709756.
E-mail address: [email protected] (Y. Ding).
2
Nomenclature
HPSCC high performance self-compacting
concrete
FRC
fiber reinforced concrete
NC plain HPSCC for C60 RC steel rebar reinforced HPSCC
PP macro PP fiber reinforced HPSCC
RC+PP4 hybrid steel rebar and 4 kg/m3 macro PP
fiber reinforced HPSCC PP4 macro PP fiber reinforced HPSCC with
fiber content of 4 kg/m3
PP6 macro PP fiber reinforced HPSCC with
fiber content of 6 kg/m3
RC+PP6
hybrid steel rebar and 6 kg/m3 macro PP
fiber reinforced HPSCC
SF macro steel fiber reinforced HPSCC
RC+SF20 hybrid steel rebar and 20 kg/m3 macro
steel fiber reinforced HPSCC SF20 macro steel fiber reinforced HPSCC with
fiber content of 20 kg/m3
SF35 macro steel fiber reinforced HPSCC with
fiber content of 35 kg/m3
RC+SF35
hybrid steel rebar and 35 kg/m3 macro
steel fiber reinforced HPSCC
N1 number of repeated impact to the first
crack
W1 first crack impact energy
N2 number of repeated impact to the failure
W2 failure impact energy
f1 first-peak strength
L span length of the beam
fp peak strength
f150 residual strength at deflection of L/150
f600 residual strength at deflection of L/600
T150 area under the load vs. deflection curve
0 to L/150
1
1. Introduction 2
Many concrete elements of infrastructure may experience impact loads such as bridge planks, 3
road pavements and precast concrete piles. For bridge planks and road pavements, due to passing 4
vehicles, they often endure repetitive impact loads produced by surface irregularities [1]; for precast 5
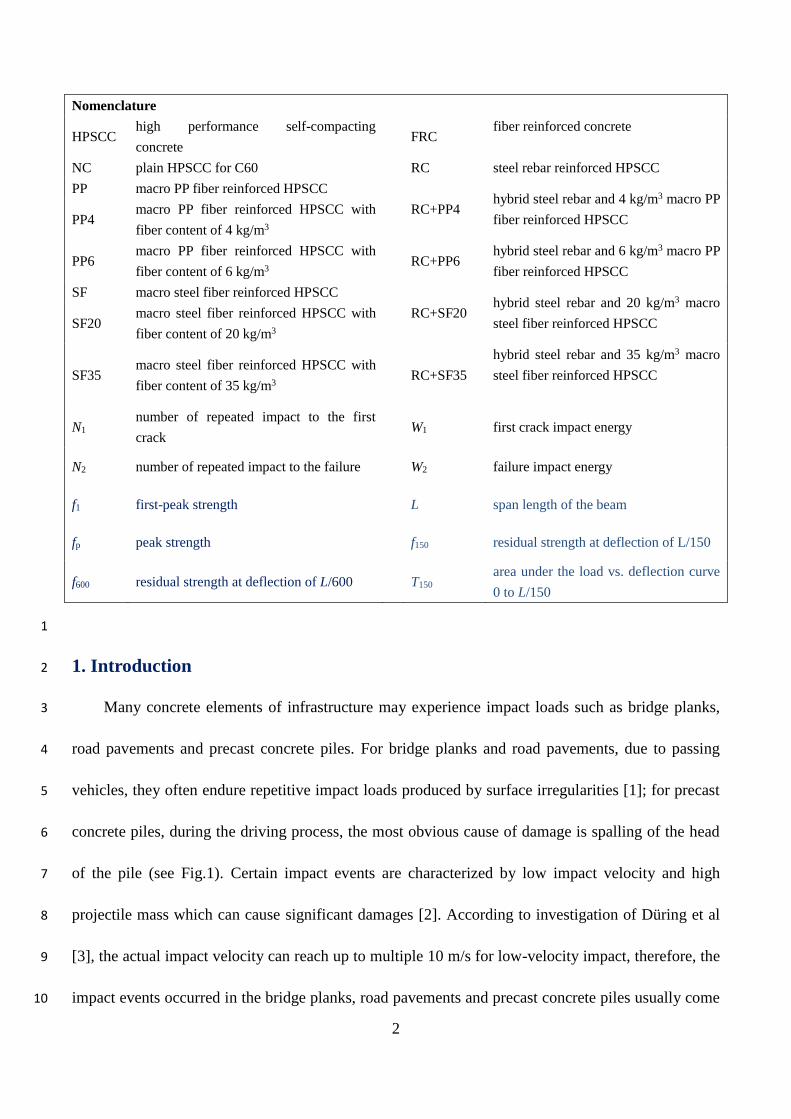
concrete piles, during the driving process, the most obvious cause of damage is spalling of the head 6
of the pile (see Fig.1). Certain impact events are characterized by low impact velocity and high 7
projectile mass which can cause significant damages [2]. According to investigation of Düring et al 8
[3], the actual impact velocity can reach up to multiple 10 m/s for low-velocity impact, therefore, the 9
impact events occurred in the bridge planks, road pavements and precast concrete piles usually come 10
3
under the low-velocity impact. 1
2
Fig.1 Impact failure at the head of the pile 3
The impact resistance is considered to be one of the significant properties of concrete for 4
applications in civil engineering [4]. Some investigations indicated that the randomly distributed 5
steel fibers can enhance the mechanical properties of concrete, such as toughness, post crack 6
behavior, impact resistance and fatigue properties noticeably [5-14]. Apart from steel fibers, 7
synthetic macro fibers such as macro polypropylene (PP) fibers have been widely used in civil 8
engineering, and considerable improvements can also be obtained regarding the post-cracking 9
residual strength, toughness, cracking control of the concrete [15-21]. Additionally, compared to steel 10
fibers, the macro PP fibers may show advantages in density and corrosion resistance. Although some 11
investigations have been conducted to study the fiber effect on the impact properties of concrete, the 12
focus was on the different concrete matrixes [2, 10, 18, 22-24], or on the reinforcement effects of 13
various fibers [9, 25-32]. Nowadays, the structures are usually constructed by conventionally 14
reinforced concrete, and the studies on the composite effect of rebars and different macro fibers on 15
the impact properties of high performance self-compacting concrete (HPSCC) are still limited. 16
Several experimental methods have been suggested to investigate the impact properties of fiber 17
reinforced concrete [33]. Charpy impact test and drop-weight test have been used for low velocity 18

4
impact experiments; split Hopkinson pressure bar (SHPB) test, explosive and projectile impact test 1
were used for middle and high velocity impact experiments. Among them, the drop-weight impact 2
test method [34] has been widely adopted by researchers as it is regarded as proper, simple and 3
economical to simulate the real impact loading behavior of concrete. But, some investigations 4
showed that the testing results can be remarkably scattered [28, 35-36]. The large scatter in test 5
results may be induced by the manual procedure since it is hard to control the height and loading 6
point of the drop hammer precisely. In view of the characteristics of the impact resistance, some 7
statistical methods have been suggested to analyze the test results and the fiber effects on concrete 8
[22-23, 27-29, 37]. 9
In order to reduce the errors caused by human factors, a modified device is presented, see Fig.3 10
(b). With the aid of this device, [36] compared the number of blows to the first crack and to the 11
failure of concrete specimens reinforced with steel fibers or/and steel rebars. Based on the 12
investigations of [36], besides a series of drop-weight impact experiments, we further studied the 13
reinforcement mechanism of the influence of different fibers (macro PP fiber, and macro steel fiber) 14
and steel rebars on failure impact energy, compared the composite effects of hybrid use of steel 15
rebars with different fibers on the failure impact energy, analyzed the penetration depth for each 16
mixture. At the end, the statistical analysis technique was introduced to evaluate the experimental 17
results. The results may offer an effective way to improve the impact behavior of conventionally 18
reinforced concrete. 19
2. Experiments 20
2.1 Materials 21
The designed compression strength of the HPSCC without fiber addition was 60 MPa. The 22
5
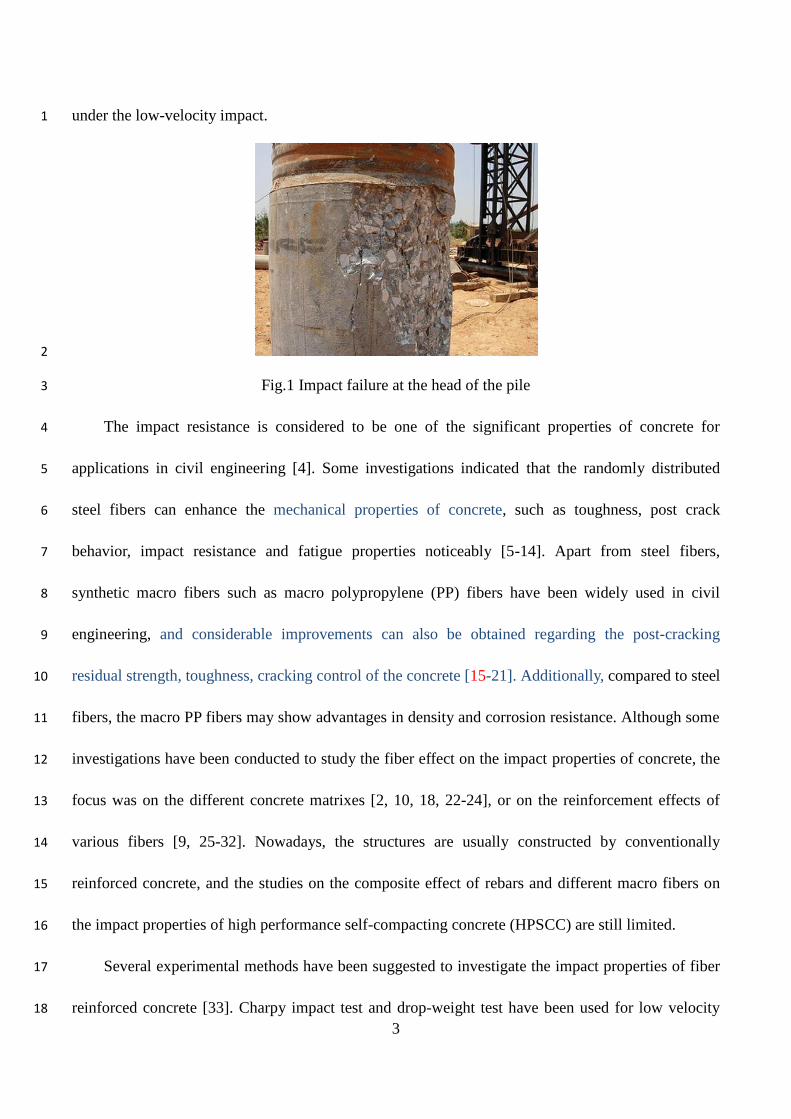
basic mix proportion was illustrated in Table 1. The binder was made of Portland cement (P•O 52.5R) 1
and fly ash. The coarse aggregates were crushed gravel with particle size 5-10 mm. The fine 2
aggregates were natural river sand with the particle size 0-5 mm. For investigating of the composite 3
effect of rebars and different macro fibers on the impact properties of HPSCC, macro PP fibers, 4
macro steel fibers and A 12 steel rebars have been added into the HPSCC. Fig.2 demonstrated the 5
different macro fibers and steel rebar applied in this program. The properties of macro PP fibers and 6
macro steel fibers were presented in Table 2. 7
Table1 Basic mix proportion of HPSCC 8
Cement
(kg/m3)
Fly ash
(kg/m3)
Water
(kg/m3)
Coarse
aggregates
(kg/m3)
Fine
aggregates
(kg/m3)
SP.a
(kg/m3) W/Bb
424 106 180 1028 619 5.82 0.34
a Super plasticizer; b Water to binder ratio (binder=cement + fly ash). 9
10
(a) (b) (c) 11
Fig.2 Macro fibers and steel rebar: (a) macro PP fibers; (b) macro steel fibers; (c) A 12 steel rebar 12
Table 2 Properties of macro PP fibers and macro steel fibers 13
Types Length
/mm
Diameter
/mm
Aspect
ratio
Tensile
strength/MPa
Number
(pieces /kg)
Macro PP fibers 30 0.67 45 490 96000
Steel fibers 35 0.54 65 1345 14500
Table 3 showed the arrangement of steel rebars and different macro fibers with different dosages 14
added into the HPSCC specimens. 15

6
Table 3 Summary of ten types of specimens 1
Specimen Macro PP fiber Steel fiber Steel rebar
(kg/m3) (kg/m3)
NC 0 0 0
PP4 4 0 0
PP6 6 0 0
SF20 0 20 0
SF35 0 35 0
RC 0 0 A 12@50
RC+PP4 4 0 A 12@50
RC+PP6 6 0 A 12@50
RC+SF20 0 20 A 12@50
RC+SF35 0 35
A 12@50
2.2. Samples preparation 2
For each mixture, three cubes (150 x 150 x 150 mm) were casted for the compressive strength 3
test, three beams (100 x 100 x 400 mm) were prepared for the flexural performance test, and six 4
cylinders (150 mm in diameter and 75 mm in thickness) were poured for the impact test. All the 5
specimens were demoulded after 24 h, and then they were placed in the moist curing room with the 6
temperature of 20oC± 2oC and relative humidity (RH) of 95% until testing. 7
2.3. Testing method 8
The flexural performance test and the impact test were performed according to ASTM C1609 9
and ACI 544, respectively [34, 38]. Fig.3 (a) presented the drop-weight test, detailed description of 10
this impact method has been given elsewhere [34]. In order to reduce the man-made scatter, a 11
modified drop-weight test device was developed, as shown in Fig.3 (b). Compared with the 12
drop-weight test suggested by ACI [34], a steel frame and a magnetic positioning switch were 13

7
introduced in the improved device [36]. This way, the HPSCC samples could be impacted uniformly 1
from the same height onto the same point by the free falling hammer, such that the boundary 2
conditions could be maintained constant during the experimental procedures. 3
4
(a) 5
6
1. Positioning magnetic switch. 2. Drop hammer 3. Impact frame 4.Guidance. 5. Steel ball. 6. Positioning lug 7. Base plate 7
(b) 8
Fig.3 Drop-weight test device: (a) recommended by ACI [34]; (b) Modified by researchers [36] 9
10
Because the steel rebar was added into the specimen, the specimen thickness was up to around 11
75 mm, and the hammer was elevated to 600 mm. The experiment was performed simply, and the 12

8
test was repeatedly performed by elevating a 4.5kg steel ball to the 600mm height, then let it fall 1
freely on the top of the specimen. Recorded the number of repeated impact, as first crack resistance 2
factor (N1), when the first visible crack was observed. Then continued the same process until the 3
pieces of specimen were touching three of the four steel lugs. We recorded these numbers of impact 4
as the failure resistance factor (N2) [34]. 5
3. Results and discussion 6
3.1 Workability, compressive strength and flexural properties 7
For the workability experiment, the average diameter of the slump flow (d) and the time when 8
the concrete spread to 500 mm circle (T500) were recorded, the results of different fiber reinforced 9
HPSCC are shown in Table 4. According to the European guidelines [39], the parameters of each 10
mixture satisfy the requirements. The uniaxial compression tests were carried out after 28 d, and the 11
mean values of compressive strength for each mix proportion are also presented in Table 4. As 12
expected, for a given mix proportion, fibers have relatively little effect on the compressive strength 13
of concrete [6, 8, 20, 33]. 14
Table 4 Results of workability and compressive strength 15
Specimen Slump flow test Compressive
strength (MPa) d (mm) T500 (s)
NC 600 8.0 67.7
PP4 590 8.2 65.4
PP6 570 9.1 66.5
SF20 580 9.0 66.2
SF35 550 9.5 66.7
16
The flexural properties of concrete mixtures with different fiber types and fiber contents are 17
shown in Table 5. 18
19

9
Table 5 Flexural properties of the different concrete mixtures 1
Specimen Peak strength(MPa) Residual strength(MPa) Toughness(J)
f1 fp f600 f150 T150
NC 7.98 7.98 - - -
PP4 8.73 8.73 1.87 1.36 12.91
PP6 8.13 8.13 1.95 1.74 14.96
SF20 8.91 8.91 4.99 4.11 34.03
SF35 8.97 8.97 8.07 6.18 46.88
From Table 5, it can be seen that: 2
i) The NC beams without any reinforcement do not demonstrate any residual strength and 3
toughness. Compared to the NC beams, the macro fiber reinforced beams show more 4
attractive post-crack behavior, the residual strength and the toughness are enhanced 5
obviously. 6
ii) Compared to PP4, the residual strength f600 and f150 of PP6 increased by about 4% and 28%, 7
respectively, and the toughness T150 increased by about 16%. 8
iii) Compared to PP6, the residual strength f600 and f150 of SF20 increased by about 156% and 9
136%, respectively, and the toughness T150 increased by about 127%. 10
iv) Compared to SF20, the residual strength f600 and f150 of SF35 increased by about 62% and 11
50%, respectively, and the toughness T150 increased by about 38%. 12
3.2 Impact test results 13
The comparisons of the number of repeated impact to the first crack (N1) and to the failure (N2) 14
of all test samples are illustrated in Table 6. It can be observed that both the values of N1 and N2 15
exhibit a relatively large variation. 16
17
18

10
Table 6 Comparison of drop-weight results of different specimens 1
Specimen No. N1/N2
NC PP4 PP6 SF20 SF35 RC RC+PP4 RC+PP6 RC+SF20 RC+SF35
1 6/6 10/22 20/35 14/31 9/25 11/195 10/512 10/515 10/690 11/890
2 9/9 15/32 21/39 16/29 14/38 15/249 16/435 15/778 12/1015 14/930
3 13/13 16/30 22/34 20/49 20/54 19/289 18/334 19/489 16/1164 23/1218
4 17/17 19/35 22/44 23/36 24/57 22/373 19/386 19/924 21/1296 27/1347
5 18/18 20/39 24/41 42/67 39/59 27/481 25/595 20/894 27/1387 32/1401
6 25/25 20/42 26/46 60/99 79/97 31/512 40/673 33/859 31/1623 39/1608
Note: for each mix proportion, six specimens were tested. The specimen No. was arranged according to the 2
ascending order of N1. 3
The statistical analyses of experimental results are shown in Table 7. The impact energy 4
absorbed by the specimens can be calculated as follows [9]: 5
W Nmgh (1) 6
where W, N, m, g denote impact energy, number of repeated impact, mass of the drop hammer, 7
acceleration due to gravity and height of fall, respectively. 8
Table 7 Analyses of drop-weight test results 9
Specimen
Average
number
of blows
Standard
deviation (σ)
Coefficient of
variation (CV, %) Average first crack
impact energy(W1/J)
Average failure
impact
energy(W2/J) N1 N2 σN1 σN2 CVN1 CVN2
NC 15 15 7 7 47 47 400.4 400.4
PP4 17 33 4 7 23 21 453.8 880.9
PP6 23 40 2 5 10 12 614.0 1067.8
SF20 29 52 18 27 62 52 774.3 1388.4
SF35 31 55 26 24 83 44 827.7 1468.5
RC 21 350 7 128 36 37 560.6 9343.3
RC+PP4 21 489 10 129 49 26 560.6 13054.0
RC+PP6 19 743 8 193 40 26 507.2 19834.5
RC+SF20 20 1196 8 322 43 27 533.9 31927.5
RC+SF35 24 1232 11 280 44 23 640.7 32888.5
Based on the impact results in Table 7, the following points can be observed in terms of the first 10
crack impact energy (W1) and the failure impact energy (W2): 11
1) For the specimens of NC: 12
11
The first crack impact energy (W1) equals to the failure impact energy (W2), that is to say the 1
appearance of the crack and the failure of the specimen took place simultaneously, and the specimens 2
without fiber reinforcement show clearly brittle behavior. 3
2) For specimens reinforced with different macro PP fiber contents : 4
i) For PP4, the first crack impact energy (W1) and the failure impact energy (W2) were 453.8 J 5
and 880.9 J, respectively. Compared to NC, the absorbed impact energy increased by about 6
13% and 120%, respectively. 7
ii) For PP6, the first crack impact energy (W1) and the failure impact energy (W2) were 614.0 J 8
and 1067.8 J, respectively. Compared to NC, the absorbed impact energy increased by 9
about 53% and 167%, respectively; compared to PP4, the absorbed impact energy increased 10
by about 35% and 21%, respectively. 11
It can be seen that the addition of macro PP fibers can improve the ability of energy absorption 12
under impact load, and the energy absorption capacity increases with the increasing of fiber content. 13
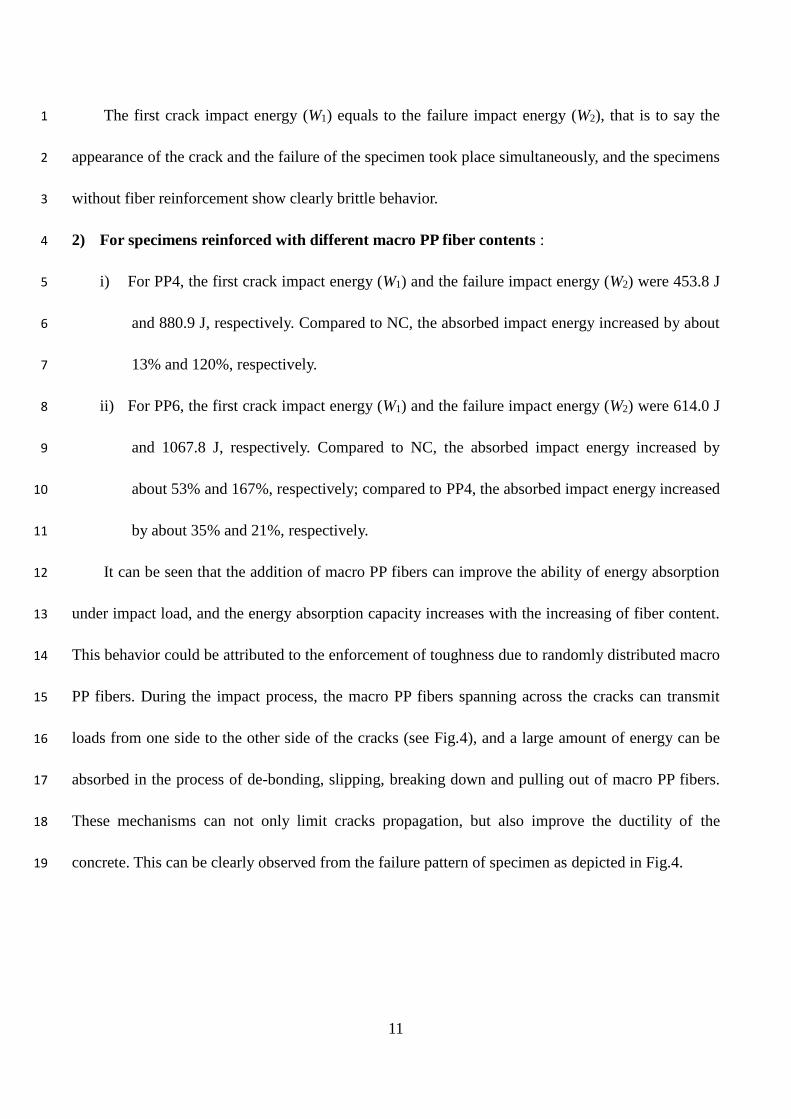
This behavior could be attributed to the enforcement of toughness due to randomly distributed macro 14
PP fibers. During the impact process, the macro PP fibers spanning across the cracks can transmit 15
loads from one side to the other side of the cracks (see Fig.4), and a large amount of energy can be 16
absorbed in the process of de-bonding, slipping, breaking down and pulling out of macro PP fibers. 17
These mechanisms can not only limit cracks propagation, but also improve the ductility of the 18
concrete. This can be clearly observed from the failure pattern of specimen as depicted in Fig.4. 19
12
1
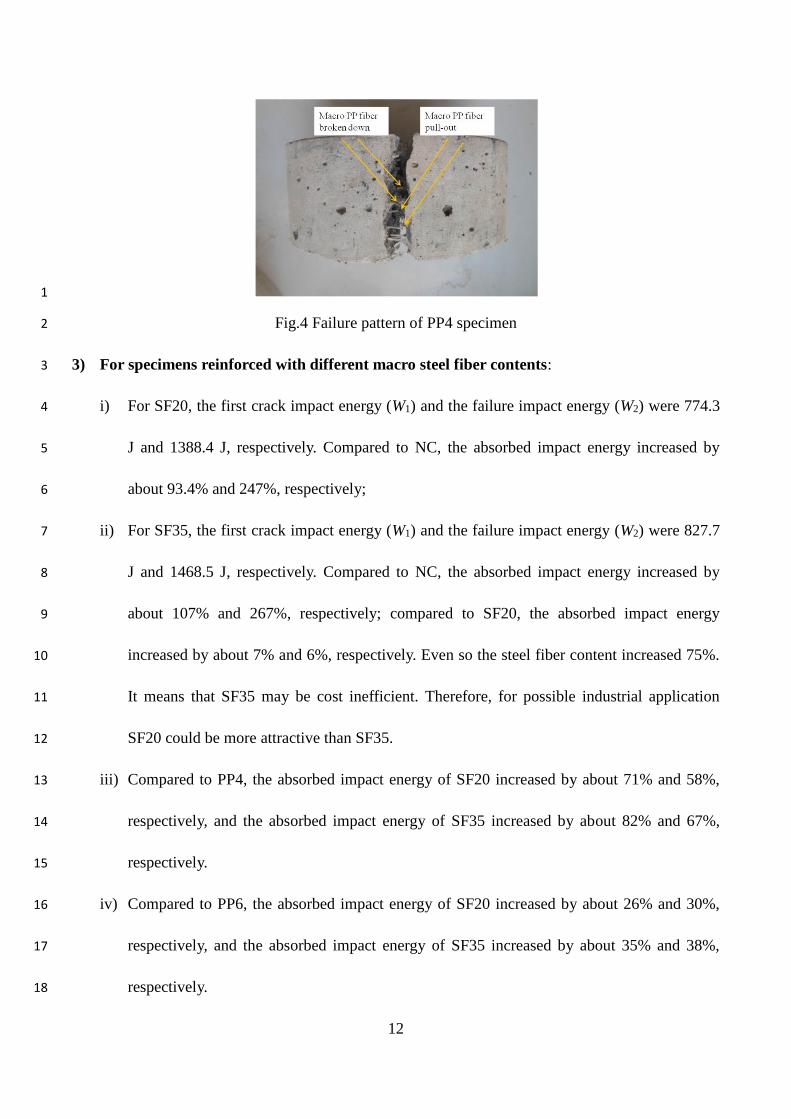
Fig.4 Failure pattern of PP4 specimen 2
3) For specimens reinforced with different macro steel fiber contents: 3
i) For SF20, the first crack impact energy (W1) and the failure impact energy (W2) were 774.3 4
J and 1388.4 J, respectively. Compared to NC, the absorbed impact energy increased by 5
about 93.4% and 247%, respectively; 6
ii) For SF35, the first crack impact energy (W1) and the failure impact energy (W2) were 827.7 7
J and 1468.5 J, respectively. Compared to NC, the absorbed impact energy increased by 8
about 107% and 267%, respectively; compared to SF20, the absorbed impact energy 9
increased by about 7% and 6%, respectively. Even so the steel fiber content increased 75%. 10
It means that SF35 may be cost inefficient. Therefore, for possible industrial application 11
SF20 could be more attractive than SF35. 12
iii) Compared to PP4, the absorbed impact energy of SF20 increased by about 71% and 58%, 13
respectively, and the absorbed impact energy of SF35 increased by about 82% and 67%, 14
respectively. 15
iv) Compared to PP6, the absorbed impact energy of SF20 increased by about 26% and 30%, 16
respectively, and the absorbed impact energy of SF35 increased by about 35% and 38%, 17
respectively. 18

13
Based on the analysis above, we can see that the addition of macro steel fibers can both improve 1
the first impact energy (W1) and the failure impact energy (W2). The energy absorption capacity 2
increased with the increasing of macro steel fiber dosage. It may trace back to the macro steel fibers, 3
as they are distributed randomly in the matrix, each fiber acts as a small-scale energy-absorbing 4
element, and can share a certain portion of the load during repeated impact. Thus, the FRC 5
specimens can absorb more impact energy compared to the NC counterparts. After cracking the 6
macro steel fibers continue to transmit tensile stresses across the crack in the concrete and prevent 7
the further spread of cracks and this may lead to a great improvement in the failure impact energy 8
(W2) and ductility of concrete [20]. The failure patterns are very different between macro steel fibers 9
and macro PP-fibers. As the macro PP-fibers are partly broken down and partly pulled out (Fig.4), 10
the most steel fibers are gradually pulled out (Fig.5) after the concrete cracking subjected to impact 11
loads. This mechanism can not only absorb and diffuse the impact energy by de-bonding, slipping 12
and pulling out of fibers in the matrix, but also delay the cracks extension, hence improve the failure 13
impact energy (W2). 14
15
Fig.5 Failure pattern of SF20 specimen 16
4) For specimens reinforced with rebars: 17
The reinforcement ratio of steel rebar reinforced specimens was 1.9%, and these specimens 18

14
were used to simulate the impact property of precast pile tip. The mass of the steel rebars of each 1
specimen is 0.209 kg, just as the macro steel fiber weight in the FRC with fiber content of 148 kg/m3. 2
The first crack impact energy (W1) and failure impact energy (W2) were 540.6 J and 9343.3 J. 3
Compared to NC specimens without any reinforcement, the absorbed impact energy of RC increased 4
by about 40% and 2233%, respectively. It shows that the addition of steel rebars can significantly 5
improve the failure impact energy (W2). It is due mainly to the bond effect on the interface between 6
concrete and steel rebars: after cracking the force transfer is mainly governed by bearing of the ribs 7
against the concrete(Fig.6 (a)), with the dropping operation continuing, the slipping between the 8
concrete and the rebars can significantly diffuse the impact energy, therefore, the failure impact 9
energy can be greatly improved, and the final failure can mainly be attributed to the longitudinal and 10
circumferential cracks (Fig.6 (b)) [40]. 11
12
(a) 13

15
1
(b) 2
Fig.6 Failure pattern: (a) pressure in front of ribs; (b) cracks of RC specimen 3
5) For specimens reinforced with macro PP fibers and steel rebars: 4
i) For RC+PP4, the first crack impact energy (W1) and failure impact energy (W2) were 560.6J 5
and 13054.0 J. Compared to NC, the absorbed impact energy increased by about 40% and 6
3180%, respectively. 7
ii) For RC+PP6, the first crack impact energy (W1) and failure impact energy (W2) were 507.2J 8
and 19834.5 J. Compared to NC, the absorbed impact energy increased by about 27% and 9
4820%, respectively. 10
iii) Compared to PP4, the absorbed impact energy of RC+PP4 increased by about 24% and 11
1382%, respectively. 12
iv) Compared to PP6, the first crack impact energy (W1) of RC+PP6 decreased by about 17%, 13
and failure impact energy (W2) increased by about 1758%. 14
v) Compared to RC, the first crack impact energy (W1) of RC+PP4 is no change, while the 15
failure impact energy (W2) of RC+PP4 increased by about 40%; the first crack impact 16
energy (W1) of RC+PP6 decreased by about 10%, and failure impact energy (W2) increased 17
by about 112%. 18

16
It demonstrates that composite use of macro PP fibers and steel rebars can greatly improve the 1
failure impact energy (W2). This enormous enhancement could be traced back to the possible energy 2
dissipation as followings: 3
The arresting of the cracks by macro PP fibers and steel rebars across the longitudinal 4
cracks; 5
Bridging the circumferential cracks by macro PP fibers; 6
Slipping of steel rebars and macro PP fibers in the matrix. 7
6) For specimens reinforced with macro steel fibers and steel rebars: 8
i) For RC+SF20, the first crack impact energy (W1) and failure impact energy (W2) were 533.9 9
J and 31927.5 J. Compared with NC, the absorbed impact energy increased by about 33% 10
and 7873%, respectively. 11
ii) For RC+SF35, the first crack impact energy (W1) and failure impact energy (W2) were 640.7 12
J and 32888.5 J. Compared with NC, the absorbed impact energy increased by about 60% 13
and 8113%, respectively. 14
iii) Compared to SF20 specimens, the first crack impact energy (W1) of RC+SF20 decreased by 15
about 30%, and failure impact energy (W2) increased by about 2200%. 16
iv) Compared to SF35 specimens, the first crack impact energy (W1) of RC+SF35 decreased by 17
about 20%, and failure impact energy (W2) increased by about 2140%. 18
v) Compared to RC specimens, the first crack impact energy (W1) of RC+SF20 decreased by 19
about 5%, and failure impact energy (W2) increased by about 242%; the absorbed impact 20
energy of RC+SF35 increased by about 14% and 252%, respectively. 21
It can be seen that the combined use of steel rebars and macro steel fibers can greatly increase 22
17
the failure impact energy (W2) and indicates enormous positive hybrid effect on the impact property. 1
3.3 Composite effect of steel rebars and different fibers on failure impact energy 2
The aim for the hybrid use of various reinforcements (such as rebars and fibers) was to achieve 3
a possible positive composite effect on the impact properties of concrete: namely a positive 4
composite effect of 1 + 1 ˃ 2. The composite effects of different mixture in this test were compared, 5
which can be seen clearly from Table 8. 6
Table 8 Comparison of composite effect on W2 with different macro fibers and fiber contents 7
No. Failure impact energy (W2/J) Observation
Group 1 RC PP4 RC+PP4
W2(RC)+W2(PP4)<W2(RC+PP4) 9343.3 880.9 13054.0
Group 2 RC PP6 RC+PP6
W2(RC)+W2(PP6)<W2(RC+PP6) 9343.3 1067.8 19834.5
Group 3 RC SF20 RC+SF20
W2(RC)+W2(SF20)<W2(RC+SF20) 9343.3 1388.4 31927.5
Group 4 RC SF35 RC+SF35
W2(RC)+W2(SF35)<W2(RC+SF35) 9343.3 1468.5 32888.5
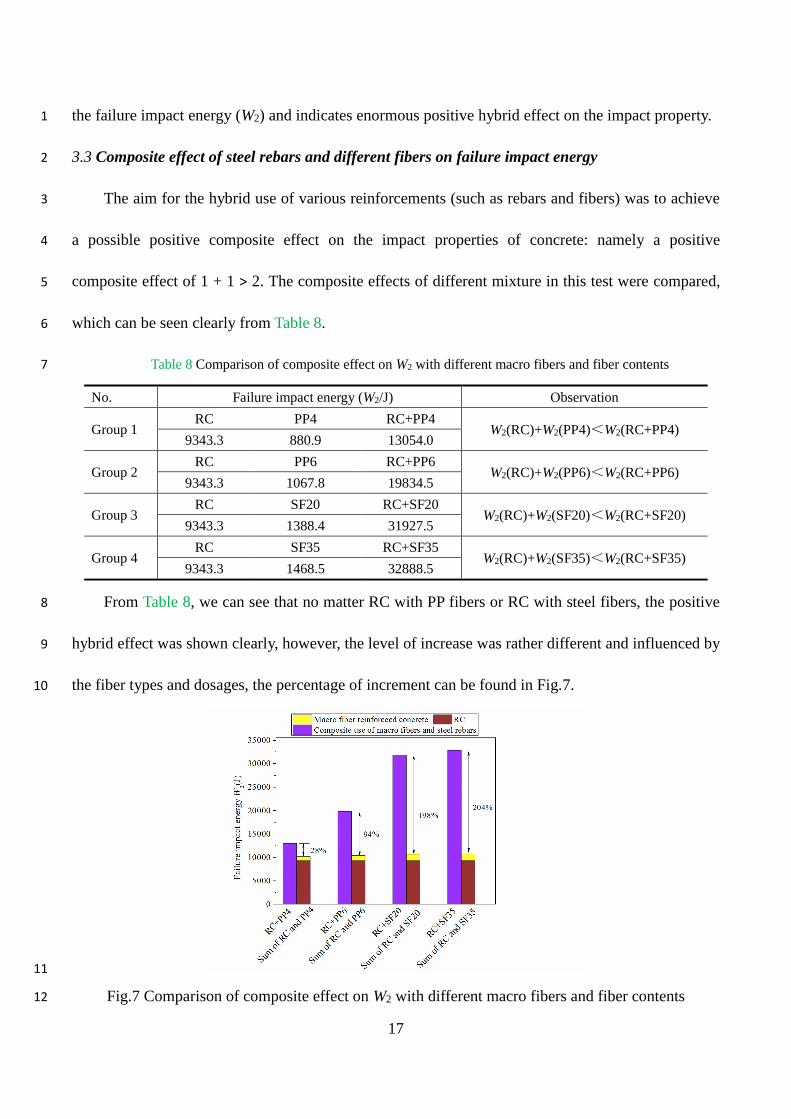
From Table 8, we can see that no matter RC with PP fibers or RC with steel fibers, the positive 8
hybrid effect was shown clearly, however, the level of increase was rather different and influenced by 9
the fiber types and dosages, the percentage of increment can be found in Fig.7. 10
11
Fig.7 Comparison of composite effect on W2 with different macro fibers and fiber contents 12

18
In order to compare the composite effects among specimens of hybrid use of steel rebar and 1
macro PP fibers with different fiber contents and specimens of hybrid use of steel rebar and macro 2
steel fibers with different fiber contents, the factor for composite effect (η) is introduced and can be 3
calculated by Eq. (2). 4
2-C
2-F 2-R
1W
W W
(2)
5
where η denotes the composite effect on the failure impact energy (W2), η>0 means positive 6
composite effect, η<0 means negative composite effect, η=0 means no composite effect; W2-C 7
denotes the failure impact energy of composite use of macro fibers and steel rebars reinforced 8
concrete specimens; W2-F denotes the failure impact energy of FRC specimens; W2-R denotes the 9
failure impact energy of RC specimens. 10
From Fig.7 and Eq.(2), some interesting points as follows can be observed: 11
i) The values of η of RC+PP4, RC+PP6, RC+SF20, RC+SF35 are 28%, 94%, 198%, 204%, 12
respectively. All of the values of η>0, so the combination of steel rebars and macro fibers 13
shows positive composite effect on W2. 14
ii) The η value of RC+PP6 is 94%. Compared to RC+PP4, the η value of RC+PP6 increases by 15
236%, even though the macro PP fiber contents increased 50% only. It means that RC+PP6 16
shows both superior impact property and cost efficient for possible industrial application. 17
iii) The η value of RC+SF35 is 204%. Compared to RC+SF20, the η value of RC+SF35 18
increases slightly (only 3%), even so the steel fiber content increased 75%. It means that 19
RC+SF35 may be cost inefficient. Hence, for possible industrial application the 20
combination of RC+SF20 could be more attractive than that of RC+SF35. 21
iv) Compared to RC+PP6, the value of η of RC+SF20 increases by 111%. Therefore, the hybrid 22
19
use of steel rebars and macro steel fibers presents much greater positive composite effect on 1
W2 than that of the combination of steel rebars and macro PP fibers. 2
3.4 Failure patterns of specimens 3
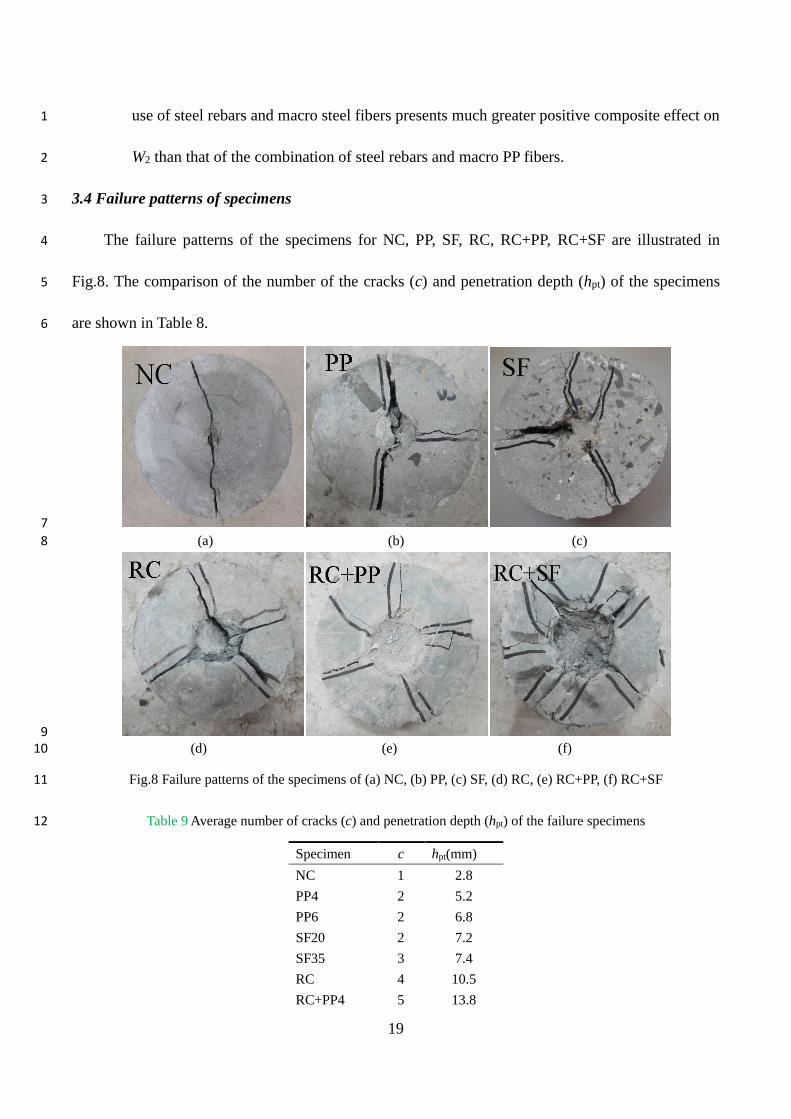
The failure patterns of the specimens for NC, PP, SF, RC, RC+PP, RC+SF are illustrated in 4
Fig.8. The comparison of the number of the cracks (c) and penetration depth (hpt) of the specimens 5
are shown in Table 8. 6
7
(a) (b) (c) 8
9 (d) (e) (f) 10
Fig.8 Failure patterns of the specimens of (a) NC, (b) PP, (c) SF, (d) RC, (e) RC+PP, (f) RC+SF 11
Table 9 Average number of cracks (c) and penetration depth (hpt) of the failure specimens 12
Specimen c hpt(mm)
NC 1 2.8
PP4 2 5.2
PP6 2 6.8
SF20 2 7.2
SF35 3 7.4
RC 4 10.5
RC+PP4 5 13.8

20
RC+PP6 5 15.6
RC+SF20 6 13.5
RC+SF35 6 18.6
1
From Fig.8 and Table 9, some phenomena as follows can be observed: 2
i) For the specimens of NC, when the first crack appears, the specimens broke down 3
immediately into two pieces (see Fig.8 (a)), and show an obviously brittle failure behavior. 4
ii) For the macro fiber reinforced specimens with different fiber dosage (PP, SF), when the first 5
crack appears, the specimen can continue to bear the impact loads and to absorb the impact 6
energy; the new cracks will occur gradually, most part of the specimens fail when 2-3 cracks 7
appear, and break into three or more pieces (see Fig.8 (b) and (c)). It shows well distributed 8
tensile stress and significantly ductile failure properties under impact. Compared to the NC 9
specimens, the values of hpt of PP4, PP6, SF20 and SF35 increase by 86%, 143%, 157% and 10
164%, respectively. 11
iii) For the steel rebar reinforced specimens, the failure process is similar to that of the PP and 12
SF, in most case, the specimens fail with 4 cracks, and break into four or more pieces (see 13
Fig.8 (d)). Compared to NC, the value of hpt of RC increases by 275%. 14
iv) For the composite use of macro fibers and steel rebars reinforced specimens (RC+PP, 15
RC+SF), the failure patterns improve from some large cracks to a number of small cracks 16
(see Fig.8 (e) and (f)). This phenomenon indicates that the stress redistribution in the 17
concrete matrix is achieved more evenly with the composite use of different fibers and steel 18
rebars. Compared to NC, the values of hpt of RC+PP4, RC+PP6, RC+SF increase by 393%, 19
457%, 382%, and 564%, respectively. 20
3.5 Distribution of impact property factors 21

21
Series of statistical models have been developed for analysis of fatigue and impact test results of 1
concrete over the last few decades [23,27-29,32,36-37,41-43]. Among them, the normal distribution 2
model is frequently introduced,, however, the goodness of fit test indicated that the impact test 3
results were poor fit to normal distribution at 95% level of confidence, as reported by the researchers 4
[27]. While, the two-parameter Weibull distribution has been proved by some investigations that it is 5
it is suitable to evaluate the fatigue performance of concrete [41-43]. Due to the similar failure 6
mechanism of the impact process and fatigue process [22, 37], the two-parameter Weibull 7
distribution is adopted in this study. In addition, we use graphical method to describe the impact 8
property factors of ten types of samples. 9
The cumulative distribution function F n of two-parameter Weibull probability law can be 10
expressed as [40-42]: 11
( ) 1 exp ( )n
F nu
(3) 12
where n is the impact life of the concrete; α is the Weibull slop; u is the scale parameter. 13
The function F n corresponds to the failure probability. So the survivorship function may be 14
defined in Eq. (4): 15
( ) 1 ( ) expn
L n F nu
(4) 16
Taking twice natural logarithm for both sides of Eq. (4) gives Eq.(5): 17
1
ln ln ln( ) ln( )n uL n
(5) 18
Setting 1
ln lnYL n
, ln( )X n , ln( )u , then 19
Y X (6) 20
22
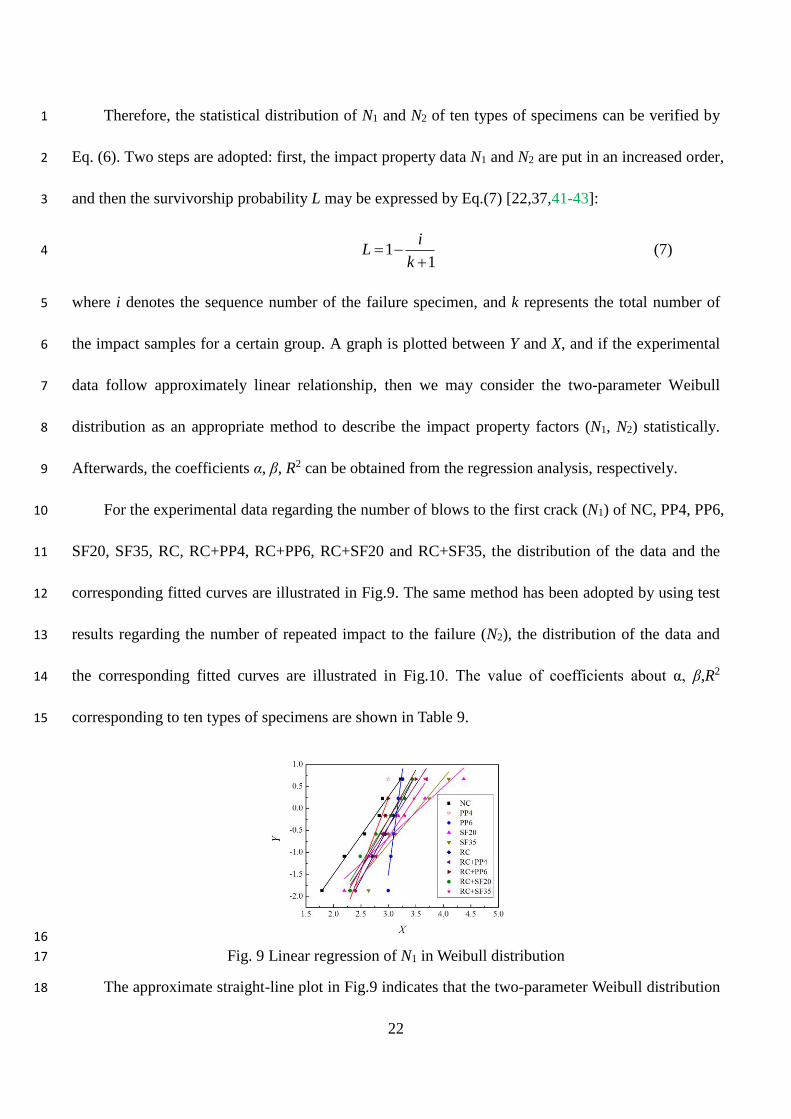
Therefore, the statistical distribution of N1 and N2 of ten types of specimens can be verified by 1
Eq. (6). Two steps are adopted: first, the impact property data N1 and N2 are put in an increased order, 2
and then the survivorship probability L may be expressed by Eq.(7) [22,37,41-43]: 3
11
iL
k
(7) 4
where i denotes the sequence number of the failure specimen, and k represents the total number of 5
the impact samples for a certain group. A graph is plotted between Y and X, and if the experimental 6
data follow approximately linear relationship, then we may consider the two-parameter Weibull 7
distribution as an appropriate method to describe the impact property factors (N1, N2) statistically. 8
Afterwards, the coefficients α, β, R2 can be obtained from the regression analysis, respectively. 9
For the experimental data regarding the number of blows to the first crack (N1) of NC, PP4, PP6, 10
SF20, SF35, RC, RC+PP4, RC+PP6, RC+SF20 and RC+SF35, the distribution of the data and the 11
corresponding fitted curves are illustrated in Fig.9. The same method has been adopted by using test 12
results regarding the number of repeated impact to the failure (N2), the distribution of the data and 13
the corresponding fitted curves are illustrated in Fig.10. The value of coefficients about α, β,R2 14
corresponding to ten types of specimens are shown in Table 9. 15
16
Fig. 9 Linear regression of N1 in Weibull distribution 17
The approximate straight-line plot in Fig.9 indicates that the two-parameter Weibull distribution 18

23
may be an appropriate method for the statistical description of the number of blows to the first crack 1
(N1). The large difference of the various slopes may be caused by the scatter of the concrete matrix of 2
the elastic pre-cracking behavior. 3
4
Fig. 10 Linear regression of N2 in Weibull distribution 5
The approximate straight-line plot in Fig.10 indicates that the two-parameter Weibull 6
distribution is a suitable approach for the statistical description of the number of blows to the failure 7
(N2). The small difference of the various slopes can be traced back to the fiber or rebar effect on the 8
ductile behavior of specimens during the post crack period. 9
Table 10 Linear regression of impact resistance in Weibull distribution 10
Impact resistance
factor Concrete type
Regression
coefficient α
Regression
coefficient β
Correlation
coefficient R2
N1
NC 1.766 5.030 0.987
PP4 3.282 9.615 0.901
PP6 9.240 29.203 0.903
SF20 1.162 4.158 0.941
SF35 1.501 5.316 0.869
RC 2.398 7.613 0.998
RC+PP4 1.913 6.150 0.928
RC+PP6 2.239 6.960 0.905
RC+SF20 2.018 6.300 0.972
RC+SF35 1.854 6.216 0.974
N2
NC 1.766 5.030 0.988
PP4 3.943 14.213 0.970
PP6 7.425 27.782 0.960
SF20 1.952 8.128 0.943

24
SF35 1.784 7.328 0.874
RC 2.382 14.282 0.973
RC+PP4 3.465 21.852 0.987
RC+PP6 3.059 20.142 0.869
RC+SF20 3.033 21.864 0.970
RC+SF35 3.784 27.315 0.941
From Table 10, it can be seen that the R2 values of ten groups are larger than 0.950; the R2values 1
of seven groups are between 0.900 and 0.950; and the values of R2 of only three groups are between 2
0.85 and 0.900, The R2 values of all kinds of specimens are greater than 0.850, which substantiated 3
the existence of linear relationship between Y and X. This validates that the distribution of the 4
number of repeated impact to the first crack (N1) and to the failure (N2) of all tested specimens follow 5
the two-parameter Weibull distribution. 6
4. Conclusions 7
Based on the experimental and analytical investigation, the main conclusions could be drawn as 8
follows: 9
1. The improvement of impact properties (number of blows, impact energy, cracking property, 10
penetration depth) of NC can be achieved by addition of mono macro PP fibers or mono 11
macro steel fibers. The failure patterns of FRC specimens transform from obvious 12
brittleness to well ductility. 13
2. The hybrid use of steel rebars and macro fibers provides positive composite effect on 14
improvement of the failure impact energy (W2). 15
3. The combined use of steel rebars and macro steel fibers demonstrates more obvious 16
composite effect on the failure impact energy (W2) than that of the combined use of macro 17
PP fibers and steel rebars. 18
4. The energy absorption capacity and the positive composite effect increase with the 19
25
increasing of macro fiber dosage. 1
5. The hybrid use of steel rebars and macro fibers can be an effective way for enhancing of the 2
impact properties of the concrete; RC+PP6 and RC+SF25 show both good impact properties 3
and cost efficient for possible industrial application. 4
6. Penetration depth can reflect the ability of impact energy absorption, and maybe used as an 5
index to evaluate the impact properties of the concrete. 6
7. The statistical method based on two-parameter Weibull theory can be adopted to analyze the 7
distribution of the number of repeated impact to the first crack (N1) and to the failure (N2) of 8
each group of specimens. 9
Acknowledgements 10
The authors gratefully acknowledge the National Natural Science Foundation of China: Grants: 11
51578109 and 51121005.DUT and Fundaçãopara a Ciência e a Tecnologia(SFRH/BPD/22680/2005). 12
References 13
[1] Agostinacchio M, Ciampa D, Olita S. The vibrations induced by surface irregularities in road 14
pavements – a Matlab® approach. Eur Transp Res Rev 2013; 6(3): 267-275. 15
doi:10.1007/s12544-013-0127-8. 16
[2] Dey V, Bonakdar A, Mobasher B. Low-velocity flexural impact response of fiber-reinforced 17
aerated concrete. Cem Concr Compos 2014; 49(5):100-110. 18
doi:10.1016/j.cemconcomp.2013.12.006. 19
[3] Düring D, Weiß L, Stefaniak D, et al. Low-velocity impact response of composite laminates with 20
steel and elastomer protective layer. Compos Struct 2015; 134(15):18-26. 21
doi:10.1016/j.compstruct.2015.08.001. 22

26
[4] Zhang M H, Li L, Paramasivam P. Flexural toughness and impact resistance of 1
steel-fibre-reinforced lightweight concrete. Mag Concrete Res 2004; 56(5): 251-262. 2
doi:10.1680/macr.2004.56.5.251. 3
[5] Altun F, Haktanir T, Ari K. Effects of steel fiber addition on mechanical properties of concrete 4
and RC beams. Construct Build Mater 2007; 21:654-661. 5
doi:10.1016/j.conbuildmat.2005.12.006. 6
[6] Ding Y., Kusterle W. Compressive stress-strain-relationship of steel fibre reinforced concrete at 7
early age. Cem Concr Res 2000; 30: 1573-1579.doi:10.1016/s0008-8846(00)00348-3. 8
[7] Ding Y., Kusterle W. Comparative study between steel fibre reinforced concrete and steel mesh 9
reinforced concrete at early ages in the panel tests. Cem Concr Res 1999; 29:1827-1834. 10
doi:10.1016/s0008-8846(99)00177-5. 11
[8] Ding Y., Liu Hekai, Fernando Pacheco-Torgal, Said Jalali.Experimental investigation on the 12
mechanical behaviour of the fiber reinforced high performance concrete tunnel segment. 13
Compos Struct 2011; 93:1284-1289.doi:10.1016/j.compstruct.2010.10.006. 14
[9] Mohannadi Y, Carkon-Azad R, Singh SP, et al. Impact resistance of steel fibrous concrete 15
containing fibres of mixed aspect ratio. Construct Build Mater 2009; 23:183-189. 16
doi:10.1016/j.conbuildmat.2008.01.002. 17
[10] Mahmoud N, Afroughsabet V. Combined effect of silica fume and steel fibers on the impact 18
resistance and mechanical properties of concrete. Int J Impact Eng 2010; 37:879-886. 19
doi:10.1016/j.ijimpeng.2010.03.004. 20
[11] Rao H S, Ghorpade V G, Ramana N V, et al. Response of SIFCON two-way slabs under impact 21
loading. Int J Impact Eng, 2010, 37(4):452-458.doi:10.1016/j.ijimpeng.2009.06.003. 22
[12] Abbas H, Gupta N K, Alam M. Nonlinear response of concrete beams and plates under impact 23
loading. Int J Impact Eng, 2004, 30(8–9):1039-1053.doi:10.1016/j.ijimpeng.2004.06.011. 24

27
[13] Nia A A, Hedayatian M, Nili M, et al. An experimental and numerical study on how steel and 1
polypropylene fibers affect the impact resistance in fiber-reinforced concrete. Int J Impact Eng, 2
2012, 46(4):62–73.doi:10.1016/j.ijimpeng.2012.01.009. 3
[14] Colin D. Johnston, Robert W. Zemp. Flexural fatigue performance of steel fiber reinforced 4
concrete-influence of fiber content, aspect ratio, and type. ACI Mater J 1991; 88:374-383. 5
doi:10.14359/1875. 6
[15] Pujadas P, Blanco A, Fuente A D L, et al. Cracking behavior of FRC slabs with traditional 7
reinforcement. Mater Struct, 2012, 45(5):707-725.doi: 10.1617/s11527-011-9791-0. 8
[16] Pujadas P, Blanco A, Cavalaro S, et al. Plastic fibres as the only reinforcement for flat 9
suspended slabs: Experimental investigation and numerical simulation. Construct Build Mater, 10
2014, 57(57):92-104.doi: 10.1016/j.conbuildmat.2014.01.082. 11
[17] Pujadas P, Blanco A, Cavalaro S H P, et al. Plastic fibres as the only reinforcement for flat 12
suspended slabs: Parametric study and design considerations. Construct Build Mater, 2014, 13
70:88-96.doi: 10.1016/j.conbuildmat.2014.07.091. 14
[18] Erdem S, Dawson A R, Thom N H. Microstructure-linked strength properties and impact 15
response of conventional and recycled concrete reinforced with steel and synthetic macro fibres. 16
Construct Build Mater 2011; 25(10): 4025-4036.doi:10.1016/j.conbuildmat.2011.04.037. 17
[19] Nicola Buratti, Claudio Mazzotti, Macro Savoia. Post-cracking behavior of steel and 18
macro-synthetic fibre-reinforced concretes. Construct Build Mater 2011; 25:2713-2722. 19
doi:10.1016/j.conbuildmat.2010.12.022. 20
[20] Ding Y, Zhang Y, Thomas A. The investigation on strength and flexural toughness of fibre 21
cocktail reinforced self-compacting high performance concrete. Construct Build Mater 2009; 22
23(1): 448-452. doi:10.1016/j.conbuildmat.2007.11.006. 23
28
[21] Blanco A, Pujadas P, Fuente A D L, et al. Influence of the Type of Fiber on the Structural 1
Response and Design of FRC Slabs. J Struct Eng, 2016, 142(9). 2
doi:10.1061/(ASCE)ST.1943-541X.0001515. 3
[22] Wang L, Wang H, JIA. J. Impact resistance of steel-fibre-reinforced lightweight-aggregate 4
concrete. Mag Concrete Res 2009; 67:539-547.doi: 10.1680/macr.2007.00128. 5
[23] Song P S, Wu J C, Hwang S, et al. Assessment of statistical variations in impact resistance of 6
high-strength concrete and high-strength steel fiber-reinforced concrete. Cem Concr Res 2005; 7
35(2):393-399. doi:10.1016/j.cemconres.2004.07.021. 8
[24] Mo K H, Yap S P, Alengaram U J, et al. Impact resistance of hybrid fibre-reinforced oil palm 9
shell concrete. Construct Build Mater 2014; 50: 499-507. 10
doi:10.1016/j.conbuildmat.2013.10.016. 11
[25] Hrynyk T D, Vecchio F J. Behavior of steel fiber-reinforced concrete slabs under impact load. 12
ACI Struct J 2014; 1213-1223.doi: 10.14359/51686923. 13
[26] Nataraja M C, Nagaraj T S, Basavaraja S B. Reproportioning of steel fibre reinforced concrete 14
mixes and their impact resistance. Cem Concr Res 2005; 35(12): 2350-2359. 15
doi:10.1016/j.cemconres.2005.06.011. 16
[27] Nataraja M C, Dhang N, Gupta A P. Statistical variations in impact resistance of steel 17
fiber-reinforced concrete subjected to drop weight test. Cem Concr Res 1999; 29(7): 989-995. 18
doi:10.1016/s0008-8846(99)00052-6. 19
[28] Atef B, Ashraf F, Andrew K. Statistical variations in impact resistance of polypropylene 20
fibre-reinforced concrete. Int J Impact Eng 2006; 32: 1907–1920. 21
doi:10.1016/j.ijimpeng.2005.05.003. 22
[29] Song P.S, Wu J.C, Hwang S, Sheu B.C. Statistical analysis of impact strength and strength 23
reliability of steel-polypropylene hybrid fiber-reinforced concrete. Construct Build Mater 24
2005;19:1-9. doi:10.1016/j.conbuildmat.2004.05.002. 25

29
[30] Yew M K, Othman I, Yew M C, et al. Strength properties of hybrid nylon-steel and 1
polypropylene-steel fibre-reinforced high strength concrete at low volume fraction. Int J Phys 2
Sci 2011; 6(33): 7584-7588.doi: 10.5897/ijps11.736. 3
[31] Soe K T, Zhang Y X, Zhang L C. Impact resistance of hybrid-fiber engineered cementitious 4
composite panels. Compos Struct 2013; 104: 320-330.doi:10.1016/j.compstruct.2013.01.29. 5
[32] Rahmani T, Kiani B, Shekarchi M, et al. Statistical and experimental analysis on the behavior 6
of fiber reinforced concretes subjected to drop weight test. Construct Build Mater 2012; 37: 7
360-369. doi:10.1016/j.conbuildmat.2012.07.068. 8
[33] Bentur A, Mindess S. Fibre reinforced cementitious composites. Taylor & Francis, 2007. 9
[34] ACI Committee 544. Measurement of properties of fiber reinforced concrete. ACI Mater J 1988; 10
85(6): 583-593. 11
[35] Myers J J, Tinsley M. Impact resistance of blast mitigation material using modified ACI 12
drop-weight impact test. ACI Mater J 2013; 110(3): 339-348.doi:10.14359/51685668. 13
[36] Chen X Y, Ding Y N, C. Azevedo. Combine effect of steel fibers and steel rebars on impact 14
resistance of high performance concrete. J Cent South Univ Technology 2011; 18: 1677-1684. 15
doi:10.1007/s11771-011-0888-y. 16
[37] Li J., Zhang K., Deng Z. Distribution regularity of flexural impact resistance of synthetic 17
macro-fiber reinforced concrete. J Architect Civil Eng 2007; 24(4): 54-59. (in Chinese) 18
doi:10.3321/j.issn:1673-2049.2007.04.010. 19
[38] ASTM C1609/C1609M-12. Standard Test Method for Flexural Performance of 20
Fiber-Reinforced Concrete (Using Beam With Third-Point Loading). 2012. 21
[39] Concrete, T.E.G.f.S.C., The European Guide lines for Self-Compacting Concrete, BIBM, et al., 22
Editors. 2004. 23
[40] CEB-FIP, Structural Concrete-Bulletion No.1.Paris, France,1999. 24

30
[41] Li H., Zhang M., Ou J. Flexural fatigue performance of concrete containing nano-particles for 1
pavement. Int J Fatigue 2007; 29(7):1292-1301.doi:10.1016/j.ijfatigue.2006.10.004. 2
[42] Goel S, Singh S P, Singh P. Fatigue analysis of plain and fiber-reinforced self-consolidating 3
concrete. ACI Mater J 2012; 109:573-582.doi:10.14359/51684089. 4
[43] Raif S, Irfan A. Statistical analysis of bending fatigue life data using Weibull distribution in 5
glass-fiber reinforced polyester composites. Mater Des2008; 29(6):1170-1181. 6
doi:10.1016/j.matdes.2007.05.005. 7