Experimental Investigation of the Al-Ca-Zn system · Experimental Investigation of the Al-Ca-Zn...
115
Experimental Investigation of the Al-Ca-Zn system Shabnam Konica A Thesis in The Department of Mechanical and Industrial Engineering Presented in Partial Fulfillment of the Requirements for the Degree of Master of Applied Science (Mechanical Engineering) at Concordia University Montreal, Quebec, Canada January 2013 © Shabnam Konica, 2013
Transcript of Experimental Investigation of the Al-Ca-Zn system · Experimental Investigation of the Al-Ca-Zn...
Experimental Investigation of the Al-Ca-Zn system
Shabnam Konica
A Thesis in
The Department of
Mechanical and Industrial Engineering
Presented in Partial Fulfillment of the Requirements for the Degree of Master of Applied Science (Mechanical Engineering) at
Concordia University Montreal, Quebec, Canada
January 2013
© Shabnam Konica, 2013
CONCORDIA UNIVERSITY School of Graduate Studies
This is to certify that the thesis prepared
By: Shabnam Konica
Entitled: Experimental investigation of the Al-Ca-Zn system
and submitted in partial fulfillment of the requirements for the degree of
Master of Applied Science in Mechanical Engineering
complies with the regulations of the University and meets the accepted standards with respect to originality and quality.
Signed by the final examining committee:
Dr. Hoi Dick Ng Chair
Dr. Zhigang Tian Examiner
Dr. Rolf Wüthrich Examiner
Dr. Mamoun Medraj Supervisor
Approved by Chair of Department or Graduate Program Director
_________________________________________________ Dean of Faculty
Date May 14, 2013
ABSTRACT
Experimental Investigation of the Al-Ca-Zn System
Shabnam Konica
In this work, the isothermal section of the Al-Ca-Zn system has been investigated at
350°C using 5 diffusion couples and 26 key alloys. The actual compositions of the alloys
are measured by inductively coupled plasma technique. Phase relations and solubility
limits of the binary and ternary compounds have been determined by means of electron
probe microanalysis and X-ray diffraction. In the current work, five ternary compounds
have been found, three of which are reported for the first time: ternary intermetallic IM1
with the formula AlxCa8.5Zny (26≤x≤29, 62≤y≤65at 350ºC), ternary intermetallic IM3
with the formula Al3-xCaZx (2≤x≤2.2 at 350oC) and ternary intermetallic IM5 with the
formula Al2Ca9Zn3. The crystal structure information of IM1 has been studied by X-ray
diffraction technique. XRD data has shown that IM1 is a solid solution that crystallizes in a
cubic structure with Pm3�m (221) space group having BaHg11 prototype. The homogeneity
ranges of IM2 and IM4 have been determined at 350oC. Binary compounds Al14Ca13,
Al2Ca, Al4Ca, CaZn2, CaZn3, CaZn5, CaZn11 and CaZn13 have extended solid solubility
into the ternary system. For Al14Ca13, Al2Ca and Al4Ca, Al-atom is substituted by Zn. For
CaZn2, CaZn3, CaZn5, CaZn11 and CaZn13 Zn is substituted by Al.
iii
ACKNOWLEDGEMENTS
This project would not have been possible without the help of several individuals, who in
one way or another contributed their valuable assistance in the completion of this study.
First of all, I would like to express my gratitude to my thesis supervisor, Dr. Mamoun
Medraj for his constant support, guidance and suggestions.
I would like to thank Research Associate, Dr. Dmytro Kevorkov for his continuous
supervision and constructive suggestions both in experimental works and technical
writing.
I would like to acknowledge the help of Ms. Ming Wei and Mr. Alain Tessier from the
chemistry department of Concordia University in conducting the Inductively Coupled
Plasma-Mass Spectrometry measurements. In addition, I want to thank Mr. Lang Shi
from McGill University for his help with EPMA experiments.
I am grateful to all of my group members for their support during the research.
Furthermore, financial support from General Motors of Canada Ltd. and NSERC through
the CRD grant program is gratefully acknowledged.
iv
TABLE OF CONTENTS
LIST OF ABBREVIATIONS…………………………………………………….vii
LIST OF FIGURES……………………………………………………………....viii
LIST OF TABLES………………………………………………………………...xii
CHAPTER 1………………………………………………………………………..1
INTRODUCTION…………………………………………………….………........1
1.1Importance of the Al-Ca-Zn system………………………………………….1
1.2 Challenges of the Al-Ca-Zn system………………………………………….3
1.3 Objectives…………………………………………………………………….4
CHAPTER 2………………………………………………………………………...5
LITERATURE REVIEW……………………………………………………….…..5
2.1. The Al-Ca binary system………………………………………………….….5
2.1.1 Phase diagram data………………………………………………………...5
2.1.2 Thermodynamic data………………………………………………………6
2.2 The Ca-Zn binary system………………………………….…………………11
2.2.1 Phase diagram data………………………………………………………..11
2.2.2 Thermodynamic data………………………………………………….......16
2.3 The Al-Zn binary system…………………………………………………......17
2.3.1 Phase Diagram data……………………………………………………….17
2.3.2 Thermodynamic data………………………………………………………21
2.4 The Al-Ca-Zn ternary system……………… ………………………….…….24
2.4.1 Phase Diagram data…………………………………………………….....24
v
2.5. Diffusion couple technique…………………………………..…………….. 37
CHAPTER 3………………………………………………………………………..39
EXPERIMENTAL PROCEDURE…………………………………………………39
3.1 Solid-solid diffusion couples………………………………………..…..........39
3.2 Solid-liquid diffusion couples……………………….……………………….40
3.3 Key samples preparation…………………………………………………......41
3.3.1 Inductively coupled plasma technique……………………………………42
3.4 Analysis of the samples………………………………………………………43
3.4.1 Electron probe micro-analysis (EPMA)…………………………………..43
3.4.2 X-ray diffraction technique………………………………………………..44
CHAPTER 4………………………………………………………………………...46
RESULTS AND DISCUSSIONS…………………………………………………..46
4.1 Isothermal section at 350ºC through diffusion couples………………………46
4.1.1 Solid-solid diffusion couples………………………………………………47
4.1.2. Solid-liquid diffusion couple ………………………………………….....59
4.2. Diffusion couple morphology……………………………………………….62
4.3 Key alloys analysis……………………….…………………………………..67
4.3.1 Homogeneity ranges and crystallographic information of IM1 and phase
relations between IM1, IM2 and CaZn13………………….........................67
4.3.2 Homogeneity ranges of IM2, IM3 and CaZn5 and phase relations among
IM2, IM3, IM4, CaZn2 and CaZn5 phases………………………………..72
4.3.3 Homogeneity ranges and phase relationship between IM4, IM5, Al14Ca13,
Al2Ca and CaZn2 phases………………………………………..................82
vi
4.3.4 The phase relationship between CaZn3 and CaZn2…………….…………85
4.4. The Al-Ca-Zn isothermal section at 350oC……………...………………….88
CHAPTER 5……………………………………………………………………..…92
CONCLUSION…………………………………………………………………….92
5.1. Concluding remarks…….……………………………………………………92
5.2. Contribution…………………………………………………………………..89
5.3. Future works…………………………………………………………………..92
REFERENCES………………………………………………………………………94
vii
LIST OF ABBREVIATIONS
OM Optical Microscopy
SEM Scanning Electron Microscopy
EPMA Electron Probe Microanalysis
XRD X-ray Diffraction
ICP Inductively Coupled Plasma
SSDC Solid-Solid Diffusion Couple
SLDC Solid-Liquid diffusion Couple
KS Key Sample
viii
LIST OF FIGURES
Figure 2.1 Plot of heat of formation against mole fraction Al for different intermetallic compounds in the Al-Ca system[16]
7
Figure 2.2 Calculated enthalpies of mixing of Al and Ca in liquid Al-Ca alloy at 827oC by Wasiur-Rahman [19] in comparison with the experimental results [17, 18]
8
Figure 2.3 Calculated activity of Al and Ca in the liquid at 1100oC [19] in comparison to experimental works [20, 21]
9
Figure 2.4 The Al-Ca phase diagram based on the optimization of Wasiur-Rahman [14] in comparison with the experimental results [9-11]
10
Figure 2.5 The calculated Ca-Zn phase diagram [26]
15
Figure 2.6 The calculated Ca-Zn phase diagram [39]
15
Figure 2.7 Activities of Ca and Zn in the liquid [39-41] 16
Figure 2.8 Heat of formation of the intermediate phases of the Ca-Zn system 17
Figure 2.9 Calculated Al-Zn phase diagram [19]
21
Figure 2.10 Calculated enthalpy of mixing of liquid at 680oC and fcc phase at 380oC [72]
22
Figure 2.11 Calculated activity of Al and Zn in the liquid state at 727oC and 800oC [19]
23
Figure 2.12 Calculated partial Gibbs energy of Al in the fcc phase at 380oC [19]
24
Figure 2.13 Trend of a and c lattice parameters of the Ca(Zn1-xAlx)4 phases and the variation of α and β bond angles within the Zn/Al structure [94]
26
Figure 2.14 The psedobinary Al2Ca-CaZn2 phase diagram reported by Söderberg et al. [95], the black circles represent the positions of the key alloys; the broken line is associated with the peritectic formation of the impurity AlxCa3.33Zn11-x.
28
Figure 2.15 X-ray diffraction patterns of three representative Al2-xCaZnx alloys: (a) x =0.15 (C15 type), (b) x =0.65 (C36 type) and (c) x = 0.95 (KHg2 type). The vertical bars show the calculated Bragg reflection positions and the vertical bars on the bottom show the reflection positions for silicon, which was used as an internal standard [95]
29
Figure 2.16 a) HRTEM image of Al1.3CaZn0.7, (b) ED pattern of Al1.3CaZn0.7 along [100] together with simulated patterns for the C36 and C14 structure [95]
29
ix
Figure 2.17 Structure types and lattice parameters for the Ca1–y(Zn1–xAlx)5-2y phase [94]
31
Figure 2.18 Lattice parameters, unit cell volume Vc and c/a ratio, as a function of x, in Ca2(Zn1–xAlx)17 phases. The points refer to the nominal compositions and lattice parameters obtained by powder diffraction data
32
Figure 2.19 Liquidus projection of Al-Ca-Zn ternary system [90] 35
Figure 2.20 Liquidus projection of the Al-Ca-Zn ternary system [19, 23] 36
Figure 2.21 The isothermal section of the Al-Ca-Zn system at 350oC based on the thermodynamic model of Wasiur-Rahman [23] and the experimental results reported by [90-97]
37
Figure 3.1 Compositions of the end members of the diffusion couples, the red lines designate the solid-state diffusion couples where the violet line corresponds to the solid-liquid diffusion couple
41
Figure 3.2 Schematic of a typical ICP-AES
42
Figure 3.3 Schematic of EPMA
44
Figure 3.4 Schematic of powder XRD
45
Figure 4.1 (a), (b) and (c) The back-scattered electron image of SSDC-1 annealed at 350oC for 5 weeks showing all the phases, (d) magnified view of the ternary alloy (e) compositional profile of the line scan of Figure 4.1 (b)
49
Figure 4.2 (a) and (b) Back-scattered electron image of SSDC-2 at 350oC annealed for 5 weeks, (c) the microstructure of fcc Al miscibility, (d) compositional profile of the line scan performed in Figure 4.2 (b)
52
Figure 4.3 Partial isothermal section of the Al-Ca-Zn system from 0 to 30 at.% Ca at 350ºC obtained from SSDC-1 and SSDC-2
53
Figure 4.4 (a), (b), (c) and (d) Back-scattered electron image of SSDC-3 with increased magnification showing 8 different intermetallics
55
Figure 4.5 (a) Back-scattered electron image of SSDC-4, (b) and (c) magnified view of different phases in SSDC-4
57
Figure 4.6 Partial isothermal section of the Al-Ca-Zn system obtained from SSDC-3 and SSDC-4 annealed at 350ºC for 5 weeks
58
Figure 4.7 (a) Backscattered electron image of solid-liquid diffusion couple Al2Ca-Zn, (b) The microstructure of the fcc Al miscibility
60
x
Figure 4.8 Line scan performed on the solid-liquid diffusion couple from Figure 4.7
60
Figure 4.9 Partial isothermal section of the Al-Ca-Zn system from 0 to 30 at.% Ca at 350ºC obtained from solid-liquid diffusion couple Al2Ca-Zn
61
Figure 4.10 Isothermal section of the Al-Ca-Zn system at 350oC based on the results obtained from 4 solid-state diffusin couples and one solid-liquid diffusion couple
62
Figure 4.11 (a) The morphology of the diffusion zone evolved in the solid-solid diffusion couple SSDC-2 (b) The possible morphologies in solid-solid diffusion couples when a pure element is attached to a three-phase alloy [96]
64
Figure 4.12 (a) Morphology of the micro-diffusion couple IM4-CaZn11: the tooth-like morphology and (b) The CaZn2-CaZn11 micro-diffusion couple (c) The tooth-like morphology in SSDC-3
65
Figure 4.13 (a) Microstructures of KS1 (b) XRD-pattern of KS1(c) Microstructures of KS2 (d) Microstructures of KS3 (e) Microstructures of KS4
71
Figure 4.14 The phases of the Al-Ca-Zn system at 350oC showing the results obtained from KS1 to KS4
72
Figure 4.15 Figure 4.16 Figure 4.17 Figure 4.18 Figure 4.19 Figure 4.20 Figure 4.21
Microstructures of KS5 (i) general, (ii) magnified (a) Microstructures and (b) XRD pattern of KS6 (a) Microstructures and (b) XRD pattern of KS7 (a) Microstructures and (b) XRD pattern of KS8 (a) Microstructures and (b) XRD pattern of KS9 Microstructures of (a) KS10, (b) KS11 (a) Microstructures and (b) XRD pattern of KS12
75 75 77 78 79 80 80
Figure 4.22 Phase equilibriums and homogeneity ranges of different phases obtained from KS5 to KS12
81
Figure 4.23 (a) The microstructure, (b) EPMA line scan profile, (c) the XRD pattern of KS13
85
Figure 4.24 (a) Microstructure of KS14 after 5 weeks annealing at 350ºC, (b) higher magnified microstructure with EPMA line scan, (c) EPMA line scan profile
86
xi
Figure 4.25 (a) The microstructure of KS15, (b) the microstructure of KS16, (c) the XRD
pattern of KS15
87
Figure 4.26 Phase equilibriums and homogeneity ranges of different phases obtained from KS13 to KS16
88
Figure 4.27 Microstructure of KS17
89
Figure 4.28 (a) The Isothermal section of the Al-Ca-Zn system at 350oC based on the current experimental work, (b) The isothermal section of the Al-Ca-Zn system based of the thermodynamic database of Wasiur-Rahman [19]
90
Figure 4.29 The pseudobinary Al2Ca-CaZn2 phase diagram constructed using data of Söderberg et al. [95] and experimental data from this work
91
xii
LIST OF TABLES
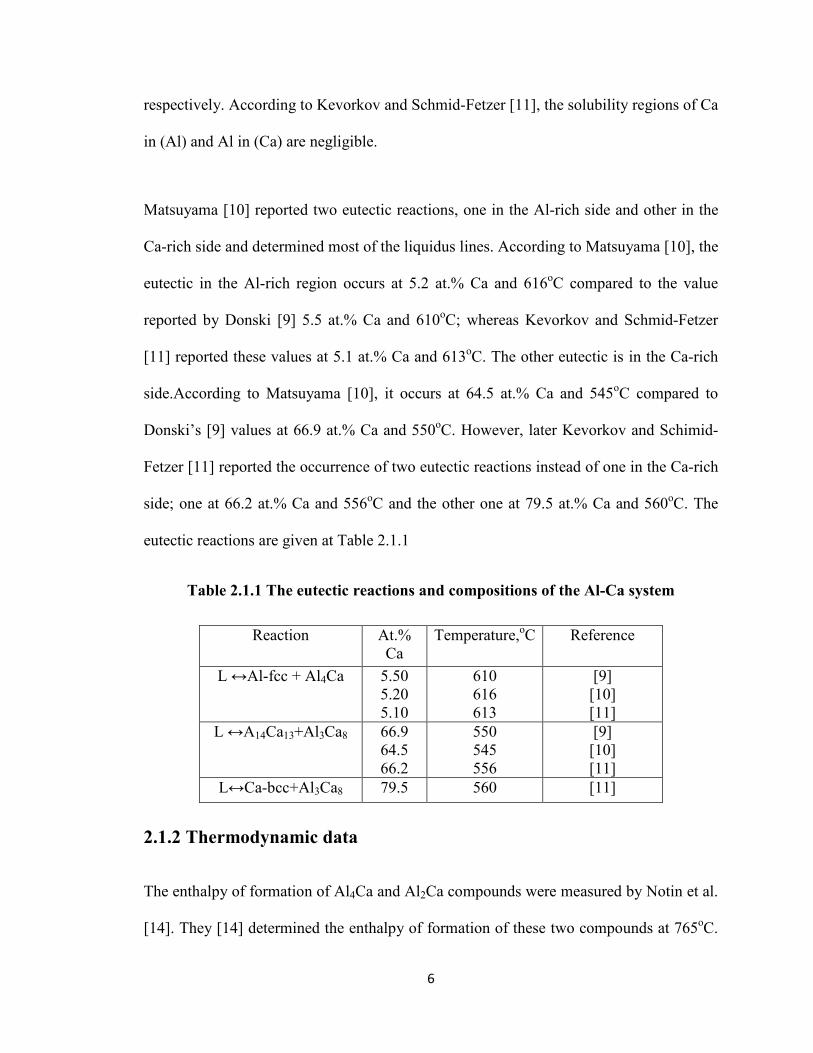
Table 2.1.1 The eutectic reactions and eutectic compositions of the Al-Ca system
6
Table 2.2.1 Eutectic reactions and compositions of the phases of the Ca-Zn system
13
Table 2.2.2 Crystal structure information of the phases of the Ca-Zn system
13
Table 2.3.1 The invariant reactions of the Al-Zn system
20
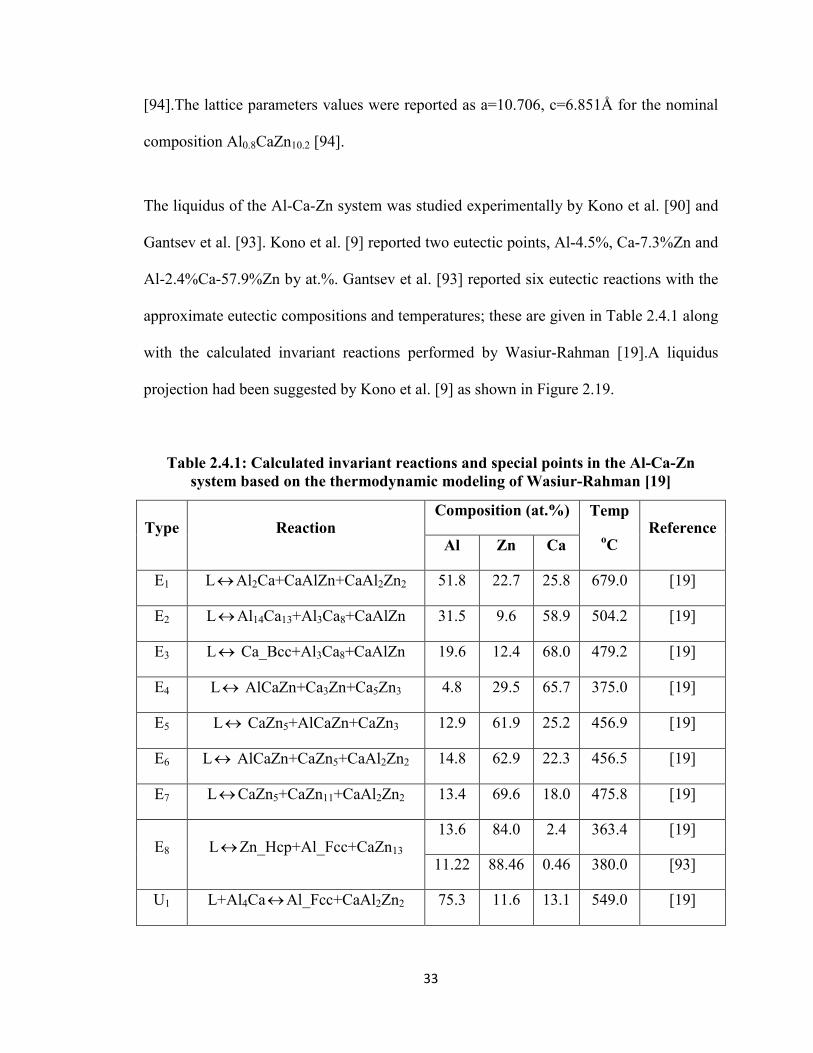
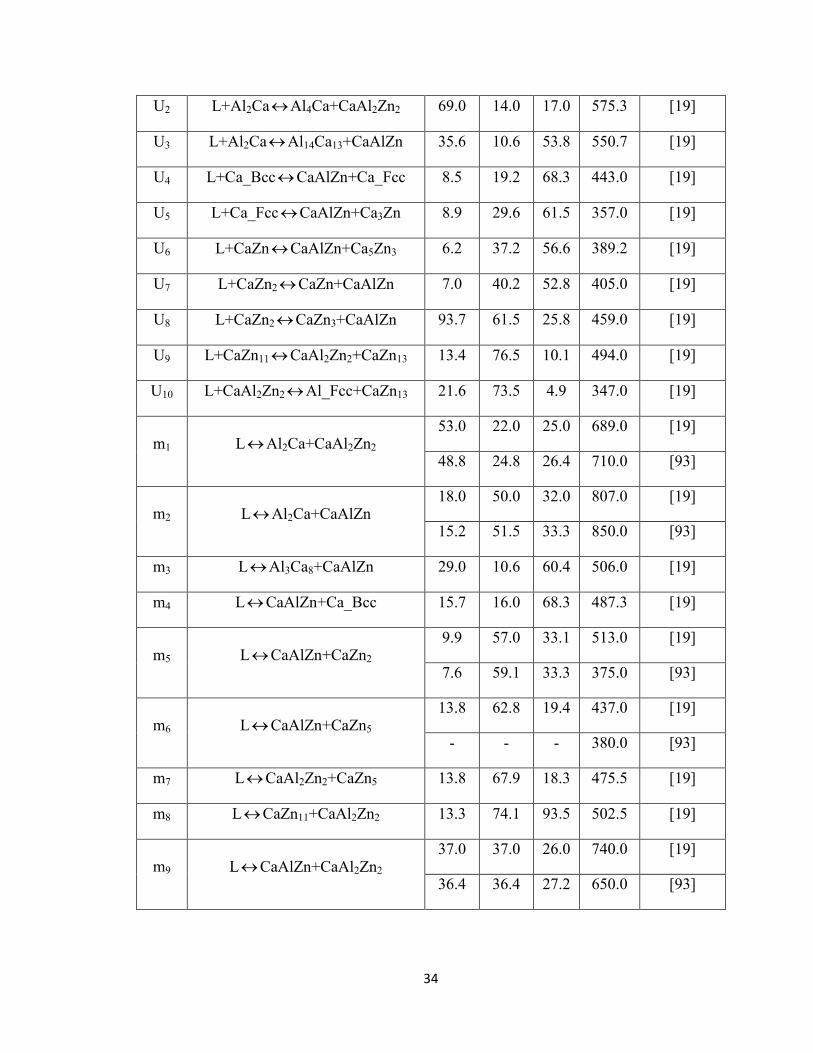
Table 2.4.1 Calculated invariant reactions and special points in the Al-Ca-Zn system based on the thermodynamic modeling of Wasiur-Rahman [19]
33
Table 4.3.1-1 Chemical composition of key alloys from ICP and the equilibrium phases
69
Table 4.3.2-1 Chemical composition of key alloys from ICP and the equilibrium phases
75
Table 4.3.3-1 Chemical composition of key alloys from ICP and the equilibrium phases
82
Table 4.3.3-2 The comparison of the unit cell parameters for the Al14Ca13 binary compound
88
xiii
CHAPTER 1
INTRODUCTION
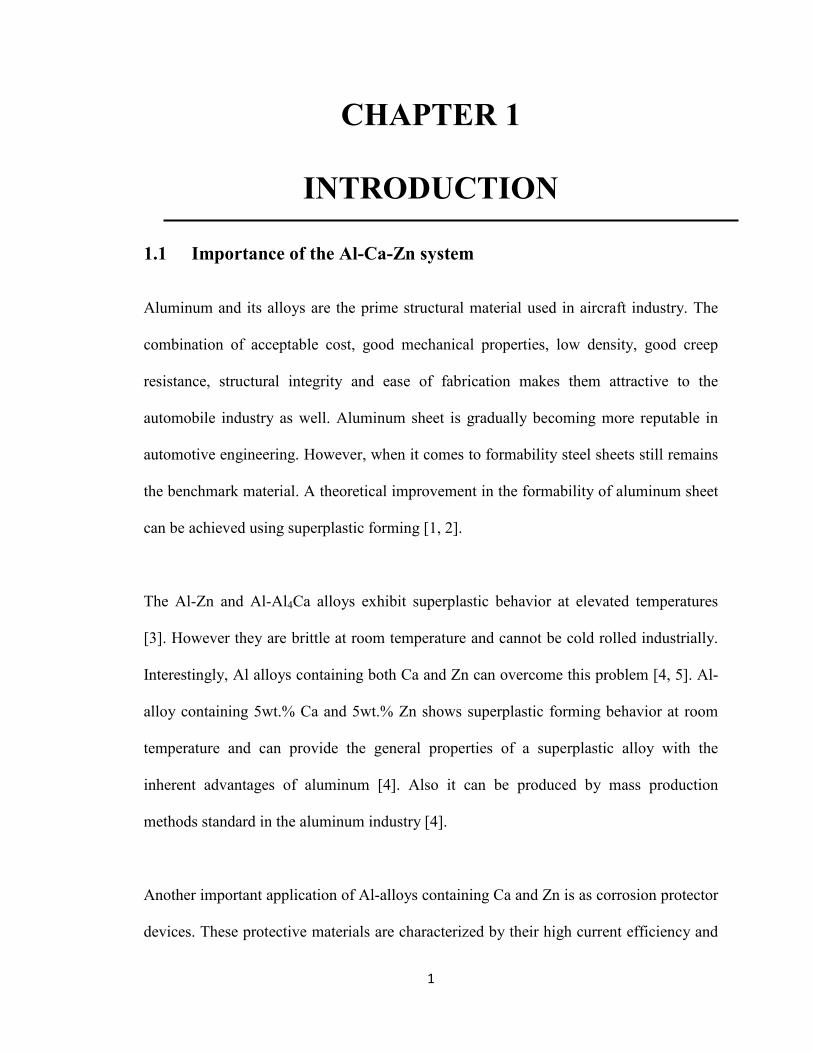
1.1 Importance of the Al-Ca-Zn system
Aluminum and its alloys are the prime structural material used in aircraft industry. The
combination of acceptable cost, good mechanical properties, low density, good creep
resistance, structural integrity and ease of fabrication makes them attractive to the
automobile industry as well. Aluminum sheet is gradually becoming more reputable in
automotive engineering. However, when it comes to formability steel sheets still remains
the benchmark material. A theoretical improvement in the formability of aluminum sheet
can be achieved using superplastic forming [1, 2].
The Al-Zn and Al-Al4Ca alloys exhibit superplastic behavior at elevated temperatures
[3]. However they are brittle at room temperature and cannot be cold rolled industrially.
Interestingly, Al alloys containing both Ca and Zn can overcome this problem [4, 5]. Al-
alloy containing 5wt.% Ca and 5wt.% Zn shows superplastic forming behavior at room
temperature and can provide the general properties of a superplastic alloy with the
inherent advantages of aluminum [4]. Also it can be produced by mass production
methods standard in the aluminum industry [4].
Another important application of Al-alloys containing Ca and Zn is as corrosion protector
devices. These protective materials are characterized by their high current efficiency and
1
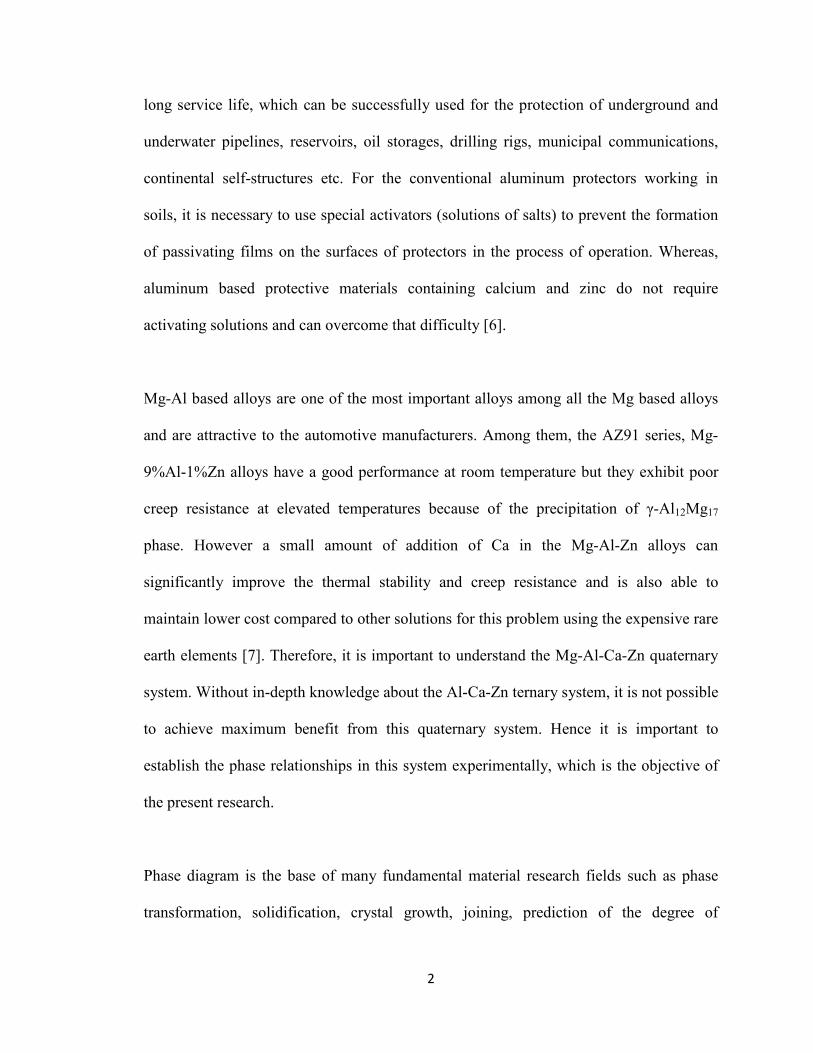
long service life, which can be successfully used for the protection of underground and
underwater pipelines, reservoirs, oil storages, drilling rigs, municipal communications,
continental self-structures etc. For the conventional aluminum protectors working in
soils, it is necessary to use special activators (solutions of salts) to prevent the formation
of passivating films on the surfaces of protectors in the process of operation. Whereas,
aluminum based protective materials containing calcium and zinc do not require
activating solutions and can overcome that difficulty [6].
Mg-Al based alloys are one of the most important alloys among all the Mg based alloys
and are attractive to the automotive manufacturers. Among them, the AZ91 series, Mg-
9%Al-1%Zn alloys have a good performance at room temperature but they exhibit poor
creep resistance at elevated temperatures because of the precipitation of γ-Al12Mg17
phase. However a small amount of addition of Ca in the Mg-Al-Zn alloys can
significantly improve the thermal stability and creep resistance and is also able to
maintain lower cost compared to other solutions for this problem using the expensive rare
earth elements [7]. Therefore, it is important to understand the Mg-Al-Ca-Zn quaternary
system. Without in-depth knowledge about the Al-Ca-Zn ternary system, it is not possible
to achieve maximum benefit from this quaternary system. Hence it is important to
establish the phase relationships in this system experimentally, which is the objective of
the present research.
Phase diagram is the base of many fundamental material research fields such as phase
transformation, solidification, crystal growth, joining, prediction of the degree of
2
microsegregation and inclusion (or second-phase) formation, oxidation, etc. It also acts as
a guideline for material design and processing conditions to obtain the desired
microstructures and mechanical properties [8]. Moreover, to improve the mechanical
properties, several elements are often mixed. These multi-component systems have
complex phase relationships. Therefore, a phase diagram is indispensable for better
understanding of these complex phase relations and predicting the possibility of phase
formation. In this work, the experimental Al-Ca-Zn ternary phase diagram will be
constructed, which will be helpful to predict the phase relationships and the formation of
intermetallics. These details are needed for accurate thermodynamic modeling of the
system.
1.2 Challenges of the Al-Ca-Zn system
The Al-Ca-Zn system is challenging for experimental investigation because of the
following factors:
1. Calcium is highly reactive in air and therefore special procedures and
precautions are required to prepare alloys with relatively high calcium
content.
2. The Al-Ca and Ca-Zn binary systems contain 4 and 8 intermetallics,
respectively. Naturally, this indicates that the Al-Ca-Zn ternary system will
probably contain significant number of binary interactions such as solid
solutions and ternary compounds leading to a comparatively complicated
phase relation among the phases.
3
A number of researchers investigated the system from 0 to 33 at.% Ca [4, 9-16]. However
their work was mostly limited to the understanding of certain properties of some alloys,
such as tensile strength, or to study the crystal structure of certain compounds. To date no
extensive study has been performed to understand the complete system, including phase
relations and solubility limits of the phases in this system. Phase relations and solubility
data are also required for the thermodynamic calculation of the phase diagram. Thus it is
evident that the system needs to be thoroughly investigated to obtain the missing
information. This will be performed during the current work.
1.3 Objectives
The aim of the present work is to provide experimental information about the
thermodynamically stable binary and ternary Al-Ca-Zn phases, their homogeneity ranges,
crystal structures and phase relationships. Hence the present work mainly focuses on:
• Determination of the phase relations and solubility limits of the binary and
ternary compounds by metallographic examination, SEM, EPMA and X-
ray diffraction techniques.
• Analyzing the morphology of diffusion couples in the Al-Ca-Zn system at
350oC
• Studying the crystal structures of the ternary compounds using X-ray
diffraction technique.
• Construction of the Al-Ca-Zn isothermal section at 350ºCexperimentally.
4
CHAPTER 2
LITERATURE REVIEW
2.1The Al-Ca binary system 2.1.1 Phase diagram data
Most of the experimental investigations of the Al-Ca system deal mainly with the Al-rich
side, which is technically interesting for the aluminum alloys. Donski [9] carried out the
first attempt to construct the Al-Ca system using thermal analysis. Later, Matsuyama [10]
investigated the system by thermal analysis, electrical resistance and microscopic
examination. The entire Al-Ca system was investigated by Kevorkov and Schmid-Fetzer
[11] who used X-ray diffraction, SEM/EDX analysis, metallographic and diffusion
couple techniques. They [11] reported four intermetallic compounds; Al4Ca, Al2Ca, AlCa
and Al3Ca8. According to by Matsuyama [10] and Kevorkov and Schmid-Fetzer [11],
Al4Ca decomposes at 700oC whereas Donski [9] reported the value as 690oC. Kevorkov
and Schmid-Fetzer [11] reported that Al2Ca melts congruently at 1086oC compared to
Matsuyama’s [10] value of 1079oC, AlCa melts incongruently at 633oC [11] and Al3Ca8
melts congruently at 579oC [11]. However, Huang and Corbett [12] reported the
occurrence of Al14Ca13 compound with monoclinic structure instead of AlCa. Nowotny
et al. [13] determined the crystal structure of Al4Ca and Al2Ca as bct and fcc,
respectively. Huang and Corbett [12] investigated the crystal structures of Al14Ca13 and
Al3Ca8 using X-ray analysis and noted that they have monoclinic and triclinic structures,
5
respectively. According to Kevorkov and Schmid-Fetzer [11], the solubility regions of Ca
in (Al) and Al in (Ca) are negligible.
Matsuyama [10] reported two eutectic reactions, one in the Al-rich side and other in the
Ca-rich side and determined most of the liquidus lines. According to Matsuyama [10], the
eutectic in the Al-rich region occurs at 5.2 at.% Ca and 616oC compared to the value
reported by Donski [9] 5.5 at.% Ca and 610oC; whereas Kevorkov and Schmid-Fetzer
[11] reported these values at 5.1 at.% Ca and 613oC. The other eutectic is in the Ca-rich
side.According to Matsuyama [10], it occurs at 64.5 at.% Ca and 545oC compared to
Donski’s [9] values at 66.9 at.% Ca and 550oC. However, later Kevorkov and Schimid-
Fetzer [11] reported the occurrence of two eutectic reactions instead of one in the Ca-rich
side; one at 66.2 at.% Ca and 556oC and the other one at 79.5 at.% Ca and 560oC. The
eutectic reactions are given at Table 2.1.1
Table 2.1.1 The eutectic reactions and compositions of the Al-Ca system
2.1.2 Thermodynamic data
The enthalpy of formation of Al4Ca and Al2Ca compounds were measured by Notin et al.
[14]. They [14] determined the enthalpy of formation of these two compounds at 765oC.
Reaction At.% Ca
Temperature,oC Reference
L ↔Al-fcc + Al4Ca 5.50 5.20 5.10
610 616 613
[9] [10] [11]
L ↔A14Ca13+Al3Ca8 66.9 64.5 66.2
550 545 556
[9] [10] [11]
L↔Ca-bcc+Al3Ca8 79.5 560 [11]
6
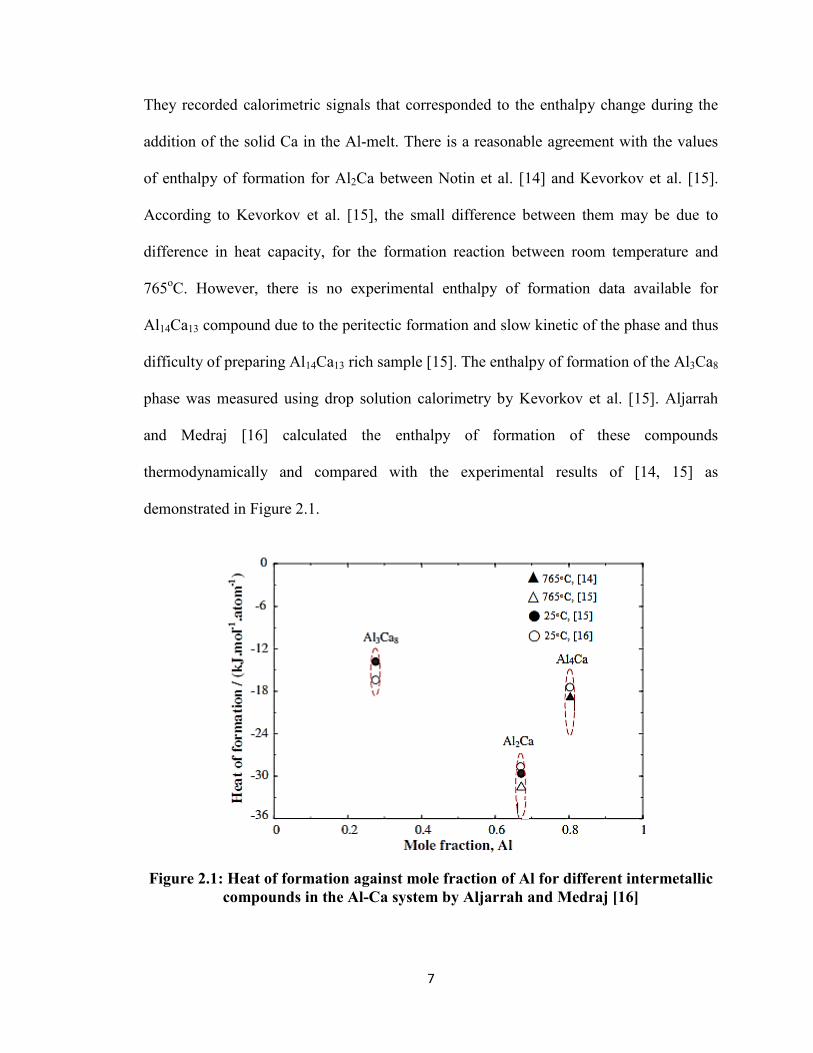
They recorded calorimetric signals that corresponded to the enthalpy change during the
addition of the solid Ca in the Al-melt. There is a reasonable agreement with the values
of enthalpy of formation for Al2Ca between Notin et al. [14] and Kevorkov et al. [15].
According to Kevorkov et al. [15], the small difference between them may be due to
difference in heat capacity, for the formation reaction between room temperature and
765oC. However, there is no experimental enthalpy of formation data available for
Al14Ca13 compound due to the peritectic formation and slow kinetic of the phase and thus
difficulty of preparing Al14Ca13 rich sample [15]. The enthalpy of formation of the Al3Ca8
phase was measured using drop solution calorimetry by Kevorkov et al. [15]. Aljarrah
and Medraj [16] calculated the enthalpy of formation of these compounds
thermodynamically and compared with the experimental results of [14, 15] as
demonstrated in Figure 2.1.
Figure 2.1: Heat of formation against mole fraction of Al for different intermetallic compounds in the Al-Ca system by Aljarrah and Medraj [16]
7
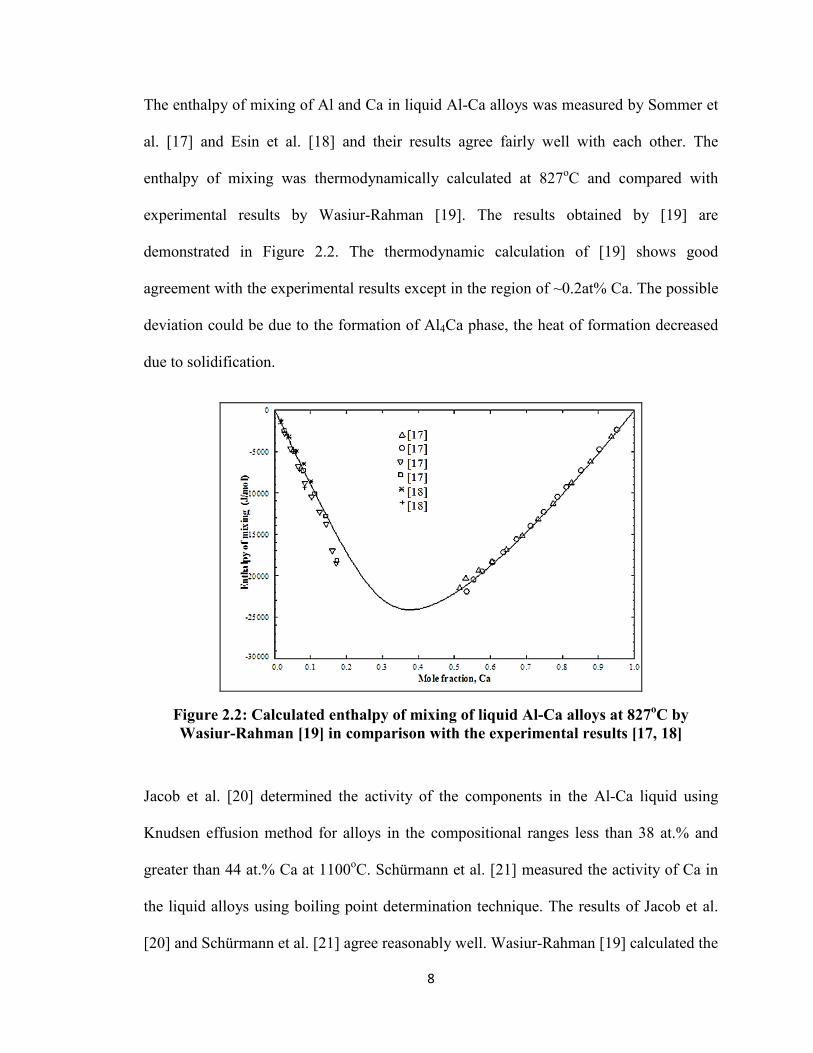
The enthalpy of mixing of Al and Ca in liquid Al-Ca alloys was measured by Sommer et
al. [17] and Esin et al. [18] and their results agree fairly well with each other. The
enthalpy of mixing was thermodynamically calculated at 827oC and compared with
experimental results by Wasiur-Rahman [19]. The results obtained by [19] are
demonstrated in Figure 2.2. The thermodynamic calculation of [19] shows good
agreement with the experimental results except in the region of ~0.2at% Ca. The possible
deviation could be due to the formation of Al4Ca phase, the heat of formation decreased
due to solidification.
Figure 2.2: Calculated enthalpy of mixing of liquid Al-Ca alloys at 827oC by Wasiur-Rahman [19] in comparison with the experimental results [17, 18]
Jacob et al. [20] determined the activity of the components in the Al-Ca liquid using
Knudsen effusion method for alloys in the compositional ranges less than 38 at.% and
greater than 44 at.% Ca at 1100oC. Schürmann et al. [21] measured the activity of Ca in
the liquid alloys using boiling point determination technique. The results of Jacob et al.
[20] and Schürmann et al. [21] agree reasonably well. Wasiur-Rahman [19] calculated the
8
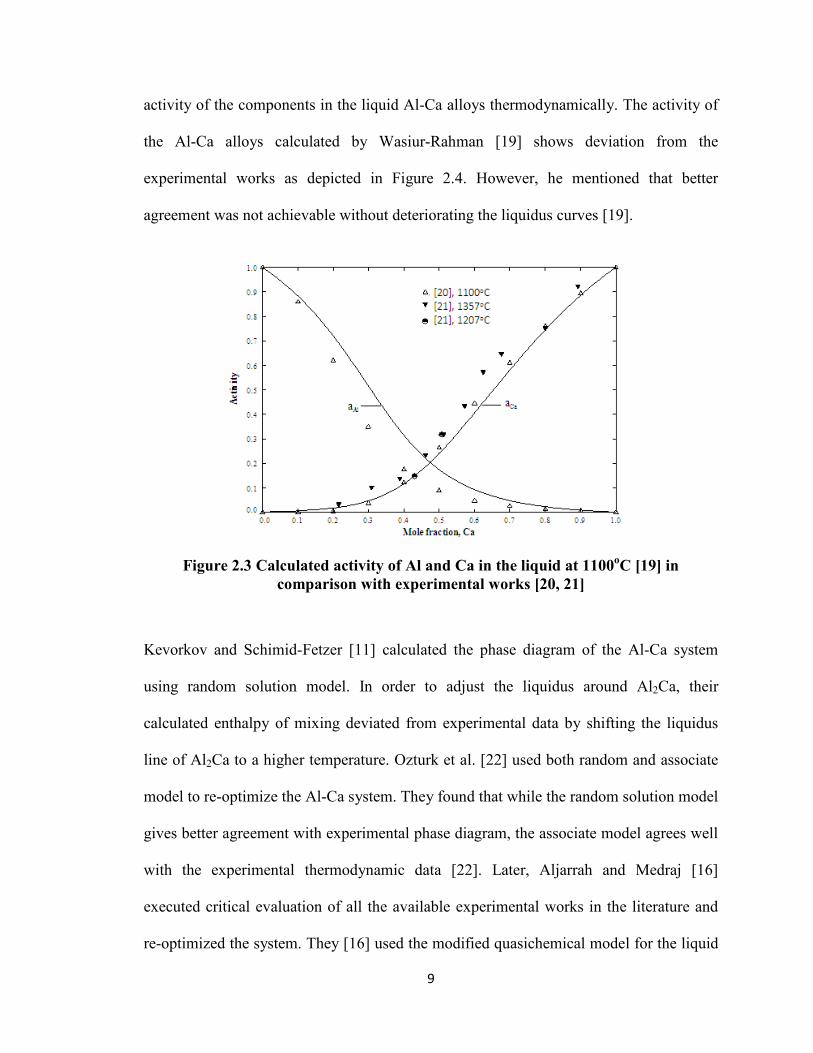
activity of the components in the liquid Al-Ca alloys thermodynamically. The activity of
the Al-Ca alloys calculated by Wasiur-Rahman [19] shows deviation from the
experimental works as depicted in Figure 2.4. However, he mentioned that better
agreement was not achievable without deteriorating the liquidus curves [19].
Figure 2.3 Calculated activity of Al and Ca in the liquid at 1100oC [19] in comparison with experimental works [20, 21]
Kevorkov and Schimid-Fetzer [11] calculated the phase diagram of the Al-Ca system
using random solution model. In order to adjust the liquidus around Al2Ca, their
calculated enthalpy of mixing deviated from experimental data by shifting the liquidus
line of Al2Ca to a higher temperature. Ozturk et al. [22] used both random and associate
model to re-optimize the Al-Ca system. They found that while the random solution model
gives better agreement with experimental phase diagram, the associate model agrees well
with the experimental thermodynamic data [22]. Later, Aljarrah and Medraj [16]
executed critical evaluation of all the available experimental works in the literature and
re-optimized the system. They [16] used the modified quasichemical model for the liquid
9
phase in order to account for the presence of short range ordering. Nevertheless, there
was a little deviation of some of their [16] calculated invariant points with experimental
results. This was improved by Wasiur-Rahman and Medraj [23] who also used the
modified quasichemical model for the liquid phase. In their work [23], they made some
adjustments in the values of the composition dependent coordination numbers and the
excess Gibbs energy parameters to increase the consistency with the experimental results.
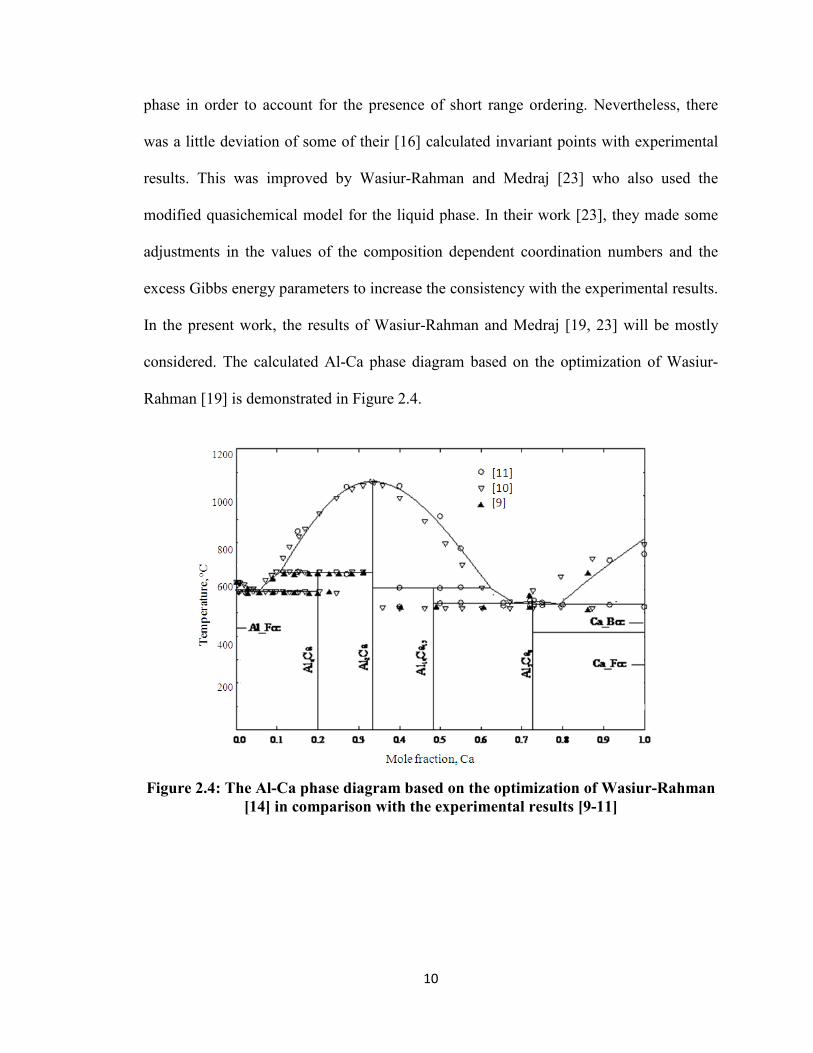
In the present work, the results of Wasiur-Rahman and Medraj [19, 23] will be mostly
considered. The calculated Al-Ca phase diagram based on the optimization of Wasiur-
Rahman [19] is demonstrated in Figure 2.4.
Figure 2.4: The Al-Ca phase diagram based on the optimization of Wasiur-Rahman [14] in comparison with the experimental results [9-11]
10
2.2 The Ca-Zn binary system 2.2.1 Phase diagram data
Donski [9] studied the Ca-Zn system using thermal analysis. But the alloys were prepared
in open glass tubes using materials which were impure by modern standards [19]. Paris
[24] investigated the system by thermal and micrographic analysis. Later, the Ca-Zn
system was investigated by Messing et al. [25] using differential thermal analysis
supplemented by X-ray diffusion and vapor effusion measurement. They reported eight
compounds in the system: Ca3Zn, Ca7Zn4, CaZn, CaZn2, Ca7Zn20, CaZn5, CaZn11 and
CaZn13. According to their thermal analysis, the compounds CaZn2, CaZn5 and CaZn11
melt congruently at 704oC, 695oC and 724oC, respectively. The other compounds Ca3Zn,
Ca7Zn4, CaZn, Ca7Zn20 and CaZn13 undergo peritectic decomposition at 394oC, 414oC,
439oC, 642oC and 669oC, respectively. Itkin and Alcock [26] revised the phase diagram,
replacing Ca7Zn4 and Ca7Zn20 listed by Messing et al. [25], with Ca5Zn3 and CaZn3,
respectively, based on the crystallographic data in the literature [27, 28]. Messing et al.
[25] reported 3 eutectic reactions occurring at 27.4 at.% Zn and 394oC, at 76.4 at.% Zn
and 638oC and at 86.4 at.% Zn and 690oC. The eutectic reactions and phase compositions
are given in Table 2.2.1.
The crystal structure data and lattice parameters of the phases in the Ca-Zn system (Table
2.2.2) were determined in a number of studies using X-ray analysis [27-36]. Ketelaar [29]
discovered the crystal structure of CaZn13 with fcc structure and lattice parameter
a=12.13Å. This result was confirmed in the work of Iandelli and Palenzona [30] who
reported the value of lattice parameter, a=12.185Å. Iandelli and Palenzona [30] also
11
determined the crystal structure of CaZn11 as BaCd11 prototype with a=10.699Å. Haucke
[31] determined that the compound CaZn5 has a hexagonal lattice, with parameters a=
5.405 and c= 4.183Å. Messing et al. [25] assumed that CaZn5 has a narrow homogeneity
range, but they did not define it accurately. Recently, Wendroff and Röhr [32] reported
that the binary compound CaZn5 has a continuous variation in the range 14.3-16.7 at.%
Ca, corresponding to the change of the stoichiometry from 1:5 to 1:6 with a continuous
structural change from CaCu5 to TbCu7. The orthorhombic structure of CaZn2 was
reported by Schulze and Wieting [33] with the lattice parameters a=4.591, b=7.337 and
c=7.667Å. The formula of the compounds Ca7Zn4 and Ca7Zn20 reported by Messing et al.
[25] were revised [27, 28]. Bruzzone et al. [27] prepared an alloy of the composition
Ca5Zn3 by melting 99.99 wt.% Ca and 99.99 wt.% Zn in sealed iron crucibles, followed
by slow cooling and annealing. The result showed a single homogeneous phase with a
tetragonal structure of the Cr5B3 type and parameters a=7.954 and c=15.443Å. The
formula Ca5Zn3 was recommended instead of Ca7Zn4 [27]. Fornasini and Merlo [28]
prepared the compound CaZn3 by melting 99.9 wt.% Ca and 99.999 wt.% Zn in sealed
tantalum crucibles, with subsequent annealing at 550oC and found that CaZn3 compound
had a hexagonal structure and it exhibited a small homogeneity range from 74 to 75 at.%
Zn at 550oC with lattice parameters varying from a=9.157 and c=7.297Åto a=9.168 and
c=7.327 Ǻ. Fornasini and Merlo [28] analyzed the crystal structure of CaZn3 using single
crystal x-ray diffractometer and described the structure of CaZn3 as a random mixture of
two types of elementary cells with the same symmetry and dimensions, but in different
composition and atomic arrangement; two thirds of total number of cells is nearly
identical to BaLi4, whereas the rest have an arrangement similar to CeCu2. The structures
12
of the compounds CaZn and Ca3Zn were identified by Fornasini et al. [34]. Both
compounds have the orthorhombic structure. The lattice parameters for CaZn is, a=4.202,
b=11.61 and c=4.442Å and for Ca3Zn, a=4.15, b=13.258 and c=11.086Å.
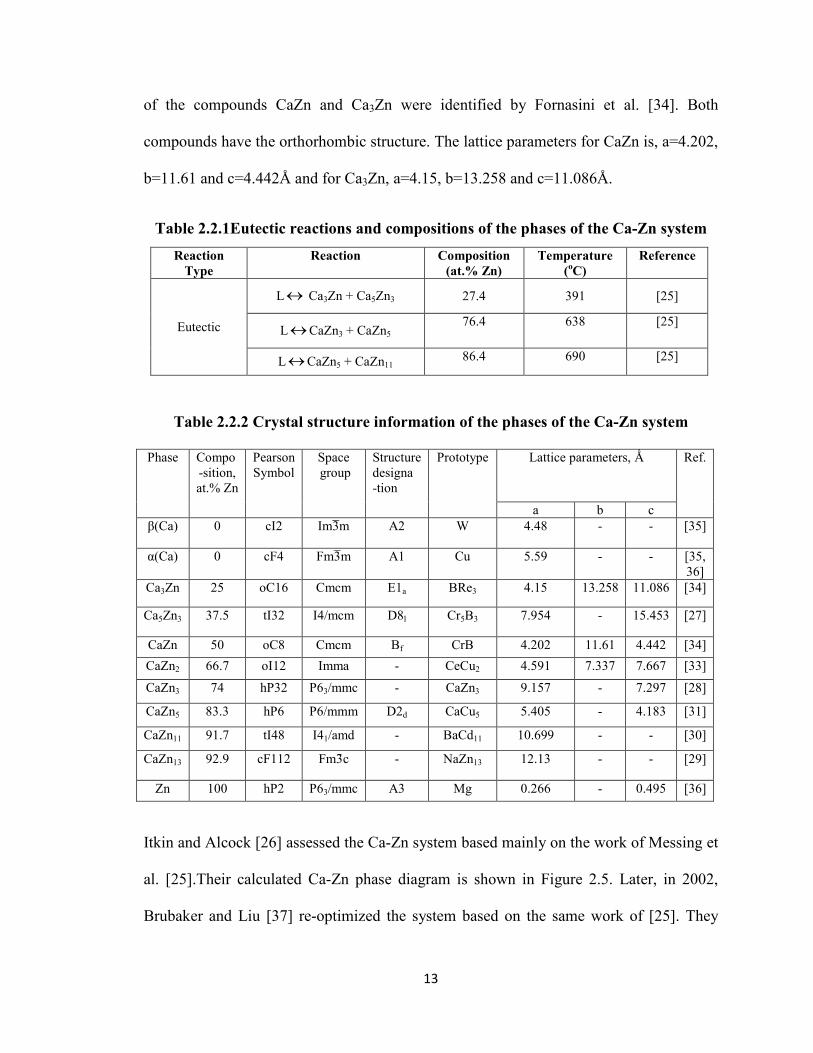
Table 2.2.1Eutectic reactions and compositions of the phases of the Ca-Zn system
Table 2.2.2 Crystal structure information of the phases of the Ca-Zn system
Phase Compo -sition, at.% Zn
Pearson Symbol
Space group
Structure designa -tion
Prototype Lattice parameters, Ǻ Ref.
a b c β(Ca) 0 cI2 Im3̅m A2 W 4.48 - - [35]
α(Ca) 0 cF4 Fm3̅m A1 Cu 5.59 - - [35, 36]
Ca3Zn 25 oC16 Cmcm E1a BRe3 4.15 13.258 11.086 [34]
Ca5Zn3 37.5 tI32 I4/mcm D8l Cr5B3 7.954 - 15.453 [27]
CaZn 50 oC8 Cmcm Bf CrB 4.202 11.61 4.442 [34] CaZn2 66.7 oI12 Imma - CeCu2 4.591 7.337 7.667 [33]
CaZn3 74 hP32 P63/mmc - CaZn3 9.157 - 7.297 [28]
CaZn5 83.3 hP6 P6/mmm D2d CaCu5 5.405 - 4.183 [31]
CaZn11 91.7 tI48 I41/amd - BaCd11 10.699 - - [30]
CaZn13 92.9 cF112 Fm3̄c - NaZn13 12.13 - - [29]
Zn 100 hP2 P63/mmc A3 Mg 0.266 - 0.495 [36]
Itkin and Alcock [26] assessed the Ca-Zn system based mainly on the work of Messing et
al. [25].Their calculated Ca-Zn phase diagram is shown in Figure 2.5. Later, in 2002,
Brubaker and Liu [37] re-optimized the system based on the same work of [25]. They
Reaction Type
Reaction Composition (at.% Zn)
Temperature (oC)
Reference
Eutectic
L↔ Ca3Zn + Ca5Zn3 27.4 391 [25]
L↔CaZn3 + CaZn5 76.4 638 [25]
L↔CaZn5 + CaZn11 86.4 690 [25]
13
assumed the liquid phase as substitutional solution phase and modeled it using sublattice
model with all the intermetallic compounds. However, they proposed a new interpretation
by reporting the CaZn3 to undergo congruent melting which was reported to be
incongruent melting by previous investigators. Moreover, if CaZn3 is a congruently
melting compound then the liquidus of the CaZn3 on the Ca-rich side becomes too flat.
According to Okamoto and Massaiski [38], this is thermodynamically improbable.
Hence, the phase diagram calculated by Brubaker and Liu [37] will not be considered in
this work. The Ca-Zn phase diagram was most recently calculated almost simultaneously
by two different research groups [39, 40]. Both Spencer et. al. [39] and Wasiur-Rahman
and Medraj [40] used the modified quasichemical model considering the short-range
ordering in the liquid phase and their results agreed fairly well with each other. Both
research groups considered the incongruent melting of the CaZn3 phase. The calculated
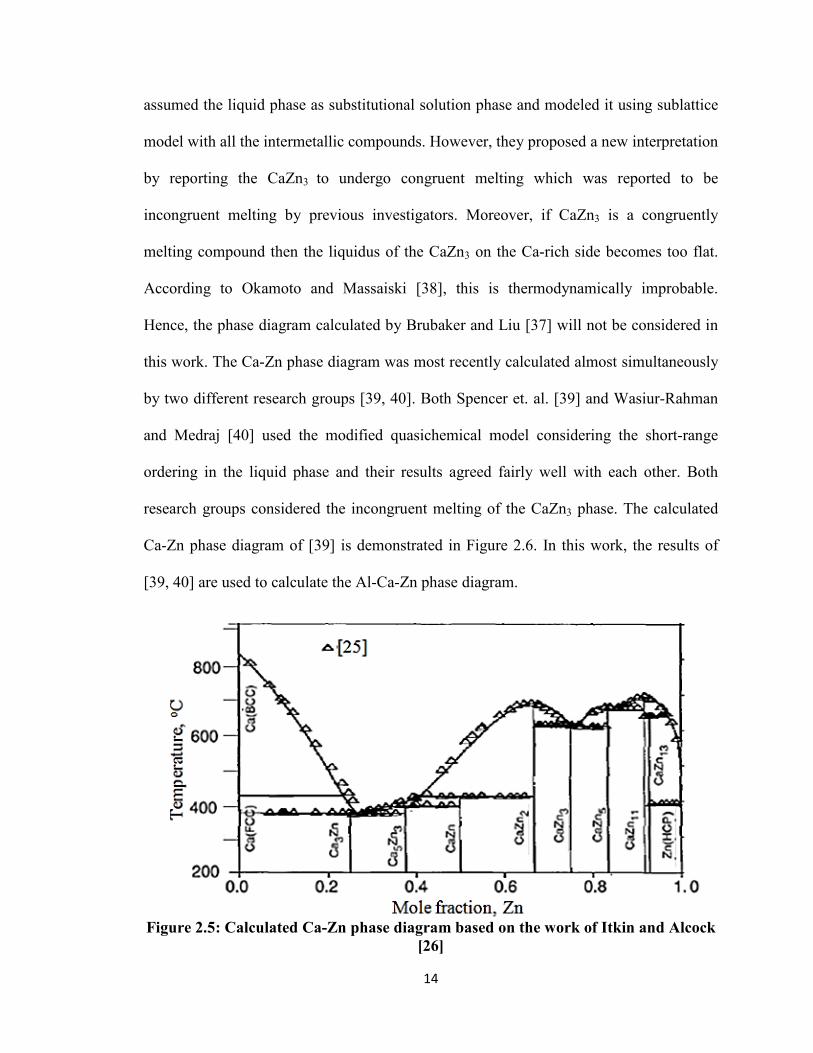
Ca-Zn phase diagram of [39] is demonstrated in Figure 2.6. In this work, the results of
[39, 40] are used to calculate the Al-Ca-Zn phase diagram.
Figure 2.5: Calculated Ca-Zn phase diagram based on the work of Itkin and Alcock
[26]
14
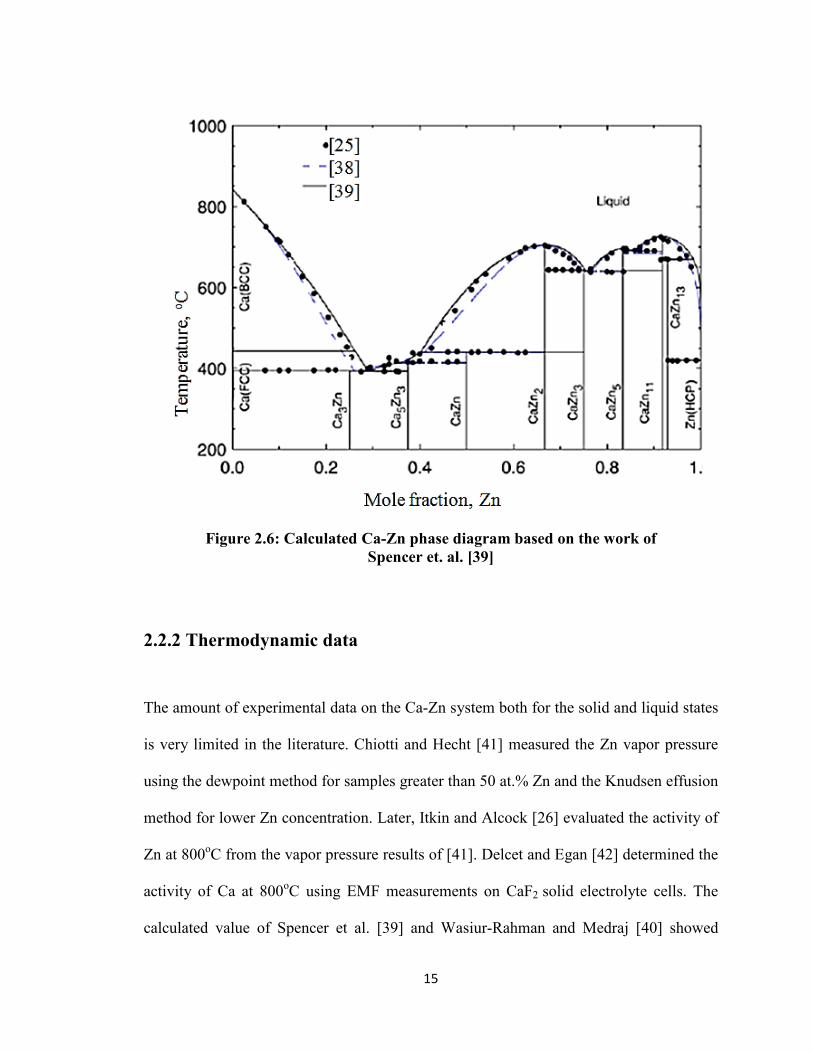
Figure 2.6: Calculated Ca-Zn phase diagram based on the work of Spencer et. al. [39]
2.2.2 Thermodynamic data
The amount of experimental data on the Ca-Zn system both for the solid and liquid states
is very limited in the literature. Chiotti and Hecht [41] measured the Zn vapor pressure
using the dewpoint method for samples greater than 50 at.% Zn and the Knudsen effusion
method for lower Zn concentration. Later, Itkin and Alcock [26] evaluated the activity of
Zn at 800oC from the vapor pressure results of [41]. Delcet and Egan [42] determined the
activity of Ca at 800oC using EMF measurements on CaF2 solid electrolyte cells. The
calculated value of Spencer et al. [39] and Wasiur-Rahman and Medraj [40] showed
15
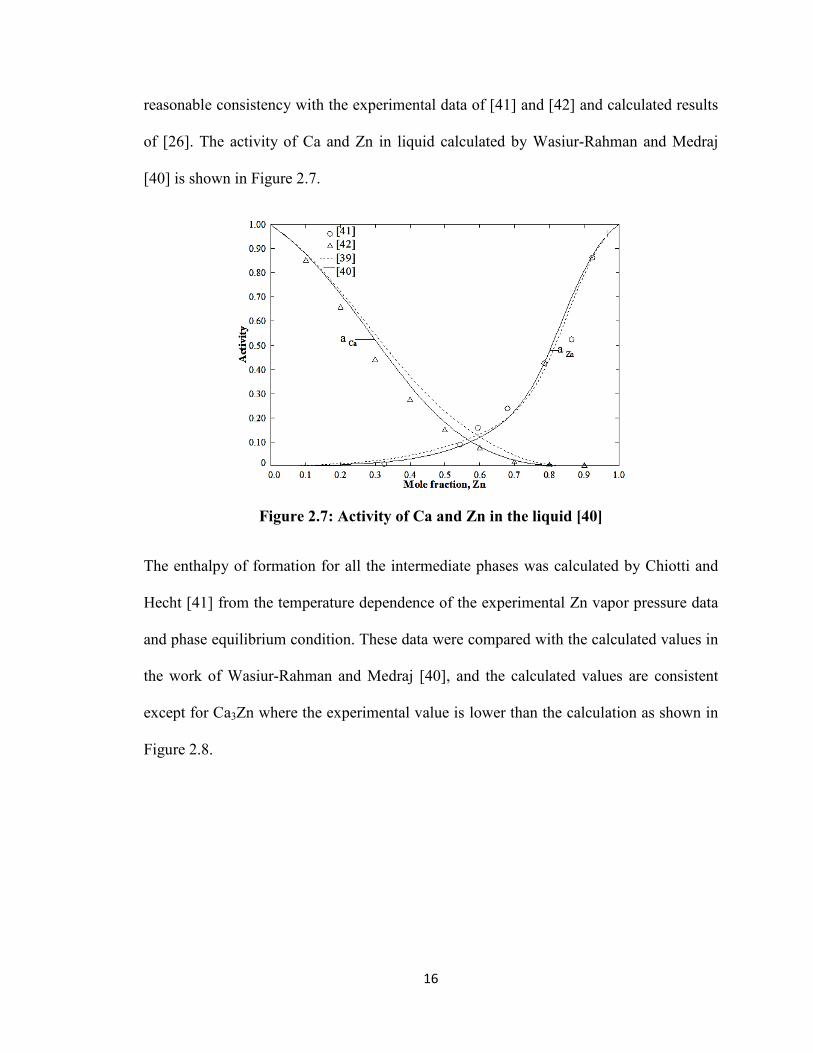
reasonable consistency with the experimental data of [41] and [42] and calculated results
of [26]. The activity of Ca and Zn in liquid calculated by Wasiur-Rahman and Medraj
[40] is shown in Figure 2.7.
Figure 2.7: Activity of Ca and Zn in the liquid [40]
The enthalpy of formation for all the intermediate phases was calculated by Chiotti and
Hecht [41] from the temperature dependence of the experimental Zn vapor pressure data
and phase equilibrium condition. These data were compared with the calculated values in
the work of Wasiur-Rahman and Medraj [40], and the calculated values are consistent
except for Ca3Zn where the experimental value is lower than the calculation as shown in
Figure 2.8.
16
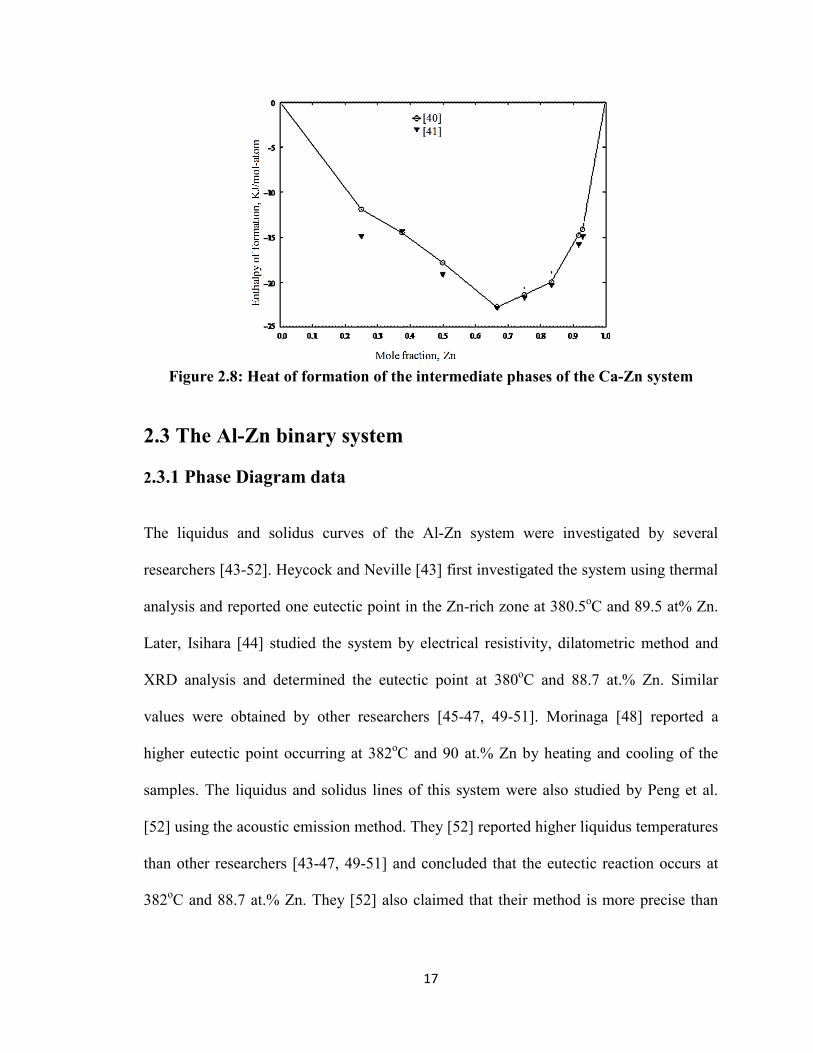
Figure 2.8: Heat of formation of the intermediate phases of the Ca-Zn system
2.3 The Al-Zn binary system 2.3.1 Phase Diagram data The liquidus and solidus curves of the Al-Zn system were investigated by several
researchers [43-52]. Heycock and Neville [43] first investigated the system using thermal
analysis and reported one eutectic point in the Zn-rich zone at 380.5oC and 89.5 at% Zn.
Later, Isihara [44] studied the system by electrical resistivity, dilatometric method and
XRD analysis and determined the eutectic point at 380oC and 88.7 at.% Zn. Similar
values were obtained by other researchers [45-47, 49-51]. Morinaga [48] reported a
higher eutectic point occurring at 382oC and 90 at.% Zn by heating and cooling of the
samples. The liquidus and solidus lines of this system were also studied by Peng et al.
[52] using the acoustic emission method. They [52] reported higher liquidus temperatures
than other researchers [43-47, 49-51] and concluded that the eutectic reaction occurs at
382oC and 88.7 at.% Zn. They [52] also claimed that their method is more precise than
17
the conventional thermal analysis because of the absence of the heat hysteresis
phenomenon.
The Al-solidus curve was investigated by several researchers [44, 45, 48, 53-56]. Among
them Morinaga [48] and Gebhardt [53] used microscopic analysis, Ellwood [54] used
high temperature X-ray diffraction and Araki et. al.[55] used electron-probe
microanalysis in order to determine the solidus line. Early works [44, 45] showed lower
values for solidus temperatures. Isihara [44] and Tanabe [45] found a series of thermal
arrests between 440oC and 447oC, which they described as a peritectic reaction, L + (Al)
↔ solid solution (β). Later, Gayleret al.[46] and Morinaga [48] demonstrated that the
thermal effect is the result of segregation. They [46, 48] found no evidence of any kind of
phase change and this was supported by later investigators [54, 56].
The fcc miscibility gap has been studied by various groups of investigators [54, 56-61].
Fink and Willey [56] found two aluminum solid solutions in equilibrium at a temperature
above 275oC by electrical resistivity method. They [56] reported that the critical
temperature occurs at 353oC and 38.5 at.% Zn. Borelius and Larsson [58] reported the
eutectoid decomposition at 277oC with an uncertainty of about ± 0.5oC using electrical
resistivity method. Using the same method, Münster and Sagel [59] found that the critical
temperature is at 341.5± 0.4oC and its composition is 39.5± 0.002 at.% Zn. Terauchi et
al. [60] reported the critical temperature to be 351oC at 39.16 at.% Zn and eutectoid
temperature as 275oC using cooling curve technique which are similar to the values
reported by [56].
18
The solubility of Zn in Al was determined by Tanabe [45], Ellwood [54], Araki et al.
[55], Fink and Willey [56] and Borelius and Larsson [58]; the results are in good
agreement with each other except in the composition range 10 to 16.5 at.% Zn. The data
of [45, 55, 56] for the phase boundary Al-fcc2/ (Al-fcc + Zn-hcp) are consistent in the
range 59 to 67 at.% Zn whereas the data of Larsson [62] show more scatter than those of
[49, 60, 61].
The experimental works of most of the researchers regarding the solubility of Al in Zn
are in good agreement with each other. At first, Peirce and Palmerton [63] measured the
solubility of Al in Zn using electrical resistivity supplemented by microscopic analysis.
Then Auer and Mann [64] used magnetic susceptibility to measure the same
phenomenon. Lattice parameters were measured by Fuller and Wilcox [65], Burkhardt
[66], Lohberg [67] and Hofmann and Fahrenhost [68], to detect the Zn solvus line.
However, the data of Fuller and Wilcox [65] are not accurate due to impurity in the
samples and inaccuracy in the experiment. Afterward, Pasternak [69] also measured the
lattice parameters using electrical resistivity and they confirmed the earlier works of [63,
64, 66-68]. The invariant points reported by [45-69] are listed in Table 2.3.1.
19
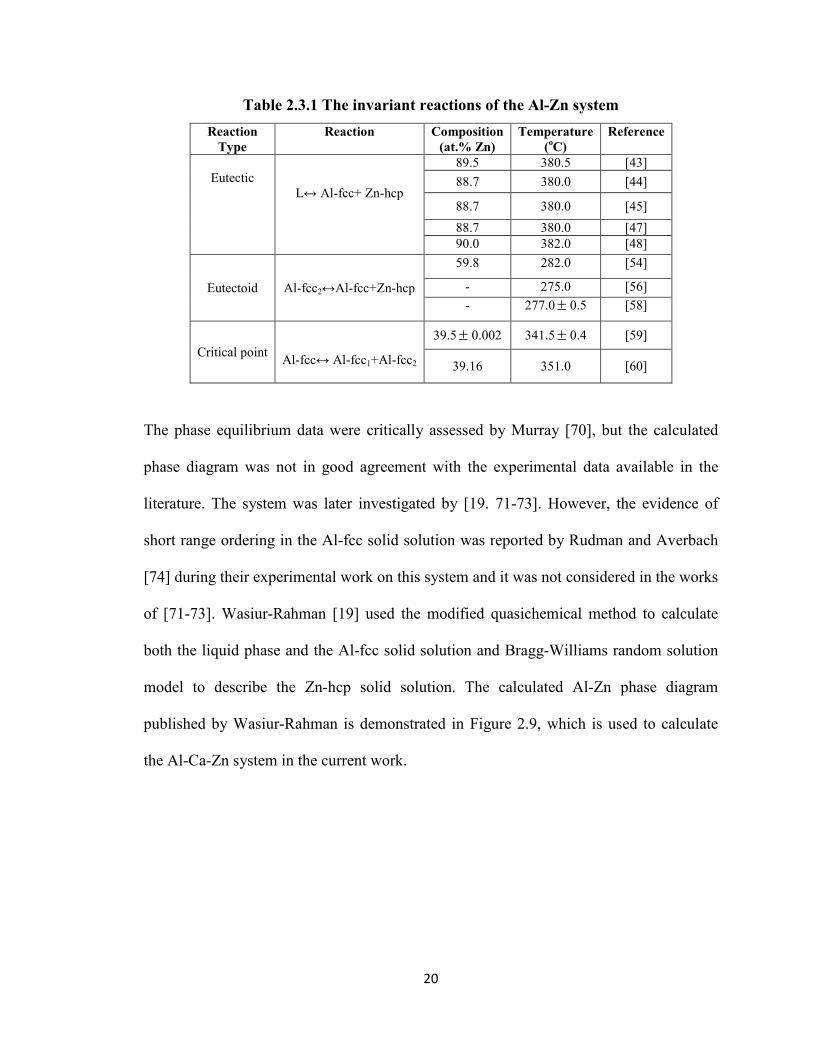
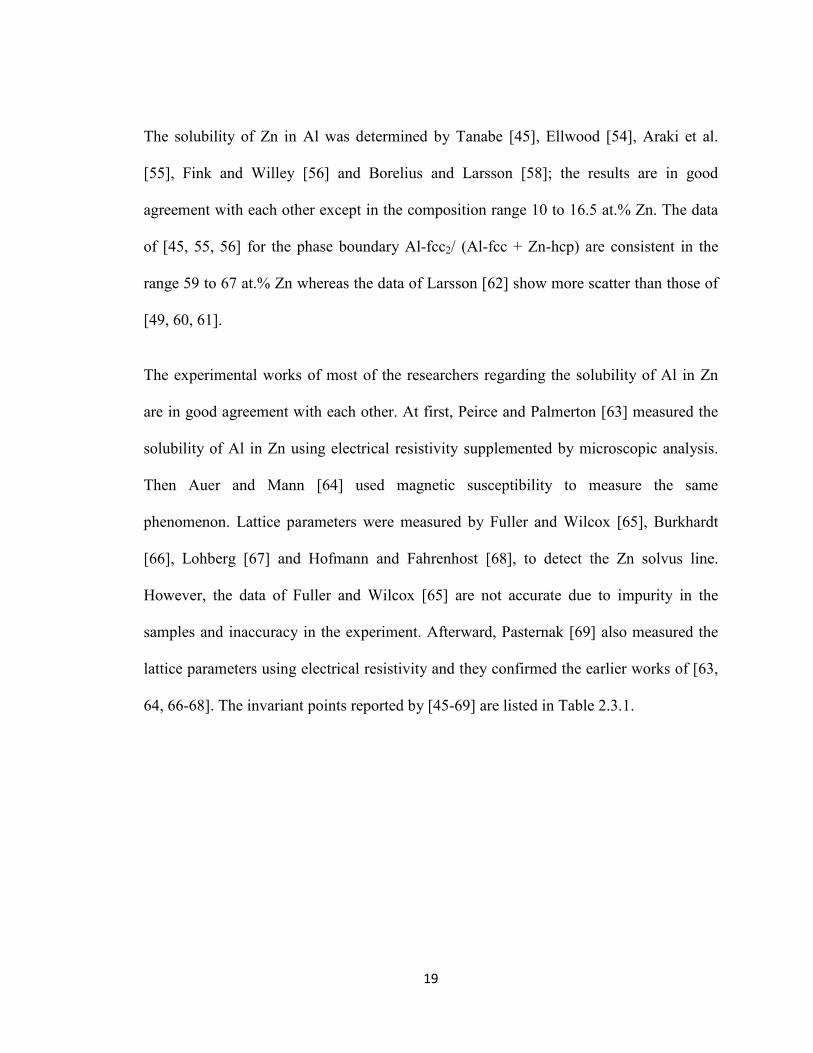
Table 2.3.1 The invariant reactions of the Al-Zn system
The phase equilibrium data were critically assessed by Murray [70], but the calculated
phase diagram was not in good agreement with the experimental data available in the
literature. The system was later investigated by [19. 71-73]. However, the evidence of
short range ordering in the Al-fcc solid solution was reported by Rudman and Averbach
[74] during their experimental work on this system and it was not considered in the works
of [71-73]. Wasiur-Rahman [19] used the modified quasichemical method to calculate
both the liquid phase and the Al-fcc solid solution and Bragg-Williams random solution
model to describe the Zn-hcp solid solution. The calculated Al-Zn phase diagram
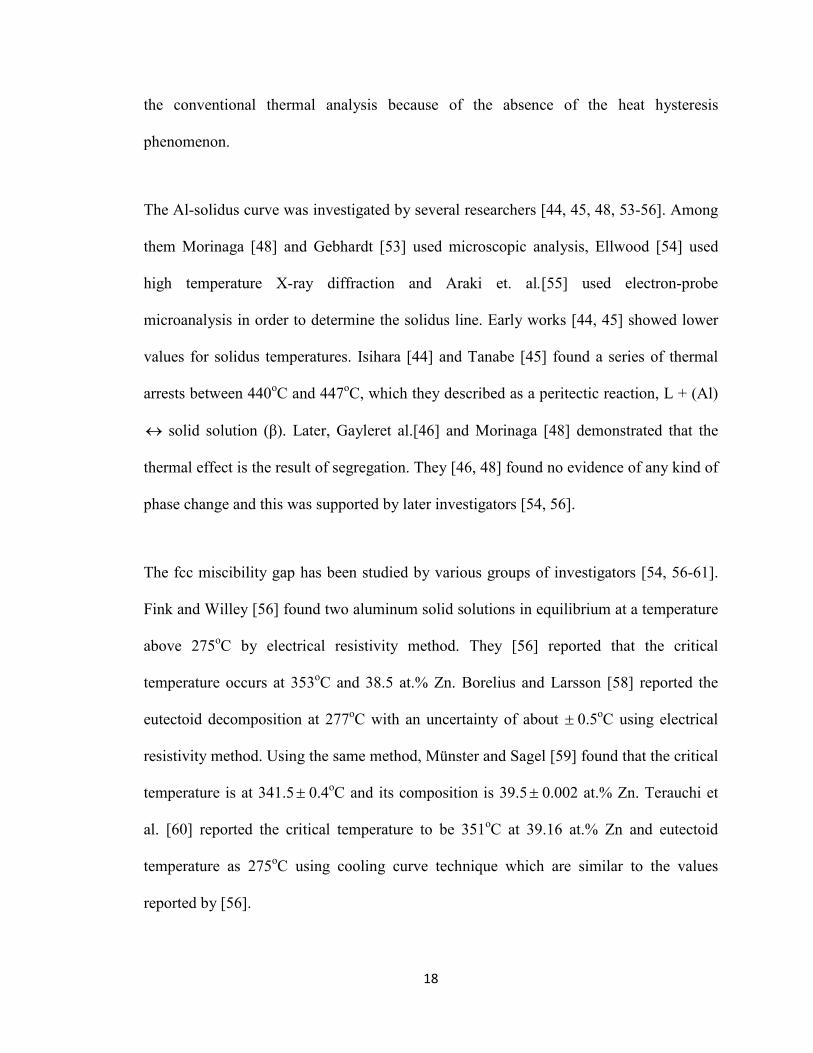
published by Wasiur-Rahman is demonstrated in Figure 2.9, which is used to calculate
the Al-Ca-Zn system in the current work.
Reaction Type
Reaction Composition (at.% Zn)
Temperature (oC)
Reference
Eutectic
L↔ Al-fcc+ Zn-hcp
89.5 380.5 [43] 88.7 380.0 [44]
88.7 380.0 [45] 88.7 380.0 [47] 90.0 382.0 [48]
Eutectoid Al-fcc2↔Al-fcc+Zn-hcp
59.8 282.0 [54]
- 275.0 [56] - 277.0± 0.5 [58]
Critical point
Al-fcc↔ Al-fcc1+Al-fcc2
39.5± 0.002 341.5± 0.4 [59]
39.16 351.0 [60]
20
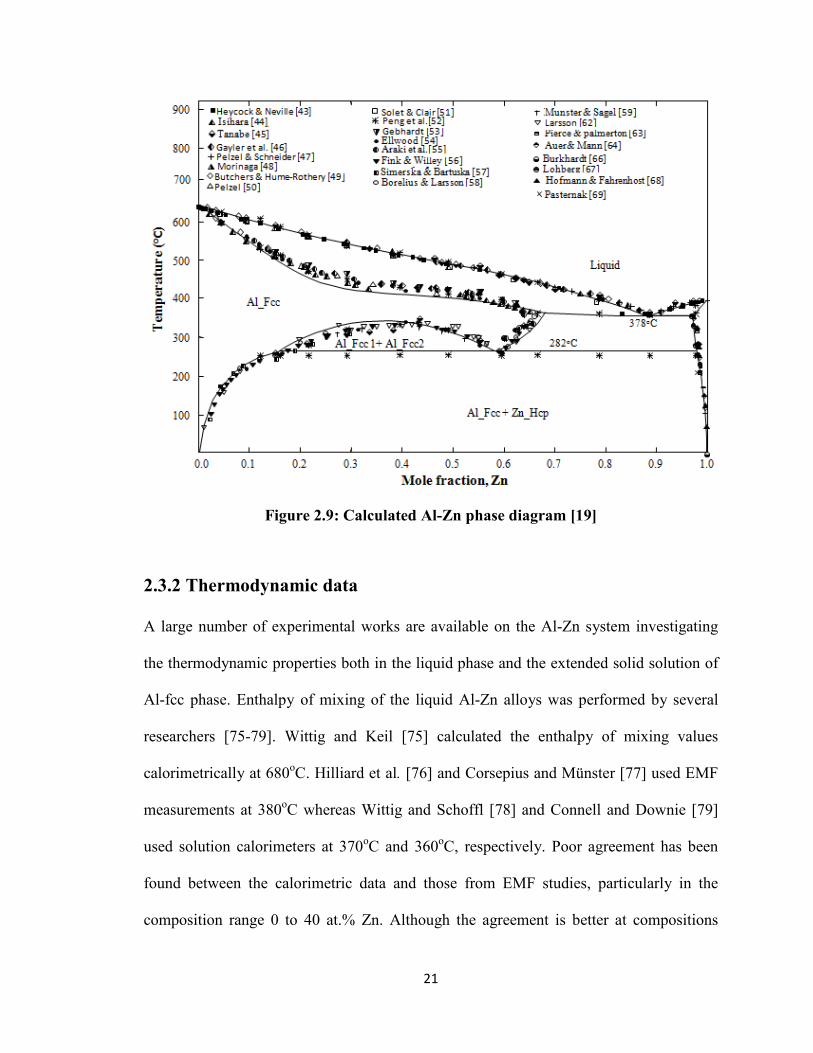
Figure 2.9: Calculated Al-Zn phase diagram [19]
2.3.2 Thermodynamic data
A large number of experimental works are available on the Al-Zn system investigating
the thermodynamic properties both in the liquid phase and the extended solid solution of
Al-fcc phase. Enthalpy of mixing of the liquid Al-Zn alloys was performed by several
researchers [75-79]. Wittig and Keil [75] calculated the enthalpy of mixing values
calorimetrically at 680oC. Hilliard et al. [76] and Corsepius and Münster [77] used EMF
measurements at 380oC whereas Wittig and Schoffl [78] and Connell and Downie [79]
used solution calorimeters at 370oC and 360oC, respectively. Poor agreement has been
found between the calorimetric data and those from EMF studies, particularly in the
composition range 0 to 40 at.% Zn. Although the agreement is better at compositions
21
higher than 40 at.% Zn, the trends of the two sets of data are quite different [75-79].
Figure 2.12 illustrates the calculated enthalpy of mixing by Mey [72] both for the liquid
and solid phase at 680oC and 370oC, respectively. The curve fits well with the
experimental values of [75] in the liquid phase but deviates considerably both in terms of
magnitude and trend from the experimental results of [78] and [79] for the Al-fcc solid
solution phase.
Figure 2.10: Calculated enthalpy of mixing of liquid at 680oC
andfcc phase at 380oC [72]
The activity of Al and Zn both in the liquid phase and the solid solutions are measured by
several researchers [80-89]. The activity of Al in the Al-Zn liquid alloys was measured
by Batalin and Beloborodova [80] at 687oC, Predel and Schallner [81] at 727oC and
827oC and Sebkova and Beranek [82] at 700oC and 800oC. All of them used the EMF
method and their results agree fairly well with each other as can be seen from the
thermodynamic calculations of Wasiur-Rahman [19] demonstrated in Figure 2.11.
22
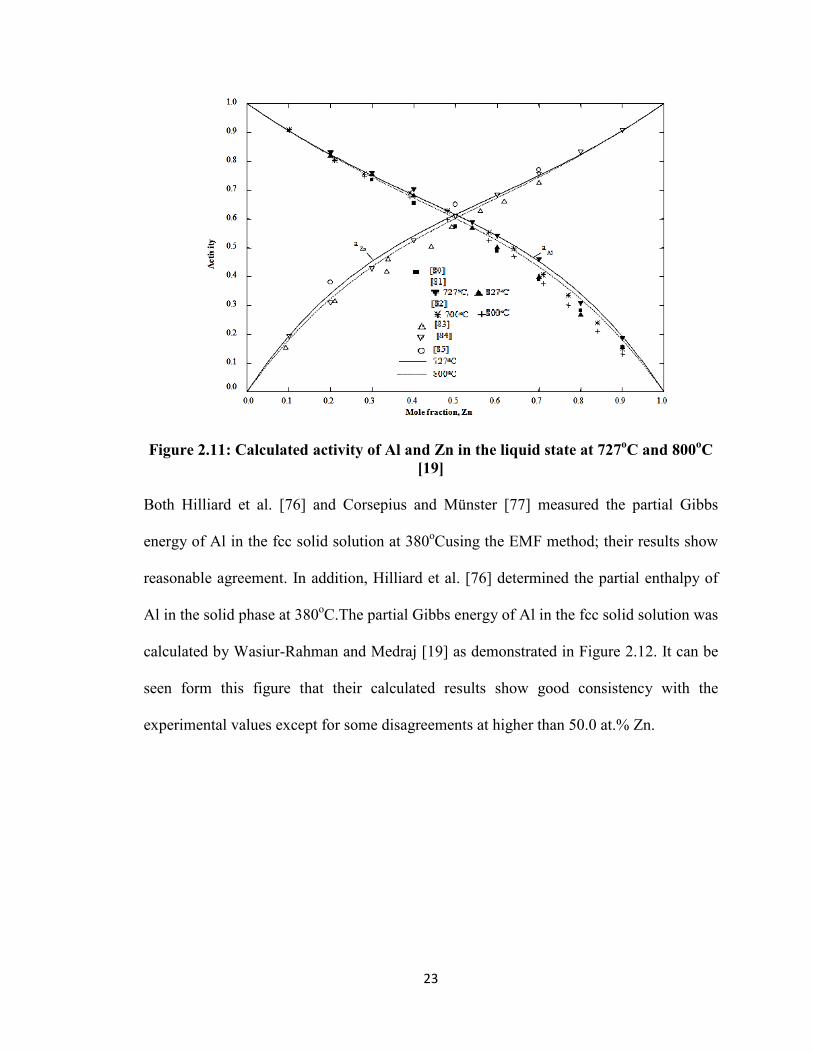
Figure 2.11: Calculated activity of Al and Zn in the liquid state at 727oC and 800oC
[19]
Both Hilliard et al. [76] and Corsepius and Münster [77] measured the partial Gibbs
energy of Al in the fcc solid solution at 380oCusing the EMF method; their results show
reasonable agreement. In addition, Hilliard et al. [76] determined the partial enthalpy of
Al in the solid phase at 380oC.The partial Gibbs energy of Al in the fcc solid solution was
calculated by Wasiur-Rahman and Medraj [19] as demonstrated in Figure 2.12. It can be
seen form this figure that their calculated results show good consistency with the
experimental values except for some disagreements at higher than 50.0 at.% Zn.
23
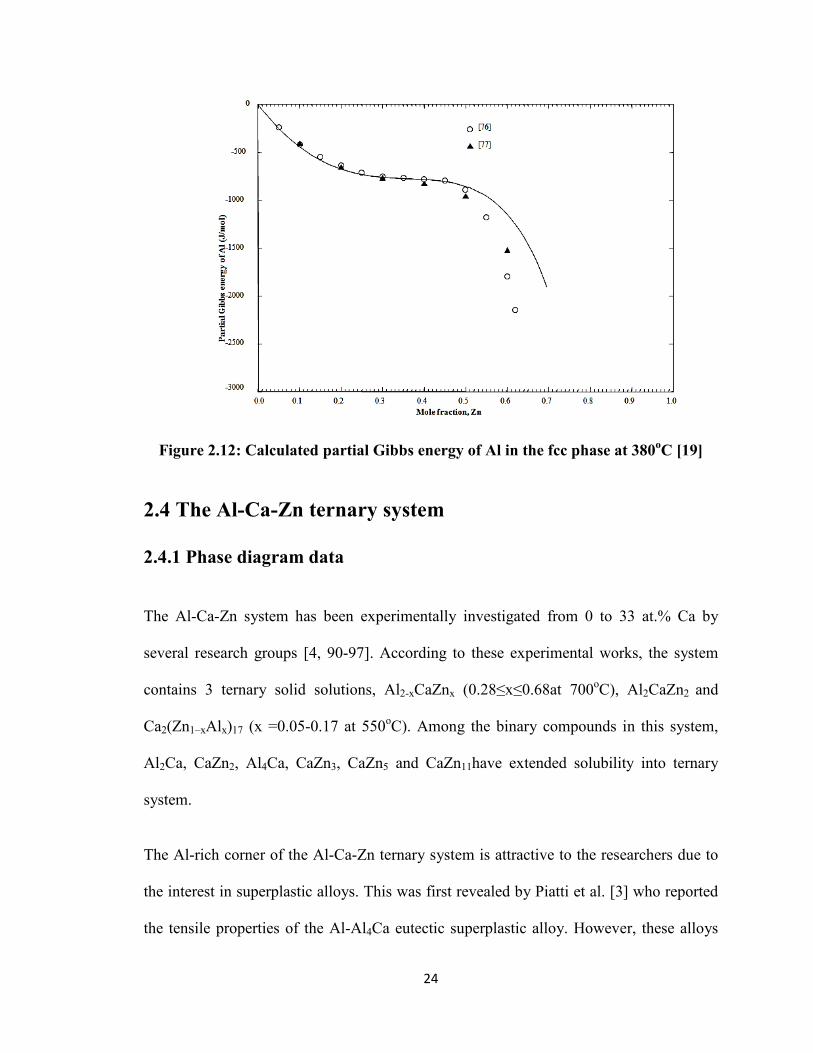
Figure 2.12: Calculated partial Gibbs energy of Al in the fcc phase at 380oC [19]
2.4 The Al-Ca-Zn ternary system
2.4.1 Phase diagram data
The Al-Ca-Zn system has been experimentally investigated from 0 to 33 at.% Ca by
several research groups [4, 90-97]. According to these experimental works, the system
contains 3 ternary solid solutions, Al2-xCaZnx (0.28≤x≤0.68at 700oC), Al2CaZn2 and
Ca2(Zn1–xAlx)17 (x =0.05-0.17 at 550oC). Among the binary compounds in this system,
Al2Ca, CaZn2, Al4Ca, CaZn3, CaZn5 and CaZn11have extended solubility into ternary
system.
The Al-rich corner of the Al-Ca-Zn ternary system is attractive to the researchers due to
the interest in superplastic alloys. This was first revealed by Piatti et al. [3] who reported
the tensile properties of the Al-Al4Ca eutectic superplastic alloy. However, these alloys
24
are brittle at room temperature and cannot be cold rolled industrially. This problem can
be overcome by a small addition of Zn in the system which was first determined by
Moore and Morris [4]. They [4] first experimentally investigated the Al-Ca-Zn system
using metallographic technique, differential thermal analysis, EPMA, TEM and X-ray
diffraction techniques and discovered a new ternary compound AlCaZn3 in the Al-rich
corner. They reported this compound to be superplastic and have a body centered
tetragonal structure. Later, Kono et al. [90] studied the Al-Ca-Zn system and confirmed
the presence of the ternary compound AlCaZn3 using micrography, thermal analysis, X-
ray diffraction and EPMA analysis. They reported that the binary compound Al4Ca
gradually changes into a ternary compound Al3CaZn. Almost at the same time Cordier et
al. [91] reported the crystal structure of a new ternary compound Al2CaZn2 as an ordered
ternary variant of Al4Ba-type structure with lattice parameters a=4.127Å and c=11.671Å.
Later, Ganiev et al. [92] investigated the Al-Ca-Zn system using differential thermal
analysis, X-ray diffraction and metallographic examination and determined the
isothermal section of the Al-Ca-Zn system at 350oC. They reported the congruent melting
temperature of the ternary compound Al2CaZn2 as 840oC using DTA. The presence of
this compound was later confirmed by Gantsev et al. [93]. Recently, Pani et al. [94]
reported a wide homogeneity range from Al4Ca to Al1.88CaZn2.12 composition at 550oC.
The general formula of this phase was proposed as Ca(Zn1-xAlx)4 (x=0.47-1.00 at 550oC)
with an Al4Ba-type structure [94], which is consistent with ternary compound Al2CaZn2
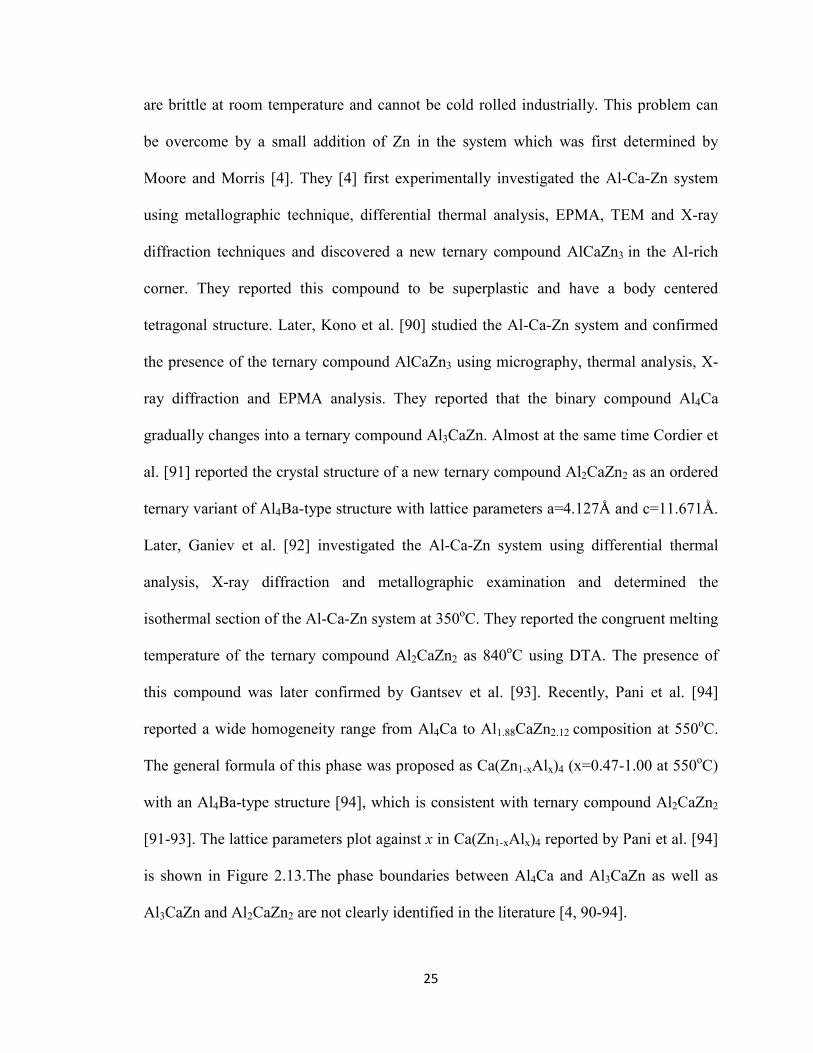
[91-93]. The lattice parameters plot against x in Ca(Zn1-xAlx)4 reported by Pani et al. [94]
is shown in Figure 2.13.The phase boundaries between Al4Ca and Al3CaZn as well as
Al3CaZn and Al2CaZn2 are not clearly identified in the literature [4, 90-94].
25
Figure 2.13: Trend of a and c lattice parameters of the Ca(Zn1-xAlx)4 phases and the
variation of α and β bond angles within the Zn/Al structure [94].
A number of researchers [90, 92, 93, 95, 96] studied other ternary compound AlCaZn,
but their results were contradictory with each other. Ganiev et al. [92] and Gantsev et al.
[93] reported AlCaZn as a congruently melting compound with the melting temperature
as 990oC using differential thermal analysis. Later the Al2Ca-CaZn2 pseudobinary section
was studied by Söderberg et al. [95] and Pani et al. [96]. The Al2Ca-CaZn2 vertical
section illustrated by Söderberg et al. [95] is shown in Figure 2.14. Söderberg et al. [95]
studied this system in the region below 33 at.% Zn at 700ºC and above 33 at% Zn at
600ºC using X-ray diffraction, transmission electron microscopy and thermal analysis
and concluded that AlCaZn is an extended solid solution of the CaZn2 phase.
26
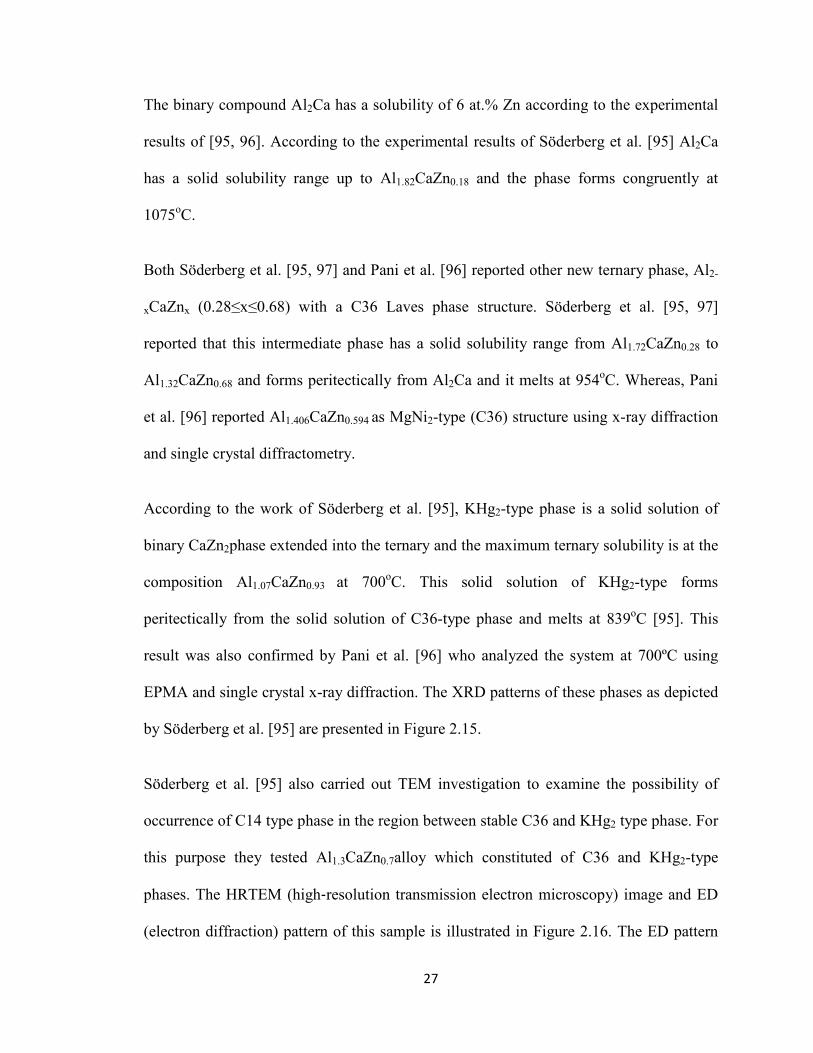
The binary compound Al2Ca has a solubility of 6 at.% Zn according to the experimental
results of [95, 96]. According to the experimental results of Söderberg et al. [95] Al2Ca
has a solid solubility range up to Al1.82CaZn0.18 and the phase forms congruently at
1075oC.
Both Söderberg et al. [95, 97] and Pani et al. [96] reported other new ternary phase, Al2-
xCaZnx (0.28≤x≤0.68) with a C36 Laves phase structure. Söderberg et al. [95, 97]
reported that this intermediate phase has a solid solubility range from Al1.72CaZn0.28 to
Al1.32CaZn0.68 and forms peritectically from Al2Ca and it melts at 954oC. Whereas, Pani
et al. [96] reported Al1.406CaZn0.594 as MgNi2-type (C36) structure using x-ray diffraction
and single crystal diffractometry.
According to the work of Söderberg et al. [95], KHg2-type phase is a solid solution of
binary CaZn2phase extended into the ternary and the maximum ternary solubility is at the
composition Al1.07CaZn0.93 at 700oC. This solid solution of KHg2-type forms
peritectically from the solid solution of C36-type phase and melts at 839oC [95]. This
result was also confirmed by Pani et al. [96] who analyzed the system at 700ºC using
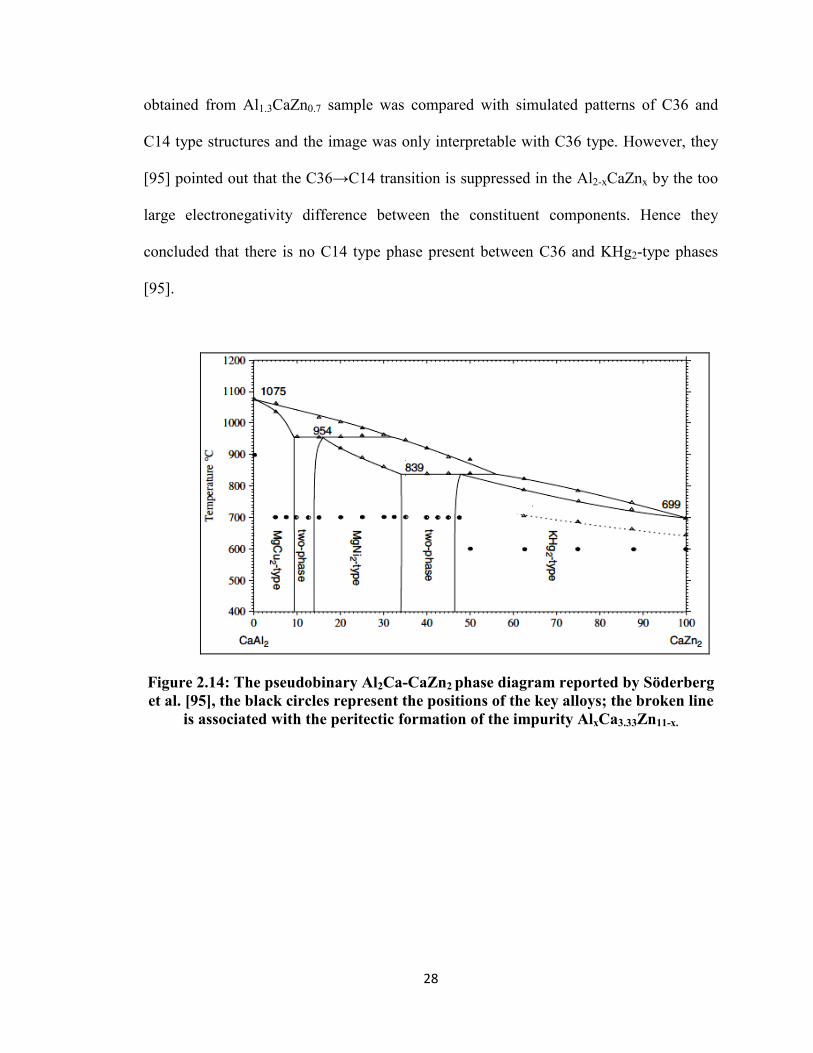
EPMA and single crystal x-ray diffraction. The XRD patterns of these phases as depicted
by Söderberg et al. [95] are presented in Figure 2.15.
Söderberg et al. [95] also carried out TEM investigation to examine the possibility of
occurrence of C14 type phase in the region between stable C36 and KHg2 type phase. For
this purpose they tested Al1.3CaZn0.7alloy which constituted of C36 and KHg2-type
phases. The HRTEM (high‐resolution transmission electron microscopy) image and ED
(electron diffraction) pattern of this sample is illustrated in Figure 2.16. The ED pattern
27
obtained from Al1.3CaZn0.7 sample was compared with simulated patterns of C36 and
C14 type structures and the image was only interpretable with C36 type. However, they
[95] pointed out that the C36→C14 transition is suppressed in the Al2-xCaZnx by the too
large electronegativity difference between the constituent components. Hence they
concluded that there is no C14 type phase present between C36 and KHg2-type phases
[95].
Figure 2.14: The pseudobinary Al2Ca-CaZn2 phase diagram reported by Söderberg et al. [95], the black circles represent the positions of the key alloys; the broken line
is associated with the peritectic formation of the impurity AlxCa3.33Zn11-x.
28
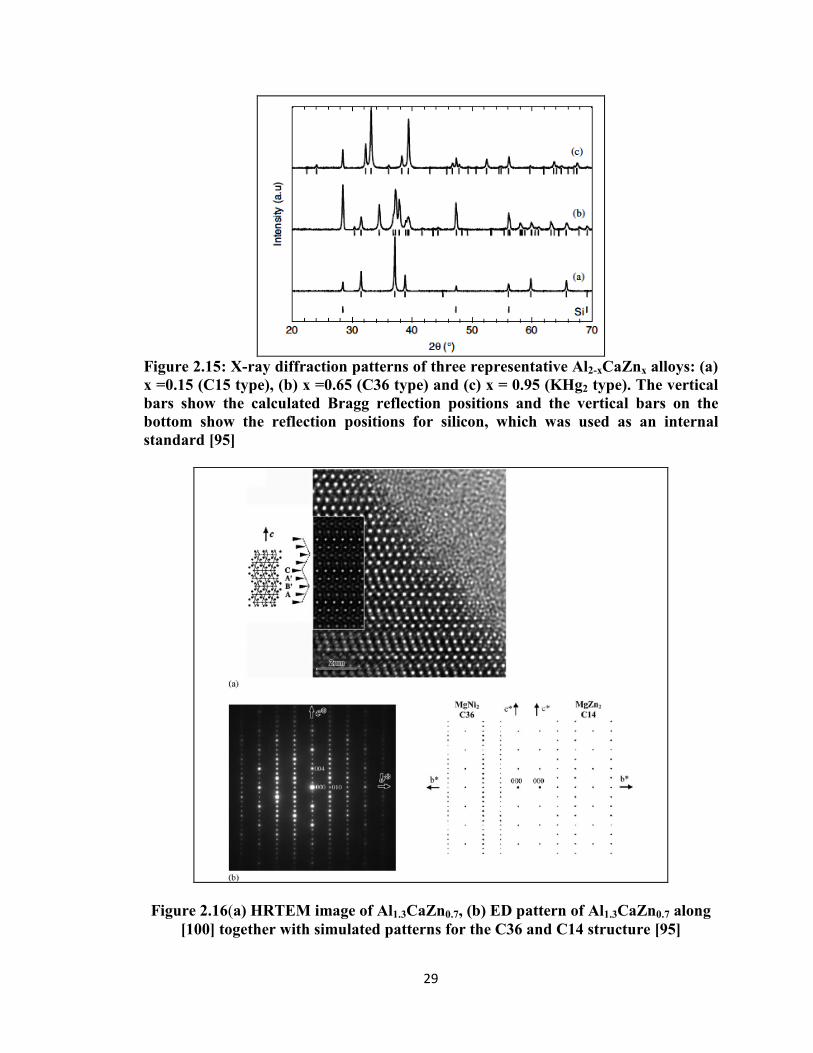
Figure 2.15: X-ray diffraction patterns of three representative Al2-xCaZnx alloys: (a) x =0.15 (C15 type), (b) x =0.65 (C36 type) and (c) x = 0.95 (KHg2 type). The vertical bars show the calculated Bragg reflection positions and the vertical bars on the bottom show the reflection positions for silicon, which was used as an internal standard [95]
Figure 2.16(a) HRTEM image of Al1.3CaZn0.7, (b) ED pattern of Al1.3CaZn0.7 along [100] together with simulated patterns for the C36 and C14 structure [95]
29
Pani et al. [94] investigated the Al-Ca-Zn system from 8 to 33 at% Ca at 550oC by optical
and scanning electron microscopy, EPMA and X-ray analysis. They reported several
binary solid solutions with their homogeneity ranges and crystal structures. According to
Pani et al. [94], the binary phase CaZn3 has an extended solubility in the ternary where
the maximum solubility of Al corresponds to the composition Al0.702CaZn2.322. The
formula for this phase was proposed as Ca(Zn1–xAlx)3 (x= 0-0.23 at 550oC) [94]. The
lattice structure was reported as a=9.157, c= 7.365Å for the nominal composition
Al0.3CaZn2.7 and a= 9.169, c=7.382 Å for the nominal composition Al0.6CaZn2.33 [94].
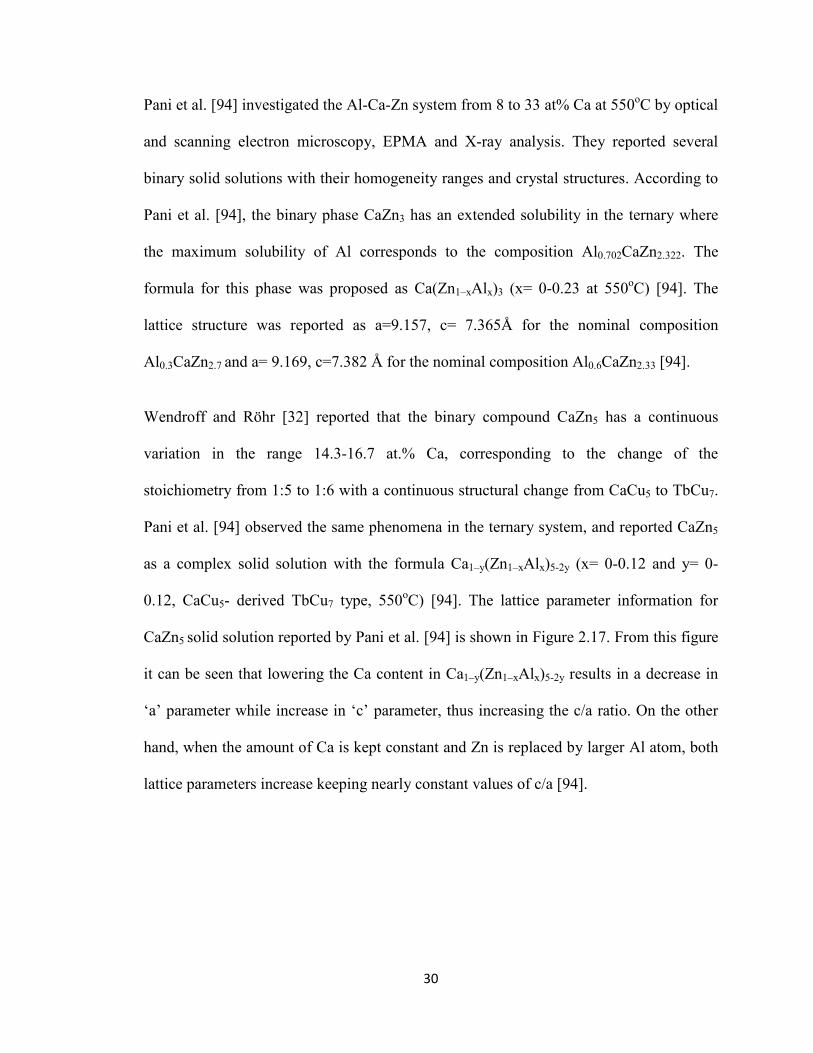
Wendroff and Röhr [32] reported that the binary compound CaZn5 has a continuous
variation in the range 14.3-16.7 at.% Ca, corresponding to the change of the
stoichiometry from 1:5 to 1:6 with a continuous structural change from CaCu5 to TbCu7.
Pani et al. [94] observed the same phenomena in the ternary system, and reported CaZn5
as a complex solid solution with the formula Ca1–y(Zn1–xAlx)5-2y (x= 0-0.12 and y= 0-
0.12, CaCu5- derived TbCu7 type, 550oC) [94]. The lattice parameter information for
CaZn5 solid solution reported by Pani et al. [94] is shown in Figure 2.17. From this figure
it can be seen that lowering the Ca content in Ca1–y(Zn1–xAlx)5-2y results in a decrease in
‘a’ parameter while increase in ‘c’ parameter, thus increasing the c/a ratio. On the other
hand, when the amount of Ca is kept constant and Zn is replaced by larger Al atom, both
lattice parameters increase keeping nearly constant values of c/a [94].
30
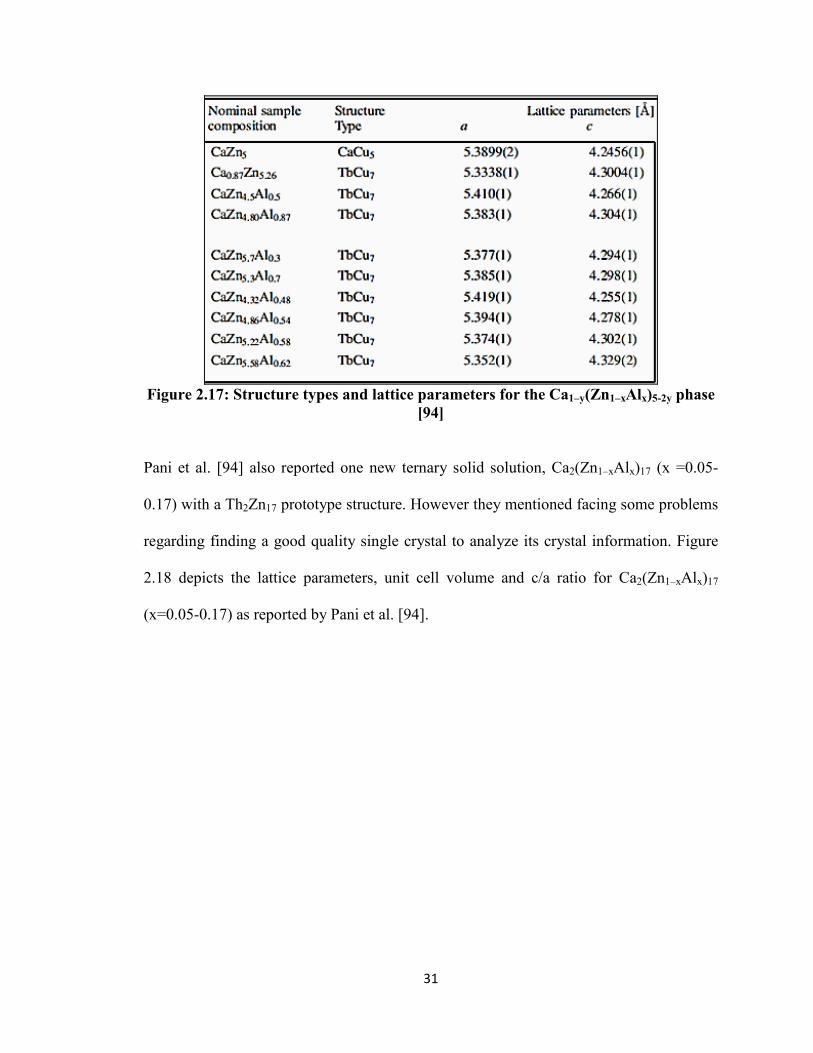
Figure 2.17: Structure types and lattice parameters for the Ca1–y(Zn1–xAlx)5-2y phase
[94]
Pani et al. [94] also reported one new ternary solid solution, Ca2(Zn1–xAlx)17 (x =0.05-
0.17) with a Th2Zn17 prototype structure. However they mentioned facing some problems
regarding finding a good quality single crystal to analyze its crystal information. Figure
2.18 depicts the lattice parameters, unit cell volume and c/a ratio for Ca2(Zn1–xAlx)17
(x=0.05-0.17) as reported by Pani et al. [94].
31
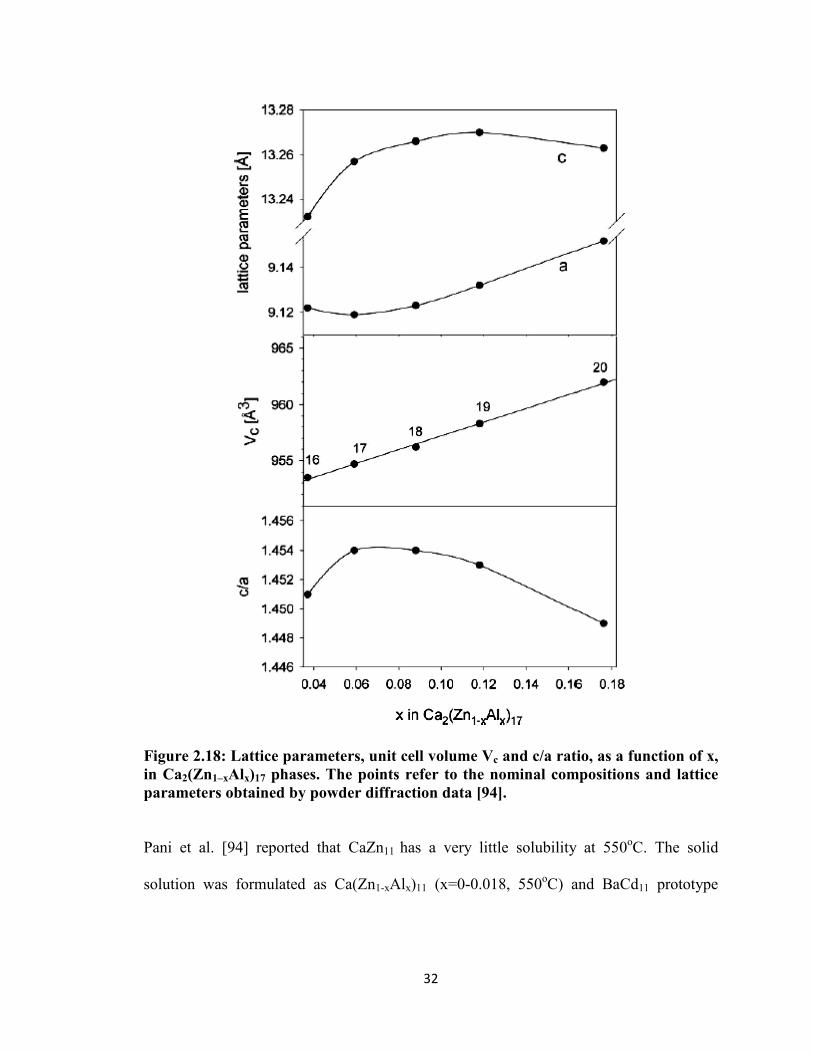
Figure 2.18: Lattice parameters, unit cell volume Vc and c/a ratio, as a function of x, in Ca2(Zn1–xAlx)17 phases. The points refer to the nominal compositions and lattice parameters obtained by powder diffraction data [94].
Pani et al. [94] reported that CaZn11 has a very little solubility at 550oC. The solid
solution was formulated as Ca(Zn1-xAlx)11 (x=0-0.018, 550oC) and BaCd11 prototype
32
[94].The lattice parameters values were reported as a=10.706, c=6.851Å for the nominal
composition Al0.8CaZn10.2 [94].
The liquidus of the Al-Ca-Zn system was studied experimentally by Kono et al. [90] and
Gantsev et al. [93]. Kono et al. [9] reported two eutectic points, Al-4.5%, Ca-7.3%Zn and
Al-2.4%Ca-57.9%Zn by at.%. Gantsev et al. [93] reported six eutectic reactions with the
approximate eutectic compositions and temperatures; these are given in Table 2.4.1 along
with the calculated invariant reactions performed by Wasiur-Rahman [19].A liquidus
projection had been suggested by Kono et al. [9] as shown in Figure 2.19.
Table 2.4.1: Calculated invariant reactions and special points in the Al-Ca-Zn system based on the thermodynamic modeling of Wasiur-Rahman [19]
Type Reaction Composition (at.%) Temp
oC Reference
Al Zn Ca
E1 L↔Al2Ca+CaAlZn+CaAl2Zn2 51.8 22.7 25.8 679.0 [19]
E2 L↔Al14Ca13+Al3Ca8+CaAlZn 31.5 9.6 58.9 504.2 [19]
E3 L↔ Ca_Bcc+Al3Ca8+CaAlZn 19.6 12.4 68.0 479.2 [19]
E4 L↔ AlCaZn+Ca3Zn+Ca5Zn3 4.8 29.5 65.7 375.0 [19]
E5 L↔ CaZn5+AlCaZn+CaZn3 12.9 61.9 25.2 456.9 [19]
E6 L↔ AlCaZn+CaZn5+CaAl2Zn2 14.8 62.9 22.3 456.5 [19]
E7 L↔CaZn5+CaZn11+CaAl2Zn2 13.4 69.6 18.0 475.8 [19]
E8 L↔Zn_Hcp+Al_Fcc+CaZn13 13.6 84.0 2.4 363.4 [19]
11.22 88.46 0.46 380.0 [93]
U1 L+Al4Ca↔Al_Fcc+CaAl2Zn2 75.3 11.6 13.1 549.0 [19]
33
U2 L+Al2Ca↔Al4Ca+CaAl2Zn2 69.0 14.0 17.0 575.3 [19]
U3 L+Al2Ca↔Al14Ca13+CaAlZn 35.6 10.6 53.8 550.7 [19]
U4 L+Ca_Bcc↔CaAlZn+Ca_Fcc 8.5 19.2 68.3 443.0 [19]
U5 L+Ca_Fcc↔CaAlZn+Ca3Zn 8.9 29.6 61.5 357.0 [19]
U6 L+CaZn↔CaAlZn+Ca5Zn3 6.2 37.2 56.6 389.2 [19]
U7 L+CaZn2↔CaZn+CaAlZn 7.0 40.2 52.8 405.0 [19]
U8 L+CaZn2↔CaZn3+CaAlZn 93.7 61.5 25.8 459.0 [19]
U9 L+CaZn11↔CaAl2Zn2+CaZn13 13.4 76.5 10.1 494.0 [19]
U10 L+CaAl2Zn2↔Al_Fcc+CaZn13 21.6 73.5 4.9 347.0 [19]
m1 L↔Al2Ca+CaAl2Zn2 53.0 22.0 25.0 689.0 [19]
48.8 24.8 26.4 710.0 [93]
m2 L↔Al2Ca+CaAlZn 18.0 50.0 32.0 807.0 [19]
15.2 51.5 33.3 850.0 [93]
m3 L↔Al3Ca8+CaAlZn 29.0 10.6 60.4 506.0 [19]
m4 L↔CaAlZn+Ca_Bcc 15.7 16.0 68.3 487.3 [19]
m5 L↔CaAlZn+CaZn2 9.9 57.0 33.1 513.0 [19]
7.6 59.1 33.3 375.0 [93]
m6 L↔CaAlZn+CaZn5 13.8 62.8 19.4 437.0 [19]
- - - 380.0 [93]
m7 L↔CaAl2Zn2+CaZn5 13.8 67.9 18.3 475.5 [19]
m8 L↔CaZn11+CaAl2Zn2 13.3 74.1 93.5 502.5 [19]
m9 L↔CaAlZn+CaAl2Zn2 37.0 37.0 26.0 740.0 [19]
36.4 36.4 27.2 650.0 [93]
34
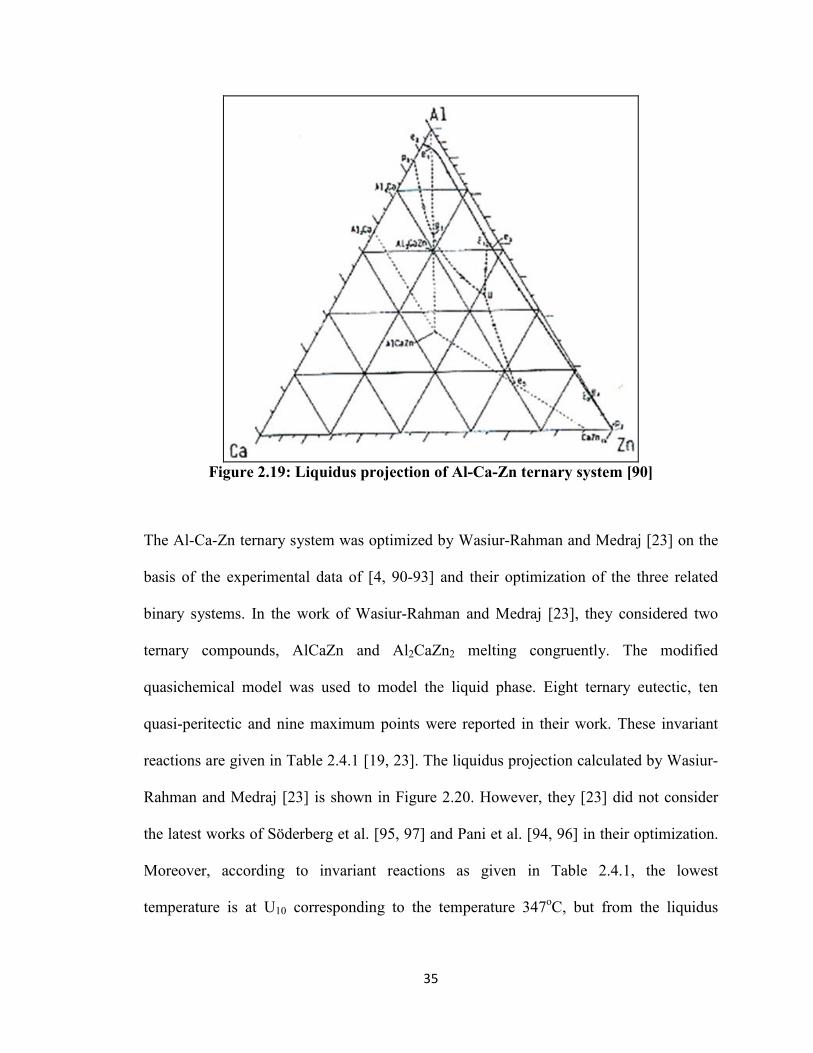
Figure 2.19: Liquidus projection of Al-Ca-Zn ternary system [90]
The Al-Ca-Zn ternary system was optimized by Wasiur-Rahman and Medraj [23] on the
basis of the experimental data of [4, 90-93] and their optimization of the three related
binary systems. In the work of Wasiur-Rahman and Medraj [23], they considered two
ternary compounds, AlCaZn and Al2CaZn2 melting congruently. The modified
quasichemical model was used to model the liquid phase. Eight ternary eutectic, ten
quasi-peritectic and nine maximum points were reported in their work. These invariant
reactions are given in Table 2.4.1 [19, 23]. The liquidus projection calculated by Wasiur-
Rahman and Medraj [23] is shown in Figure 2.20. However, they [23] did not consider
the latest works of Söderberg et al. [95, 97] and Pani et al. [94, 96] in their optimization.
Moreover, according to invariant reactions as given in Table 2.4.1, the lowest
temperature is at U10 corresponding to the temperature 347oC, but from the liquidus
35
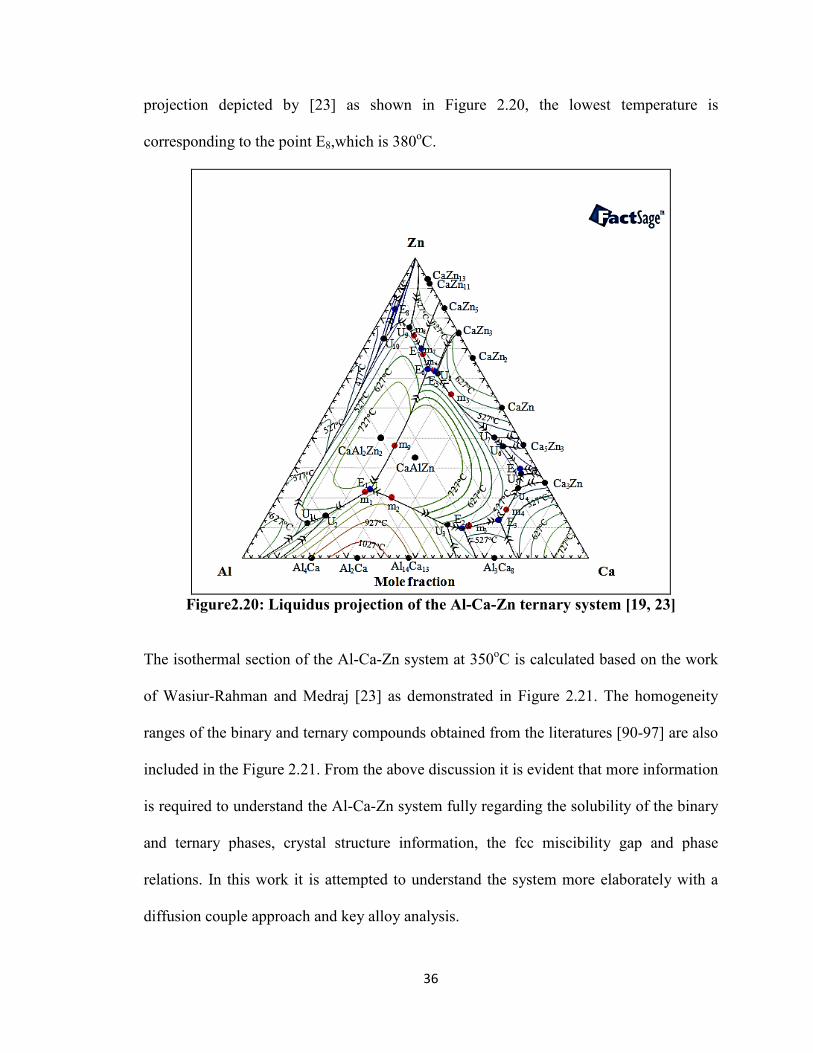
projection depicted by [23] as shown in Figure 2.20, the lowest temperature is
corresponding to the point E8,which is 380oC.
Figure2.20: Liquidus projection of the Al-Ca-Zn ternary system [19, 23]
The isothermal section of the Al-Ca-Zn system at 350oC is calculated based on the work
of Wasiur-Rahman and Medraj [23] as demonstrated in Figure 2.21. The homogeneity
ranges of the binary and ternary compounds obtained from the literatures [90-97] are also
included in the Figure 2.21. From the above discussion it is evident that more information
is required to understand the Al-Ca-Zn system fully regarding the solubility of the binary
and ternary phases, crystal structure information, the fcc miscibility gap and phase
relations. In this work it is attempted to understand the system more elaborately with a
diffusion couple approach and key alloy analysis.
36
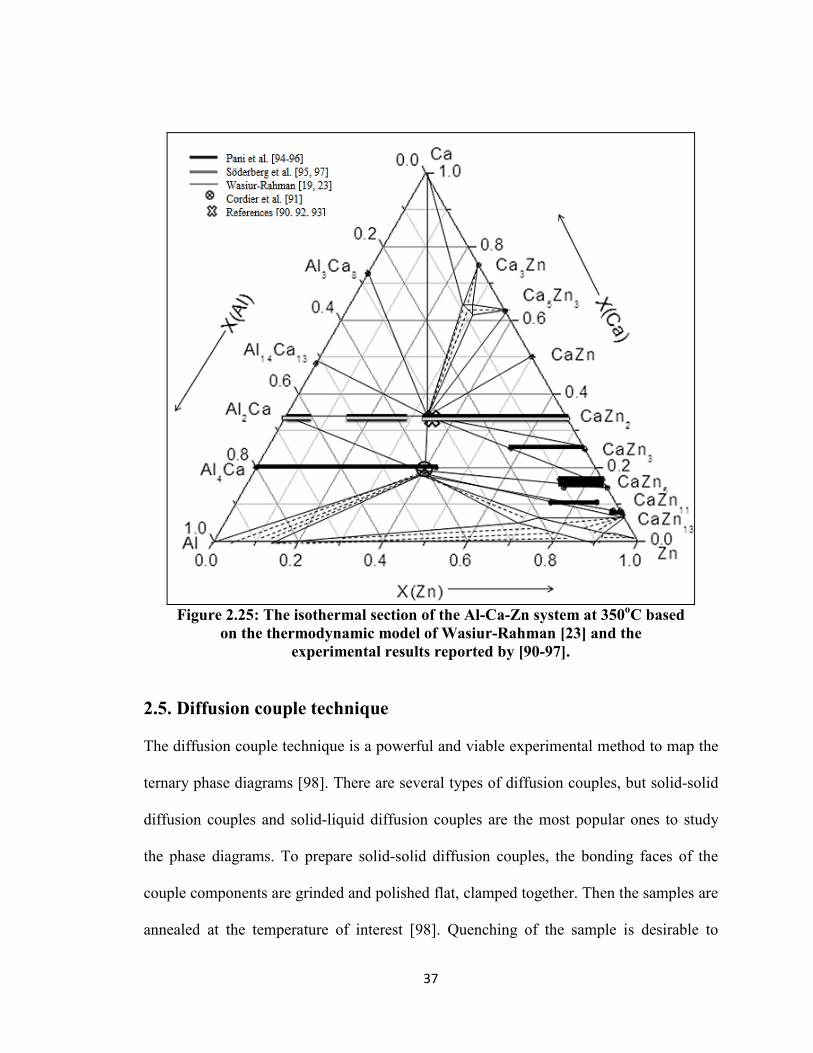
Figure 2.25: The isothermal section of the Al-Ca-Zn system at 350oC based
on the thermodynamic model of Wasiur-Rahman [23] and the experimental results reported by [90-97].
2.5. Diffusion couple technique
The diffusion couple technique is a powerful and viable experimental method to map the
ternary phase diagrams [98]. There are several types of diffusion couples, but solid-solid
diffusion couples and solid-liquid diffusion couples are the most popular ones to study
the phase diagrams. To prepare solid-solid diffusion couples, the bonding faces of the
couple components are grinded and polished flat, clamped together. Then the samples are
annealed at the temperature of interest [98]. Quenching of the sample is desirable to
37
freeze and keep the high temperature equilibrium [98]. The advantage of solid-solid
diffusion couple is that no melting or powder contamination incorporated with this
technique and equilibrium phases are formed by interdiffusion reaction [98]. However,
sometimes solid-solid diffusion couples are not successful due to certain inherent
problems associated with the terminal compositions, such as brittleness of the alloys. In
such cases, solid-liquid diffusion couple can be a good alternative, where instead of
clamping, the lower melting point alloy or pure metal is molten on top of the high-
melting component. Although diffusion couple technique is a powerful tool in phase
diagram determination, it is not invincible. When diffusion couple method is used to
determine phase relationships, one must always consider for the likelihood of missing
phases [98, 99]. The possible reason for the missing phase can be the slow nucleation of
the phase, and due to the sluggish nature of the phase formation, the layer of this phase
could be too thin to be identified by EPMA. This phenomenon will ultimately give
erroneous tie line compositions for phase relations due to the difficulty of extrapolating
the interface based on a few data points [98]. The possible solution can be considered by
preparing other diffusion couples with different end members [99] or a combination of
diffusion method with an investigation of selected equilibrated alloys [99]. In this work,
the Al-Ca-Zn system has been studied with diffusion couple technique in conjunction
with key alloys.
38
CHAPTER 3
EXPERIMENTAL PROCEDURE
The Al-Ca-Zn system has been studied experimentally by preparing 5 diffusion couples
and 26 key alloys annealed at 350oC based on the thermodynamic model of Wasiur-
Rahman [19, 23].The starting materials are 99.999% pure Al, 99.99% pure Zn and 99%
pure Ca supplied by Alfa-Aesar. The key alloys have been prepared in an arc-melting
furnace with water-cooled copper crucible in an argon atmosphere using a non-
consumable tungsten electrode. All the samples have been re-melted 5 times in the arc-
melting furnace to ensure the homogeneity of the samples. The samples have been
annealed at 350oC. The annealing temperature has been chosen at 350oC for the following
reasons,
1. The lowest temperature on the liquidus of the Al-Ca-Zn system was found to be
380oC from the thermodynamic calculation of Wasiur-Rahman and Medraj [19,
23]. So the annealing temperature should be below 380oC.
2. The annealing temperature should be high enough to ensure the interdiffusion and
the formation of the phases at a comparatively faster rate to avoid extremely long
annealing time.
3.1 Solid-solid diffusion couples
The solid-solid diffusion couples have been prepared with a piece of ternary alloy and a
piece of Zn as end members. The faces of the end members of the diffusion couples have
39
been pre-grinded up to 1200 grit using SiC paper and polished up to 1µm using diamond
suspension and 99% ethanol as lubricant. The pieces are then pressed together using
clamping rings and wrapped in a tantalum foil, sealed in a quartz tube under protective
argon atmosphere. Finally the diffusion couples are annealed at 350oC for 5 weeks and
quenched in cold water.
The actual compositions of the end members of the solid-solid diffusion couples are:
SSDC-1: Al66.3Ca26.9Zn6.8-Zn
SSDC-2: Al69.6Ca12.2Zn18.2-Zn
SSDC-3: Al40Ca40Zn20-Zn
SSDC-4: Al30Ca37.3Zn32.7-Zn
3.2 Solid-Liquid diffusion couples
To investigate the Al-Ca-Zn system, one additional solid-liquid diffusion couple has been
prepared with end members Al2Ca-Zn. To prepare the solid-liquid diffusion couple, the
lower melting element Zn was melted on top of the higher melting compound Al2Ca in
the arc-melting furnace under protective argon atmosphere. The sample was then sealed
in a quartz tube and annealed for one week at 350oC followed by quenching in cold
water.
The end members of the diffusion couples are illustrated in Figure 3.1.
40
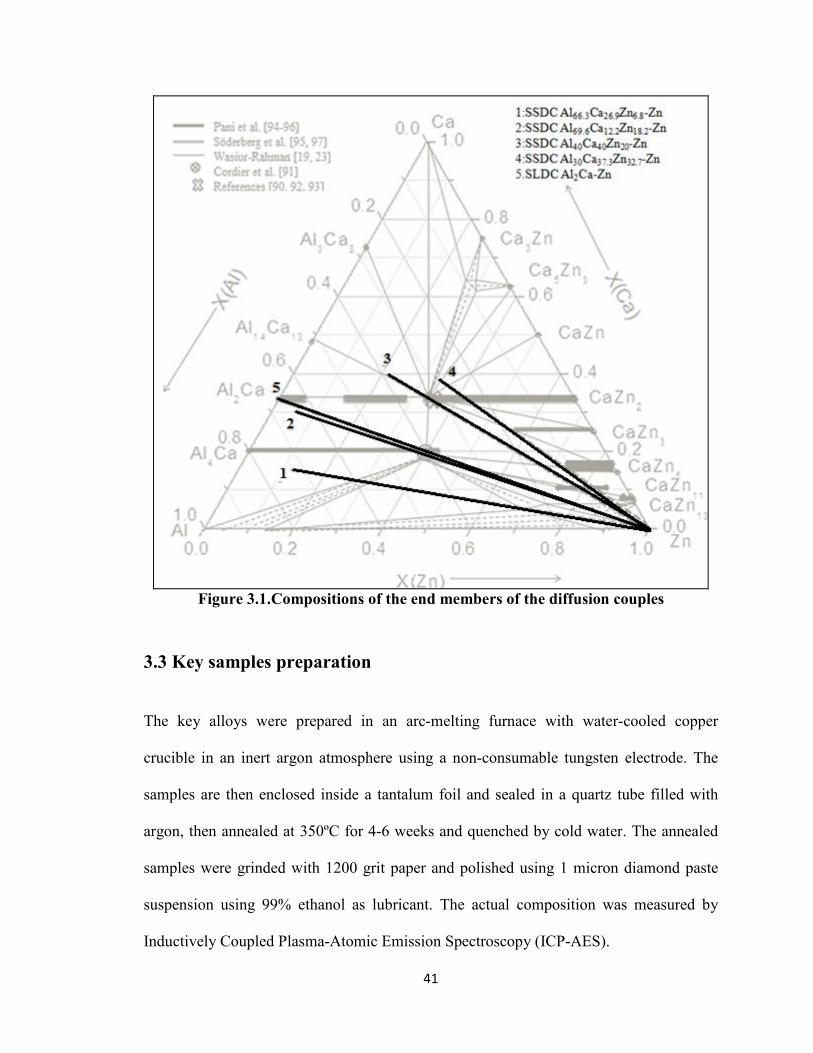
Figure 3.1.Compositions of the end members of the diffusion couples
3.3 Key samples preparation
The key alloys were prepared in an arc-melting furnace with water-cooled copper
crucible in an inert argon atmosphere using a non-consumable tungsten electrode. The
samples are then enclosed inside a tantalum foil and sealed in a quartz tube filled with
argon, then annealed at 350ºC for 4-6 weeks and quenched by cold water. The annealed
samples were grinded with 1200 grit paper and polished using 1 micron diamond paste
suspension using 99% ethanol as lubricant. The actual composition was measured by
Inductively Coupled Plasma-Atomic Emission Spectroscopy (ICP-AES).
41
3.3.1 Inductively Coupled Plasma technique
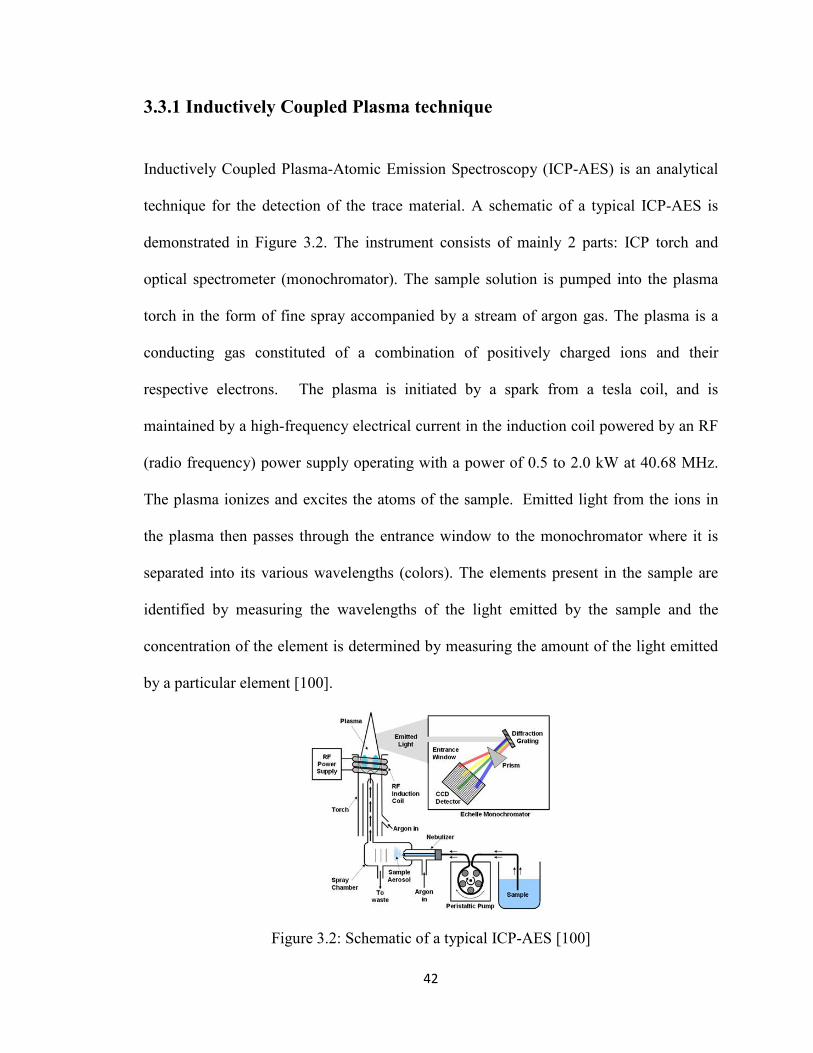
Inductively Coupled Plasma-Atomic Emission Spectroscopy (ICP-AES) is an analytical
technique for the detection of the trace material. A schematic of a typical ICP-AES is
demonstrated in Figure 3.2. The instrument consists of mainly 2 parts: ICP torch and
optical spectrometer (monochromator). The sample solution is pumped into the plasma
torch in the form of fine spray accompanied by a stream of argon gas. The plasma is a
conducting gas constituted of a combination of positively charged ions and their
respective electrons. The plasma is initiated by a spark from a tesla coil, and is
maintained by a high-frequency electrical current in the induction coil powered by an RF
(radio frequency) power supply operating with a power of 0.5 to 2.0 kW at 40.68 MHz.
The plasma ionizes and excites the atoms of the sample. Emitted light from the ions in
the plasma then passes through the entrance window to the monochromator where it is
separated into its various wavelengths (colors). The elements present in the sample are
identified by measuring the wavelengths of the light emitted by the sample and the
concentration of the element is determined by measuring the amount of the light emitted
by a particular element [100].
Figure 3.2: Schematic of a typical ICP-AES [100]
42
3.4 Analysis of the samples
Diffusion couples and key alloys have been analyzed by OM (Optical Microscopy), SEM
(Scanning Electron Microscopy), EPMA (Electron Probe Micro-analysis) and XRD (X-
ray diffraction). The microstructure of the constituent phases of a sample has been
identified by OM and SEM. Phase identification and determination of the phase
compositions have been performed with EPMA. XRD method has been incorporated for
phase identification and crystallographic information.
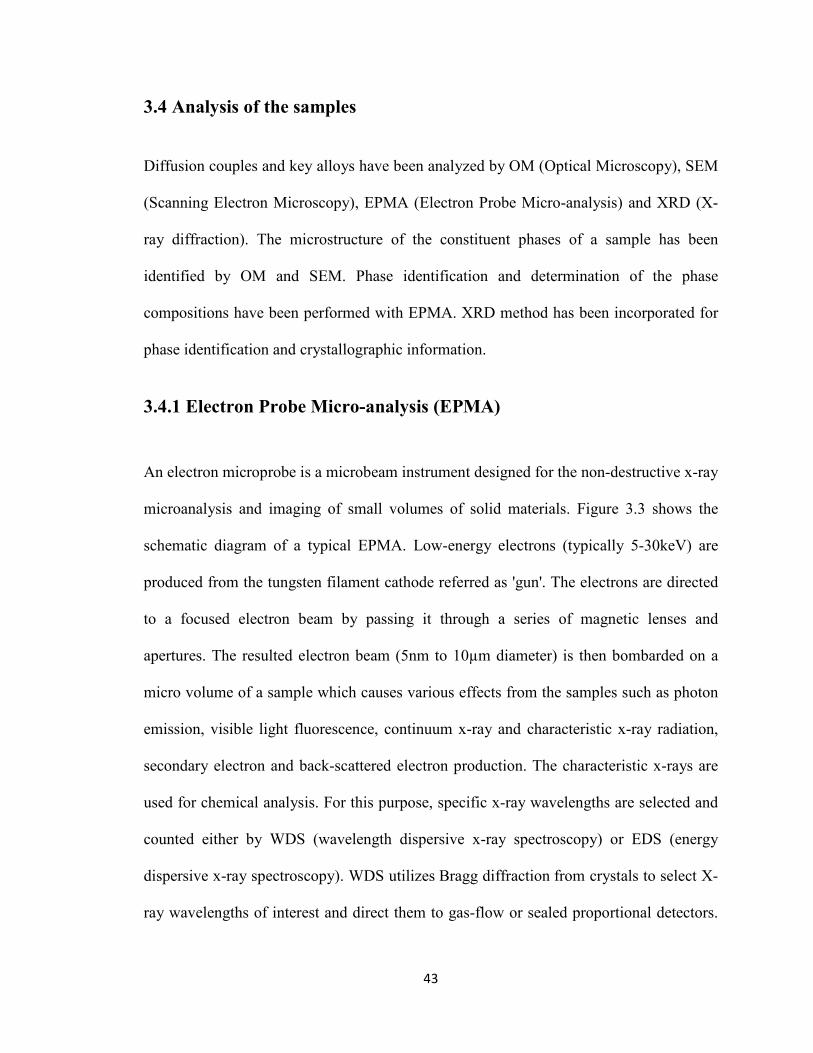
3.4.1 Electron Probe Micro-analysis (EPMA)
An electron microprobe is a microbeam instrument designed for the non-destructive x-ray
microanalysis and imaging of small volumes of solid materials. Figure 3.3 shows the
schematic diagram of a typical EPMA. Low-energy electrons (typically 5-30keV) are
produced from the tungsten filament cathode referred as 'gun'. The electrons are directed
to a focused electron beam by passing it through a series of magnetic lenses and
apertures. The resulted electron beam (5nm to 10µm diameter) is then bombarded on a
micro volume of a sample which causes various effects from the samples such as photon
emission, visible light fluorescence, continuum x-ray and characteristic x-ray radiation,
secondary electron and back-scattered electron production. The characteristic x-rays are
used for chemical analysis. For this purpose, specific x-ray wavelengths are selected and
counted either by WDS (wavelength dispersive x-ray spectroscopy) or EDS (energy
dispersive x-ray spectroscopy). WDS utilizes Bragg diffraction from crystals to select X-
ray wavelengths of interest and direct them to gas-flow or sealed proportional detectors.
43
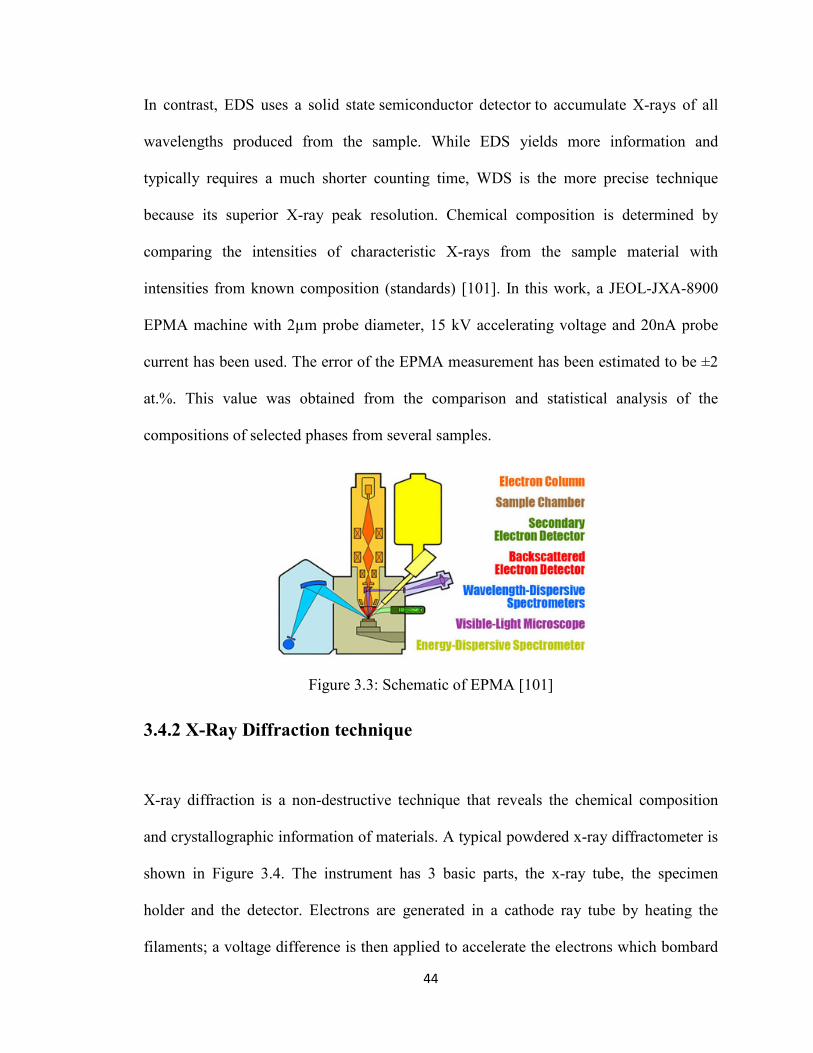
In contrast, EDS uses a solid state semiconductor detector to accumulate X-rays of all
wavelengths produced from the sample. While EDS yields more information and
typically requires a much shorter counting time, WDS is the more precise technique
because its superior X-ray peak resolution. Chemical composition is determined by
comparing the intensities of characteristic X-rays from the sample material with
intensities from known composition (standards) [101]. In this work, a JEOL-JXA-8900
EPMA machine with 2µm probe diameter, 15 kV accelerating voltage and 20nA probe
current has been used. The error of the EPMA measurement has been estimated to be ±2
at.%. This value was obtained from the comparison and statistical analysis of the
compositions of selected phases from several samples.
Figure 3.3: Schematic of EPMA [101]
3.4.2 X-Ray Diffraction technique
X-ray diffraction is a non-destructive technique that reveals the chemical composition
and crystallographic information of materials. A typical powdered x-ray diffractometer is
shown in Figure 3.4. The instrument has 3 basic parts, the x-ray tube, the specimen
holder and the detector. Electrons are generated in a cathode ray tube by heating the
filaments; a voltage difference is then applied to accelerate the electrons which bombard
44
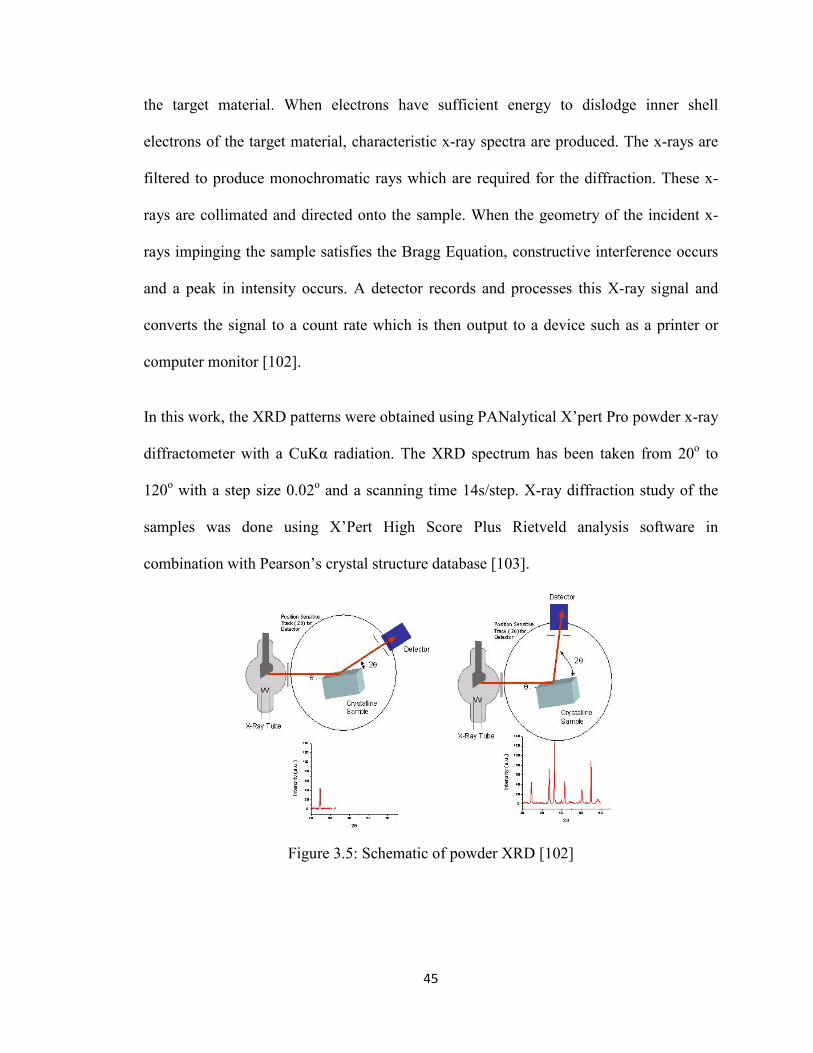
the target material. When electrons have sufficient energy to dislodge inner shell
electrons of the target material, characteristic x-ray spectra are produced. The x-rays are
filtered to produce monochromatic rays which are required for the diffraction. These x-
rays are collimated and directed onto the sample. When the geometry of the incident x-
rays impinging the sample satisfies the Bragg Equation, constructive interference occurs
and a peak in intensity occurs. A detector records and processes this X-ray signal and
converts the signal to a count rate which is then output to a device such as a printer or
computer monitor [102].
In this work, the XRD patterns were obtained using PANalytical X’pert Pro powder x-ray
diffractometer with a CuKα radiation. The XRD spectrum has been taken from 20o to
120o with a step size 0.02o and a scanning time 14s/step. X-ray diffraction study of the
samples was done using X’Pert High Score Plus Rietveld analysis software in
combination with Pearson’s crystal structure database [103].
Figure 3.5: Schematic of powder XRD [102]
45
CHAPTER 4
RESULTS AND DISCUSSIONS
4.1 Isothermal section at 350ºC through diffusion couples
The isothermal section of the Al-Ca-Zn system has been studied via 5 diffusion couples
and 26 key samples. The analysis has revealed that there are 5 ternary compounds in the
system. These ternary compounds have been named as IM1, IM2, IM3, IM4 and IM5
according to the amount of Ca-content in the intermetallics. IM1 is a new ternary solid
solution reported for the first time in this work containing approximately 8.5 at.% Ca.
The formula of this compound is AlxCa8.5Zny (26≤x≤29, 62≤y≤65, 350oC). The crystal
structure of IM1 has also been confirmed in this work. IM2 is a ternary compound
containing 20 at.% Ca and its formula is Al4-xCaZnx (1.2 x≤2, 350oC). IM2 has been
studied and reported by a several research groups [90-94]. However, as discussed earlier
in the literature review, the homogeneity range of this compound is not clear from the
information obtained from the former works. In this work, the equilibrium of IM2 with
the binary compound Al4Ca has been identified using the diffusion couple approach. IM3
is another new ternary compound with approximately 25 at.% Ca-content, the formula for
this compound is Al3-xCaZx (2≤x≤2.2, 350oC). IM4 is 33 at.% Ca-content ternary solid
solution with Al2-xCaZnx (0.28≤x≤0.70, 350oC) formula, which is similar to the results
reported by [94, 95] at 600oC. IM5 is a high Ca-content ternary compound with
Al2Ca9Zn3formula. Among the binary compounds, Al4Ca, Al2Ca, Al14Ca13, CaZn13,
CaZn11, CaZn5, CaZn3 and CaZn2 have extended solid solution in the ternary at 350oC.
46
The detailed discussions of the solid solutions of these compounds and their relationships
with other phases have been described in the following sections with the help of diffusion
couples and key alloy experiments.
4.1.1 Solid-solid diffusion couples
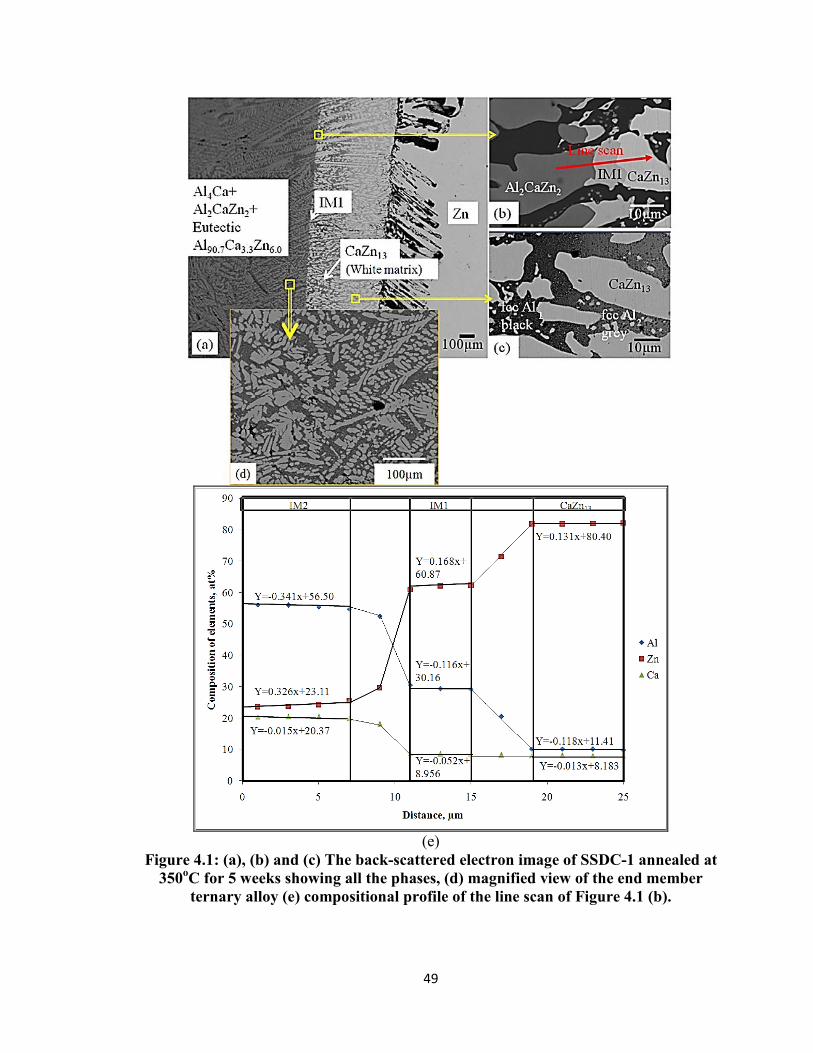
The Solid-solid diffusion couple SSDC-1 has been prepared with terminal composition
Al69.6Ca12.2Zn18.2 to pure Zn. Back-scattered electron images of the solid-solid diffusion
couple SSDC-1 with increased magnification of the area of interest are illustrated in
Figure 4.1 (a), (b), (c) and (d). During heat treatment, extensive interdiffusion among Al,
Ca and Zn took place allowing various equilibrium phases to form. EPMA line scan has
been carried out to determine the solubility range of IM1, IM2 and CaZn13as
demonstrated in Figure 4.1(b) and (e). Spot analysis has been carried out for composition
detection of smaller grains, for instance those of fcc-Al and ternary eutectic that has been
found to have the composition Al90.7Ca3.3Zn6.0. Based on the compositional information
obtained by EPMA analysis, ternary and binary intermetallic compounds and the solid
solubility of the binary compounds extending in the ternary system have been identified.
Using the local equilibrium at the interfaces formed between the phases, the sequence of
the phases along the diffusion path (from left to right corresponding to Figure 4.1) is:
Al4Ca + IM2+Eutectic→ IM1+ fcc-Al1(black) → IM1+ fcc-Al1(black) + fcc-Al2(grey) →
IM1+ fcc-Al2(grey) + CaZn13 → Zn. Two ternary compounds have been detected in this
diffusion couple by EPMA spot analysis: ternary intermetallic (IM1) with
Al29.8Ca8.6Zn61.5formula and ternary intermetallic (IM2) with Al56.0Ca20.4Zn23.6formula.
The result of the 25μm EPMA line scan of the diffusion couple is shown in Figure 4.1(e).
The solubility ranges have been calculated at the boundary between two phases using a
47
least square approximation method. From Figure 4.1(e), the limiting composition of the
solid solution IM2 has been determined to be Al56.0Ca20.3Zn23.7at 350oC at the equilibrium
with Al4Ca, but the boundary between Al4Ca and IM2 has not been identified. The
solubility limits of IM1 have been studied at 350oC from SSDC-1 and the compositions
are Al29.4Ca8.4Zn62.2 at the equilibrium with IM2 and Al26.7Ca8.4Zn64.9 at the equilibrium
with CaZn13, respectively, as illustrated in Figure 4.1(e). The binary compound CaZn13
has a maximum ternary solubility of 10.1 at.% Al with the composition Al10.1Ca8.0Zn81.9.
The least squares approximation has been used to obtain the solubility limits of all the
compounds. The deviation from the linearity is about ±1 at.%, which is within the error
limits of the EPMA measurements.
The compositions of the phases of ternary alloy have been determined by EPMA spot
analysis. The ternary alloy Al69.6Ca12.2Zn18.2is composed of a eutectic microstructure with
the Al4Ca+ IM2 matrix. The composition of the eutectic in the Al-rich region has been
found by EPMA spot analysis to be approximately Al90.7Ca3.3Zn6.0, as shown in Figure
4.1(a). Figure 4.1 (c) presents the fcc-Al miscibility. Two different fcc-Al precipitates
have been found: the higher Al-rich phase is named as fcc-Al1(black) and the Zn-rich
phase is named fcc-Al2(grey). The solubility range offcc-Al1(black) has been found from
pure Al to Al71.2Zn28.8 whereas fcc-Al2(grey) phase has a solubility range from
Al52.4Zn47.6 to Al39.7Zn63.3. The solubility of Zn in Al has been measured to be 7.7 at% Zn
at 350oC.
48
(e)
Figure 4.1: (a), (b) and (c) The back-scattered electron image of SSDC-1 annealed at 350oC for 5 weeks showing all the phases, (d) magnified view of the end member
ternary alloy (e) compositional profile of the line scan of Figure 4.1 (b).
49
SSDC-1 has given the information about the phases that can form in the lower Ca-content
region of the Al-Ca-Zn system. However, the results from SSDC-1 are not adequate
enough to completely understand the solid solubility information and phase relations in
this lower Ca-content region. In order to verify the phase boundary between Al4Ca and
IM2, solid-solid diffusion couple SSDC-2 with Al66.3Ca26.9Zn6.8 ternary alloy and pure Zn
as end members has been prepared. Back-scattered electron images of the solid-solid
diffusion couple SSDC-2 with increased magnification of the area of interest are
illustrated in Figure 4.2. The presence of the new ternary compound (IM1) has been
confirmed from this diffusion couple. The sequence of the phases along the diffusion path
(from left to right according to Figure 4.2) is: Al2Ca+Al4Ca→IM2→IM1 + fcc-Al1
(black) → IM1+ fcc-Al1 (black)+ fcc-Al2 (grey)→ IM1+ fcc-Al2 (grey)+ CaZn13 → Zn.
A 45µm long EPMA line scan has been carried out to find the homogeneity ranges of
Al4Ca, IM1, IM2 and CaZn13 phases, as demonstrated in Figure 4.2(b) and 4.2(d). The
solubility ranges has been calculated at the boundary between two phases using a least
square approximation method. On the basis of EPMA line scan, the phase boundary
between Al4Ca and IM2 has been well studied. Al4Ca is a substitutional solid solution
where Al atoms are gradually replaced by Zn atoms and the maximum solubility of Zn
has been determined to be Al65.2Ca20.1Zn13.9 at 350oCat the boundary with IM2. The solid
solubility limit of IM2 has been identified with the composition Al56.0Ca20.6Zn23.3 at the
interface between Al4Ca and IM2, which also verifies the result of SSDC-1. This finding
contradicts the data of Pani et al. [94] who reported a continuous solid solution Ca(Zn1-
xAlx)4 (x=0.47-1.00 at 550oC). However, it is possible that the continuous solid solution
at 550oC decomposes before reaching 350oC to Al4Ca and Al2CaZn2 phases suggesting
50
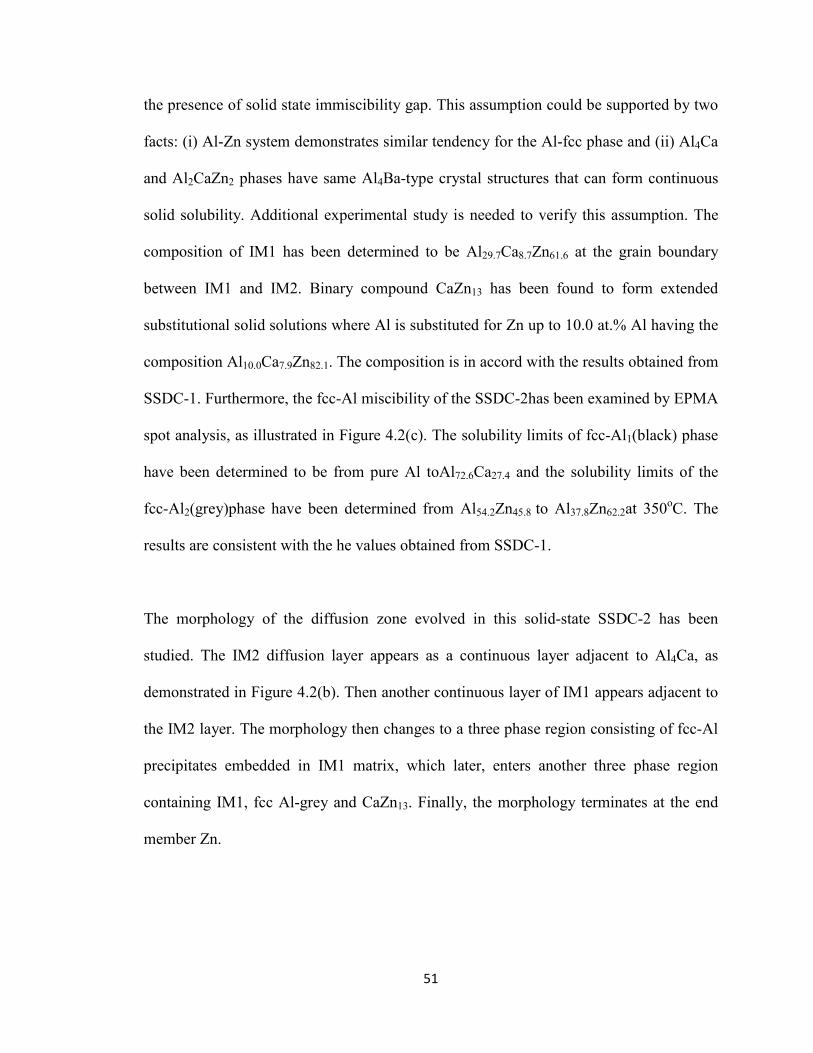
the presence of solid state immiscibility gap. This assumption could be supported by two
facts: (i) Al-Zn system demonstrates similar tendency for the Al-fcc phase and (ii) Al4Ca
and Al2CaZn2 phases have same Al4Ba-type crystal structures that can form continuous
solid solubility. Additional experimental study is needed to verify this assumption. The
composition of IM1 has been determined to be Al29.7Ca8.7Zn61.6 at the grain boundary
between IM1 and IM2. Binary compound CaZn13 has been found to form extended
substitutional solid solutions where Al is substituted for Zn up to 10.0 at.% Al having the
composition Al10.0Ca7.9Zn82.1. The composition is in accord with the results obtained from
SSDC-1. Furthermore, the fcc-Al miscibility of the SSDC-2has been examined by EPMA
spot analysis, as illustrated in Figure 4.2(c). The solubility limits of fcc-Al1(black) phase
have been determined to be from pure Al toAl72.6Ca27.4 and the solubility limits of the
fcc-Al2(grey)phase have been determined from Al54.2Zn45.8 to Al37.8Zn62.2at 350oC. The
results are consistent with the he values obtained from SSDC-1.
The morphology of the diffusion zone evolved in this solid-state SSDC-2 has been
studied. The IM2 diffusion layer appears as a continuous layer adjacent to Al4Ca, as
demonstrated in Figure 4.2(b). Then another continuous layer of IM1 appears adjacent to
the IM2 layer. The morphology then changes to a three phase region consisting of fcc-Al
precipitates embedded in IM1 matrix, which later, enters another three phase region
containing IM1, fcc Al-grey and CaZn13. Finally, the morphology terminates at the end
member Zn.
51
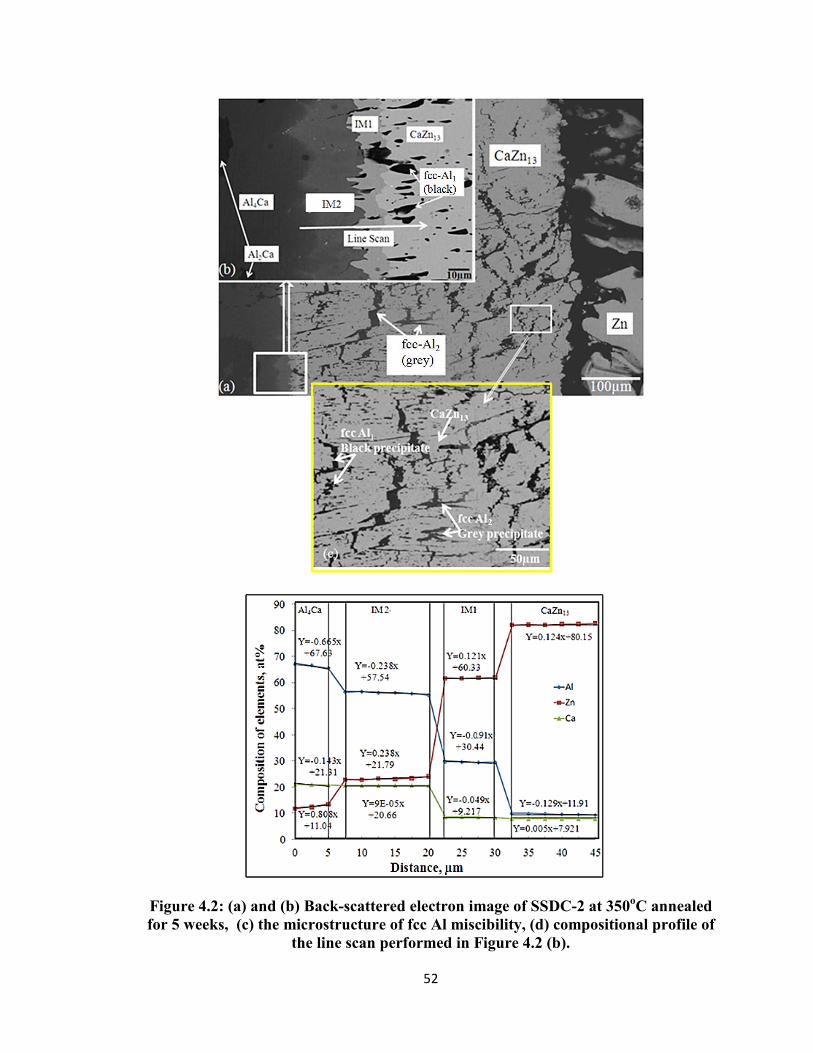
Figure 4.2: (a) and (b) Back-scattered electron image of SSDC-2 at 350oC annealed for 5 weeks, (c) the microstructure of fcc Al miscibility, (d) compositional profile of
the line scan performed in Figure 4.2 (b).
52
Combining the results from SSDC-1 and SSDC-2, a large amount of phase equilibrium
information has been obtained from 0 to 30 at.% Ca of the Al-Ca-Zn phase diagram. A
partial isothermal section at 350ºC of the Al-Ca-Zn system has been constructed and the
phase relations are demonstrated in Figure 4.3. The existence of the ternary substitutional
solid solution IM1 has been confirmed in these two diffusion couples. Based on the
EPMA analysis the solubility ranges for this compound has been determined with the
compositions Al29.4Ca8.4Zn62.2to Al26.7Ca8.4Zn64.9. The solid solubility limit of IM2 has
been identified with the composition Al56.0Ca20.6Zn23.4 at the Al-rich region. Al4Ca is an
extensive binary substitutional solid solution and the maximum solubility has been
determined with the composition Al64.36Ca20.56Zn15.08. CaZn13phase has been found to
form extended substitutional solid solution where Al atom replaces approximately 10.0
at.% of Zn.
Figure 4.3: Partial isothermal section of the Al-Ca-Zn system from 0 to 30 at.% Ca at 350ºC obtained from SSDC-1 and SSDC-2.
The solid-solid diffusion couple SSDC-3 has been prepared with the terminal
compositions Al40Ca40Zn20 and pure Zn. Back-scattered electron images of SSDC-3 with
increased magnification showing the formation of eight different intermetallics are
53
illustrated in Figure 4.4. Four ternary compounds have been found in the diffusion couple:
IM2, IM3, IM4 and IM5. IM2 is a ternary solid solution with Al4-xCaZnx (1.2≤x≤2 at
350oC) formula. IM3 is a ternary compound with Al3-xCaZx (2≤x≤2.2 at 350oC) formula.
IM4 is a C36-type ternary solid solution with Al2-xCaZnx (0.28≤x≤0.7 at 350oC) formula.
On the other hand, IM5 is a high Ca-content ternary compound with Al2Ca9Zn3 formula.
The binary compounds: CaZn2, CaZn5, CaZn11 and CaZn13 have extended solid solubility
in the ternary. The following three phase triangulations are identified from Figure 4.4:
IM2, CaZn11 and CaZn13; IM2, CaZn5 and CaZn11; IM2, IM3 and CaZn5; IM2, IM3 and
IM4. From SSDC-3, the homogeneity ranges of several compounds have been studied.
The limit of IM2 solid solution has been found with the composition Al40.5Ca20.3Zn39.2 in
Zn-rich side. The maximum solubility of IM4 has been determined to be at the
composition Al57.4Ca33.3Zn9.3 in the Al-rich side and Al43.5Ca33Zn23.5 in the Zn-rich side.
Two new ternary compounds have been found from this diffusion couple by EPMA point
analysis: Al20Ca25Zn55 (IM3) and Al14.3Ca63.2Zn22.5 (IM5). To determine the homogeneity
range of IM3, several key alloys have been analyzed and will be further discussed in the
key alloys analysis section. IM5 ternary compound has been found with the composition
Al14.3Ca63.2Zn22.5. Therefore, the chemical formula of IM5 has been derived as
Al2Ca9Zn3.Among the binary compounds, CaZn2 has a wide range of solubility starting
from 31 at.% Al with the compositionAl31Ca33Zn36. The result is in good agreement with
the values reported by [94, 95]. CaZn5 has a solid solution with 11.3 at% Al and the
composition is Al11.3Ca17.1Zn71.6. CaZn11 has a solubility of 1.7 at% Al with the
composition Al1.7Ca8.8Zn89.5. One new eutectic has been found with the composition
Al16.4Ca12.7Zn70.8 in the Zn-rich zone.
54
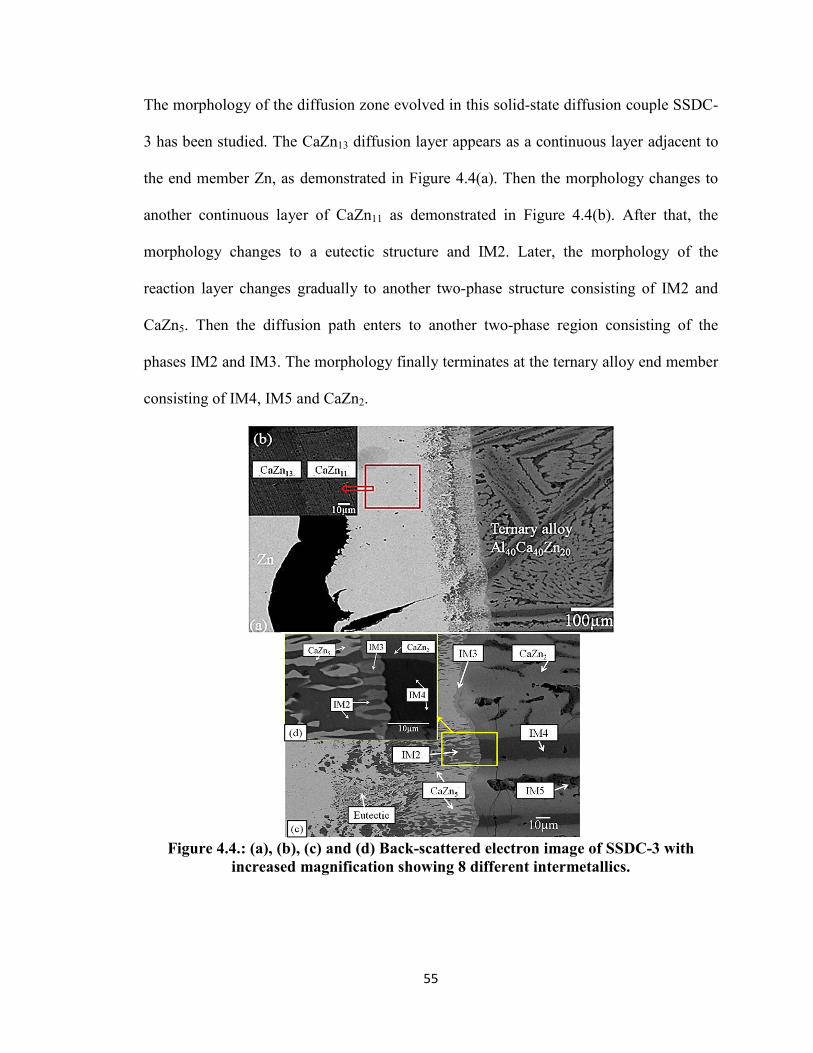
The morphology of the diffusion zone evolved in this solid-state diffusion couple SSDC-
3 has been studied. The CaZn13 diffusion layer appears as a continuous layer adjacent to
the end member Zn, as demonstrated in Figure 4.4(a). Then the morphology changes to
another continuous layer of CaZn11 as demonstrated in Figure 4.4(b). After that, the
morphology changes to a eutectic structure and IM2. Later, the morphology of the
reaction layer changes gradually to another two-phase structure consisting of IM2 and
CaZn5. Then the diffusion path enters to another two-phase region consisting of the
phases IM2 and IM3. The morphology finally terminates at the ternary alloy end member
consisting of IM4, IM5 and CaZn2.
Figure 4.4.: (a), (b), (c) and (d) Back-scattered electron image of SSDC-3 with
increased magnification showing 8 different intermetallics.
55
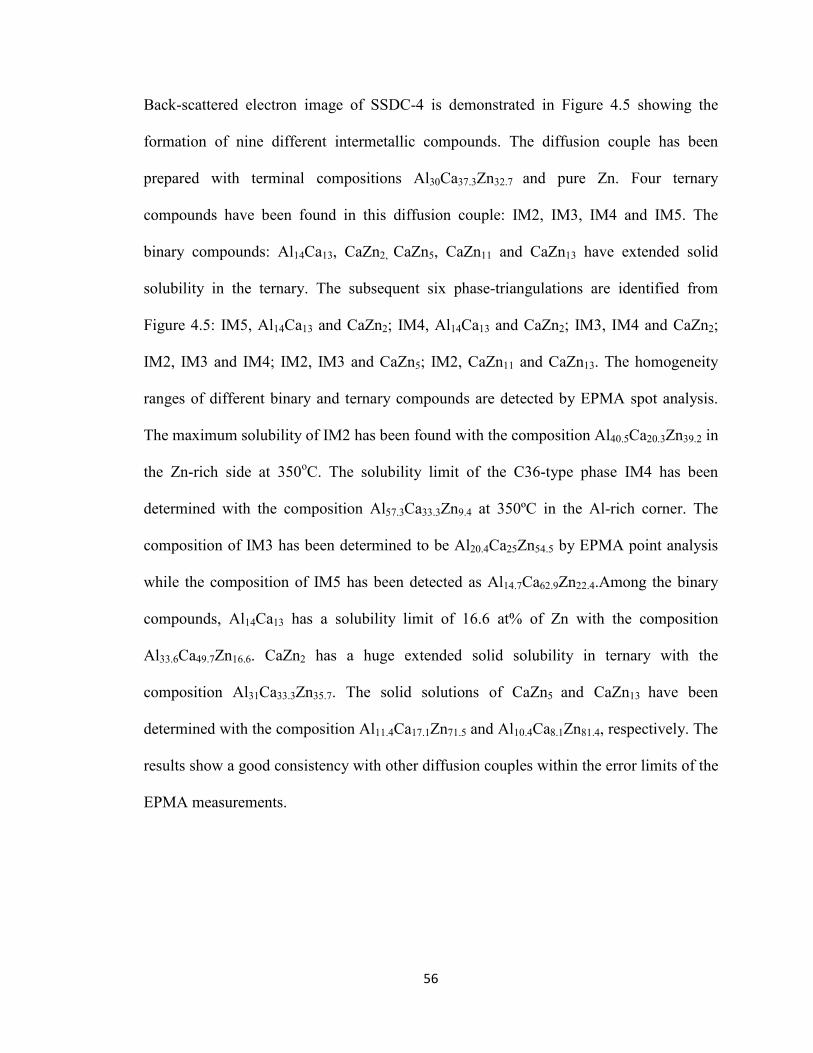
Back-scattered electron image of SSDC-4 is demonstrated in Figure 4.5 showing the
formation of nine different intermetallic compounds. The diffusion couple has been
prepared with terminal compositions Al30Ca37.3Zn32.7 and pure Zn. Four ternary
compounds have been found in this diffusion couple: IM2, IM3, IM4 and IM5. The
binary compounds: Al14Ca13, CaZn2, CaZn5, CaZn11 and CaZn13 have extended solid
solubility in the ternary. The subsequent six phase-triangulations are identified from
Figure 4.5: IM5, Al14Ca13 and CaZn2; IM4, Al14Ca13 and CaZn2; IM3, IM4 and CaZn2;
IM2, IM3 and IM4; IM2, IM3 and CaZn5; IM2, CaZn11 and CaZn13. The homogeneity
ranges of different binary and ternary compounds are detected by EPMA spot analysis.
The maximum solubility of IM2 has been found with the composition Al40.5Ca20.3Zn39.2 in
the Zn-rich side at 350oC. The solubility limit of the C36-type phase IM4 has been
determined with the composition Al57.3Ca33.3Zn9.4 at 350ºC in the Al-rich corner. The
composition of IM3 has been determined to be Al20.4Ca25Zn54.5 by EPMA point analysis
while the composition of IM5 has been detected as Al14.7Ca62.9Zn22.4.Among the binary
compounds, Al14Ca13 has a solubility limit of 16.6 at% of Zn with the composition
Al33.6Ca49.7Zn16.6. CaZn2 has a huge extended solid solubility in ternary with the
composition Al31Ca33.3Zn35.7. The solid solutions of CaZn5 and CaZn13 have been
determined with the composition Al11.4Ca17.1Zn71.5 and Al10.4Ca8.1Zn81.4, respectively. The
results show a good consistency with other diffusion couples within the error limits of the
EPMA measurements.
56
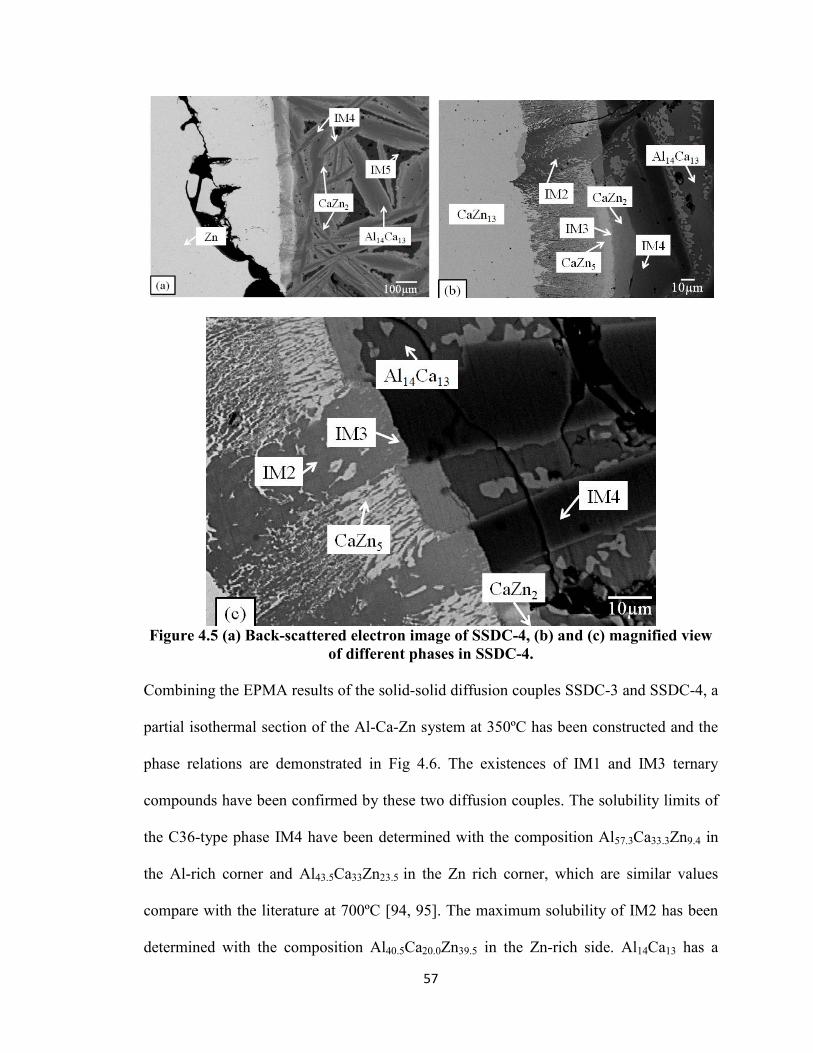
Figure 4.5 (a) Back-scattered electron image of SSDC-4, (b) and (c) magnified view
of different phases in SSDC-4.
Combining the EPMA results of the solid-solid diffusion couples SSDC-3 and SSDC-4, a
partial isothermal section of the Al-Ca-Zn system at 350ºC has been constructed and the
phase relations are demonstrated in Fig 4.6. The existences of IM1 and IM3 ternary
compounds have been confirmed by these two diffusion couples. The solubility limits of
the C36-type phase IM4 have been determined with the composition Al57.3Ca33.3Zn9.4 in
the Al-rich corner and Al43.5Ca33Zn23.5 in the Zn rich corner, which are similar values
compare with the literature at 700ºC [94, 95]. The maximum solubility of IM2 has been
determined with the composition Al40.5Ca20.0Zn39.5 in the Zn-rich side. Al14Ca13 has a
57
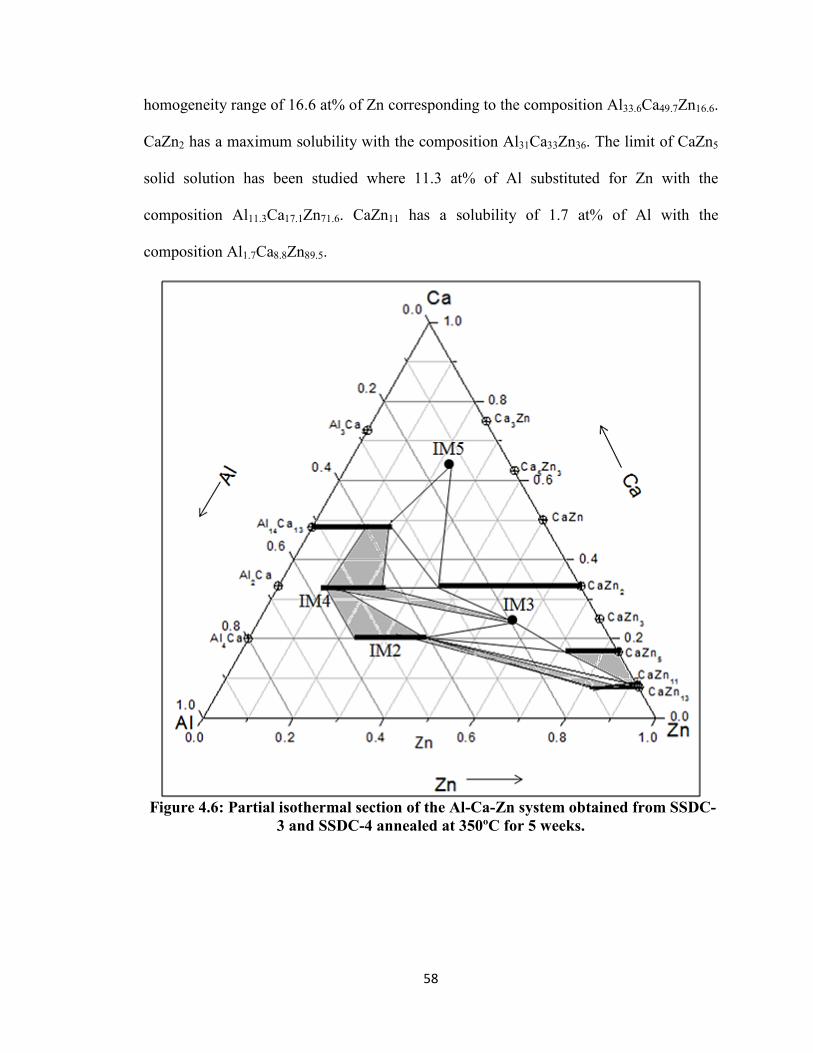
homogeneity range of 16.6 at% of Zn corresponding to the composition Al33.6Ca49.7Zn16.6.
CaZn2 has a maximum solubility with the composition Al31Ca33Zn36. The limit of CaZn5
solid solution has been studied where 11.3 at% of Al substituted for Zn with the
composition Al11.3Ca17.1Zn71.6. CaZn11 has a solubility of 1.7 at% of Al with the
composition Al1.7Ca8.8Zn89.5.
Figure 4.6: Partial isothermal section of the Al-Ca-Zn system obtained from SSDC-
3 and SSDC-4 annealed at 350ºC for 5 weeks.
58
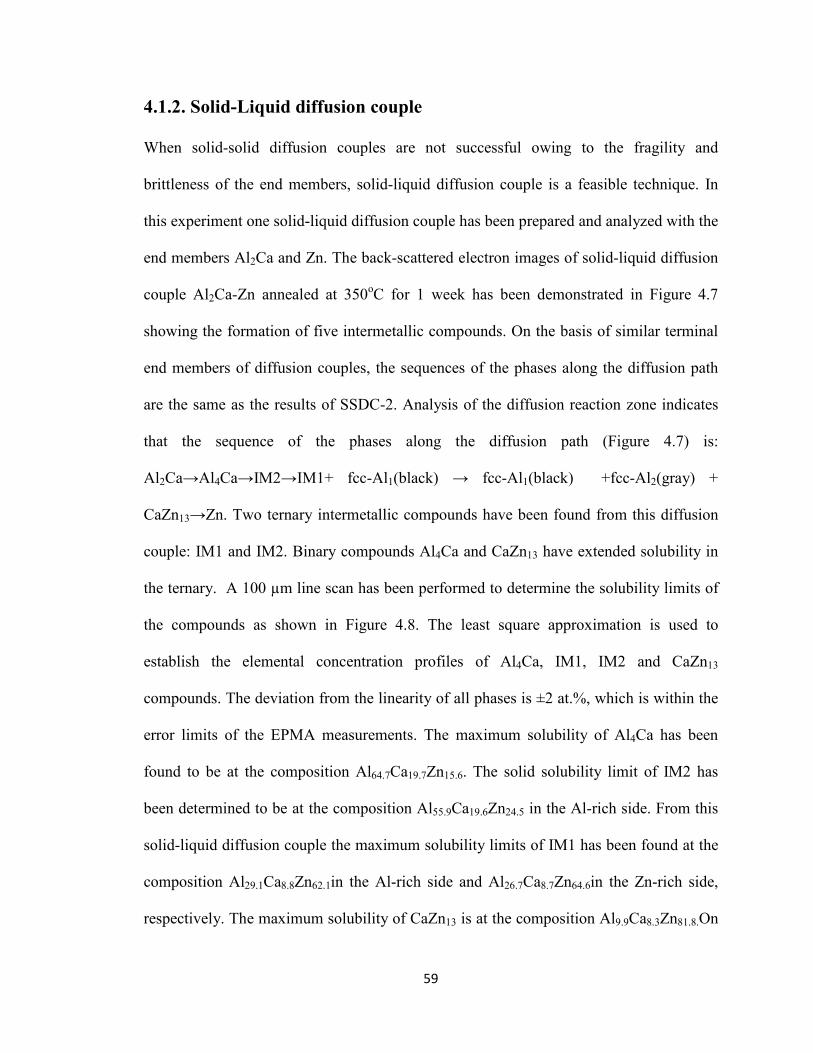
4.1.2. Solid-Liquid diffusion couple
When solid-solid diffusion couples are not successful owing to the fragility and
brittleness of the end members, solid-liquid diffusion couple is a feasible technique. In
this experiment one solid-liquid diffusion couple has been prepared and analyzed with the
end members Al2Ca and Zn. The back-scattered electron images of solid-liquid diffusion
couple Al2Ca-Zn annealed at 350oC for 1 week has been demonstrated in Figure 4.7
showing the formation of five intermetallic compounds. On the basis of similar terminal
end members of diffusion couples, the sequences of the phases along the diffusion path
are the same as the results of SSDC-2. Analysis of the diffusion reaction zone indicates
that the sequence of the phases along the diffusion path (Figure 4.7) is:
Al2Ca→Al4Ca→IM2→IM1+ fcc-Al1(black) → fcc-Al1(black) +fcc-Al2(gray) +
CaZn13→Zn. Two ternary intermetallic compounds have been found from this diffusion
couple: IM1 and IM2. Binary compounds Al4Ca and CaZn13 have extended solubility in
the ternary. A 100 µm line scan has been performed to determine the solubility limits of
the compounds as shown in Figure 4.8. The least square approximation is used to
establish the elemental concentration profiles of Al4Ca, IM1, IM2 and CaZn13
compounds. The deviation from the linearity of all phases is ±2 at.%, which is within the
error limits of the EPMA measurements. The maximum solubility of Al4Ca has been
found to be at the composition Al64.7Ca19.7Zn15.6. The solid solubility limit of IM2 has
been determined to be at the composition Al55.9Ca19.6Zn24.5 in the Al-rich side. From this
solid-liquid diffusion couple the maximum solubility limits of IM1 has been found at the
composition Al29.1Ca8.8Zn62.1in the Al-rich side and Al26.7Ca8.7Zn64.6in the Zn-rich side,
respectively. The maximum solubility of CaZn13 is at the composition Al9.9Ca8.3Zn81.8.On
59
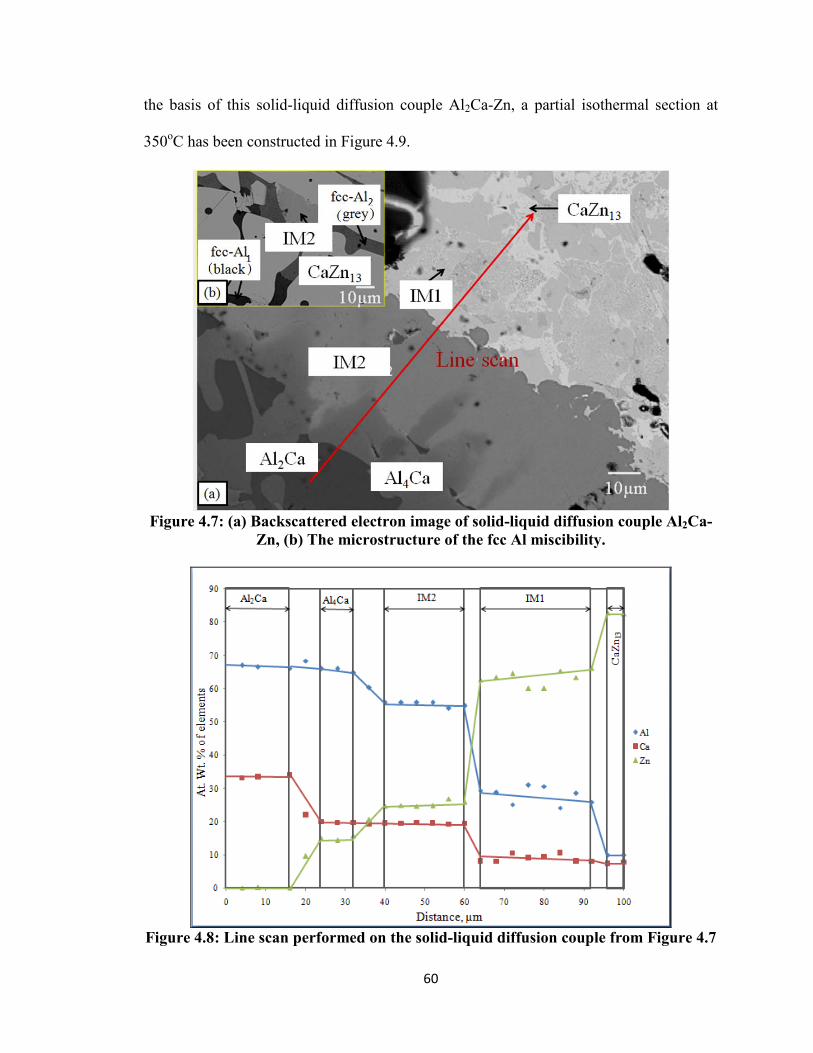
the basis of this solid-liquid diffusion couple Al2Ca-Zn, a partial isothermal section at
350oC has been constructed in Figure 4.9.
Figure 4.7: (a) Backscattered electron image of solid-liquid diffusion couple Al2Ca-
Zn, (b) The microstructure of the fcc Al miscibility.
Figure 4.8: Line scan performed on the solid-liquid diffusion couple from Figure 4.7
60
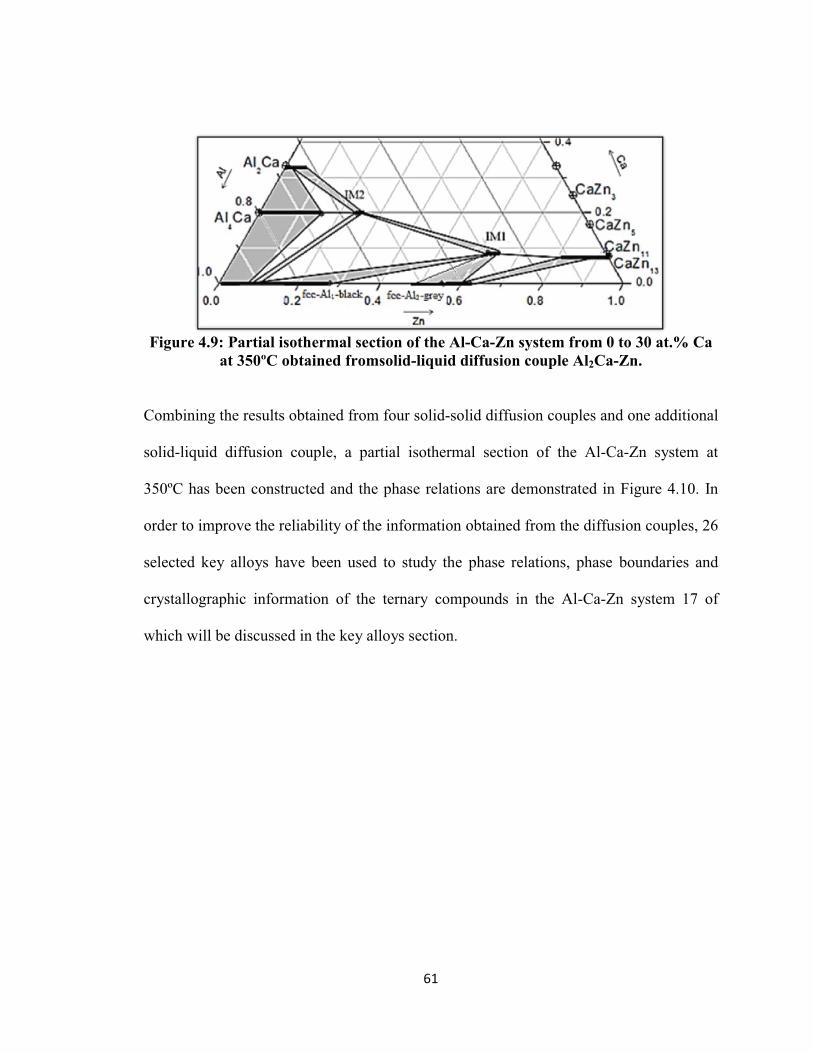
61
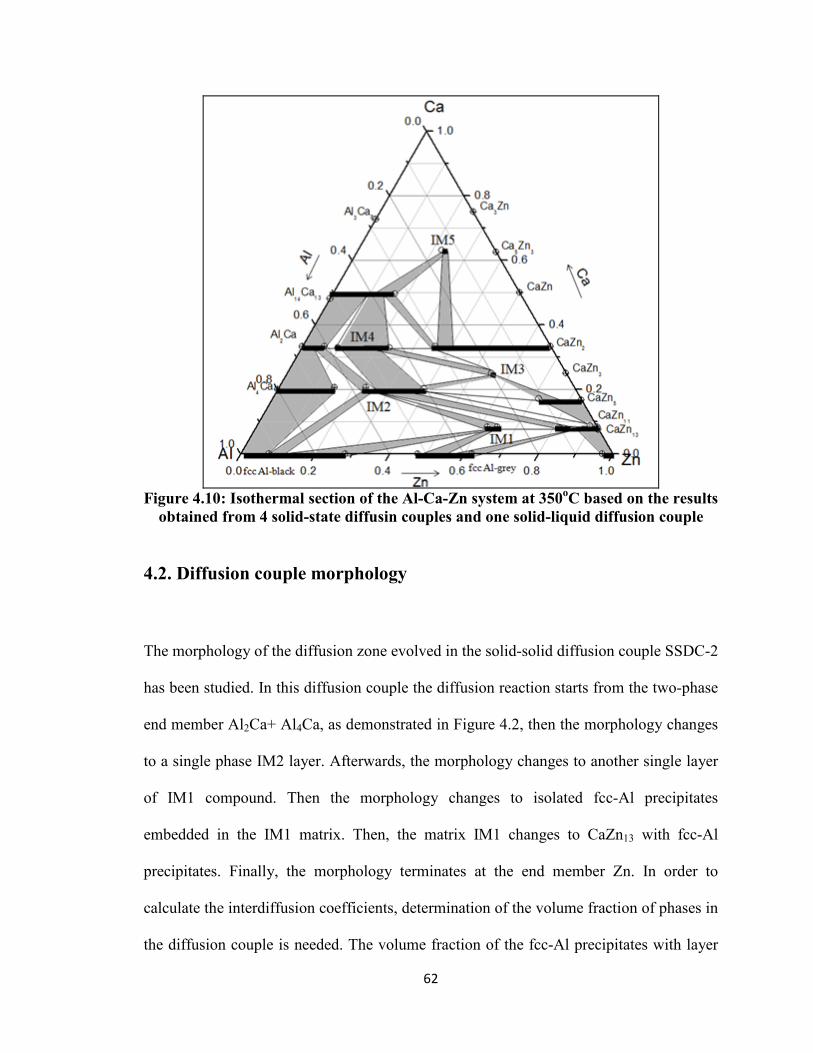
Figure 4.10: Isothermal section of the Al-Ca-Zn system at 350oC based on the results
obtained from 4 solid-state diffusin couples and one solid-liquid diffusion couple
4.2. Diffusion couple morphology
The morphology of the diffusion zone evolved in the solid-solid diffusion couple SSDC-2
has been studied. In this diffusion couple the diffusion reaction starts from the two-phase
end member Al2Ca+ Al4Ca, as demonstrated in Figure 4.2, then the morphology changes
to a single phase IM2 layer. Afterwards, the morphology changes to another single layer
of IM1 compound. Then the morphology changes to isolated fcc-Al precipitates
embedded in the IM1 matrix. Then, the matrix IM1 changes to CaZn13 with fcc-Al
precipitates. Finally, the morphology terminates at the end member Zn. In order to
calculate the interdiffusion coefficients, determination of the volume fraction of phases in
the diffusion couple is needed. The volume fraction of the fcc-Al precipitates with layer
62
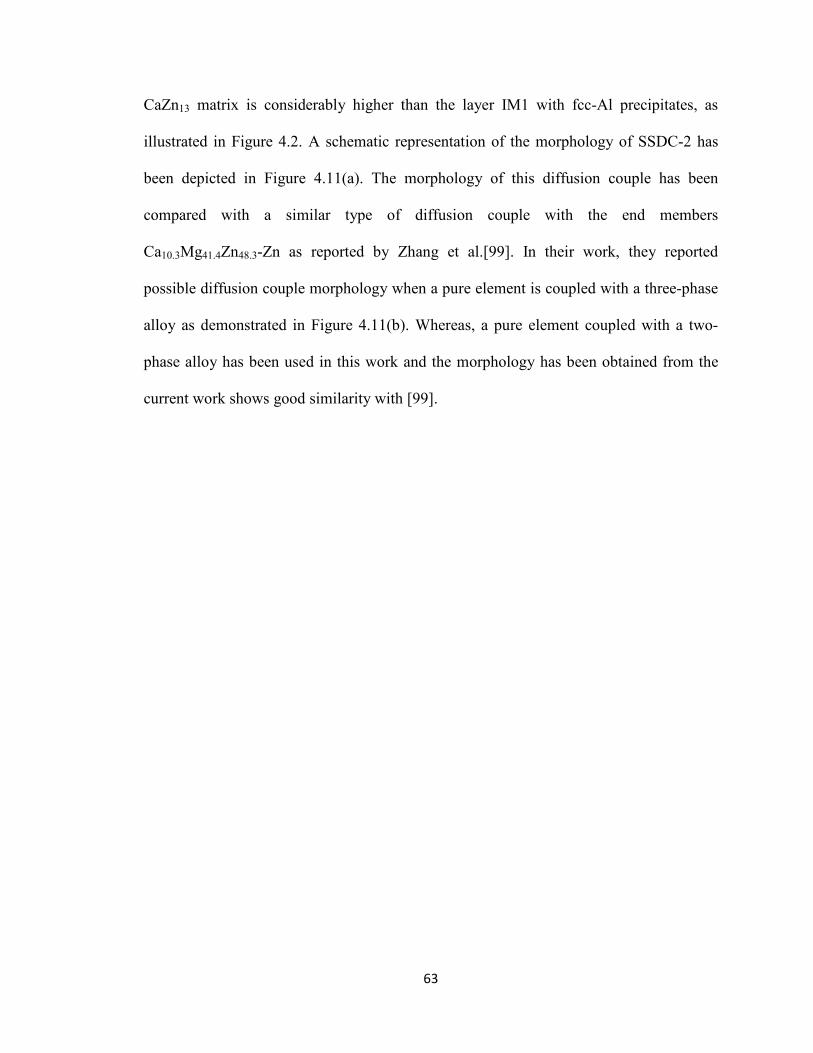
CaZn13 matrix is considerably higher than the layer IM1 with fcc-Al precipitates, as
illustrated in Figure 4.2. A schematic representation of the morphology of SSDC-2 has
been depicted in Figure 4.11(a). The morphology of this diffusion couple has been
compared with a similar type of diffusion couple with the end members
Ca10.3Mg41.4Zn48.3-Zn as reported by Zhang et al.[99]. In their work, they reported
possible diffusion couple morphology when a pure element is coupled with a three-phase
alloy as demonstrated in Figure 4.11(b). Whereas, a pure element coupled with a two-
phase alloy has been used in this work and the morphology has been obtained from the
current work shows good similarity with [99].
63
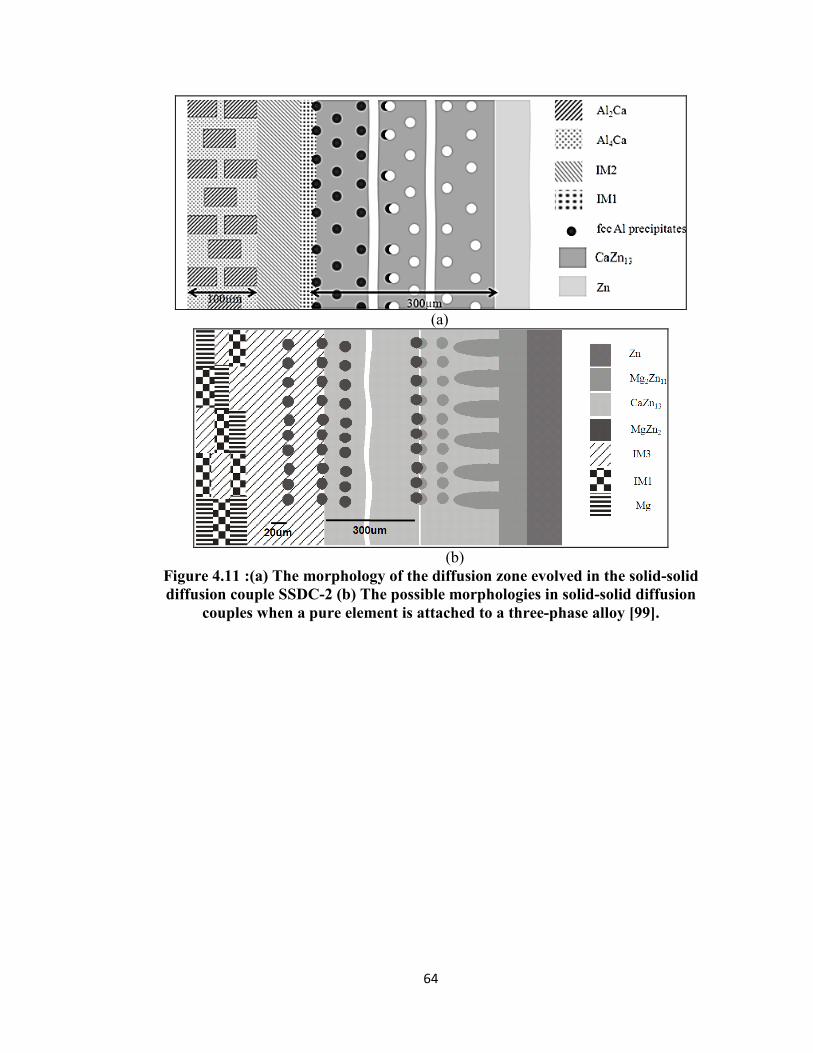
(a)
(b)
Figure 4.11 :(a) The morphology of the diffusion zone evolved in the solid-solid diffusion couple SSDC-2 (b) The possible morphologies in solid-solid diffusion
couples when a pure element is attached to a three-phase alloy [99].
64
In the solid-solid diffusion couple SSDC-3, CaZn11 and CaZn13 phases are the dominant
reaction products, as the microstructure in Figure 4.4 exemplifies. Another morphology
of the diffusion zone evolved in this diffusion couple is the ‘tooth-like’ structure, as can
be seen clearly in Figure 4.4. This ‘tooth-like’ morphology has first been demonstrated in
the work of Zhang et al.[99]. The morphology of SSDC-3 is rather complex compared to
SSDC-1 and SSCDC-2. To understand such complex morphology, the diffusion couple
can be divided into several sub-diffusion couples. In the present work, the morphology of
the diffusion couple has been studied by considering two micro-diffusion couples; IM4
with CaZn11 and CaZn2 with CaZn11 as demonstrated in Figure 4.12(a) and (b)
respectively. Figure 4.12(a) and (b) is combined to understand the morphology of SSDC-
3 as demonstrated in Figure 4.12(c). The diffusion path has followed two different
directions during the interdiffusion between IM4 and CaZn11 phase as shown by
rectangular box 1 and 2 in Figure 4.12(a). For diffusion path-1 the products of
interdiffusion between IM4 and (CaZn11) are IM2 and (CaZn5) whereas for diffusion
path-3 the products of interdiffusion are IM2, IM3 and (CaZn5). On the other hand, IM2,
IM3 and (CaZn5) are produced as a result of interdiffusion between (CaZn2) with
(CaZn11) as illustrated in Figure 4.12(b).
65
(a)
(b)
(c)
Figure 4.12: (a) Morphology of the micro-diffusion couple IM4-CaZn11: the tooth-like morphology and (b) The CaZn2-CaZn11 micro-diffusion couple (c) The tooth-
like morphology in SSDC-3
66
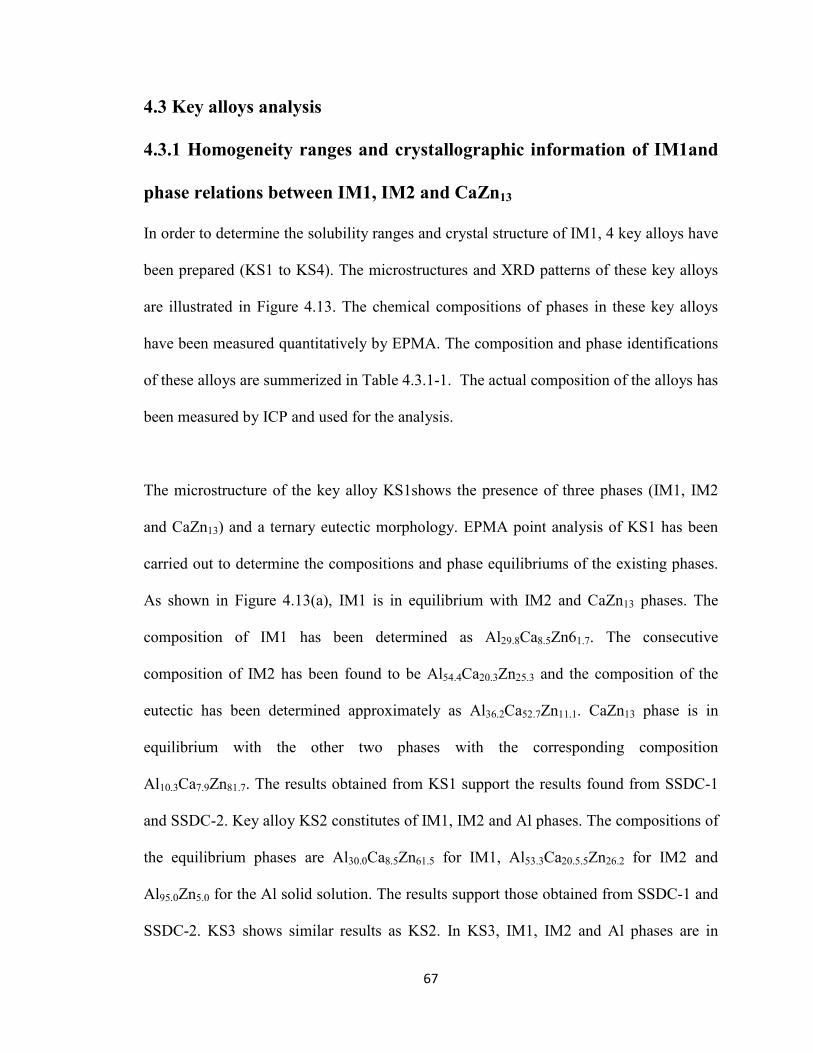
4.3 Key alloys analysis
4.3.1 Homogeneity ranges and crystallographic information of IM1and
phase relations between IM1, IM2 and CaZn13
In order to determine the solubility ranges and crystal structure of IM1, 4 key alloys have
been prepared (KS1 to KS4). The microstructures and XRD patterns of these key alloys
are illustrated in Figure 4.13. The chemical compositions of phases in these key alloys
have been measured quantitatively by EPMA. The composition and phase identifications
of these alloys are summerized in Table 4.3.1-1. The actual composition of the alloys has
been measured by ICP and used for the analysis.
The microstructure of the key alloy KS1shows the presence of three phases (IM1, IM2
and CaZn13) and a ternary eutectic morphology. EPMA point analysis of KS1 has been
carried out to determine the compositions and phase equilibriums of the existing phases.
As shown in Figure 4.13(a), IM1 is in equilibrium with IM2 and CaZn13 phases. The
composition of IM1 has been determined as Al29.8Ca8.5Zn61.7. The consecutive
composition of IM2 has been found to be Al54.4Ca20.3Zn25.3 and the composition of the
eutectic has been determined approximately as Al36.2Ca52.7Zn11.1. CaZn13 phase is in
equilibrium with the other two phases with the corresponding composition
Al10.3Ca7.9Zn81.7. The results obtained from KS1 support the results found from SSDC-1
and SSDC-2. Key alloy KS2 constitutes of IM1, IM2 and Al phases. The compositions of
the equilibrium phases are Al30.0Ca8.5Zn61.5 for IM1, Al53.3Ca20.5.5Zn26.2 for IM2 and
Al95.0Zn5.0 for the Al solid solution. The results support those obtained from SSDC-1 and
SSDC-2. KS3 shows similar results as KS2. In KS3, IM1, IM2 and Al phases are in
67
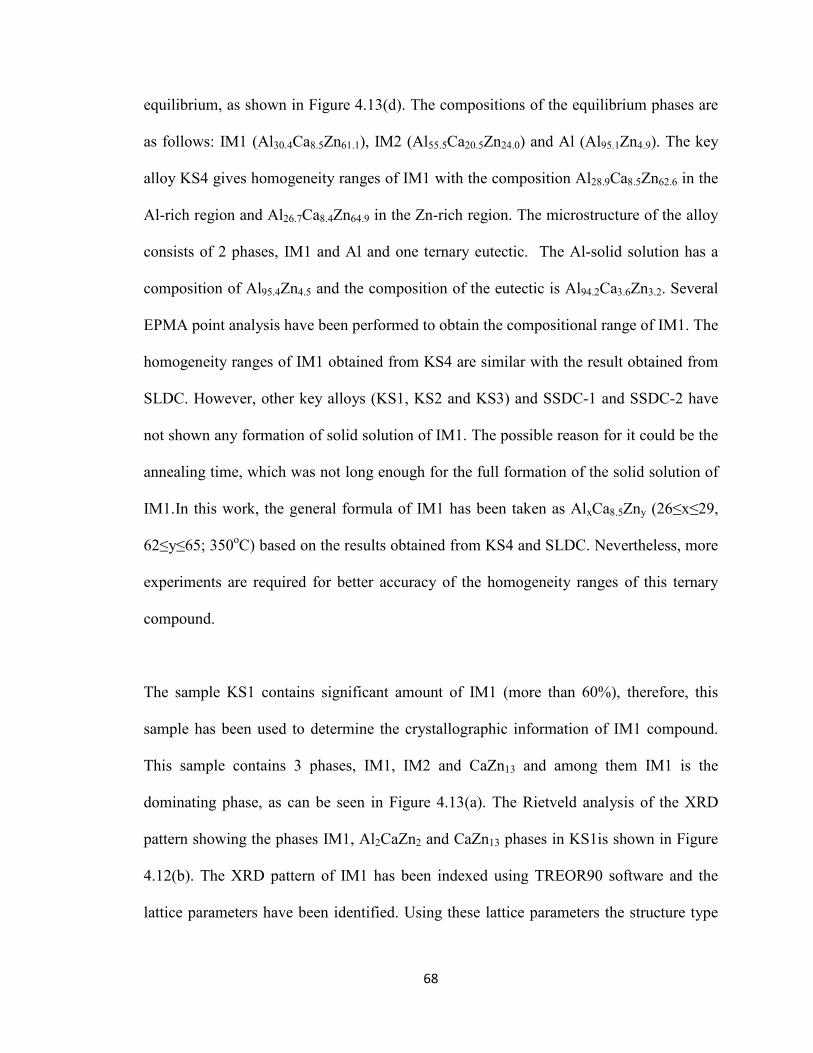
equilibrium, as shown in Figure 4.13(d). The compositions of the equilibrium phases are
as follows: IM1 (Al30.4Ca8.5Zn61.1), IM2 (Al55.5Ca20.5Zn24.0) and Al (Al95.1Zn4.9). The key
alloy KS4 gives homogeneity ranges of IM1 with the composition Al28.9Ca8.5Zn62.6 in the
Al-rich region and Al26.7Ca8.4Zn64.9 in the Zn-rich region. The microstructure of the alloy
consists of 2 phases, IM1 and Al and one ternary eutectic. The Al-solid solution has a
composition of Al95.4Zn4.5 and the composition of the eutectic is Al94.2Ca3.6Zn3.2. Several
EPMA point analysis have been performed to obtain the compositional range of IM1. The
homogeneity ranges of IM1 obtained from KS4 are similar with the result obtained from
SLDC. However, other key alloys (KS1, KS2 and KS3) and SSDC-1 and SSDC-2 have
not shown any formation of solid solution of IM1. The possible reason for it could be the
annealing time, which was not long enough for the full formation of the solid solution of
IM1.In this work, the general formula of IM1 has been taken as AlxCa8.5Zny (26≤x≤29,
62≤y≤65; 350oC) based on the results obtained from KS4 and SLDC. Nevertheless, more
experiments are required for better accuracy of the homogeneity ranges of this ternary
compound.
The sample KS1 contains significant amount of IM1 (more than 60%), therefore, this
sample has been used to determine the crystallographic information of IM1 compound.
This sample contains 3 phases, IM1, IM2 and CaZn13 and among them IM1 is the
dominating phase, as can be seen in Figure 4.13(a). The Rietveld analysis of the XRD
pattern showing the phases IM1, Al2CaZn2 and CaZn13 phases in KS1is shown in Figure
4.12(b). The XRD pattern of IM1 has been indexed using TREOR90 software and the
lattice parameters have been identified. Using these lattice parameters the structure type
68
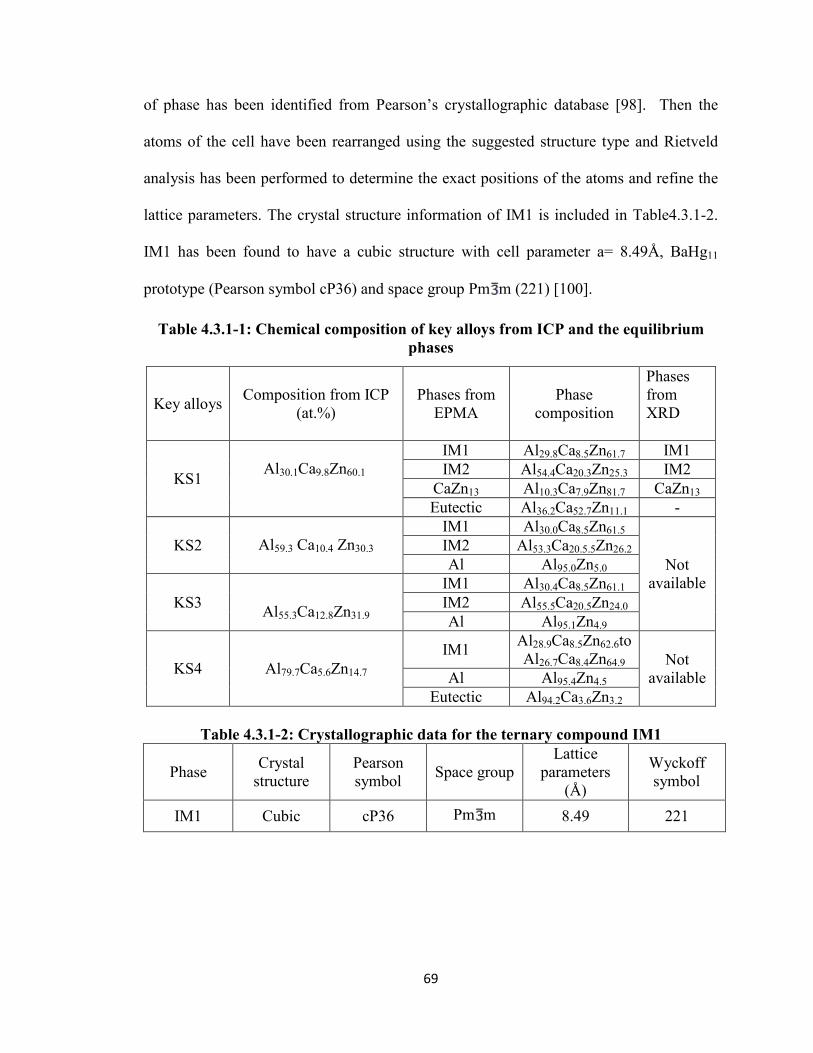
of phase has been identified from Pearson’s crystallographic database [98]. Then the
atoms of the cell have been rearranged using the suggested structure type and Rietveld
analysis has been performed to determine the exact positions of the atoms and refine the
lattice parameters. The crystal structure information of IM1 is included in Table4.3.1-2.
IM1 has been found to have a cubic structure with cell parameter a= 8.49Å, BaHg11
prototype (Pearson symbol cP36) and space group Pm m (221) [100].
Table 4.3.1-1: Chemical composition of key alloys from ICP and the equilibrium phases
Table 4.3.1-2: Crystallographic data for the ternary compound IM1
Phase Crystal structure
Pearson symbol Space group
Lattice parameters
(Å)
Wyckoff symbol
IM1 Cubic cP36 Pm m 8.49 221
Key alloys Composition from ICP (at.%)
Phases from EPMA
Phase composition
Phases from XRD
KS1
Al30.1Ca9.8Zn60.1
IM1 Al29.8Ca8.5Zn61.7 IM1 IM2 Al54.4Ca20.3Zn25.3 IM2
CaZn13 Al10.3Ca7.9Zn81.7 CaZn13 Eutectic Al36.2Ca52.7Zn11.1 -
KS2
Al59.3 Ca10.4 Zn30.3
IM1 Al30.0Ca8.5Zn61.5
Not available
IM2 Al53.3Ca20.5.5Zn26.2 Al Al95.0Zn5.0
KS3 Al55.3Ca12.8Zn31.9
IM1 Al30.4Ca8.5Zn61.1 IM2 Al55.5Ca20.5Zn24.0 Al Al95.1Zn4.9
KS4 Al79.7Ca5.6Zn14.7 IM1 Al28.9Ca8.5Zn62.6to
Al26.7Ca8.4Zn64.9 Not available Al Al95.4Zn4.5
Eutectic Al94.2Ca3.6Zn3.2
69
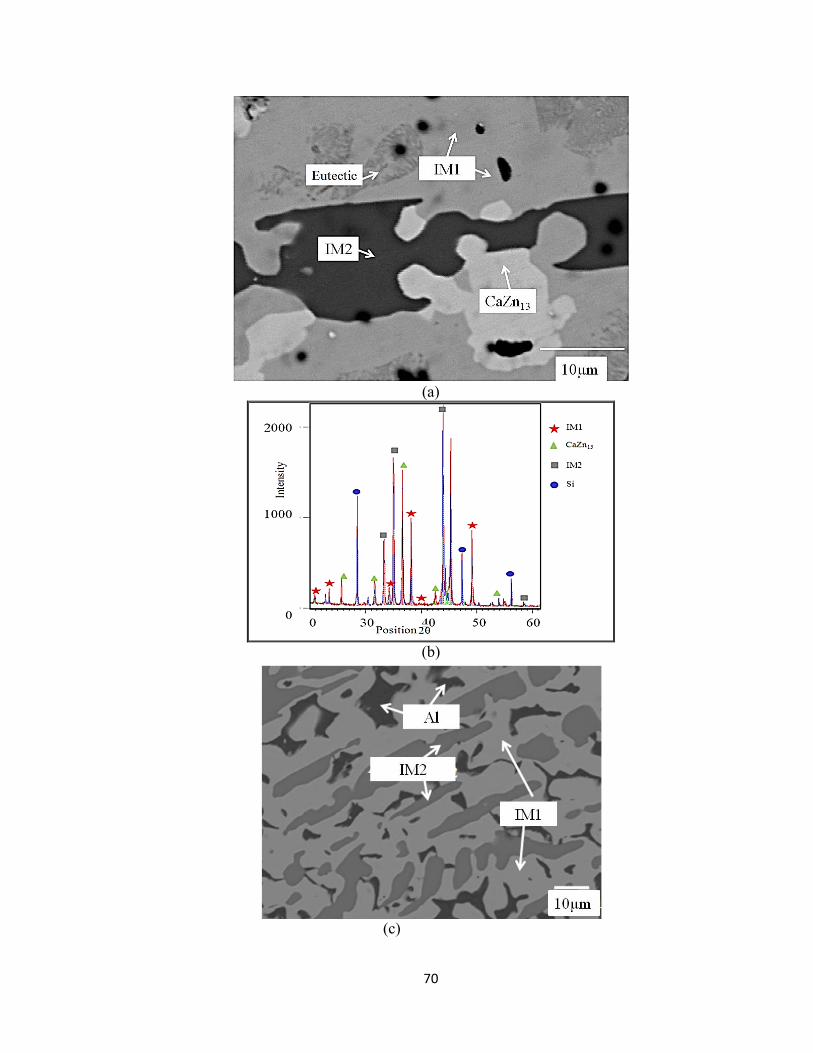
(a)
(b)
(c)
70
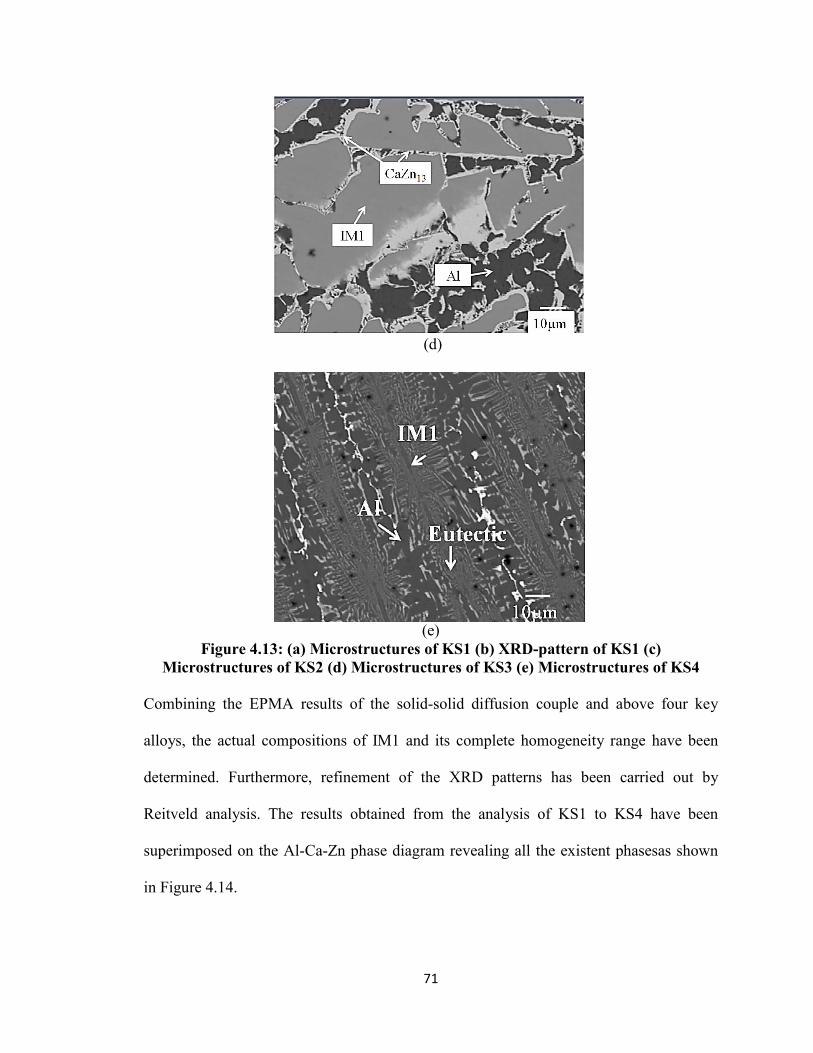
(d)
(e)
Figure 4.13: (a) Microstructures of KS1 (b) XRD-pattern of KS1 (c) Microstructures of KS2 (d) Microstructures of KS3 (e) Microstructures of KS4
Combining the EPMA results of the solid-solid diffusion couple and above four key
alloys, the actual compositions of IM1 and its complete homogeneity range have been
determined. Furthermore, refinement of the XRD patterns has been carried out by
Reitveld analysis. The results obtained from the analysis of KS1 to KS4 have been
superimposed on the Al-Ca-Zn phase diagram revealing all the existent phasesas shown
in Figure 4.14.
71
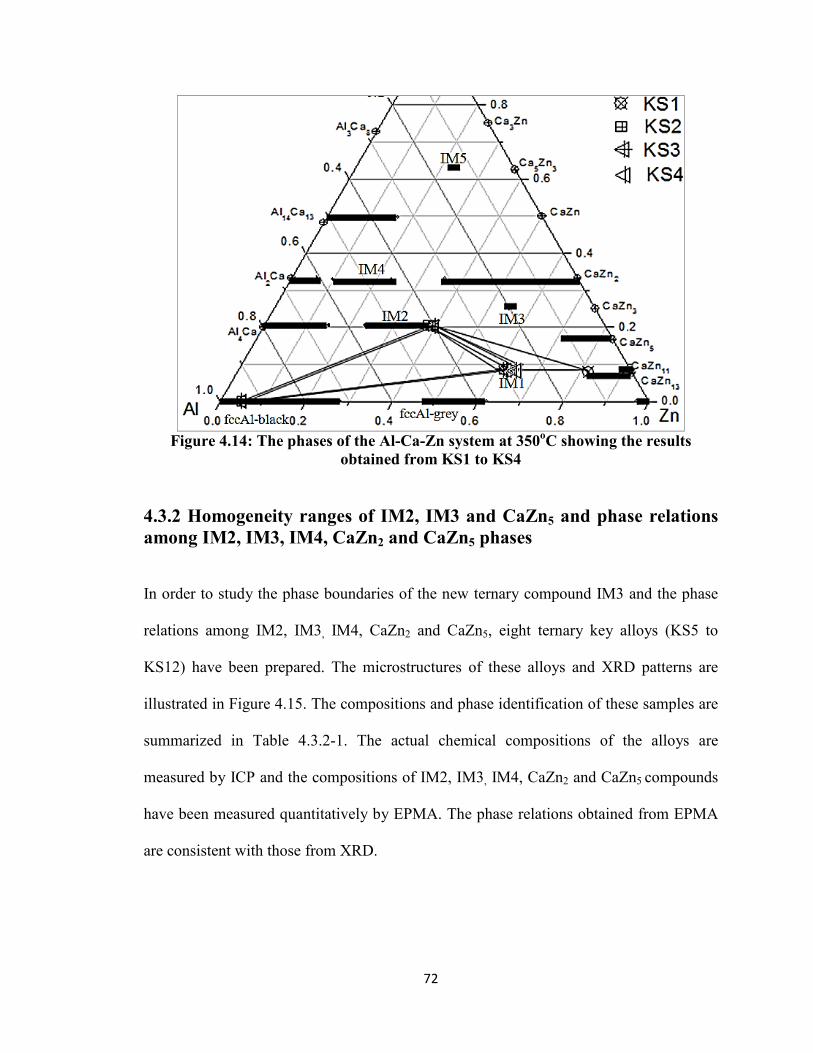
Figure 4.14: The phases of the Al-Ca-Zn system at 350oC showing the results
obtained from KS1 to KS4 4.3.2 Homogeneity ranges of IM2, IM3 and CaZn5 and phase relations among IM2, IM3, IM4, CaZn2 and CaZn5 phases
In order to study the phase boundaries of the new ternary compound IM3 and the phase
relations among IM2, IM3, IM4, CaZn2 and CaZn5, eight ternary key alloys (KS5 to
KS12) have been prepared. The microstructures of these alloys and XRD patterns are
illustrated in Figure 4.15. The compositions and phase identification of these samples are
summarized in Table 4.3.2-1. The actual chemical compositions of the alloys are
measured by ICP and the compositions of IM2, IM3, IM4, CaZn2 and CaZn5 compounds
have been measured quantitatively by EPMA. The phase relations obtained from EPMA
are consistent with those from XRD.
72
Back-scattered electron image of sample KS5 annealed at 350ºC for 6 weeks is presented
in Figure 4.15. The microstructure of KS5 reveals that the sample contains four phases,
which indicates that the sample is not in global equilibrium, which may be due to the
peritectic IM3 compound. CaZn5 compound forms congruently at 691ºC. Then IM3
ternary compound forms peritectically from CaZn5. During solidification, CaZn5 solid
solution precipitates as a primary phase. After heat treatment at 350ºC for 6 weeks,
CaZn5 should transform to IM3 solid solution, but the decomposition process was not
complete. It would take a considerable amount of time for all of the CaZn5 to transfer to
IM3 compound due to the sluggish decomposition process. From this key sample, it is
found that IM3 has 4.5 at.% solubility in the ternary where the limiting compositions of
this solid solution are Al24.6Ca25.1Zn50.3 and Al20.1Ca23.9Zn56.0 respectively.
The solubility of IM2 compound has been determined from KS6, KS7, KS9 and KS10.
The microstructures and xrd patterns of these key alloys are depicted in Figure 4.16, 4.17,
4.18 and 4.19. The maximum solubility of IM2 has been determined with the
approximate composition Al40Ca20Zn40 in the Zn-rich side, which is consistent with the
reuslts obtained from diffusion couples. The maximum solubility of the IM4 phase has
been detected from KS9 with the composition Al43.5Ca33.4Zn23.1,which is similar to the
results obtained from the diffusion couples. Among the binary phases, the maximum
solubility of CaZn5 has been determined from KS6 to be 9.6 at% of Al with the
composition Al9.6Ca17.2Zn73.2. Another binary compound CaZn2 has a solid solubility of
31.1 at% Al with the composition Al31.1Ca33.4Zn35.6, All of the binary compounds
showing extended solid solubility in the ternary show good agreement with the results
73
determined from the diffusion couples. The XRD patterns of KS6 to KS9 are given in
from Figure 4.16 to Figure 4.21. However, inspite of a considerable amount of affort has
been used to prepare an IM3-phase dominent sample, the attempts were not successful
probably due to the peritectic reaction from binary CaZn5 to IM3 compound. From the
experiments, it has been observed that the formation of IM3 phase is quite sluggish and
the annleaing time and temperature was not high enough for thecompletion of the
peritectic reaction. Hence it has been difficult to obtain a sample very richof IM3 phase.
The compositions of the equilibriating phases from KS5 to KS12 are shown is Figure
4.22 along with equiibrium tie lines.
74
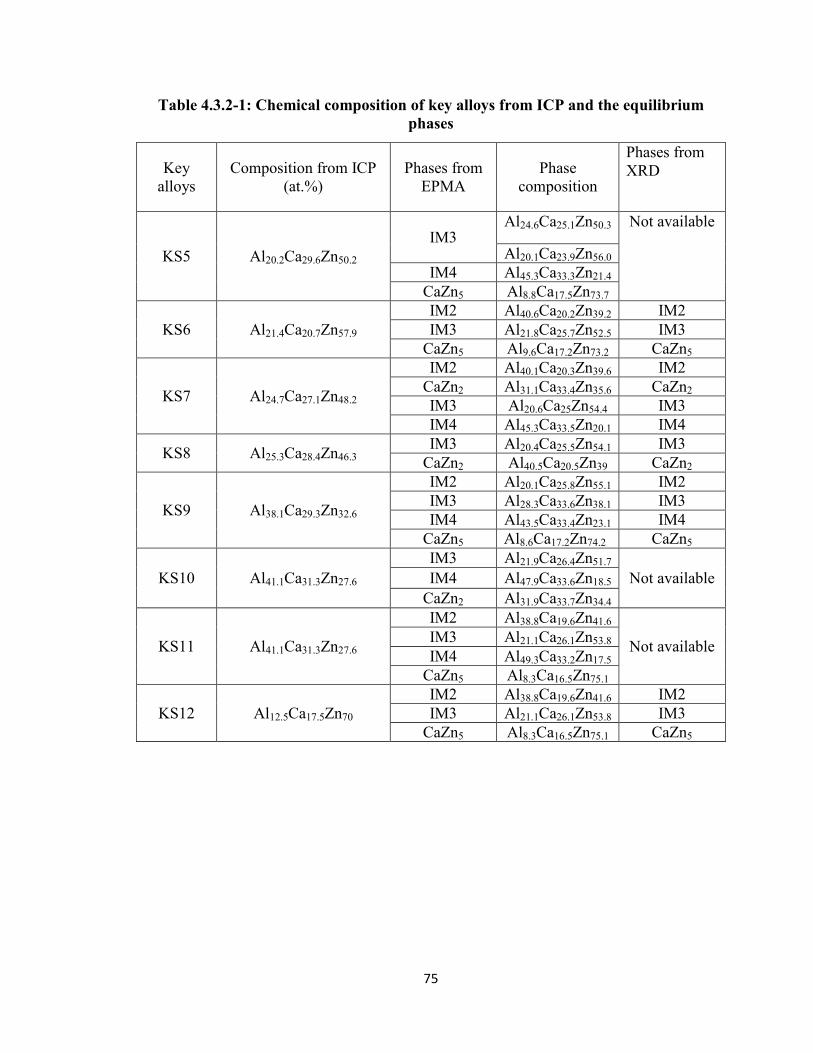
Table 4.3.2-1: Chemical composition of key alloys from ICP and the equilibrium phases
Key alloys
Composition from ICP (at.%)
Phases from EPMA
Phase composition
Phases from XRD
KS5 Al20.2Ca29.6Zn50.2 IM3
Al24.6Ca25.1Zn50.3 Not available
Al20.1Ca23.9Zn56.0 IM4 Al45.3Ca33.3Zn21.4
CaZn5 Al8.8Ca17.5Zn73.7
KS6 Al21.4Ca20.7Zn57.9 IM2 Al40.6Ca20.2Zn39.2 IM2 IM3 Al21.8Ca25.7Zn52.5 IM3
CaZn5 Al9.6Ca17.2Zn73.2 CaZn5
KS7 Al24.7Ca27.1Zn48.2
IM2 Al40.1Ca20.3Zn39.6 IM2 CaZn2 Al31.1Ca33.4Zn35.6 CaZn2 IM3 Al20.6Ca25Zn54.4 IM3 IM4 Al45.3Ca33.5Zn20.1 IM4
KS8 Al25.3Ca28.4Zn46.3 IM3 Al20.4Ca25.5Zn54.1 IM3
CaZn2 Al40.5Ca20.5Zn39 CaZn2
KS9 Al38.1Ca29.3Zn32.6
IM2 Al20.1Ca25.8Zn55.1 IM2 IM3 Al28.3Ca33.6Zn38.1 IM3 IM4 Al43.5Ca33.4Zn23.1 IM4
CaZn5 Al8.6Ca17.2Zn74.2 CaZn5
KS10 Al41.1Ca31.3Zn27.6 IM3 Al21.9Ca26.4Zn51.7
Not available IM4 Al47.9Ca33.6Zn18.5 CaZn2 Al31.9Ca33.7Zn34.4
KS11 Al41.1Ca31.3Zn27.6
IM2 Al38.8Ca19.6Zn41.6
Not available IM3 Al21.1Ca26.1Zn53.8 IM4 Al49.3Ca33.2Zn17.5
CaZn5 Al8.3Ca16.5Zn75.1
KS12 Al12.5Ca17.5Zn70 IM2 Al38.8Ca19.6Zn41.6 IM2 IM3 Al21.1Ca26.1Zn53.8 IM3
CaZn5 Al8.3Ca16.5Zn75.1 CaZn5
75
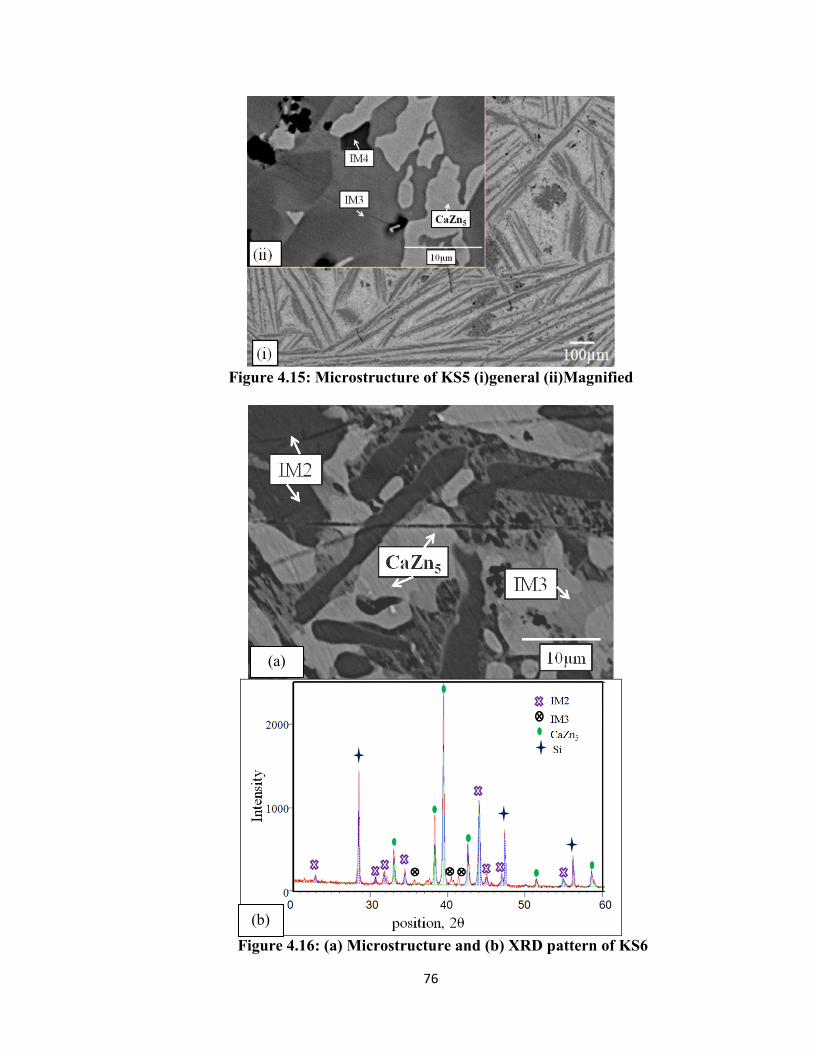
Figure 4.15: Microstructure of KS5 (i)general (ii)Magnified
Figure 4.16: (a) Microstructure and (b) XRD pattern of KS6
(a)
(b)
76
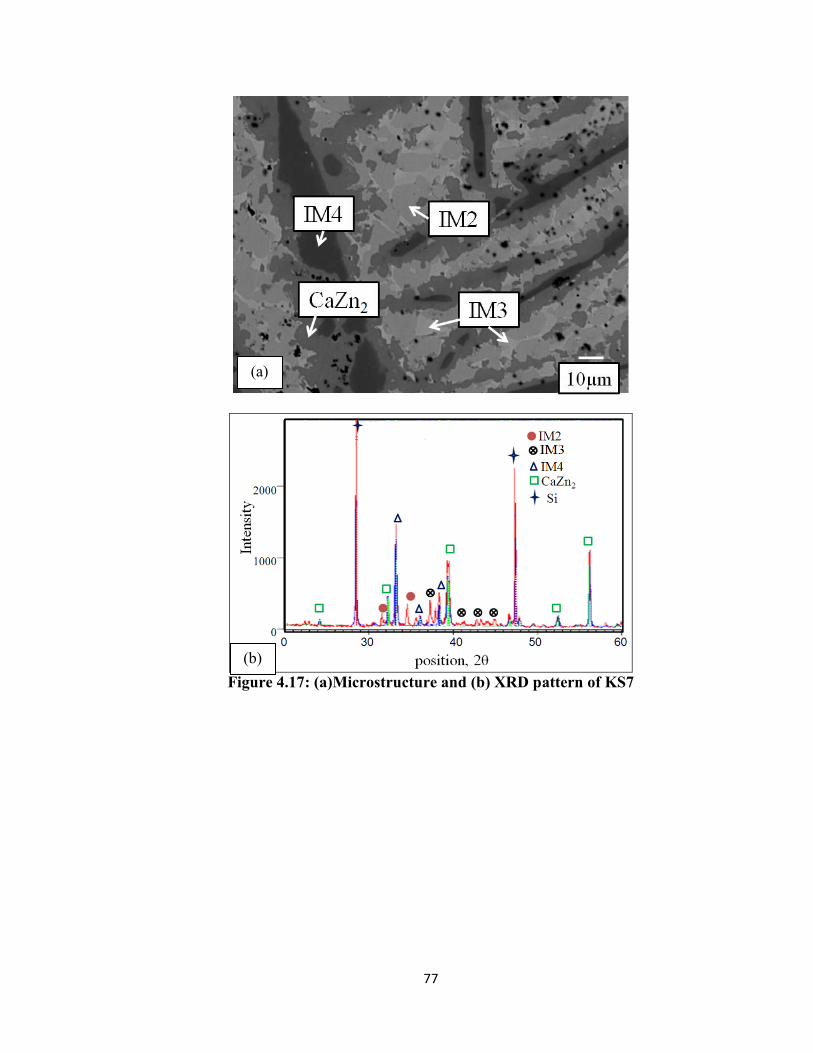
Figure 4.17: (a)Microstructure and (b) XRD pattern of KS7
(a)
(b)
77
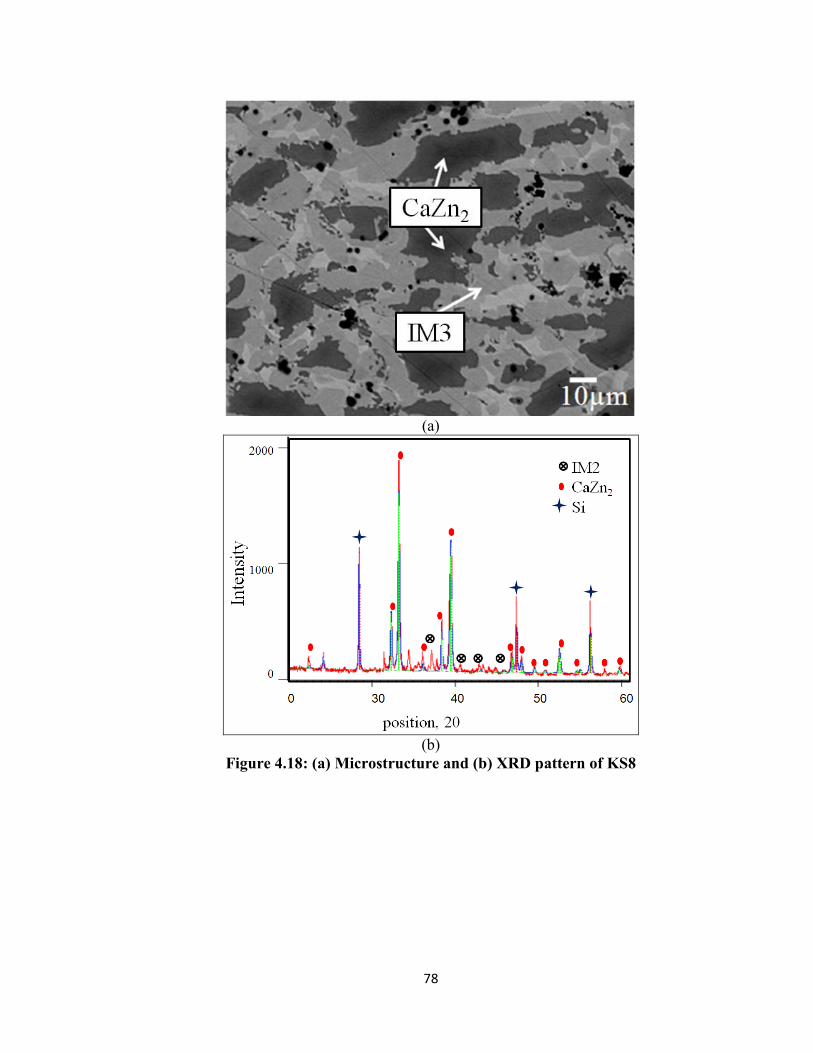
(a)
(b)
Figure 4.18: (a) Microstructure and (b) XRD pattern of KS8
78
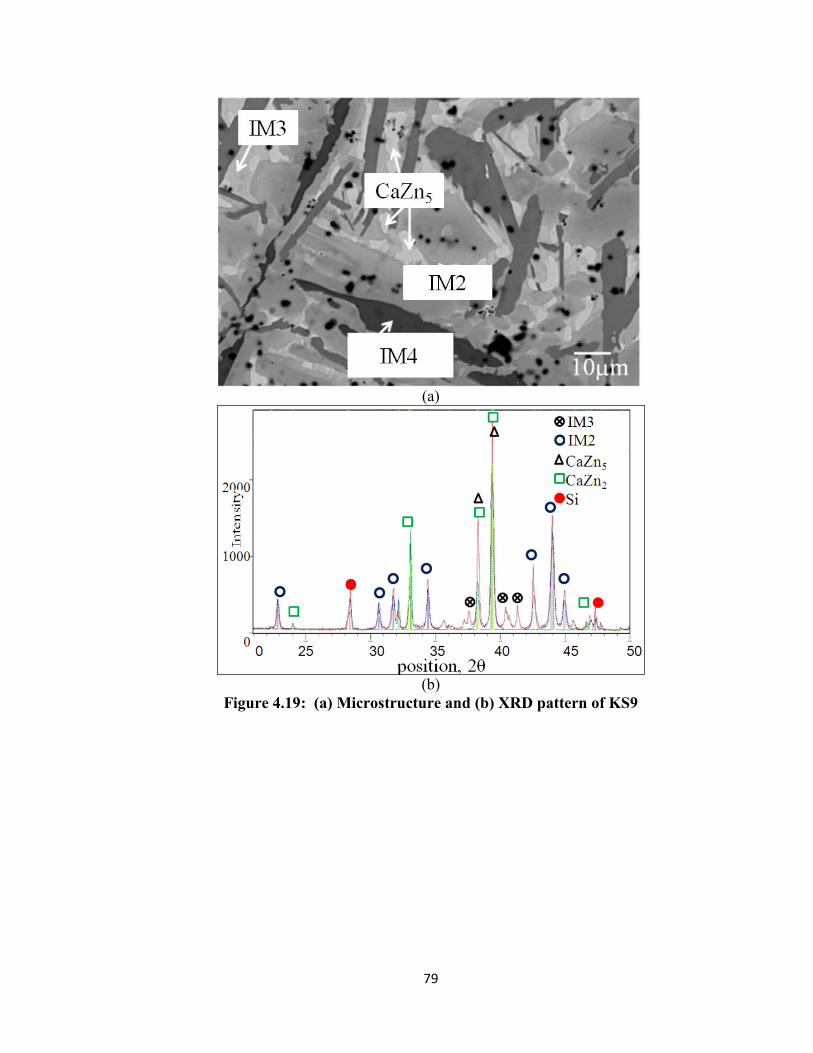
(a)
(b)
Figure 4.19: (a) Microstructure and (b) XRD pattern of KS9
79
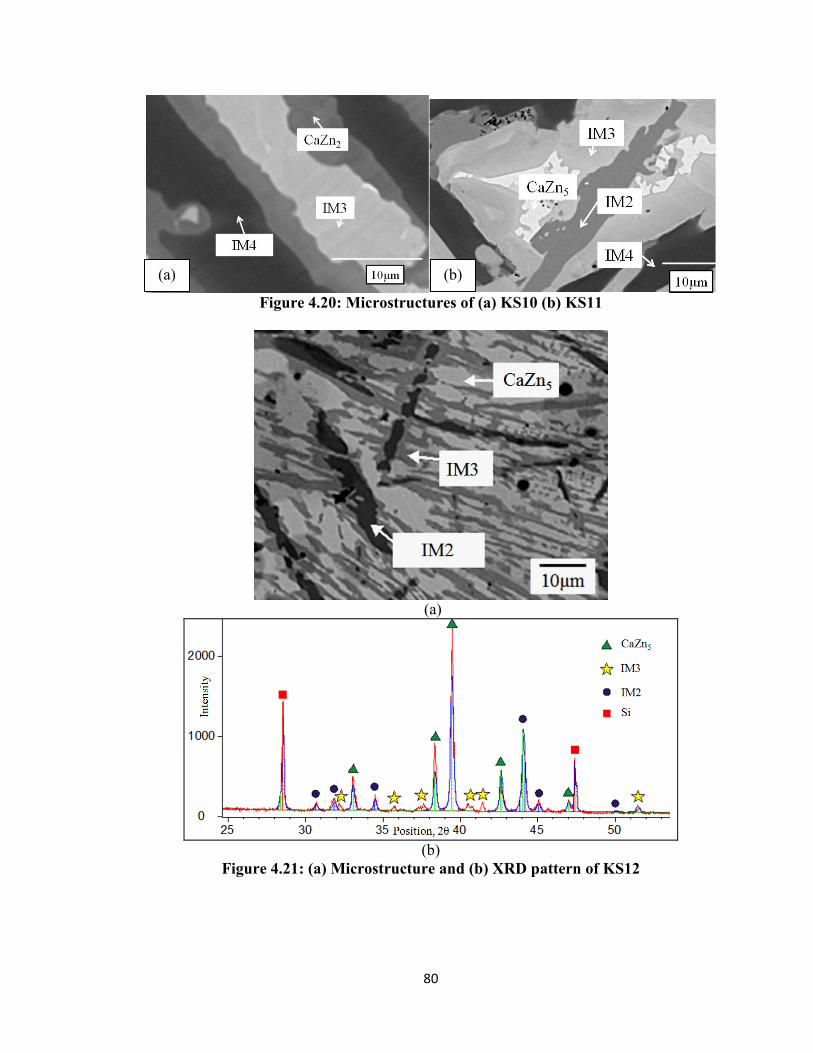
Figure 4.20: Microstructures of (a) KS10 (b) KS11
(a)
(b)
Figure 4.21: (a) Microstructure and (b) XRD pattern of KS12
(a) (b)
80
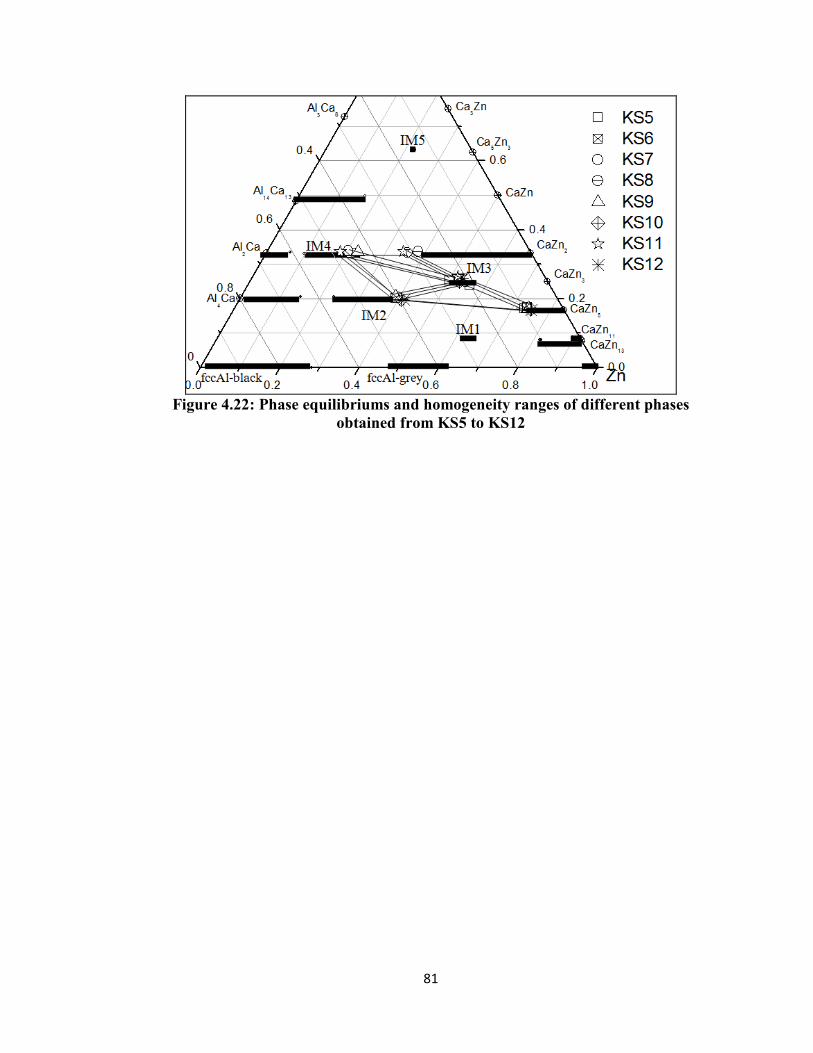
Figure 4.22: Phase equilibriums and homogeneity ranges of different phases
obtained from KS5 to KS12
81
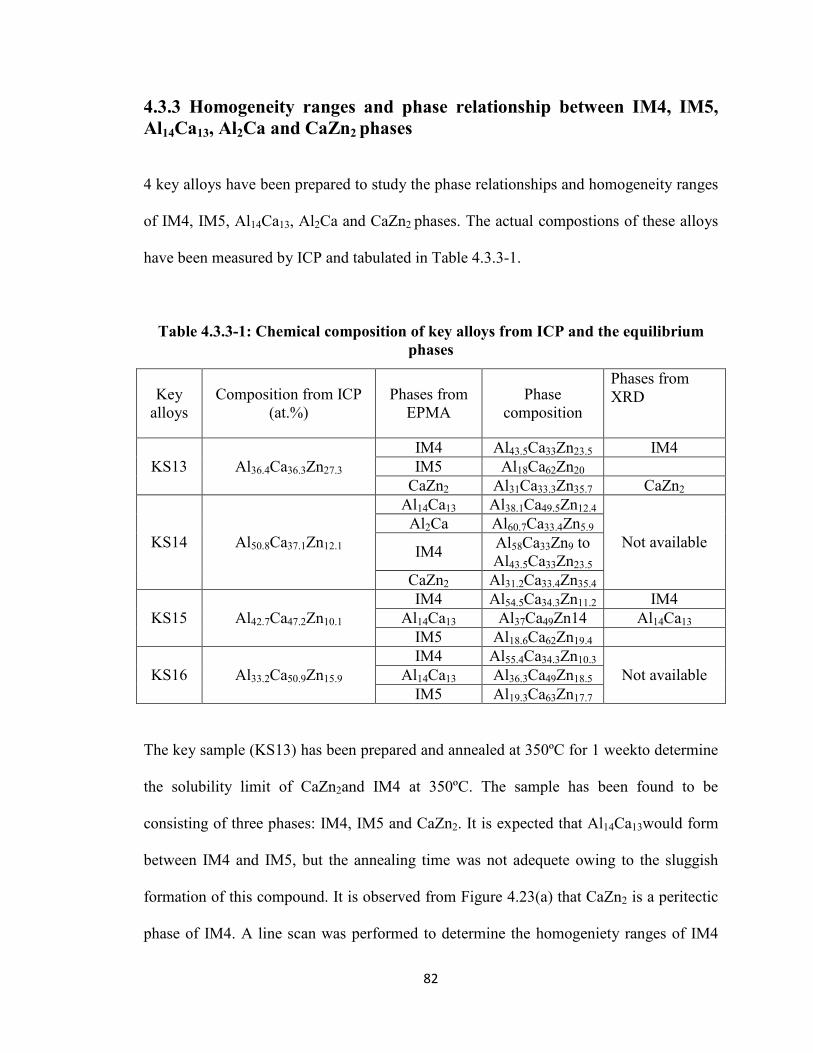
4.3.3 Homogeneity ranges and phase relationship between IM4, IM5, Al14Ca13, Al2Ca and CaZn2 phases
4 key alloys have been prepared to study the phase relationships and homogeneity ranges
of IM4, IM5, Al14Ca13, Al2Ca and CaZn2 phases. The actual compostions of these alloys
have been measured by ICP and tabulated in Table 4.3.3-1.
Table 4.3.3-1: Chemical composition of key alloys from ICP and the equilibrium phases
The key sample (KS13) has been prepared and annealed at 350ºC for 1 weekto determine
the solubility limit of CaZn2and IM4 at 350ºC. The sample has been found to be
consisting of three phases: IM4, IM5 and CaZn2. It is expected that Al14Ca13would form
between IM4 and IM5, but the annealing time was not adequete owing to the sluggish
formation of this compound. It is observed from Figure 4.23(a) that CaZn2 is a peritectic
phase of IM4. A line scan was performed to determine the homogeniety ranges of IM4
Key alloys
Composition from ICP (at.%)
Phases from EPMA
Phase composition
Phases from XRD
KS13 Al36.4Ca36.3Zn27.3 IM4 Al43.5Ca33Zn23.5 IM4 IM5 Al18Ca62Zn20
CaZn2 Al31Ca33.3Zn35.7 CaZn2
KS14 Al50.8Ca37.1Zn12.1
Al14Ca13 Al38.1Ca49.5Zn12.4
Not available Al2Ca Al60.7Ca33.4Zn5.9
IM4 Al58Ca33Zn9 to Al43.5Ca33Zn23.5
CaZn2 Al31.2Ca33.4Zn35.4
KS15 Al42.7Ca47.2Zn10.1 IM4 Al54.5Ca34.3Zn11.2 IM4
Al14Ca13 Al37Ca49Zn14 Al14Ca13 IM5 Al18.6Ca62Zn19.4
KS16 Al33.2Ca50.9Zn15.9 IM4 Al55.4Ca34.3Zn10.3
Not available Al14Ca13 Al36.3Ca49Zn18.5 IM5 Al19.3Ca63Zn17.7
82
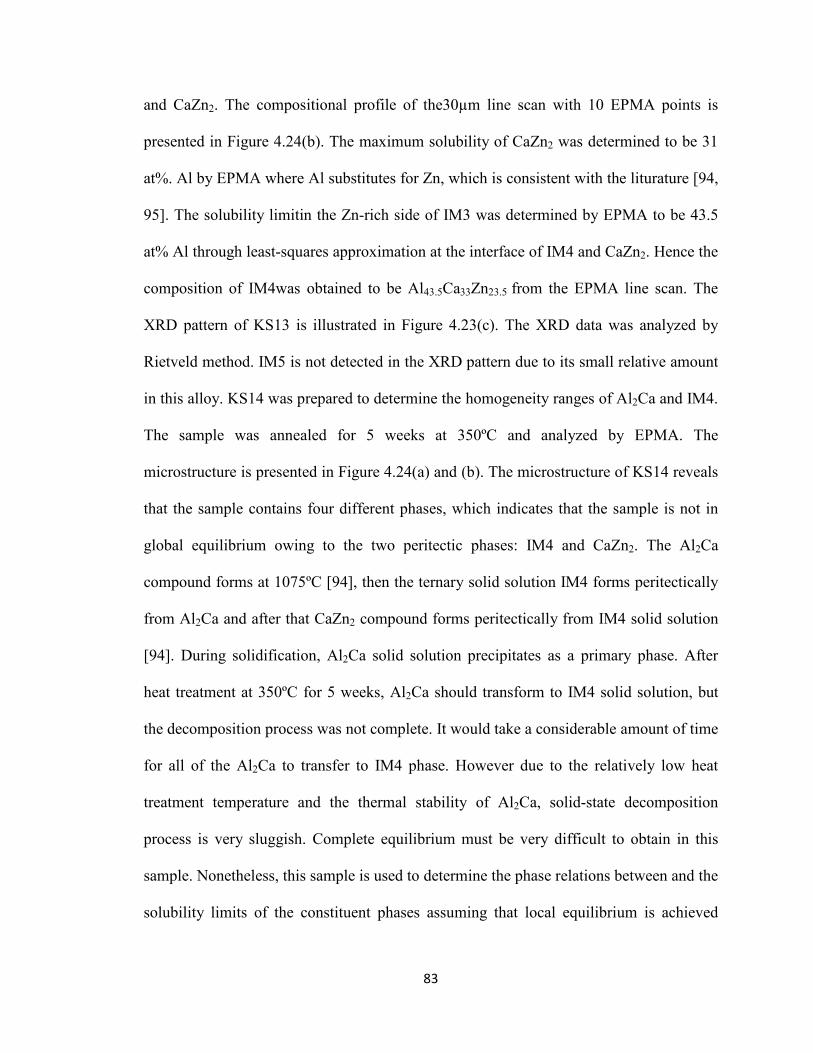
and CaZn2. The compositional profile of the30µm line scan with 10 EPMA points is
presented in Figure 4.24(b). The maximum solubility of CaZn2 was determined to be 31
at%. Al by EPMA where Al substitutes for Zn, which is consistent with the liturature [94,
95]. The solubility limitin the Zn-rich side of IM3 was determined by EPMA to be 43.5
at% Al through least-squares approximation at the interface of IM4 and CaZn2. Hence the
composition of IM4was obtained to be Al43.5Ca33Zn23.5 from the EPMA line scan. The
XRD pattern of KS13 is illustrated in Figure 4.23(c). The XRD data was analyzed by
Rietveld method. IM5 is not detected in the XRD pattern due to its small relative amount
in this alloy. KS14 was prepared to determine the homogeneity ranges of Al2Ca and IM4.
The sample was annealed for 5 weeks at 350ºC and analyzed by EPMA. The
microstructure is presented in Figure 4.24(a) and (b). The microstructure of KS14 reveals
that the sample contains four different phases, which indicates that the sample is not in
global equilibrium owing to the two peritectic phases: IM4 and CaZn2. The Al2Ca
compound forms at 1075ºC [94], then the ternary solid solution IM4 forms peritectically
from Al2Ca and after that CaZn2 compound forms peritectically from IM4 solid solution
[94]. During solidification, Al2Ca solid solution precipitates as a primary phase. After
heat treatment at 350ºC for 5 weeks, Al2Ca should transform to IM4 solid solution, but
the decomposition process was not complete. It would take a considerable amount of time
for all of the Al2Ca to transfer to IM4 phase. However due to the relatively low heat
treatment temperature and the thermal stability of Al2Ca, solid-state decomposition
process is very sluggish. Complete equilibrium must be very difficult to obtain in this
sample. Nonetheless, this sample is used to determine the phase relations between and the
solubility limits of the constituent phases assuming that local equilibrium is achieved
83
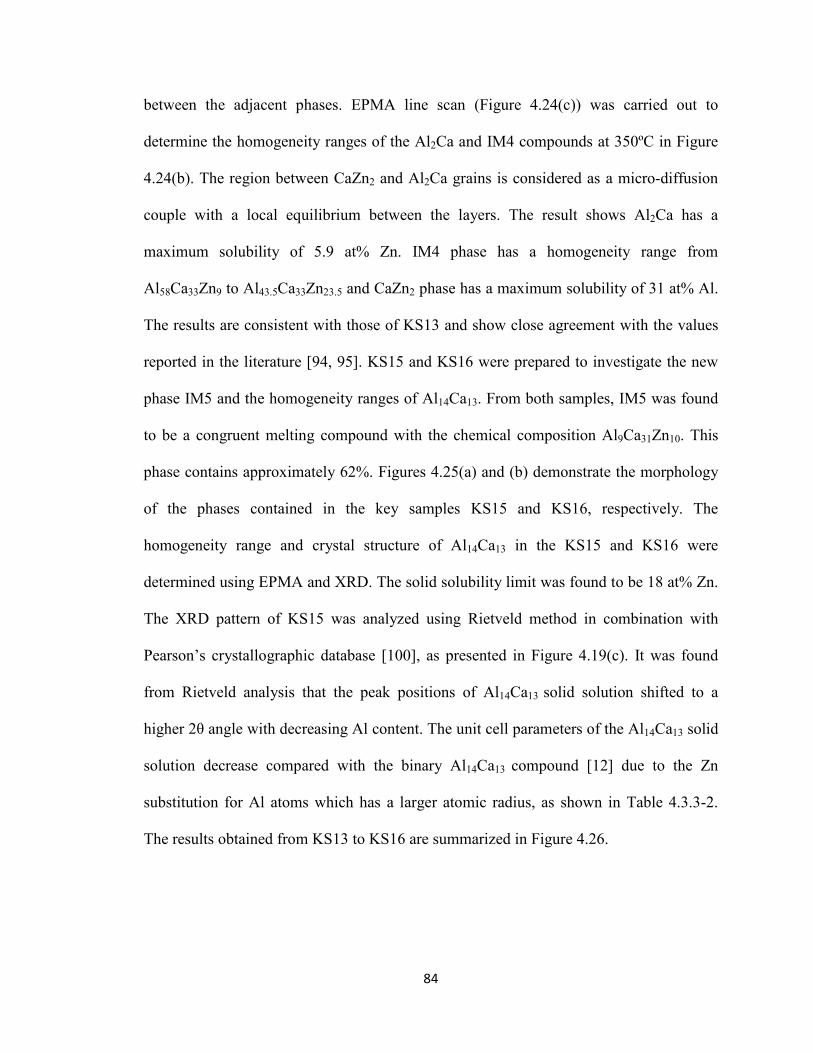
between the adjacent phases. EPMA line scan (Figure 4.24(c)) was carried out to
determine the homogeneity ranges of the Al2Ca and IM4 compounds at 350ºC in Figure
4.24(b). The region between CaZn2 and Al2Ca grains is considered as a micro-diffusion
couple with a local equilibrium between the layers. The result shows Al2Ca has a
maximum solubility of 5.9 at% Zn. IM4 phase has a homogeneity range from
Al58Ca33Zn9 to Al43.5Ca33Zn23.5 and CaZn2 phase has a maximum solubility of 31 at% Al.
The results are consistent with those of KS13 and show close agreement with the values
reported in the literature [94, 95]. KS15 and KS16 were prepared to investigate the new
phase IM5 and the homogeneity ranges of Al14Ca13. From both samples, IM5 was found
to be a congruent melting compound with the chemical composition Al9Ca31Zn10. This
phase contains approximately 62%. Figures 4.25(a) and (b) demonstrate the morphology
of the phases contained in the key samples KS15 and KS16, respectively. The
homogeneity range and crystal structure of Al14Ca13 in the KS15 and KS16 were
determined using EPMA and XRD. The solid solubility limit was found to be 18 at% Zn.
The XRD pattern of KS15 was analyzed using Rietveld method in combination with
Pearson’s crystallographic database [100], as presented in Figure 4.19(c). It was found
from Rietveld analysis that the peak positions of Al14Ca13 solid solution shifted to a
higher 2θ angle with decreasing Al content. The unit cell parameters of the Al14Ca13 solid
solution decrease compared with the binary Al14Ca13 compound [12] due to the Zn
substitution for Al atoms which has a larger atomic radius, as shown in Table 4.3.3-2.
The results obtained from KS13 to KS16 are summarized in Figure 4.26.
84
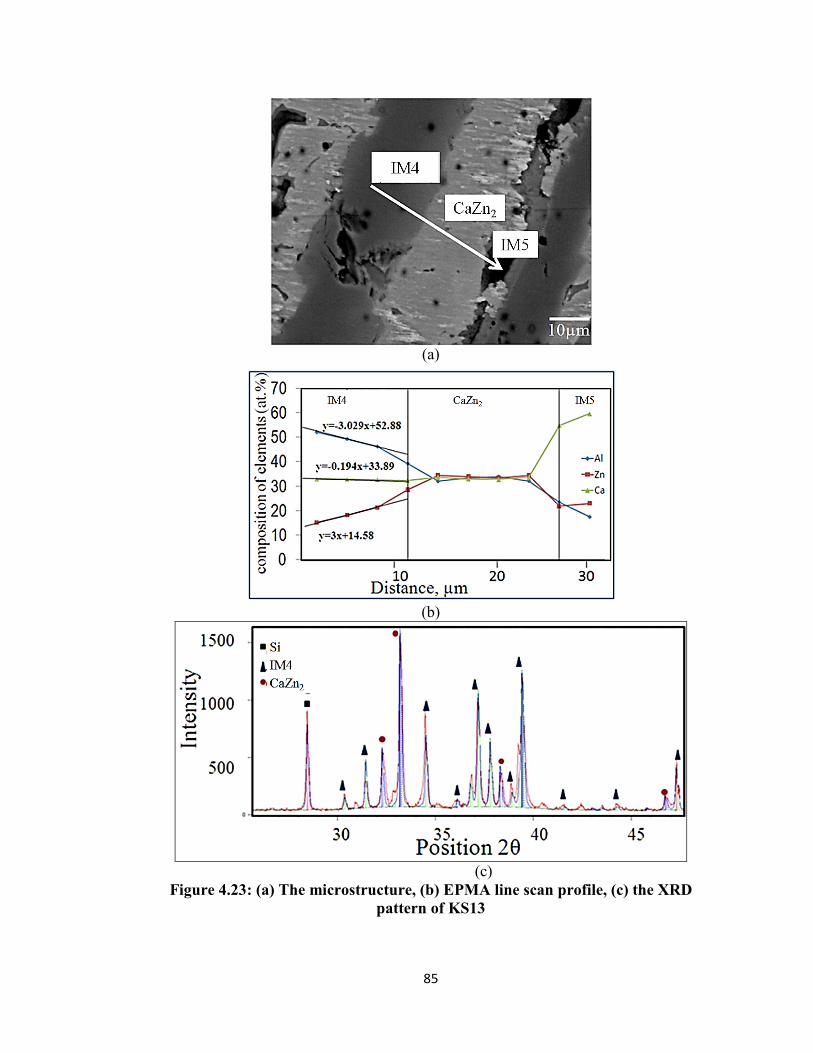
(a)
(b)
(c)
Figure 4.23: (a) The microstructure, (b) EPMA line scan profile, (c) the XRD pattern of KS13
85
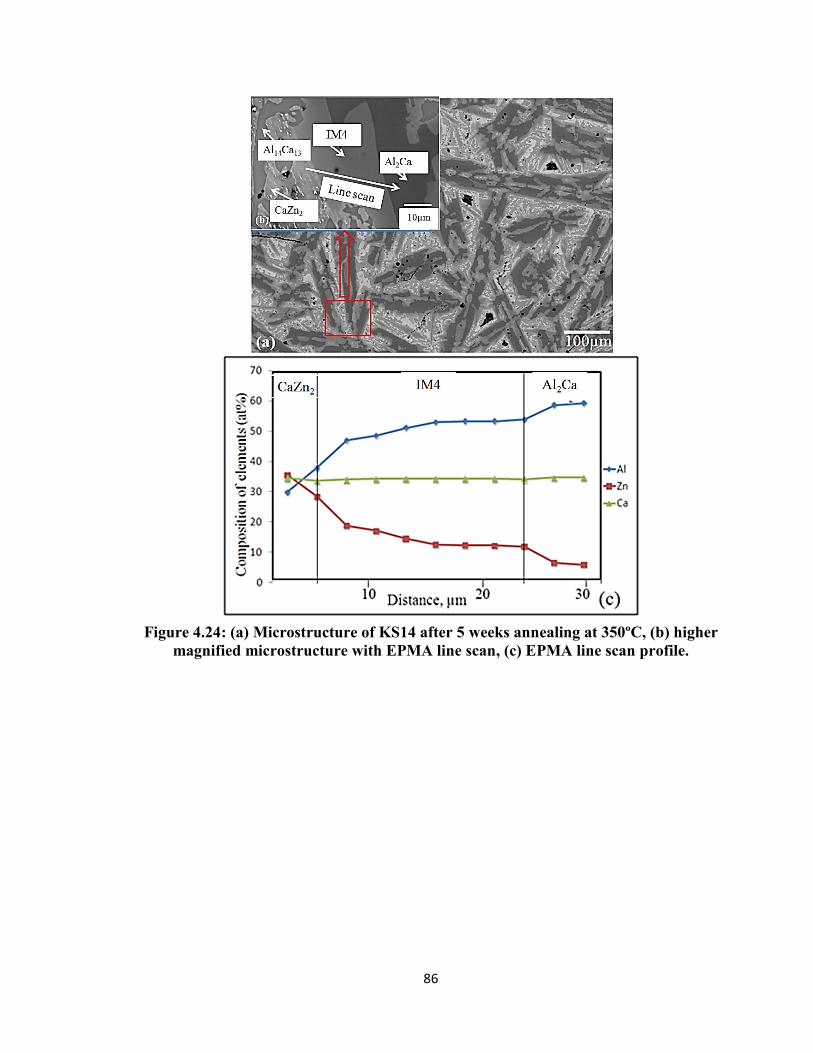
Figure 4.24: (a) Microstructure of KS14 after 5 weeks annealing at 350ºC, (b) higher
magnified microstructure with EPMA line scan, (c) EPMA line scan profile.
86
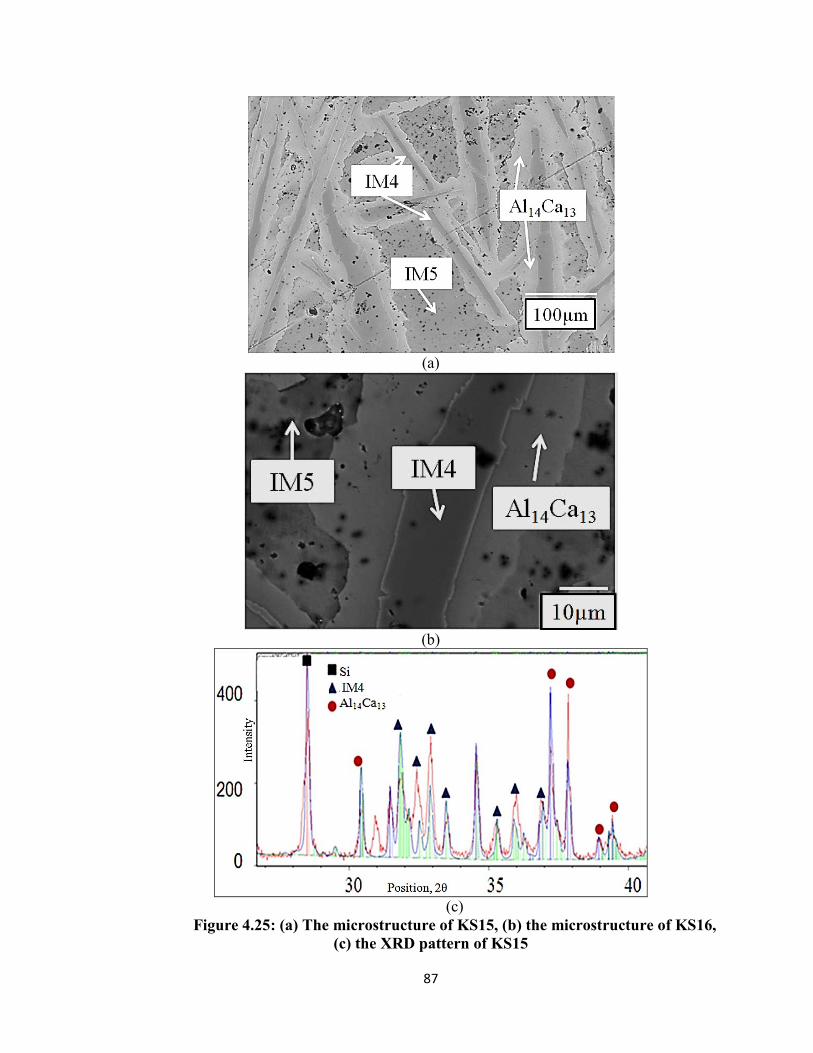
(a)
(b)
(c)
Figure 4.25: (a) The microstructure of KS15, (b) the microstructure of KS16, (c) the XRD pattern of KS15
87
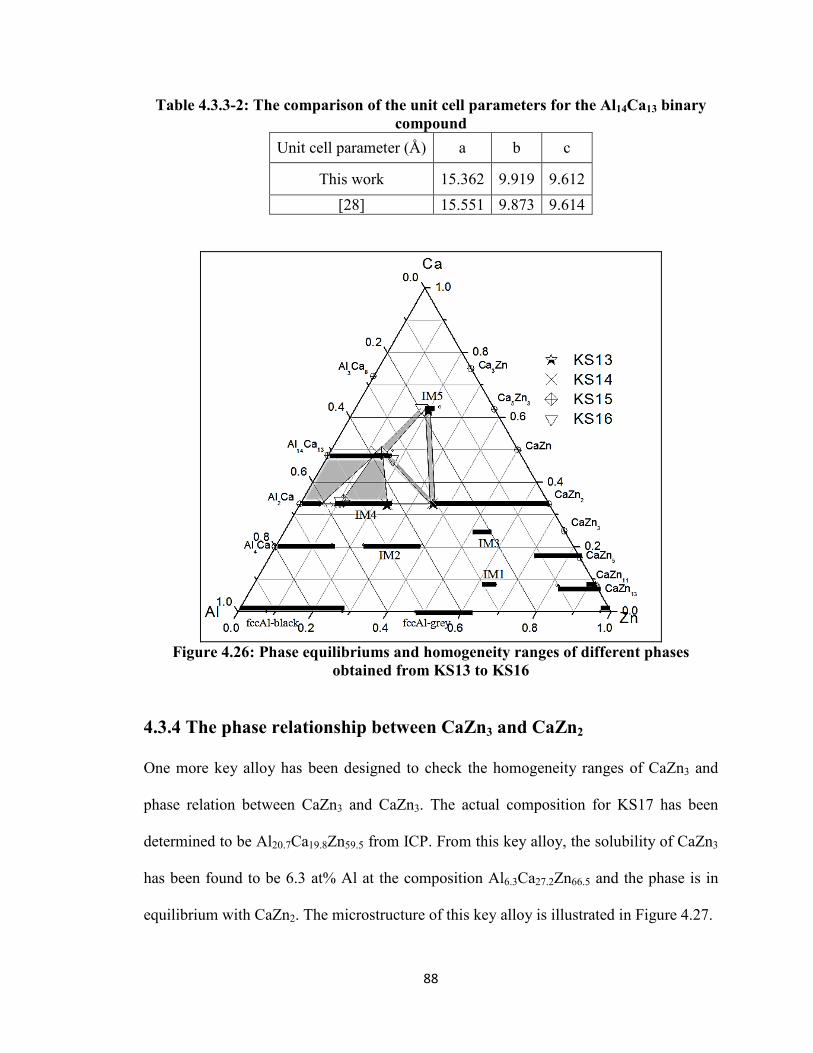
Table 4.3.3-2: The comparison of the unit cell parameters for the Al14Ca13 binary compound
Unit cell parameter (Å) a b c
This work 15.362 9.919 9.612 [28] 15.551 9.873 9.614
Figure 4.26: Phase equilibriums and homogeneity ranges of different phases
obtained from KS13 to KS16
4.3.4 The phase relationship between CaZn3 and CaZn2
One more key alloy has been designed to check the homogeneity ranges of CaZn3 and
phase relation between CaZn3 and CaZn3. The actual composition for KS17 has been
determined to be Al20.7Ca19.8Zn59.5 from ICP. From this key alloy, the solubility of CaZn3
has been found to be 6.3 at% Al at the composition Al6.3Ca27.2Zn66.5 and the phase is in
equilibrium with CaZn2. The microstructure of this key alloy is illustrated in Figure 4.27.
88
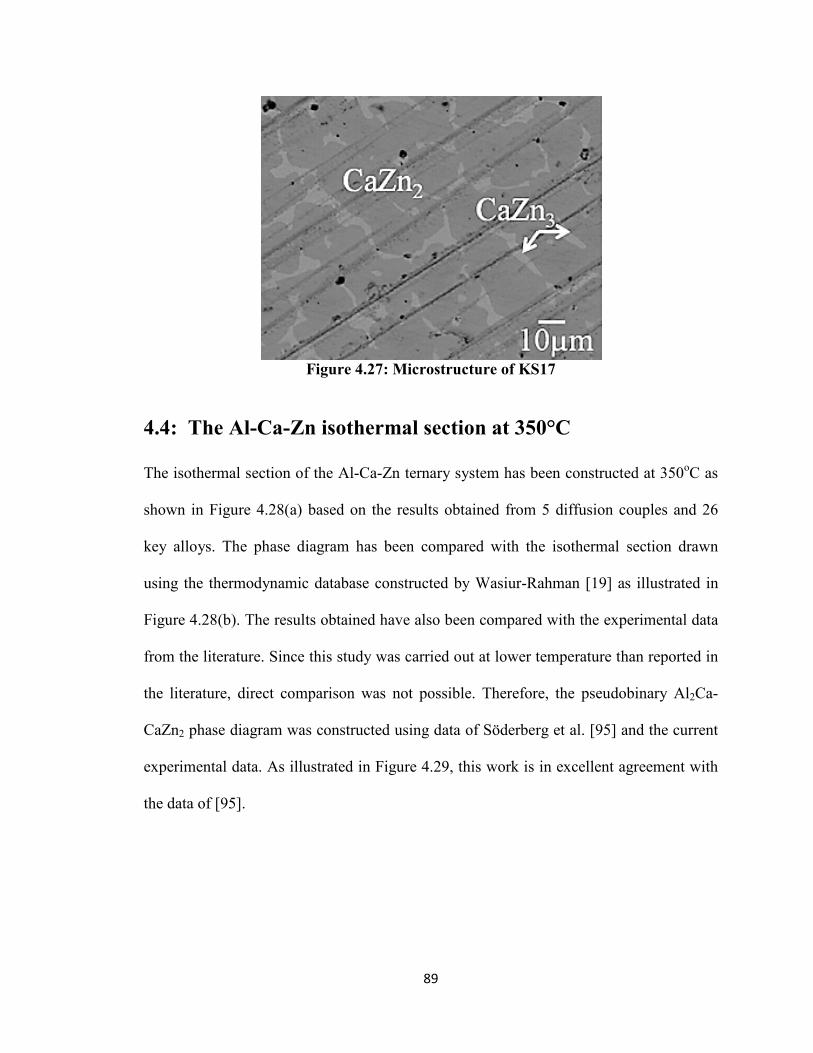
Figure 4.27: Microstructure of KS17
4.4: The Al-Ca-Zn isothermal section at 350°C
The isothermal section of the Al-Ca-Zn ternary system has been constructed at 350oC as
shown in Figure 4.28(a) based on the results obtained from 5 diffusion couples and 26
key alloys. The phase diagram has been compared with the isothermal section drawn
using the thermodynamic database constructed by Wasiur-Rahman [19] as illustrated in
Figure 4.28(b). The results obtained have also been compared with the experimental data
from the literature. Since this study was carried out at lower temperature than reported in
the literature, direct comparison was not possible. Therefore, the pseudobinary Al2Ca-
CaZn2 phase diagram was constructed using data of Söderberg et al. [95] and the current
experimental data. As illustrated in Figure 4.29, this work is in excellent agreement with
the data of [95].
89
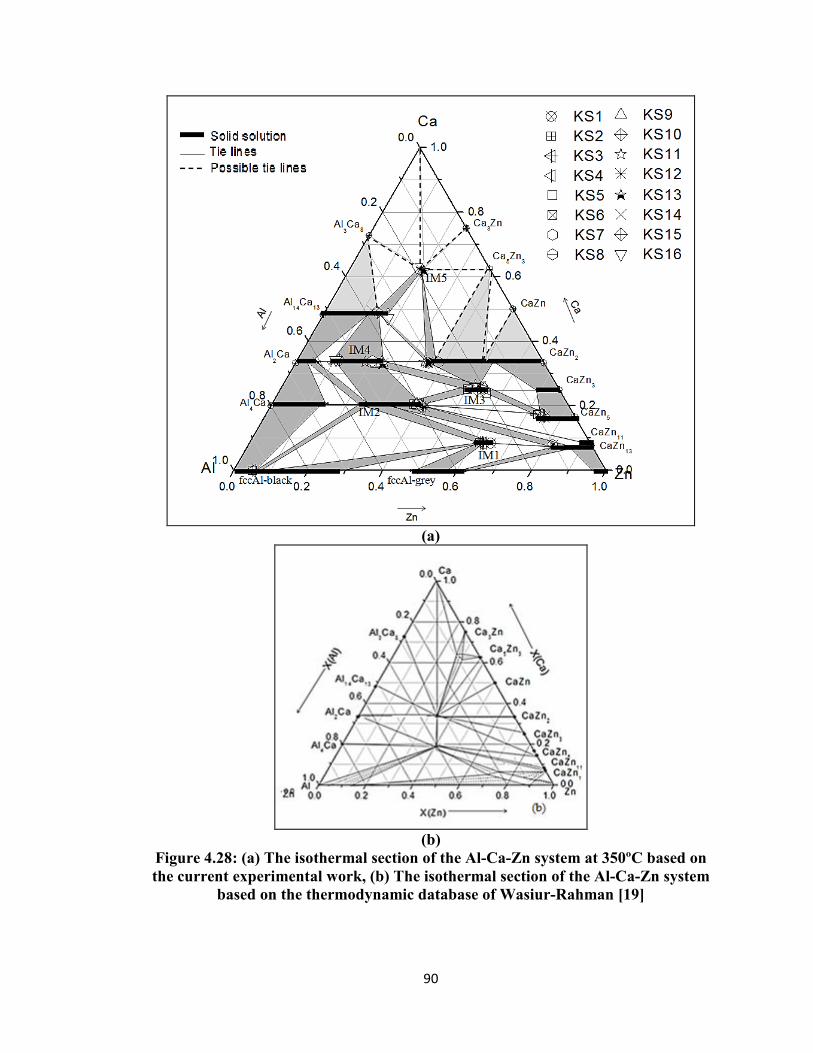
(a)
(b)
Figure 4.28: (a) The isothermal section of the Al-Ca-Zn system at 350ºC based on the current experimental work, (b) The isothermal section of the Al-Ca-Zn system
based on the thermodynamic database of Wasiur-Rahman [19]
90
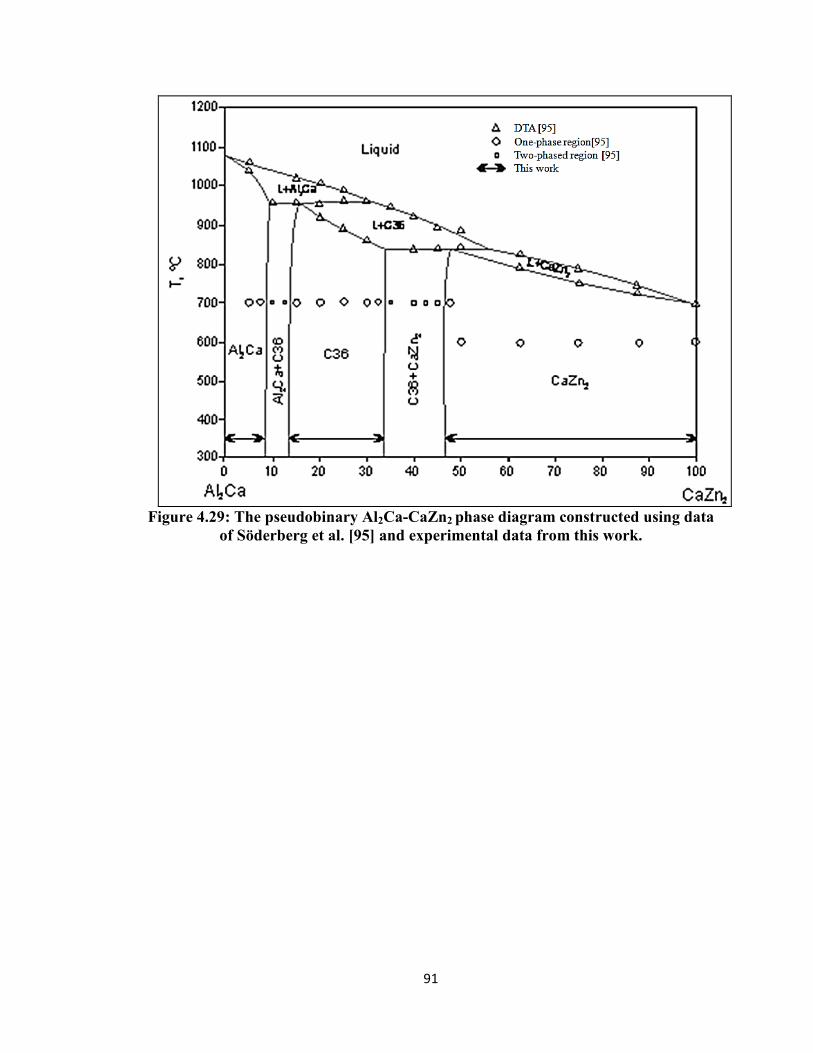
Figure 4.29: The pseudobinary Al2Ca-CaZn2 phase diagram constructed using data
of Söderberg et al. [95] and experimental data from this work.
91
CHAPTER 5
CONCLUSION
5.1. Concluding remarks
A combination of diffusion couple technique and selected equilibrated key alloys have
been used to construct the Al-Ca-Zn isothermal section at 350ºC. Phase relations,
homogeneity ranges and crystallographic information have been determined for binary
and ternary compounds using EPMA and XRD techniques. The new ternary compounds
IM1, IM3 and IM5 have been studied for the first time and their homogeneity ranges at
350oC have been determined. The formula of IM1 compound is AlxCa8.4Zny (26≤x≤29,
62≤y≤65at 350ºC) at 350°C. It has cubic structure with Pm m (221) space group and
BaHg11 prototype. The composition and homogeneity ranges of previously reported two
ternary compounds; IM2 and IM4 at 350oC have also been studied and compared with the
literature. Among the binary compounds, Al14Ca13, Al2Ca, Al4Ca, CaZn2, CaZn3, CaZn5,
CaZn11 and CaZn13 have extended solubility in the ternary system.
5.2 Contribution
The significant contributions of the present work are summarized below:
• Detailed investigation has been carried out throughout the whole compositional
range of the Al-Ca-Zn system at 350oC and possible phases, phase relationships
and tie lines have been identified. These findings have substantially improved the
92
understanding of the Al-Ca-Zn Al-Ca-Zn system and will be helpful to improve
the thermodynamic model of this system.
• Five ternary compounds have been confirmed in this work; among them, only two
were previously known. This discovery will be very useful for the design of
certain alloys for industrial applications.
• The solid solubility and crystal structure of the new ternary compound IM1 has
been determined and confirmed by means of EPMA and XRD for the first time in
this work.
5.2 Future works
• Additional experimental work is necessary to determine the crystal structure
information of the new ternary compounds IM2 and IM3. To obtain the
crystal structure of IM2, longer annealing time of the alloys containing this
compound IM2 is recommended.
• DSC experiments are needed to determine the melting points of the ternary
compounds.
93
REFERENCES
[1] D. Uffelmann, Aluminium Alloy for Superplastic Forming, ATZproduktionworldwide, Edition 2010-02.Retrieved from http://www.atzonline.com/index.php;do=show/site=a4e/sid=12294570014d0aabbc6f3dc569162208/alloc=3/id=11160 [2] L. Chappuis; K. Zengen, New Ideas for Aluminium Parts, ATZautotechnology, Edition 2004-02. Retrieved from http://www.atzonline.com/index.php;do=show/site=a4e/sid=1657738624d214b18e0f95509209016/alloc=3/id=2155 [3] G. Piatti, G. Pellegrini, R. Trippodo, The tensile properties of of a new superplastic aluminium alloy: Al-Al4Ca eutectic, Journal of Materials Science, Vol. 11, Issue 1, 1976, pp. 186-190
[4] D.M. Moore, L.R. Morris, A new superplastic aluminum sheet alloy, Material Science and Engineering, Vol. 43,Issue 1, 1980, pp. 85-92. [5] M.T. Perez-Prado, J. Ibanez, M.C. Cristina, M.A. Morris-Munoz, O.A. Ruano, G. Gonzalez-Doncel, Texture Evolution of the Tetragonal Al3CaZn Phase in Al-5%Ca-5%Zn Superplastic Sheet Alloy after Annealing and Deformation, Materials Transactions, Vol. 40, Issue 9, 1999, pp. 1011-1014. [6] V.A. Shvets, V.O. Lavrenko, V.M. Talash, Experience of application of protectors made of Al-Zn-Ca alloys, Journal of Materials Science, Vol. 42, Issue 4, 2006, pp. 563-565. [7] D. Wenwen, S. Yangshan, M. Xuegang, X. Feng, Z. Min, W. Dengyun, Microstructureand mechanical properties of Mg–Al based alloy with calcium and rare earth additions, Materials Science and Engineering, Vol. 356, Issue 1-7, 2003, pp. 1-7. [8] Y.A. Chang, S. Chen, F. Zhang, X. Yan, F. Xie, R. Schmid-Fetzer, W.A. Oates, Phase Diagram Calculation: Past, Present and Future, Progress in Materials Science, Vol.49, 2004, pp.313-345.
[9] L. Donski, Alloys of Calcium with Zinc, Cadmium, Aluminum, Thallium, Lead, Tin, Bismuth, Antimony and Copper, Zeitschrift Für Anorganische und Allgemeine Chemie, Vol. 57, 1908, pp. 185-193.
[10] K. Matsuyama, On the Equilibrium diagram of the Al-Ca system, Scientific Reports, Tohoku University, Vol. 17, 1928, pp.783-789.
94
[11] D. Kevorkov, R. Schmid-Fetzer, The Al-Ca system, Part 1: Experimental Investigation of Phase equilibria and crystal structures, Zeitschrift Für Metallkunde, Vol. 92, 2001, pp. 946-952. [12] B. Huang, J. D. Corbett, Two new binary Calcium-Aluminum compounds: Ca13Al14, with a novel Two-Dimensional aluminum network, and Ca8Al3, and Fe3Al-Type, Inorganic Chemistry, Vol. 37, 1998, pp. 5827-5833. [13] H. Nowotny , E. Wormnes , E. Mohrnheim , Investigation on the Al-Ca, Mg-Ca and Mg-Zr Systems, Zeitschrift Für Metallkunde, Vol. 32, 1940, pp. 39-42. [14] M. Notin, J. C. Gachon, J. Hertz, Thermodynamic data for calcium-based alloys from a new galvanic method, CALPHAD (Computer Coupling of Phase Diagrams and Thermochemistry), Vol. 6, Issue1, 1982, pp. 49-56. [15] D. Kevorkov, R. Schmid-Fetzer, A. Pisch, F. Hodaj and C. Colinet., The Al-Ca system, Part 2: Calorimetric Measurements and Thermodynamic Assessment, Zeitschrift Für Metallkunde, Vol. 92, 2001, pp. 953-958. [16] M. Aljarrah and M. Medraj, Thermodynamic Assessment of the Phase Equilibria in the Al-Ca-Sr System using the Modified Quasichemical Model, Journal of Chemical Thermodynamics, Vol. 40, No. 4, 2008, pp.724-734. [17] F. Sommer, J.J. Lee and B. Predel, Thermodynamic Investigation of Liquid Al- Ca, Al-Sr, Mg-Ni and Ca-Ni Alloys, Zeitschrift fur Metallkunde, Vol.74, 1983, pp.100-104.
[18] Y.O. Esin, V.V. Litovski, S.E. Demin, M.S. Petrushevski, Enthalpies of Formation of Aluminum-Strontium and Barium-Silicon Melts, Russian Journal of Physics and Chemistry, Vol.59, 1985, pp. 446.
[19] S. Wasiur-Rahman, Thermodynamic Modeling of the (Mg, Al)-Ca-Zn Systems, M.A.Sc Thesis in Mechanical and Industrial Engineering, 2008, Concordia University: Montreal, QC, Canada. [20] K. T. Jacob, S. Srikanth, Y. Waseda, Activities, concentration fluctuations and complexing in liquid Ca-Al alloys, Transactions of the Japan Institute of Metals, Vol.29, 1988, pp. 50-59. [21] E. Schürmann, C.P. Fünders, H. Litterscheidt, Vapor pressure of Ca above Ca-Si, Ca-Al and Ca-Al-Si alloys, Arch. Eisenhuttenews., Vol. 46, 1975, pp. 473-476. [22] K. Ozturk, L.Q. Chen, Z.-K.Liu, Thermodynamic Assessment of the Al-Ca Binary System Using Random Solution and Associate Models, Journal of Alloys and Compounds, Vol. 340, No.1-2, 2002, pp.199-206.
95
[23] S. Wasiur-Rahman, M. Medraj, A thermodynamic description of the Al-Ca-Zn ternary system, CALPHAD (Computer Coupling of Phase Diagrams and Thermochemistry), Vol. 30, 2009, pp. 584-598.
[24] R. Paris, Ternary Alloys, Publications Scientifiques et Techniques du minist’ere de L’Air, Ministère de L’Air, No.45, 1934, pp. 1-86.
[25] A.F. Messing, M.D. Adams and R.K. Steunenberg, Contribution to the Phase Diagram Calcium-Zinc, Transactions of the ASM., Vol. 56, 1963, pp. 345-350.
[26] V.P. Itkin and C.B. Alcock, The Ca-Zn System, Bulletin of Alloy Phase Diagrams, Vol. 11, Issue 4, 1990, pp. 328-333.
[27] G. Bruzzone, E. Franceschi and F. Merlo, M5X3 Intermediate Phases Formed by Ca, Sr and Ba, Journal of the Less-Common Metals, Vol. 60, 1978, pp. 59-63.
[28] M.L. Fornasini and F. Merlo, CaZn3: a structure with mixed BaLi4- and CeCu2-like ordering, Acta Crystallograpica, Vol. B36, 1980, pp. 1739–1744.
[29] J.A.A. Ketelaar, The Crystal Structure of Alloys of Zinc with the Alkali and Alkaline Earth Metals and of Cadmium with Potassium, Journal of Chemical Physics, Vol. 5, 1937, pp. 668.
[30] A. Iandelli and A. Palenzona, Zinc-rich phases of the rare earth zinc alloys, Journal of the Less-Common Metals, Vol. 12, 1967, pp. 333–343. [31] W. Haucke, The Crystal Structure of CaZn5 and CaCu5, Zeitschrift für Anorganische und Allgemeine Chemie, Vol. 244, 1940, pp.17-22.
[32] M. Wendorff and C. Röhr, Zink-reiche Erdalkalimetall-Verbindungen AZn5 und AZn11: Kristallstrukturen und chemische Bindung, Zeitschrift für Naturforschung, Vol. 62b, 2007, pp.1549–1562. [33] G.E.R. Schulze and J. Wieting, The Structural Characteristics of The CaZn2 Lattice, Zeitschrift für Metallkunde, Vol. 52, 1961, pp. 743-746.
[34] M.L. Fornasini, F. Merlo and K. Schubert, Crystal structures of Ca3Zn and CaZn, Journal of the Less-Common Metals, Vol. 79, 1981, pp. 111-119.
[35] H.W. King, Temperature-dependent Allotropic Structures of the Elements, Bull. Alloy Phase Diagrams, Vol. 3, 1982, pp. 275-276.
[36] H.W. King, Pressure-dependent Allotropic Structures of the Elements, Bull. Alloy Phase Diagrams, Vol. 2, 1981, pp. 401-402.
[37] C.O. Brubaker and A. Zi-Kui Liu, Computational thermodynamic assessment of the Ca–Zn system, CALPHAD (Computer Coupling of Phase Diagrams and Thermochemistry), Vol. 25, Issue 3, 2001, pp. 381–390.
96
[38] H. Okamoto and T. B. Massalski, Thermodynamically improbable phase diagrams. Journal of Phase Equilibria, Vol. 12, Issue 2, 1991, pp. 148–168. [39] P.J. Spencer, A.D. Pelton, Y-B Kang, P. Chartrand, C.D. Fuerst, Thermodynamic assessment of the Ca–Zn, Sr–Zn, Y–Zn and Ce–Zn system, CALPHAD (Computer Coupling of Phase Diagrams and Thermochemistry), Vol. 32, Issue 2, 2008, pp. 423-431. [40] S. Wasiur-Rahman and M. Medraj, Critical assessment and thermodynamic modeling of the binary Mg–Zn, Ca–Zn and ternary Mg–Ca–Zn systems, Intermetallics, Vol. 17, Issue 10, 2009, pp. 847-864. [41] P. Chiotti and R.J. Hecht, Thermodynamic Properties of the Calcium-Zinc System, Transactions of the Metallurgical Society of AIME, Vol. 239, 1967, pp. 536-542.
[42] J. Delcet and J.J. Egan, Thermodynamics of Liquid Ca-Zn Alloys, Metalallurgical Transactions B, Vol. 9B, Issue 4, 1978, pp.728-729.
[43] C.T. Heycock, F.H. Neville, The freezing points of alloys containing zinc and another metal, Journal of the Chemical Society Transactions, Vol. 71,1897, pp. 383-398. [44] T. Isihara, On the equilibrium diagram of the aluminum-zinc system, Science, Reports of the Tohoku Imperial University, Vol. 13, 1924, pp. 18-21. [45] T. Tanabe, Studies in the aluminum-zinc system, Journal of the Institute of Metals, Vol. 32, 1924, pp. 415-427. [46] M.L.V. Gayler, M. Haughton, E.G. Sutherland, The constitution of aluminum-zinc alloys of high purity: The nature of the thermal change of 443oC, Journal of the Institute of Metals, Vol. 63, 1938, pp.123-147. [47] E. Pelzel, H. Schneider, Contribution to the understanding of Zn alloys, Zeitschrift für Metallkunde, Vol. 35, 1943, pp. 124-127. [48] T. Morinaga, On the equilibrium diagram of the aluminum-zinc system, Nippon Kinzoku Gakkaishi, Vol. 3, 1939, pp. 216-221. [49] E. Butchers, W. Hume-Rothery, On the constitution of aluminum-magnesium-manganese-zinc alloys: The solidus, Journal of the Institute of Metals, Vol. 71, 1945, pp. 291-311. [50] E. Pelzel, The positions of the liquidus and solidus curves in the Al-Zn system from 30 to 70 wt.% Al, Zeitschrift für Metallkunde, Vol. 40, 1949, pp. 134-136. [51] I.S. Solet, H.W.S. Clair, Liquidus temperatures and liquid densities of zinc-aluminum alloys, Bureau of Mines Report of Investigations 4553, 1949, pp. 1-7.
97
[52] Q.F. Peng, F.S. Chen, B.S. Qi, Y.S. Wang, Measurement of aluminum-zinc phase diagram by acoustic emission during solidification, Transactions of the American Foundrymen's Society, Vol. 99, 1991, pp. 199-202. [53] E. Gebhardt, Equilibrium experiments on the systems zinc-aluminum and zinc-aluminum-copper, Zeitschrift für Metallkunde, Vol. 40, 1949, pp. 136-140. [54] E.C. Ellwood, The solid solutions of zinc in aluminum, Journal of the Institute of Metals, Vol. 80, 1951, pp. 217-224. [55] H. Araki, Y. Minamino, T. Yamane, K. Azuma, Y.S Kang, Y Miyamoto, Partial phase diagrams of the aluminum-rich region of the aluminum-zinc system at 0.1 MPa and 2.1 GPa, Journal of Materials Science Letters, Vol. 11, Issue 3, 1992, pp. 181-183. [56] W.L Fink, L.A. Willey, Equilibrium relations in aluminum-zinc alloys of high purity, II, Transactions of the Metallurgical Society of AIME, Vol. 12, 1936, pp. 244-260. [57] M. Simerska, P. Bartuska, The X-ray diffraction and electron microscopic investigation of stable and metastable equilibria in Al-rich Al-Zn alloys, Czech Journal of Physics, Vol. B24, 1974, pp. 553-559. [58] G. Borelius, L.E. Larsson, Kinetics of precipitation in aluminum-zinc alloys, Arkivför Matematik, Astronomioch Fysik, Vol. 35A, Issue 13, 1948, pp. 1-14. [59] A. Münster, K. Sagel, Miscibility gap and critical point of the aluminum-zinc system, Zeitschriftfür Physikalische Chemie, Vol. 7, 1956, pp. 267-295. [60] H. Terauchi, N. Sakamoto, K. Osamura, Y. Murakami, Small angle X-ray critical scattering in an aluminum-zinc alloy with critical composition, Transactions of the Japan Institute of Metals, Vol. 16, Issue 7, 1975, pp. 379-383. [61] J.M. Holender, J. Soltys, The studies of the eutectoidal decomposition of Al-59 at.% Zn at the temperature close to the critical temperature, Diffusion and Defect Data-Solid State Data, Pt. A: Defect and Diffusion Forum, Vol. 66-69, 1989, pp. 1461-1466. [62] L.E. Larsson, Pre-precipitation and precipitation phenomena in the Al-Zn system, Acta Metallurgica, Vol. 15, 1967, pp. 35-44. [63] W.M. Pierce, M.S. Palmerton, Studies on the constituent of binary zinc-based alloys, Transactions of the Metallurgical Society of AIME, Vol. 68, 1923, pp. 767-795. [64] H. Auer, K.E. Mann, Magnetic investigation of the aluminum-zinc system, Zeitschrift für Metallkunde, Vol. 28, 1936, pp. 323-326. [65] M.L. Fuller, R.L. Wilcox, Phase changes during aging of zinc-alloy die castings, II-Changes in the solid solution of aluminum in zinc and their relation to dimensional
98
changes, Transactions of the Metallurgical Society of AIME, Vol. 122, 1936, pp. 231-246. [66] A. Burkhardt, Zinc alloys as a substitute material, Zeitschrift für Metallkunde, Vol. 28, Issue 10, 1936, pp. 299-308. [67] K. Lohberg, X-ray determination of the solubility of aluminum and copper in zinc, Zeitschrift für Metallkunde, Vol. 32, 1940, pp. 86-90. [68] W. Hoffman, G. Fahrenhost, Precipitation rates in high purity zinc-aluminum and zinc-copper alloys, Zeitschriftfür Metallkunde, Vol. 42, 1950, pp. 460-463. [69] A. Pasternak, The solidsolubility of metals in lead and zinc, Bulletin International de l'Academie Polonaise des Sciences et des Lettres, Classe des Sciences Mathematiques et Naturelles, Serie A: Sciences Mathematiques Serial A, 1951, pp.177-192. [70] J.L. Murray, The Aluminum-Zinc System, Bulletin of Alloy Phase Diagrams, Vol. 4, Issue 1, 1983, pp.55-73.
[71] S.A. Mey and G. Effenberg, A Thermodynamic Evaluation of the Aluminum-Zinc System, Zeitschrift für Metallkunde, Vol.77, Issue 7 1986, pp. 449-453.
[72] S.A. Mey, Re-evaluation of the Aluminum-Zinc System, Zeitschrift für Metallkunde, Vol.84, Issue 7, 1993, pp. 451-455.
[73] S.L. Chen and Y.A. Chang, A Thermodynamic Analysis of the Al-Zn System and Phase Diagram Calculation, CALPHAD, Vol.17, Issue 2, 1993, pp.113-124. [74] P.S Rudman and B.L Averbach, X-ray measurements of local atomic arrangements in aluminum-zinc and in aluminum-silver solid solutions, Acta Metallurgica, Vol. 2, Issue 4, 1954, pp. 576-582. [75] F.E. Wittig, G. Keil, Heats of mixing of binary liquid aluminum-B-metal alloys (zinc, cadmium, indium, thallium, tin, lead and bismuth), Zeitschrift für Metallkunde, Vol. 54, Issue 10, 1963, pp. 576-590. [76] J.E. Hilliard, B.L. Averbach, M. Cohen, Thermodynamic properties of solid Aluminum-zinc alloys, Acta Metallurgica, Vol. 2, 1954, pp. 621-631. [77] H. Corsepius, A. Münster, On the thermodynamic properties of solid aluminum-zinc alloys, Zeitschrift für Physikalische Chemie, Vol. 22, 1959, pp. 1-19. [78] R.E. Wittig, L. Schoffl, Heat of formation in the aluminum-zinc system at 330, 370 and 430oC, Zeitschrift für Metallkunde, Vol. 51, 1960, pp. 700-707. [79] R.A. Connell, D.B. Downie, The enthalpies of formation of α-phase Al-Zn alloys, Metal Science Journal, Vol. 7, 1973, pp. 12-14.
99
[80] G. Batalin, E.A. Beloborodova, The activity of Al in the liquid, Russian Metallurgy, Vol. 4, 1968, pp. 121-125. [81] B. Predel, U. Schallner, On the thermodynamic properties of binary aluminum alloys containing gallium and zinc, Zeitschrift für Metallkunde, Vol. 60, Issue 11, 1969, pp. 869-877. [82] J. Sebkova, M. Beranek, Application of the EMF method for measurement of aluminum activities in liquid aluminum alloys, Sbornik Vysoke Skoly Chemicko-Technologicke v Praze, B: Anorganicka Chemie a Technologie, Vol. B18, 1974, pp. 217-225. [83] G.J. Lutz, A.F. Voigt, A radioactive tracer dew point method for measuring vapor pressures of binary alloys, the zinc-aluminum system, Journal of Physical Chemistry, Vol. 67, Issue 12, 1963, pp. 2795-2799. [84] P. Bolsaitis, P.M. Sullivan, The activity of zinc in liquid Zn-Al alloys from isopiestic measurements, Transactions of the Metallurgical Society of AIME, Vol. 245, 1969, pp. 1435-1438. [85] A. Yazawa, Y.K. Lee, Thermodynamic studies of the liquid aluminum alloy systems, Transactions of the Japan Institute of Metals, Vol. 11, Issue 6, 1970, pp. 411-418. [86] W. Ptak, L. Zabdyr, Determination of thermodynamic properties of aluminum-zinc solid solutions by EMF measurements, Archiwum Hutnictwa, Vol. 16, Issue 3, 1971, pp. 253-267. [87] R.E. Miller, J.L. Straalsund, D.B. Masson, The effect of electron concentration on the thermodynamic properties of two alloy phases in the Al-Zn-Ag system, Metallurgical Transactions, Vol. 3, 1971, pp. 545-550. [88] V. Piacente, V.D. Paolo, G. D'Ascenzo, The activity of zinc in solid Al-Zn alloys, Thermochimica Acta, Vol. 16, 1976, pp. 63-68. [89] T. Takahashi, N. Asano, Thermodynamic studies of solid aluminum-zinc alloys, Niihama Kogyo Koto SenmonGakko Kiyo, Rikogaku-hen, Vol. 18, 1982, pp. 78-84. [90] ]N. Kono, Y. Tsuchida, S. Muromachi and H. Watanabe, Study of the Al-Ca-Zn ternary phase diagram, Light Metals, Vol. 35, 1985, pp.574-580. [91] G. Cordier, E. Czech and H. Schafer, CaAl2Zn2, The First Example of an “Inverse” ThCr2Si2 Structure, Zeitschrift für Naturforschung, Teil B: Anorganische Chemie, Organische Chemie, Vol. 39B, Issue 12,1984, pp.1629-1632.
100
[92] I.N. Ganiev, M. S. Shukroev and K.M. Nazarov, Effect of phase composition on the electrochemical behavior ofAluminum-Zinc-Calcium alloys, Zhurnal Prikladnoi Khimii, Vol. 68, Issue 10, 1995, pp.1646-1649.
[93]I.N. Gantsev, K.M. Nazarov, M.M. Khakdodov and N.I. Gantseva, Interaction of binary eutectics in Al Zn-Ca (Sr, Ba) Systems, Evtektika V, Mizhnarodna Konferentsiya, Dnepropetrovsk, National Metallurgical Academy of Ukraine, Dnepropetrovsk, Ukraine, 2000, pp.56-58.
[94] M. Pani, L. Fornasini, D. Mazzone and F. Merlo, Structural features of intermetallic phases in the Ca-Zn-Al system, Zeitschrift für Kristallographie, Vol. 224, 2009, pp.397–406
[95] K. Söderberg, M. Bostrom, Y. Kubota, T. Nishimatsu. R. Niewa, U. Häussermann, Y. Grin, and O. Terasaki, Crystal structures and phase stability in pseudobinary CaAl2-
xZnx, Journal of Solid State Chemistry, Vol. 179, Issue 8, 2006, pp. 2690–2697.
[96] M. Pani, L. Fornasini and F. Merlo,The CaAg2—CaZn2—CaAl2 pseudoternary system: crystal structures and structural stability, Zeitschrift für Kristallographie: Vol. 222, Issue 5, 2006, pp. 218-225.
[97] K. Söderberg, Y. Kubota, N. Muroyama, D. Grüner, A. Yoshimura and O. Terasak, Electron charge distribution of CaAl2−xZnx: Maximum entropy method combined with Rietveld analysis of high-resolution-synchrotron X-ray powder diffraction data, Journal of Solid State Chemistry, Vol. 181, Issue 8, 2008, pp. 1998-2005. [98] A.A. Kodentsov, G.F. Bastin, and F.J.J. van Loo, The Diffusion Couple Technique in Phase Diagram Determination, Journal of Alloys and Compounds, Vol. 320, Issue 2, 2001, pp. 207-217. [99] Y. Zhang, D. Kevorkov, F. Bridierand M. Medraj, Experimental study of the Ca–Mg–Zn system using diffusion couples and key alloys, Science and Technology of Advanced Materials, Vol. 12,2011, 025003. [100] Inductively Coupled Plasma Atomic Emission Spectrometer (ICP-AES), Analytical Chemistry Laboratory Manual, Concordia College, 2012. Retrieved from http://www.cord.edu/dept/chemistry/analyticallabmanual/experiments/icpaes/intro.html [101] John Goodge, Electron Probe Micro-analyzer (EPMA), Integrating Research and Education, Carleton College, 2012. Retrieved from http://serc.carleton.edu/research_education/geochemsheets/techniques/EPMA.html [102] Celeste Morris, Bradley Sieve, Heather Bullen, Introduction to X-Ray Diffraction. Retrieved from http://www.asdlib.org/onlineArticles/ecourseware/Bullen_XRD
101
[103] H. Putz, K. Brandenburg, Pearson’s Crystal Data, Crystal Structure Database for Inorganic Compounds, CD-ROM software version 1.3.
102