
Experimental Investigation of Inlet-Combustor …mln/ltrs-pdfs/NASA-95-tp3502.pdfExperimental...
92
NASA Technical Paper 3502 Experimental Investigation of Inlet-Combustor Isolators for a Dual-Mode Scramjet at a Mach Number of 4 Saied Emami Lockheed Engineering & Sciences Company • Hampton, Virginia Carl A. Trexler Langley Research Center • Hampton, Virginia Aaron H. Auslender Lockheed Engineering & Sciences Company • Hampton, Virginia John P. Weidner Langley Research Center • Hampton, Virginia May 1995
Transcript of Experimental Investigation of Inlet-Combustor …mln/ltrs-pdfs/NASA-95-tp3502.pdfExperimental...

NASA Technical Paper 3502
Experimental Investigation of Inlet-CombustorIsolators for a Dual-Mode Scramjet at a MachNumber of 4Saied EmamiLockheed Engineering & Sciences Company • Hampton, Virginia
Carl A. TrexlerLangley Research Center • Hampton, Virginia
Aaron H. AuslenderLockheed Engineering & Sciences Company • Hampton, Virginia
John P. WeidnerLangley Research Center • Hampton, Virginia
May 1995

Printed copies available from the following:
NASA Center for AeroSpace Information National Technical Information Service (NTIS)800 Elkridge Landing Road 5285 Port Royal RoadLinthicum Heights, MD 21090-2934 Springfield, VA 22161-2171(301) 621-0390 (703) 487-4650
Available electronically at the following URL address: http://techreports.larc.nasa.gov/ltrs/ltrs.html

Summary
Experimental studies were conducted in the cold-flow Mach 4 Blowdown Facility (M4BDF) at theLangley Research Center to parametrically investigateinlet-isolator performance in an airframe-integratedramjet/scramjet engine. The inlet-isolator test data pre-sented herein result from both variations in geometry(isolator length and rearward-facing step height) andflow-field properties (boundary-layer thickness andoblique-glancing sidewall shock interaction). These datafrom the coupling of the inlet and isolator provide a por-tion of the parametric database required in a cycle deckto predict inlet-isolator performance over the ramjetenvelope for the design of a hypersonic vehicle.
In order to generate such a database, a generic, two-dimensional, planar inlet-isolator-diffuser model wasdesigned and fabricated to replicate the lines typical of adual-mode scramjet integrated with a hypersonic vehicle(i.e., a design typical of a flight engine). A large andflight-realistic parametric variation of test data wasobtained by providing several interchangeable, rotatingcowls of different lengths and also planar isolator sec-tions of different lengths. The combination of inlet cowlsand isolator sections resulted in a total of 250 geometricconfigurations. The length of the isolator varied from 2.7to 16.7 inlet throat heights by combining sections of dif-ferent lengths. Rearward-facing steps were also intro-duced in the isolator to simulate fuel injector locationsthat are typically used when the isolator section serves asa combustor for supersonic combustion ramjet (scramjet)operation. Each inlet-isolator geometry was also testedwith and without a horizontal forebody plate to alter thethickness of the turbulent boundary layer approachingthe inlet.
The simulation of combustion pressure rise (to studyinlet-combustor isolation) during the ramjet operationalmode was accomplished by back pressuring the modelflow path by using a variable-area throttling mechanism.This mechanism, when attached to the aft end of theisolator-diffuser model, was designed to throttle the flowgradually via a movable flap pivoting about a hinge nearthe throttling device exit. For each geometry tested, backpressuring was increased gradually by closing the throt-tling mechanism until the inlet was forced to unstart.
Model instrumentation included 110 wall static pres-sure orifices mounted flush on the inlet ramp, sidewalls,cowl, isolator, and throttling mechanism sections. Eachdata cycle, which represents the pressure distributionthroughout the model at a given time, was recorded viaan electronic-sensing pressure system that sampled dataat 1 Hz.
The results reveal that the performance of each isola-tor is dependent not only on inlet geometry and forebody
boundary-layer thickness but also on the isolator lengthand isolator step area change. For each inlet cowl, set at agiven deflection angle, the maximum pressure that theisolator could withstand just downstream of the isolatorprior to inlet unstart was denoted as the peak pressure.These peak pressure data were incorporated in all theanalyses to define the performance and set the upperthreshold of the inlet-isolator operation. The results showthat the combined inlet-isolator maximum back-pressurecapability was increased with increasing isolator lengthand increasing inlet contraction ratio, and it wasdecreased by inlet distortion and a rearward-facing steparea increase in the isolator.
Introduction
The coupling of the isolator with the inlet and com-bustor is a necessary component in a hypersonic engineflow path integration over the ramjet (RJ) portion of theflight envelope. The isolator section starts at the mini-mum geometric cross-sectional area of the inlet, oftenreferred to as the “inlet throat,” and it extends to the com-bustor section in the form of a constant-area (or nearlyconstant-area) duct. In the ramjet mode, Billig, Dugger,and Waltrup (ref. 1) recognized the need for inlet isola-tion while testing a hydrogen apparatus. Because of theabsence of an isolator, they used boundary-layer bleed tostabilize the shock system at the burner entrance. How-ever, the boundary-layer bleed enhanced the pressuredrop immediately downstream of the burner entrance.
Yet, in practice, a direct coupling of the inlet andcombustor is a highly optimistic scenario because largeamounts of boundary-layer bleed are required. Flowdistortion at the inlet throat and viscous boundary-layergrowth combined with shock-induced boundary-layerseparation typically will not allow the combustor pres-sure to reach a significant fraction of the normal shockpressure rise before inducing a terminal shock that willunstart the inlet. With sufficient isolator length, the peakpressure in the combustor can gradually reach as much as90 percent of the normal shock pressure rise at the inletthroat with the terminal shock contained within the isola-tor section. However, to achieve 90 percent of the normalshock pressure rise at the inlet throat, a long isolator isrequired and this translates into an increase in vehicletakeoff gross weight (TOGW). Hence designing an isola-tor of such length is unrealistic. Consequently, an opti-mal isolator length that yields a large percentage of thenormal shock pressure rise at the inlet throat with shortlength scales will result from trade-off studies of inte-grated components over the flight trajectory.
Two interdependent functions are ascribed toisolators. First, isolators are expected to behave as abuffer zone between the inlet and combustor in order toimpede or, at least, to minimize interferences between

2
components. In this case, the isolator is required to per-mit continuous inlet operation over the specified speedrange while withstanding the high peak pressure risesthat originate in the combustor section. The second func-tion of the isolator is to diffuse the supersonic flow to asubsonic condition and maximize recovery of the totalpressure that is vital to efficient operation of both theinlet and combustor in the ramjet mode. Pratt and Heiser(ref. 2) used the “H-K” (thermal energy versus kineticenergy) coordinates to explore and analyze the complexinteractions between system components (isolator andburner) in dual-mode combustion systems. They con-cluded that the nature of interaction between the isolatorand combustor is different for ramjet and scramjet opera-tions. In the ramjet operational mode, a constant-area iso-lator must contain a shock system consistent withsubsonic combustion pressure rise. Whereas in thescramjet operational mode, heat addition in a constant-area combustor occurs in a separated core flow at nearlyconstant pressure equal to the maximum pressure rise atthe combustor exit.
The flow process in the isolator in the ramjet opera-tional mode is a series of complex multiple interactionsof shock waves with the turbulent boundary layer, usu-ally referred to as a “normal shock train.” The formationof this shock train initiates inside the combustor andprogresses upstream in the isolator section as the com-bustor pressure increases because of heat release. Thelocal heat release compresses the flow streamlines in thecombustor. The streamline compression creates a block-age that grows in size with the increase of pressurebecause of the fuel heat release in the scramjet combus-tor. If the blockage is too great or the isolator duct is tooshort, the shock train disturbance can extend upstreaminto the inlet and cause inlet instability or unstart.
Existing experimental data on shock-wave–boundary-layer interactions in constant-area (or nearlyconstant-area) duct flows are mostly in the form ofschlieren photographs and wall static pressure measure-ments. E. P. Neumann and F. Lustwerk concluded in1947 that the length of a normal shock train in aconstant-area duct can be determined by the flow area ofthe boundary layer relative to the total cross-sectionalarea of the duct and by the Mach number immediatelyupstream of the initial location of the shock train.McLafferty et al. (ref. 3) presented the following conclu-sions from their tests in a constant-area passage having acircular cross section: (1) the pressure recovery will bemaximized if the length of the isolator duct is approxi-mately equal to the length of the shock train, (2) thelength of the shock train required to obtain the completestatic pressure rise increases with an increase in either theboundary-layer thickness relative to the duct diameter orthe average Mach number upstream of the shock train,
and (3) the profile at the exit of the subsonic diffuserbecomes less uniform if the length of the isolator (for asupersonic inlet) is less than the length of the shock train.
With the advent of the National Aero-Space Plane(NASP) Program, development and application ofnumerical techniques to solve nonlinear aerodynamicsand propulsion problems, such as the inlet-isolator prob-lem, have increased. Hataue (ref. 4) used the second-order Total Variation Diminishing (TVD) techniquebased on two- and three-dimensional Navier-Stokesequations to investigate shock-wave–boundary-layerinteractions in rectangular and circular cross-sectionalarea ducts. His results showed a bifurcated shock patterna short distance ahead of the point where the essentiallyperpendicular “normal” shock wave impinges on theboundary layer. As the interaction became stronger, theshape of the shock wave changed from a bifurcatedshock to a cross-shaped shock pattern. Lin, Rao, andO’Connor (refs. 5 and 6) also numerically simulatedflows in a two-dimensional (2-D) constant-area duct withan inflow Mach number of 3.0. They used Reynolds-averaged compressible Navier-Stokes equations with theBaldwin-Lomax zero-equation model for flows outsiderecirculation zones and a backflow turbulence modelwithin the recirculation zones. They examined the effectof the back pressure, confinement, and inflow Machnumber on the formation and pattern of the oblique shocktrain and its interaction with the turbulent boundarylayer. Hunter and Couch (ref. 7) modeled a three-shockinlet at a Mach number of 3 coupled with an isolator testarticle and used a 2-D Navier-Stokes code to study flowphysics and shock-train characteristics. Area variation,created by manipulating a flow plug deployed in thedownstream diffuser section, was used to simulate com-bustion pressure rises. The converged analytic solutiondemonstrated the spatially oscillatory nature of thecenterline Mach number undergoing recompressions andreaccelerations. The study also concluded that turbulencemodeling is highly critical for shock-train and shock–boundary-layer predictions.
Carroll and Dutton (refs. 8 and 9) used a nonintru-sive, two-component laser Doppler velocimeter (LDV)to characterize the flow physics and parameters of a flowat a Mach number of 1.61 that generated a multiplenormal-shock–turbulent-boundary-layer interaction in arectangular duct. Their results indicated that the shock-train system consists of a series of symmetric normalshocks in which the first shock is bifurcated, has incipi-ent separation at its foot, and is followed by severalweaker, nearly normal shocks. The velocity componentdata revealed that two similar expansion processesoccurred after both the bifurcated and the unbifurcatedshocks. Each expansion originates near the wall andforms an aerodynamic converging-diverging nozzle

3
effect in the core flow. Measured streamwise centerlineMach number distributions and, consequently, thecenterline static pressure distribution showed temporallysteady, spatially oscillatory behavior with gradual damp-ening from supersonic to subsonic through the shocktrains. From an examination of Mach number distribu-tions on the flow centerline, one can infer that the smoothrise in the wall static pressure distributions is in sharpcontrast with the oscillatory centerline static pressuredistribution.
Although research on isolators, specifically isolatorswith circular cross sections, has been extensive, little ofthat work, if any, has included flow distortions ahead ofthe planar isolator created by actual coupling of bothinlet and isolator flow fields. The tenet of this report is todocument isolator operational characteristics in terms ofisolator pressure rise and shock-train length as a functionof aerodynamics flow properties that are inherent in thecoupling of the isolator with both the inlet and the com-bustor, such as flow distortion due to boundary layersand shock waves. To achieve this goal, an extensiveparametric test program was conducted to create a data-base necessary for the design of a ramjet inlet-combustorisolator for a vehicle in ramjet operation mode for afuture high-speed vehicle. Combinations of different iso-lator lengths with and without rearward-facing stepswere coupled to an inlet with three different rotatingcowl lengths to investigate the maximum pressure rise inthe isolator as a result of mechanically induced combus-tor back pressure.
Symbols and Abbreviations
Acap area of inviscid stream tube captured by inlet,HcapW
Acap, act area of actual (viscous) stream tube capturedby inlet
Ag area of glow path at cowl lip station,HgW(geometric)
Am frontal of inlet,HmW
Ath geometric throat area,HthW
Ath, a aerodynamic throat area
B.L. boundary layer
Cf skin-friction coefficient,τw/qedge
CAP inlet mass capture ratio,Acap, act/Am
CR inlet geometric contraction ratio,Hcowl/Hth
(CR)a inlet aerodynamic contraction ratio,Hcap, act/Hth
(CR)i inlet geometric internal contraction ratio.Hg/Hth
H boundary-layer shape factor,δ* /θHcap height of inviscid stream tube captured by
inlet (fig. A1)
Hcap, act height of actual (viscous) stream tube capturedby inlet (fig. 5)
Hcowl height of cowl leading edge (fig. 3)
Hg height of flow path at cowl lip (fig. A1)
Hm model height, 2.30 in. (fig. 3)
Hth inlet throat or isolator entrance height, 0.4 in.(fig. 3)
I.D. inside diameter
L isolator length, in.
LC long cowl
Lc inlet cowl length (figs. 4(d) and A1), in.
Lr length of compression ramp to inlet throat,9.77 in. (figs. 4(a) and A1)
Ls isolator length up to rearward-facing step, in.
M Mach number
MC medium cowl
max. maximum
NRe Reynolds number
O.D. outside diameter
p pressure, psia
ps isolator maximum pressure before inletunstart, psia
q dynamic pressure, (ρU2)edge/2
R gas constant, ft-lbf/(lbm-°R)
Ref. reference
rad. radius
SC short cowl
St. station
Tt total temperature,°RU maximum boundary-layer-edge velocity,
calculated from pitot measurements(fig. 6), ft/sec
u local streamwise velocity, ft/sec
W model geometric width, 2.0 in.
X axial distance from leading edge of compres-sion ramp, in.

4
x' static orifice position inx-direction, relative toreference plane (fig. 4)
y Cartesian coordinate in vertical direction, in.
z' static orifice position in z-direction, relative tomodel centerline (fig. 4)
α precompression ramp angle, 11° (figs. 3and A1)
β inlet convergence angle, deg (figs. 3 and A1)
γ specific heat ratio
δ boundary-layer thickness, in.
δ∗ boundary-layer displacement thickness, in.
θ boundary-layer momentum thickness, in.
θc cowl angle relative to free stream, deg (figs. 3and A1)
θr angle of shock wave generated by compres-sion ramp and ramp boundary layer(fig. 5), deg
θs shock turning angle, deg (fig. 5)
θw angle of shock wave generated by inviscidflow over compression ramp (fig. A1), deg
µ air viscosity, lbf-sec/ft2
ρ density, lbm/ft3
τw wall shear stress, psi
Subscripts:
a aerodynamic
act actual
cap captured
edge condition within 1 percent of free stream
N.S. condition behind normal shock
t total conditions
th throat conditions
1 free-stream conditions
2 after normal shock ahead of pitot tube
Development of Experimental Configuration
Test Facility and Conditions
The Mach 4 Blowdown Facility (M4BDF) at theLangley Research Center was used for this experimentalinvestigation. The test section, which has a 9- by 9-in.cross section, is nominally 15 in. long with glassschlieren windows enabling photographs to be made.The total pressure can be varied and set at any pressurebetween 150 and 250 psia (a unit Reynolds number vari-ation between 15.75× 10⁶ and 26.25× 10⁶ per foot). Thetwo-dimensional fixed-geometry facility nozzle is capa-
ble of supplying a steady cold airflow to the test sectionfor a nominal test time of 2.0 minutes. Calibration of theM4BDF (in unpublished data) revealed that the nozzlehad a core flow Mach number of . The maxi-mum permitted aerodynamic blockage created by a sharpleading-edge model in the tunnel is approximately13 percent for a flow-through model.
The facility stilling chamber delivered air to the testsection at a nominal Reynolds number and a total pres-sure of 21× 106 per foot and psia, respectively,to all model configurations during the course of this testseries. At these conditions, the tunnel free-stream staticpressure entering the test section is . Allother tunnel test conditions were invariant during thecourse of these tests with the exception of tunnel-flowtotal temperature. This was unavoidable because of avariation of atmospheric temperature and the absence ofa flow heater. The tunnel-flow total temperature variedbetween and during thisperiod.
Errors introduced into the test data due to a slightvariation in the tunnel operating condition (with a totalpressure of psia and a static pressure of
psia) are classified as accuracy errors orsystematic errors. To eliminate accuracy errors in testdata, all test data were nondimensionalized by tunnelstatic pressure for each test run. The precision error dueto instrumentation and to each pressure gauge is
percent maximum for any static pressure readings.The examination of test data showed that the data wererepeatable.
Test Model
The two-dimensional inlet-isolator model wasdesigned at 2-percent scale to replicate the generic fea-tures of a hypersonic, air-breathing lifting-body propul-sion system. It included inlet compression, an isolator,step area changes in the isolator using rearward-facingsteps (which simulate fuel-injector locations for thescramjet mode of operation), and an expanding sectiondownstream of the isolator. A portion of the expandingsection served as a diffuser during the ramjet mode ofoperation; however, the entire expanding section servesas a nozzle during the scramjet mode of operation. Here,the expanding section is referred to as a “diffuser” for thepurpose of consistency with the goals of these experi-mental investigations at the ramjet mode of operation.Figure 1 shows the uninstalled model with various partslabeled. To achieve parametric model variations, themodel was constructed from wedges and blocks to alloweasy fabrication and simple assembly. Schematic dia-grams of the cross section, dimensions, and instrumenta-tion layouts for the 2.0-in-wide and 2.3-in-high test
4.03 0.02±
200 2±
1.266 0.034±
500°R 3°R± 540°R 3°R±
200 2±1.266 0.034±
0.25±

5
model are shown in figures 2, 3, and 4, respectively. Thewetted surfaces that enclose the flow path consist of threemajor flow categories: inlet, isolator, and combustor/diffuser.
The model inlet consists of a compression ramp,interchangeable cowls, flow fences, and a portion of thesidewalls. The inlet compression ramp was designed tosimulate a portion of any generic vehicle forebody. The11° compression ramp is 9.77 in. long and changesabruptly to a flat (0°) surface which marks the inlet throatand the beginning of the isolator section. The purpose ofthe 60° sweptback fences (fig. 1(a)) is threefold: to con-tain the shock wave generated by the 11° compressionramp, to prevent spanwise flow spillage on the ramp, andto bleed (or divert) the corner boundary-layer flow gener-ated by the fences themselves (to minimize three-dimensional distortions of the flow entering the inlet).The corner flow bleeding was accomplished through twoopen gaps just before the mainstream core flow enteredthe enclosed portion of the inlet. The compression rampand the fences remained unchanged for all test configura-tions. The inlet geometry parameters included three dif-ferent cowl lengths (fig. 5). Each cowl was used withvarious isolator lengths to examine the effects of inletdistortion created by cowl length variations on peak pres-sure in the isolators. Each cowl angle associated witheach cowl length generates a different Mach number atthe throat as the result of variations in shock patterns(fig. 5), captured mass, and inlet contraction ratio (aero-dynamic and geometric). The compression ramp turnsthe flow 11°, and the interaction of the flow with thecowl generates a cowl shock whose strength and numberof shocks in the inlet depend on the cowl angle and cowllength. The strongest cowl shock is generated when thecowl is not deflected (i.e., the cowl internal surface isparallel to the free-stream flow upstream of the model).To change the cowl angle, each cowl was designed torotate about a hinge that was located 0.4 in. above theend of the compression ramp where the geometric throatstarts. (The O-ring was placed behind the hinge point toprevent mass spillage.) The cowl rotation angle was setby an actuator mounted outside the tunnel. The geomet-ric throat cross-sectional area (0.4 in. high and 2 in.wide), remained fixed for all test configurations, thusallowing the inlet exit or isolator entrance to maintain anaspect ratio of 5.0.
The effect of incoming boundary layer on the inletoperability and, consequently, on the isolator pressurerecovery was also examined. A flat plate extending 12 in.upstream of the compression ramp was added to alter theincoming flow boundary layer on the body side of themodel. For comparison, each configuration was testedwith and without the flat plate, and the results of each are
referred to as “thick” and “thin” turbulent-boundary-layer configurations, respectively.
Two types of isolators were used in the test matrices:(1) a constant-area variable-length isolator with andwithout steps followed by a diffuser section expandingabruptly at 20°, and (2) a constant-area isolator followedby a 6° expanding isolator which, in turn, is followed bya diffuser section expanding at 20° (fig. 4(c)). Theexpanding isolator was chosen to compare the resultswith that of constant area in terms of pressure rise. Thefirst of the two isolators was used extensively in the testmatrices. The isolator section of the model, on the bodyside behind the ramp, could be arranged in several con-figurations by using combinations of three interchange-able blocks (fig. 4(b)) followed by the aft diffuserwedges (fig. 4(c)). The aft wedges forming the nozzlesection of the model extended some length into the throt-tling device section and could slide axially in order toinsert or remove isolator blocks of different lengths. (Thelocation of aft wedges with different isolator lengths isshown by dashed-lines in fig. 3.) Three interchangeableaft cowl plates (fig. 4(e)), two with a 0.028-in. step(7 percent increase in geometric throat) and one withouta step, formed the top half of the isolator section. The aftcowl mated directly with the throttling device interfaceshown in figure 4(g).
The two-dimensional throttling device was used toback pressure the model in order to simulate combustionpressure rise. The throttling device was 2.043 in. wideand 2.75 in. high and utilized a variable-throat mecha-nism that was actuated by an electric motor. During atest, the movable flap on the throttling device was closeduntil the throttling device forced a shock train upstreamtoward the inlet throat. Back pressuring of the isolatorand inlet was then continued by closing the throttlingdevice flap until the inlet unstarted. The schematic dia-gram in figure 2 shows the interfaces between the differ-ent model parts and the throttling device.
Model Configurations
The inlet-isolator model was designed to establish aparametric database necessary for the design and trade-off studies of air-breathing lifting-body hypersonic vehi-cles over the ramjet envelope. The 11° forebody com-pression ramp and 0.4-in-inlet geometric throat heightremained the same for all configurations in the test matri-ces. Model parametric variations consisted of threedifferent inlet cowl lengths (i.e., the cowl length dividedby the inlet geometric throat height (Lc/Hth) of 6.25,9.75, and 11.00) with different isolator lengths (i.e., theisolator length divided by the inlet geometric throatheight (L/Hth) of 2.7, 4.7, 8.7, and 16.7), each with andwithout rearward-facing steps. The rearward-facing steps

6
(0.028 or 0.050 in. on the body side and 0.028 in. on thecowl side) replicate fuel injectors used in supersoniccombustion ramjets (scramjets) and generate a stepincrease in isolator cross-sectional area. The stepslocated in the isolator were at 0.68 in., or 2.68 throatheights downstream of the inlet throat. The steps wereconstructed by positioning and adjusting a shim of spe-cific thickness underneath the isolator blocks on the bodyside (fig. 3). The steps on the cowl side were made byusing different aft cowl sections (aluminum), as shown infigure 4(e). The isolators without rearward-facing stepshad a constant area throughout the length of the isolator.The body side of all the isolators was joined with thestep-expansion diffuser section followed by the throttlingdevice. In addition, a 6° diffuser section (fig. 4(c), lowerview) was fabricated and tested together with constant-area isolator lengths (L/Hth) of 4.7 and 8.7; the resultswere compared with constant-area isolators of the samelength. The 6° expanding diffuser section also expands to20° and matches with the lines of the throttling device.Tables I–III present a compilation of each model config-uration that consisted of different geometric parametersfor each inlet-isolator and isolator-nozzle combination.
Test Procedure, Data Acquisition, and Analysis
The principal objective of this test series was toobtain test data that are descriptive of the performance ofinlet-isolator and isolator-combustor combinations thatare representative of dual-mode flight scramjets. Duringthe test duration of 2.0 minutes, the cowl angle andthrottling-device exit opening were remotely actuated.For a given configuration, a test was first conducted inwhich the throttling device was left at the most open set-ting to minimize pressure disturbance upstream (to simu-late the no-fuel case), and then the cowl, which wasinitially parallel to the inlet ramp, was slowly rotatedopen until inlet unstart was detected. The cowl was thenslowly rotated closed until the inlet restarted and the tun-nel was shut down. A static pressure orifice on the ramp,opposite the cowl leading edge, was continuously moni-tored to detect inlet unstart and restart. With a knowledgeof the inlet operational map for each cowl, subsequenttests of that configuration consisted of choosing specificcowl angles and slowly closing the throttling device untilthe inlet unstarted. The inlet unstart is caused by dis-gorgement of a terminal shock out of the isolator into the
Table I. Inlet-Isolator Configurations forL/Hth = 2.7 and 4.7 With Diffuser Angle of 20°
Ls/Hth = 0.7 Ls/Hth = 2.7
Cowl length,in.
Boundary-layer plate
Body-side stepheight = 0.05 in.
Cowl-side stepheight = 0.028 in.
Body-side stepheight = 0.05 in.
Cowl-side stepheight = 0.028 in. Plotfiles Runs
L/Hth = 2.7
4.4(LC)
cofi6 41–49
✓ cofi6 54–57
2.5(SC)
cofi5 36–40
✓ cofi5 58–61
L/Hth = 4.7
4.4(LC)
cofi10 105–108
✓ cofi10 101–104
✓ ✓ cofi10 85–88
✓ ✓ ✓ cofi10 89–92
✓ ✓ cofi8 70–73
✓ ✓ ✓ cofi8 66–69

7
inlet section (induced by an excessively high back pres-sure generated by the throttling device).
Aerodynamic contraction ratio, internal geometriccontraction ratio, and inlet mass capture ratio are param-eters that are used to define inlet performance for differ-ent cowl lengths and cowl angles. These inletperformance parameters are defined and quantified in theappendix.
Ninety-six static pressure orifices (0.060-in. O.D.and 0.040-in. I.D.) were installed in axial and spanwisearrays throughout each model configuration; an addi-tional nine static pressure orifices were located in thethrottling device. While closing the throttling deviceslowly to increase back pressure, electronic scanningpressure (ESP) units with four modules simultaneouslyswept data throughout the flow path at 1-Hz intervals(the sampling rate frequency); each module had 32 pres-sure ports. Each data sweep throughout the model flowpath is referred to as a “cycle.” Thus, 120 cycles of datathroughout the flow path were obtained within the 2 min-utes of testing. At the end of each test run, the data stored
in the data acquisition and control unit were transferredto a 386 PC (33 MHz) computer with a 200 megabytehard drive. The flow meter and cowl positions were alsorecorded via two analog/digital (A/D) multiplexer units.Programs in Microsoft QuickBASIC language permittedplotting the data immediately after each test and compar-ing it with data taken from previous configurations.
Results and Discussion
A brief introduction to the forthcoming results anddiscussion is pertinent if one decides not to follow eachsection of this report sequentially. The “Results and Dis-cussion” section of this report is divided into the follow-ing eight major sections:
1. State of Local Boundary Layer: Pitot measure-ments were used to investigate the state of the localboundary-layer flow at the entrance to the enclosed por-tion of the inlet and to quantify boundary-layer displace-ment thickness for both configurations with and withoutthe foreplate. (See fig. 6.)
Table II. Inlet-Isolator Configurations forL/Hth = 4.7
Ls/Hth = 0.7 Ls/Hth = 2.7
Cowllength, in.
Boundary-layer plate
Body-side stepheight = 0.05 in.
Cowl-side stepheight = 0.028 in.
Body-side stepheight = 0.05 in.
Cowl-side stepheight = 0.028 in. Plotfiles Runs
L/Hth = 4.7 with diffuser angle of 20°
3.9(MC)
cofi10a 187–189
✓ cofi10a 190–192
2.5(SC)
cofi9a 109–113
✓ cofi9a 97–100
✓ ✓ cofi9a 78–81
✓ ✓ ✓ cofi9a 94–96
✓ ✓ cofi9 74–77
✓ ✓ ✓ cofi9 62–65
L/Hth = 4.7 with diffuser angle of 6° turning into 20°
4.4(LC)
cofi12 118–121
✓ cofi12 122–124
2.5(SC)
cofi11 114–117
✓ cofi11 125–128

8
2. Inlet Design and Operation: This section describesboth the fundamental philosophies behind the design ofthe inlet compression ramp (the external part of the inlet)and the three inlet cowl lengths (the internal portion ofthe inlet); in addition, this section is also followed by adiscussion of the interaction of each cowl shock with theexpanding flow at the inlet geometric throat (shoulder)and the movement of the aerodynamic throat of the inletfor the short cowl configuration at low inlet convergenceangles (low contraction ratio). (See figs. 7–11.)
3. Inlet Throat Flow Properties: Static pressure tapmeasurements, located on the body side and cowl side ofthe inlet geometric throat, were area averaged in order todefine the inlet throat flow properties (Mach number,total pressure, and size of the aerodynamic throat area).The inlet throat properties are used to separate isolator
performance from that of the inlet and to evaluate theeffectiveness of the isolator (item 8 listed below) as a sin-gle unit with the presence of inlet effects on isolatorinflow at the junction of the inlet and the isolator. (Seefigs. 12–15.)
4. Inlet Unstart and Restart Characteristics: The trig-gering of inlet unstart is described in this section, whichshows that all the inlets unstarted at about the same inletconvergence angle independent of cowl length, inlet con-traction ratio, and inlet mass capture; in addition, thissection is followed by a short discussion about unstartpressure load. (See figs. 16–18.)
5. Isolator Back-Pressure Characteristics: Both therequired isolator length to contain a full shock-trainlength and the minimum and maximum back pressures to
Table III. Inlet-Isolator Configurations forL/Hth = 8.7 and 16.7
Ls/Hth = 0.7 Ls/Hth = 2.7
Cowllength, in.
Boundary-layer plate
Body-side stepheight = 0.05 in.
Cowl-side stepheight = 0.028 in.
Body-side stepheight = 0.05 in.
Cowl-side stepheight = 0.028 in. Plotfiles Runs
L/Hth = 8.7 with diffuser angle of 20°
4.4(LC)
cofi2 9–14
✓ cofi2 15–18
✓ ✓ cofi4 30–32
✓ ✓ ✓ cofi4 25–28
2.5(SC)
cofi1 1–8
✓ cofi1 19–21
✓ ✓ cofi3 33–35
✓ ✓ ✓ cofi3 22–24
L/Hth = 8.7 with diffuser angle of 6° turning into 20°
4.4(LC)
167
L/Hth = 16.7 with diffuser angle of 20°
4.4(LC)
cofi14 134–137
✓ cofi14 147–151
2.5(SC)
cofi13 138–142
✓ cofi13 143–146

9
simulate the effects of no-fuel and maximum-fuel frac-tion that can be added without unstarting the inlet are dis-cussed in this section for inlets with three different cowllengths at the maximum and at a medium contractionratio. (See fig. 19.)
6. Maximum Capability of Inlet-Isolator Back Pres-sure: This section shows the maximum inlet-isolatorpressure rise that each isolator was able to sustain beforethe inlet unstarted. The discussion in this section evalu-ates the inlet and isolator operation as a single unit over awide range of inlet contraction ratios. (See figs. 20–24.)
7. Effects of Inlet Flow Distortion on Inlet-IsolatorMaximum Pressure: Inlet losses attributed to a specificinlet cowl length are quantified in terms of the relativeimpact of those losses on inlet-isolator maximum-pressure capability for all the inlet configurations tested,with a common isolator length over a range of inlet con-traction ratios. (See figs. 25–32.)
8. Isolator Effectiveness: The effectiveness of an iso-lator as a single component, independent of the inlet, isevaluated in this section for a wide range of inlet contrac-tion ratios. Isolator effectiveness is of significance duringthe course of a design process when assessing thecontribution of various isolator lengths to the overallvehicle performance level (i.e., installed thrust). (Seefigs. 33–35.)
All the figures presented under items 6, 7, and 8 areplotted in terms of inlet contraction ratio. During thecourse of a realistic design and flow path trade study, oneis typically required to evaluate different inlet-isolatorconfigurations with the same mass capture. Thus, theinlet contraction ratio (see the appendix) and the data arepresented in a manner consistent with this objective.
Note, with the help of figure A2 (which shows con-traction ratio versus convergence angle for each inlet)and figures 12, 13, and 14 (which show the inlet throatflow properties), data versus convergence angle or otherinlet throat flow properties are obtainable.
State of Local Boundary Layer
Pitot measurements were obtained to investigate theboundary layer entering the model body side for inlet-isolator configurations both with and without theboundary-layer foreplate. A single 0.060-in. O.D. pitottube was flattened to 0.032 in. (ellipse minor axis) tomeasure the boundary-layer pitot pressure 6.81 in. in theaxial direction downstream from the compression rampleading edge (fig. 3). The forward cowl was removed forthese boundary-layer measurements; however, the rela-tive locations of these boundary-layer measurements
vary with respect to each inlet cowl leading edge. Theselocations are 0.46 in. upstream of theLc/Hth = 6.25 cowlleading edge, 0.94 in. downstream of theLc/Hth = 9.75cowl leading edge, and 1.44 in. downstream of theLc/Hth = 11.00 cowl leading edge. The dimensions hereare expressed with respect to the cowl leading edgeswhen the cowls are at 0° cowl incidence (at inlet conver-gence angles of 11°). The measurements started 0.016 in.away from the wall and moved outward radially throughthe boundary layer to the free stream.
To convert pitot profile data to velocity and Machnumber profiles with the use of measured wall staticpressure, assumptions are made that include an adiabaticwall and a Prandtl number of unity. Thus, the recoverytemperature at the wall (Twall) is equal to the flow totaltemperature (Tt). In addition, an empirical power-lawvelocity profile for turbulent boundary layers was chosento compare with the experimental velocity profile. Expo-nents (n) of 1/7 and 1/10, which are universally acceptedto define fully turbulent flows, were used to model theexperimental velocity profiles (note that this generalform of velocity profile does not apply in the viscoussublayer region):
(1)
The results from the thin-boundary-layer experi-ments (without the forebody plate) show that the velocityprofiles from the pitot pressure data and the 1/7 powerlaw are in close agreement (fig. 6(c)). However, for thethick boundary layer (with the forebody plate), the 1/10power-law velocity profile is in close agreement with thepitot-pressure-derived velocity profile. Figure 6(c) alsoshows that the boundary-layer thicknesses are approxi-mately 55 and 25 percent of inlet geometric throat heightfor thick and thin boundary layers entering the inlet,respectively. Figure 6(d) shows the Mach number pro-files for the thin and thick boundary layers.
Quantification of local boundary-layer characteris-tics, except for the skin-friction coefficients, for both thinand thick boundary layers was numerically integratedfrom experimental data (pitot pressure profiles), andresults are presented in table IV. A comparison of theshapes of two velocity profiles close to the wall(fig. 6(c)) also shows that the wall skin friction is higherfor the thin boundary layer than for the thick boundarylayer. Obtaining the skin-friction coefficient from thedata was not possible because of the limited spatial reso-lution of the measurements near the wall. Thus, theskin-friction coefficient was calculated from asemi-empirical equation (ref. 10) valid for compressible
uUedge-------------
yδ--
1/ 7=

10
turbulent flow up to a Mach number of 4. This is writtenas
(2)
where
based on the boundary-layer-edge condition, which isdefined as the distance from the wall to the point wherethe velocity is within 1 percent of the free-stream veloc-ity. Boundary-layer-edge conditions for both the thinboundary layer and the thick boundary layer are
In these calculations, the length (l) is measured from theleading edge of the wetted surface andγ = 1.4.
Inlet Design and Operation
The inlet was designed to diffuse the approachingsupersonic air at a Mach number of 4.03 in a mannerconsistent with current inlet-flow-path design for lifting-body hypersonic vehicles with two-dimensional planarsurfaces. In all test cases, the external compression pro-cess was accomplished by a shock from the wedge,which simulated a portion of a hypersonic vehicle fore-body. A significant amount of the compression was alsoaccomplished internally, where the process in the inletwas completely enclosed by the cowl, sidewalls, andcompression ramp (fig. 3). The cowl shock glances alongthe inlet sidewalls and impinges on the compressionramp. Depending on the inlet cowl length, the inlet cowl
Cf0.472
log10NRe( )2.581
γ 1–2
-----------Medge2
+ 0.467
--------------------------------------------------------------------------------------------=
NRe
ρUl( ) edge
µedge--------------------------=
ρU( ) edge 127.18 lbm/ft2-sec=
Uedge 2010.36 ft/sec=
Tedge 160.25°R=
11°
shock could reflect several times from the compressionramp and cowl as it progressed toward and into the inletthroat area (fig. 5).
For all configurations, regardless of the inlet cowllength or angle, the level and distribution of pressure onthe forward portion of the ramp are the same (figs. 7(a)–9(a)). An analysis of the ramp pressure level indicatesthat the combined effects of the 11° compression rampand boundary layer produce approximately an equivalent12° inviscid compression flow turn (fig. 5(b)). Asexplained earlier, the state of flow properties through theboundary layer was measured by using a pitot rake forconfigurations with and without forebody plate exten-sion. The boundary-layer displacement thickness wascalculated from the integration of velocity profileobtained from pitot data, and the resulting mass deficitthrough the boundary layer was taken into account in thecalculation of inlet capture height and contraction ratio.(See the appendix.)
For internal compression, three inlet cowl lengthswere designed and tested in order to produce differentlevels of flow distortion (skewed flow profiles) at theinlet geometric throat, where the inlet flow enters andinteracts with the isolator. The distortion results from theinteraction of uncancelled shocks with expansion waves,which originate from the inlet and shoulder. Asexplained previously, the design for each cowl lengthwas based on the number of two-dimensional inviscidshocks theory. The short 2.5-in-long cowl (fig. 5(a)) wasdesigned to compress the inlet internal flow through twoshocks. From an inviscid point of view, the latter shockimpinges on the cowl just upstream of the throat at anangle initially equal to the inlet convergence angle, it isstrengthened by the compression corner formed by thehinge, and it reflects back into the isolator section at 11°.Meanwhile, on the ramp opposite the compression cor-ner, flow expands at 11° as it enters the isolator section.The strong cowl shock and ramp corner expansion waves
Table IV. Local Boundary-Layer Characteristics With and Without Foreplate on Compression RampBehind Wedge Shock Based on Pitot Probe Data
[Located axially 6.81 in. downstream from compression ramp leading edge]
ConfigurationBoundary-layerthickness,δ, in.
Boundary-layerdisplacement
thickness,δ* , in.
Boundary-layermomentum
thickness,θ, in.Shape factor(H = δ* /θ)
Skin-frictioncoefficient,Cf
Model without foreplate(thin boundary layer)
0.1 0.036 0.0185 1.946 0.00207
Model with foreplate(thick boundary layer)
0.23 0.073 0.0425 1.717 0.00174

11
are expected to create a distorted flow into the isolatorsection that can affect isolator performance.
Figures 5(b) and 5(c) also show shock patterns forboth the medium and long cowls (Lc/Hth = 9.75 and11.00, respectively). To reduce the inlet throat distortionlevels entering the isolator and simultaneously toincrease the inlet contraction ratio and throat staticpressure, theLc/Hth = 9.75 cowl was designed based on2-D inviscid shock theory to produce a three-shock-wavereflected system within the inlet. Focusing the thirdshock on the ramp shoulder, independent of inlet conver-gence angle, was desirable in order to eliminate expan-sion waves. This configuration is commonly referred toas the “shock on shoulder” condition. TheLc/Hth = 11.00cowl length is also a three-shock-wave reflected system.The third shock impinges on the inlet ramp upstream ofthe 11° expansion corner at the shoulder. In contrast totheLc/Hth = 9.75 cowl, where the third shock is focusedon the shoulder to minimize the distortion level to theisolator inflow, the isolator inflow distortion with aLc/Hth = 11.00 cowl is caused by the presence of expan-sion waves from the shoulder and two discrete shockwaves from the ramp and the cowl in the isolator section.Also note that the final shock impingement point movesless than 0.20 in. over the range of the inlet-cowl conver-gence angle.
Figures 7, 8, and 9 show the effects of cowl conver-gence angle on inlet pressure distributions on the rampand on the cowl for the cowl lengths (Lc/Hth) of 6.25(2.5 in.), 9.75 (3.9 in.), and 11.00 (4.4 in.), respectively.From these figures, the examination of the pressurevariations at the junction of the inlet and isolator alsoindicates the inlet flow distortion specific to each cowl.In each figure, the “a” and “b” parts denote the thinincoming turbulent-boundary-layer configurations andthe “c” and “d” parts denote the thick configurations.Figure 7 shows the consistent progression of inlet pres-sure rise with increase in convergence angles for boththin and thick boundary-layer configurations with a cowllength ofLc/Hth = 6.25. For a given convergence angle,the pressure rise on the body side increases; it starts at8 in. and reaches a maximum pressure plateau beforeflow expansion begins at the inlet geometric throat,which reduces the pressure. Pressure distributions on thecowl show that the pressure rise, which starts at 8.8 in.from the compression surface leading edge on the cowl,is eventually reduced by expansion waves and extendsinto the isolator. The inlet throat flow distortion in thevicinity of the inlet-isolator junction for theLc/Hth = 6.25cowl design becomes evident when examining the steepdecrease (flow expansion) and increase (flow recompres-sion) of the body-side surface pressure, and also theincrease and decrease of the cowl-side surface pressure.
Compared with the same configuration with thethin boundary layer, the addition of the boundary-layerplate decreased the maximum operational inlet conver-gence angle before inlet unstart by about 1° (figs. 7(c)and 7(d)).
Figures 8(a) and 8(b) show the partial cancellation ofthe shock on the ramp shoulder for theLc/Hth = 9.75cowl over a wide range of convergence angles, with theexception of 10° for thin and 8.6° for thick boundary lay-ers. At this high convergence angle, the sudden rise inpressure level slightly upstream from the geometricthroat in the inlet could be attributed to the formation of aseparated zone feeding upstream in the inlet and/or aslight misalignment of the third shock shifting forward inthe inlet and finally reflecting into the isolator section.The magnitude of this pressure rise is less pronouncedfor the thick boundary layer. For theLc/Hth = 9.75 cowl,the thick boundary layer (figs. 8(c) and 8(d)) reduces theoperational inlet convergence angle by 1.4° (or by14 percent) before inlet unstart (from 10° to 8.6°), and italso increases the throat pressure on both the ramp andthe cowl when comparing the same convergence anglesfor the thin boundary layer (figs. 8(a) and 8(b)).
Figure 9 shows the pressure distributions withinthe inlet at different convergence angles for theLc/Hth = 11.00 cowl. The rise and fall in pressure aroundthe inlet geometric throat is evidence of isolator inflowdistortion, which is caused by the last inlet shock wavereflecting downstream of the compression ramp shoul-der. The inlet maximum operational convergence anglebefore inlet unstart was reduced by 0.3° for both thethin and thick boundary-layer configurations for theLc/Hth = 11.00 cowl as compared with that of theLc/Hth = 9.75 cowl.
An examination of the pressure distributions (up tothe throat) in the enclosed sections of the inlets withinternal compression (figs. 7, 8, and 9), independent ofthe isolator section, shows that the inlet pressure distribu-tion rises and reaches a maximum near the geometricthroat on both the body and cowl sides at any conver-gence angles above approximately 3° and 5° for theinlets with longer cowls (Lc/Hth = 9.75 and 11.00) andfor the inlet with a short cowl (Lc/Hth = 6.25), respec-tively. If one defines the inlet aerodynamic throat loca-tion where the inlet surface pressure on the ramp andcowl is maximum, then the area location of the aero-dynamic throat coincides with that of the geometricthroat. The aerodynamic throat area is smaller in magni-tude than the geometric throat area because of the vis-cous boundary-layer blockage (fig. 15).
An examination of the pressure distributions for theinlets at convergence angles of 5° or below for the short
12
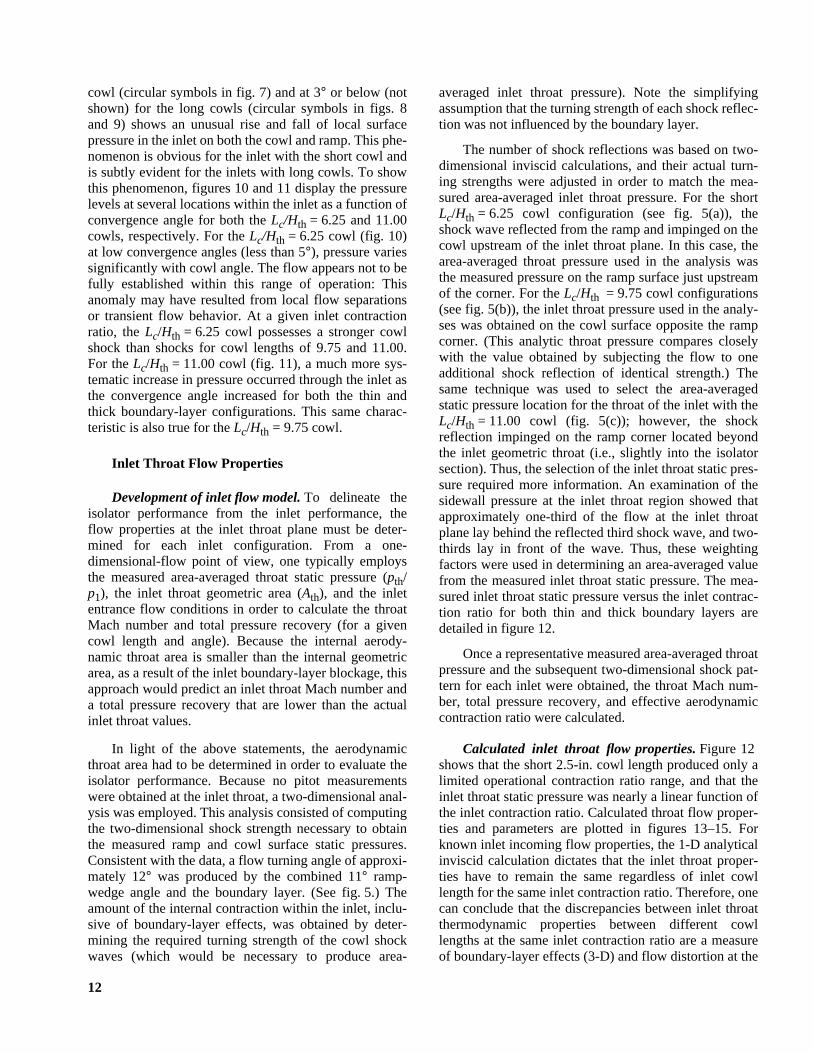
cowl (circular symbols in fig. 7) and at 3° or below (notshown) for the long cowls (circular symbols in figs. 8and 9) shows an unusual rise and fall of local surfacepressure in the inlet on both the cowl and ramp. This phe-nomenon is obvious for the inlet with the short cowl andis subtly evident for the inlets with long cowls. To showthis phenomenon, figures 10 and 11 display the pressurelevels at several locations within the inlet as a function ofconvergence angle for both theLc/Hth = 6.25 and 11.00cowls, respectively. For theLc/Hth = 6.25 cowl (fig. 10)at low convergence angles (less than 5°), pressure variessignificantly with cowl angle. The flow appears not to befully established within this range of operation: Thisanomaly may have resulted from local flow separationsor transient flow behavior. At a given inlet contractionratio, theLc/Hth = 6.25 cowl possesses a stronger cowlshock than shocks for cowl lengths of 9.75 and 11.00.For theLc/Hth = 11.00 cowl (fig. 11), a much more sys-tematic increase in pressure occurred through the inlet asthe convergence angle increased for both the thin andthick boundary-layer configurations. This same charac-teristic is also true for theLc/Hth = 9.75 cowl.
Inlet Throat Flow Properties
Development of inlet flow model.To delineate theisolator performance from the inlet performance, theflow properties at the inlet throat plane must be deter-mined for each inlet configuration. From a one-dimensional-flow point of view, one typically employsthe measured area-averaged throat static pressure (pth/p1), the inlet throat geometric area (Ath), and the inletentrance flow conditions in order to calculate the throatMach number and total pressure recovery (for a givencowl length and angle). Because the internal aerody-namic throat area is smaller than the internal geometricarea, as a result of the inlet boundary-layer blockage, thisapproach would predict an inlet throat Mach number anda total pressure recovery that are lower than the actualinlet throat values.
In light of the above statements, the aerodynamicthroat area had to be determined in order to evaluate theisolator performance. Because no pitot measurementswere obtained at the inlet throat, a two-dimensional anal-ysis was employed. This analysis consisted of computingthe two-dimensional shock strength necessary to obtainthe measured ramp and cowl surface static pressures.Consistent with the data, a flow turning angle of approxi-mately 12° was produced by the combined 11° ramp-wedge angle and the boundary layer. (See fig. 5.) Theamount of the internal contraction within the inlet, inclu-sive of boundary-layer effects, was obtained by deter-mining the required turning strength of the cowl shockwaves (which would be necessary to produce area-
averaged inlet throat pressure). Note the simplifyingassumption that the turning strength of each shock reflec-tion was not influenced by the boundary layer.
The number of shock reflections was based on two-dimensional inviscid calculations, and their actual turn-ing strengths were adjusted in order to match the mea-sured area-averaged inlet throat pressure. For the shortLc/Hth = 6.25 cowl configuration (see fig. 5(a)), theshock wave reflected from the ramp and impinged on thecowl upstream of the inlet throat plane. In this case, thearea-averaged throat pressure used in the analysis wasthe measured pressure on the ramp surface just upstreamof the corner. For theLc/Hth = 9.75 cowl configurations(see fig. 5(b)), the inlet throat pressure used in the analy-ses was obtained on the cowl surface opposite the rampcorner. (This analytic throat pressure compares closelywith the value obtained by subjecting the flow to oneadditional shock reflection of identical strength.) Thesame technique was used to select the area-averagedstatic pressure location for the throat of the inlet with theLc/Hth = 11.00 cowl (fig. 5(c)); however, the shockreflection impinged on the ramp corner located beyondthe inlet geometric throat (i.e., slightly into the isolatorsection). Thus, the selection of the inlet throat static pres-sure required more information. An examination of thesidewall pressure at the inlet throat region showed thatapproximately one-third of the flow at the inlet throatplane lay behind the reflected third shock wave, and two-thirds lay in front of the wave. Thus, these weightingfactors were used in determining an area-averaged valuefrom the measured inlet throat static pressure. The mea-sured inlet throat static pressure versus the inlet contrac-tion ratio for both thin and thick boundary layers aredetailed in figure 12.
Once a representative measured area-averaged throatpressure and the subsequent two-dimensional shock pat-tern for each inlet were obtained, the throat Mach num-ber, total pressure recovery, and effective aerodynamiccontraction ratio were calculated.
Calculated inlet throat flow properties.Figure 12shows that the short 2.5-in. cowl length produced only alimited operational contraction ratio range, and that theinlet throat static pressure was nearly a linear function ofthe inlet contraction ratio. Calculated throat flow proper-ties and parameters are plotted in figures 13–15. Forknown inlet incoming flow properties, the 1-D analyticalinviscid calculation dictates that the inlet throat proper-ties have to remain the same regardless of inlet cowllength for the same inlet contraction ratio. Therefore, onecan conclude that the discrepancies between inlet throatthermodynamic properties between different cowllengths at the same inlet contraction ratio are a measureof boundary-layer effects (3-D) and flow distortion at the
13
inlet throat. The viscous boundary layer and inlet throatflow distortion are different and unique to each cowl set-ting. In general, because of increasing shock strengthwith increasing convergence angle, the inlet throat totalpressure recovery (fig. 14) decreases with the decrease inthe inlet throat Mach number (fig. 13). The results indi-cate that the longer cowls have a slightly higher throatpressure recovery across the spectrum of inlet contrac-tion ratio. Figure 15 shows the combined effects ofboundary layer and inlet throat distortion on the aerody-namic throat area. The aerodynamic throat area decreaseswith increasing contraction ratio for theLc/Hth = 6.25cowl but increases with increasing contraction ratio forthe two larger cowls.
Inlet Unstart and Restart Characteristics
The inlet unstart phenomenon is a result of the dis-gorgement of a shock system from the inlet throat stationto a station just upstream of the cowl leading edge inorder to spill air. The inlet unstart manifests itself experi-mentally by a sudden increase in static surface pressureupstream of the cowl leading edge. Two distinct causesof inlet unstart are as follows: (1) the formation of a sep-arated flow in the inlet that forms as a result of the inletconvergence being too great and the shocks interacting inthe form of glancing and incident shocks on sidewall andbody-side boundary layers, respectively, and (2) exces-sive back pressuring due to a simulated combustor pres-sure rise pushing a shock train forward within the isolatortoward the inlet throat, and then finally disgorging outthe inlet.
To relate the formation of separated flow in the inletto inlet unstart, we must examine the inlet unstart data foreach cowl geometry. Figure 16 shows the inlet unstartand restart convergence angle for each cowl length withboth thin and thick incoming boundary layers. In general,the repeatability of inlet unstart and restart convergenceangle varies within a small range for each cowl length.All inlet unstarts occurred between 9° and 10.5° for thethin boundary-layer configurations, and between 8.2°and 9.4° for the thick, incoming inlet boundary-layerconfigurations, irrespective of cowl length and inletcontraction ratio. Korkegi’s model (ref. 11) shows thatturbulent boundary-layer incipient separation due toskewed (glancing) shock-wave interactions occurs at alocal Mach number of 3.1 when the shock-wave flowturning angle is 7.0°, although Kuehn (ref. 12) indicatesflow separation would occur for shock turning angle of8.3°. For this study, flow separations large enough tocause inlet unstart occurred at a slightly higher shockturning angle. The triggering of inlet unstart, when eachcowl reaches about the same convergence angle, indi-cates that the inlet flow boundary-layer interactions forinlet unstart are independent of inlet contraction ratio or
mass capture. (Contraction ratio and mass capture for theinlet are higher by 35 percent for theLc/Hth = 11.00 cowlthan for theLc/Hth = 6.25 cowl.) Thus, when the inletunstart occurs, the only prevalent similarity betweeneach inlet with a different cowl length is the same con-vergence angles or shock flow turning angles. This sug-gests that the interaction of the cowl shock with the inletboundary layer is critical, and this interaction creates aseparated flow that unstarts the inlet. The cowl shock isswept (glancing) and 3-D on the inlet sidewalls, and it isincident and 2-D on the body side. Note that accordingto existing research literature (refs. 13–15), the 3-D inter-action of a glancing shock system with a boundary layeris more sensitive to shock-turning angle than the 2-Dinteraction.
Figure 17 shows that the inlet unstart pressure loaddistribution increases on both the inlet ramp and the cowlwith increases in cowl length. The thick-boundary-layerexperimental results (with foreplate) show that theunstart load distribution is essentially the same as that forthe thin boundary layer (without foreplate) on both thecowl and the compression ramp.
The other type of inlet unstart addressed in thisstudy is due to back pressure. The combustor pressurerise forces a shock with high strength upstream towardthe throat of the model; this marks the maximum back-pressure limit that the inlet can withstand before theonset of the inlet unstart. The degree of maximum sus-tainable combustor pressure rise, before the onset of theinlet unstart, depends on inlet geometry, contractionratio, and isolator length. Back-pressure unstarted pres-sure distributions throughout the inlet flow path areshown in figure 18.
Comparing figures 17 and 18 shows that theunstarted pressure distribution throughout the inlet forinlet unstart due to convergence angle remains at thesame magnitude as the inlet unstarted pressure distribu-tion due to excessive back pressure (ultimately resultingin identical unstart mechanisms).
Figure 16 also shows the inlet restart (swallow theshock system) characteristics for both thin and thickincoming boundary layers. For a thin boundary layer, therange of inlet restart convergence angle varied fromabout 4.5° for theLc/Hth = 6.25 cowl to about 3.0° for theLc/Hth = 11.00 cowl, and yielded inlet geometric internalcontraction ratios (CR)i of about 1.44 to 1.31, respec-tively. The effects of the thick boundary layer with aforeplate reduced the inlet restart convergence anglevariation for each cowl by about 0.5°. Inlet restart occurswhen the inlet geometric internal contraction ratio is lowenough to pass the entrance mass flow at a total pressurethat corresponds to the value behind a normal shock atthe entrance inlet Mach number of 3.1. Kantrowitz and

14
Donaldson (ref. 16) showed that the maximum, inviscid,geometric internal contraction ratio for an incoming flowat M = 3.1 is (CR)i = 1.40 in order to restart a supersonicinlet (with γ = 1.4) compared with values of (CR)i = 1.4and 1.31 obtained experimentally from this test series.Additionally, from the multitude of different inlet sizesand shapes tested in various tunnels, Mahoney (ref. 10)empirically determined the restart internal contractionratio limit as a function of inlet incoming Mach numberfor supersonic inlets. Mahoney’s empirical determinationshows a restart contraction ratio of 3.2 for an approach-ing inlet Mach number of 3.1, which is in agreement withthis experimental study.
An examination of the unstart and/or restart data(not shown here) for each cowl for a variety of down-stream configurations suggests that the spread ininlet unstart and/or restart data is not configurationdependent (i.e., isolator lengths and steps); however, thedata spread is more pronounced for the inlet with theshort cowl (Lc/Hth = 6.25) than for inlets with medium(Lc/Hth = 9.75) and large (Lc/Hth = 11.00) cowls. Thelarger spread in data, for the short cowl, might be attrib-uted to the larger flow distortion entering the isolator.
Isolator Back-Pressure Characteristics
During the ramjet operational mode of an air-breathing engine, the diffusion process takes placethrough consecutive supersonic and subsonic diffusionprocesses. The transition from supersonic to subsonicflow occurs in the isolator section through a complexshock-train interaction with the wall boundary layer. Therequired isolator length to contain a full shock-trainlength depends on isolator entrance flow properties anddownstream combustor pressure. If the isolator is not ofsufficient length to contain the full shock train before theflow enters the combustor section, the diffusion processwould be incomplete, which would cause a decrease inthe amount of diffusion and pressure recovery. The com-bination of flow distortion (skewed) and shock–boundary-layer interaction makes a 3-D numerical solu-tion approach (full Navier-Stokes) very challenging.Thus, experiments were conducted to investigate thepressure distribution throughout the isolator and to deter-mine the upper pressure threshold that is sustainable inthe isolator section before unstarting the inlet. Testresults include the combined effects of distorted(skewed) isolator inflow conditions generated by a super-sonic inlet and simulated combustion effects downstreamof the isolator via back pressuring of the model with thethrottling device.
As noted previously, two inlets with different cowllengths, but with the same convergence angle, possessdifferent shock strengths and different isolator
inflow properties (i.e., Mach number, mass capture, pres-sure, and distortion) at the inlet throat. Thus, fromfigures 19–24, direct isolator performance comparisonsbetween two inlets with the same convergenceangles and isolator lengths should not be inferred dueto mass flow and isolator entrance Mach numbervariations.
The effects of gradually increased back pressure onthe static pressure distribution along the centerlineof the inlet isolator and combustor nozzle on thebody side and cowl side are shown in figures 19–24 forthe Lc/Hth = 6.25, 9.75, and 11.00 cowls (i.e., the 2.5-,3.9-, and 4.4-in. lengths, respectively). TheLc/Hth = 6.25and 11.00 cowl configurations include data for isolatorlength ratios (L/Hth) of 2.7, 4.7, 8.7, and 16.7; data fortheLc/Hth = 9.75 cowl are presented only forL/Hth = 4.7.In addition, the constant-area isolator length ofL/Hth = 4.7 was mated to a 6° divergent section on thebody side to investigate the effects of a low-divergent-angle isolator section on combustor back pressure for theLc/Hth = 6.25 and 11.00 cowl configurations. Theconstant-area length of isolator and diffuser combined isapproximately 16 throat heights (i.e.,L/Hth = 16). Thepressure distributions are nondimensionalized by thenozzle-exit static pressure (p1) of the free-stream tunnel.For each cowl length, the results are presented for a largeinlet convergence angle (representing the largest inletcompression achieved), the maximum possible inlet cap-ture for that configuration before unstarting the inlet, anda medium convergence angle.
The inlet would operate somewhere within these twoinlet convergence angles for optimum integrated inlet-vehicle performance. For each inlet convergence angle,results on different-length isolators represent the effect ofa partial shock train and the progression toward a fullycontained shock train with increases in isolator length.Each figure in this section shows a gradual progressionof pressure rise and back-pressure influence upstreamthroughout the inlet-isolator flow path, starting from aminimum and gradually progressing to a maximum throt-tling back pressure before unstarting the inlet.Figures 19–24 also show that back pressuring separatedthe flow downstream of the 20° nozzle expansion andcaused the pressure to become constant starting at thenozzle expansion corner. The minimum and maximumthrottling back pressures simulate the effects of no-com-bustion heat release and maximum-combustion heatrelease that can be added in the combustor withoutunstarting the inlet. The value of the percentage of theisolator normal shock pressure recovery was calculatedusing inlet throat conditions. These data inlet throatMach number, and normal shock pressure values are pre-sented with each figure.

15
Figures 19 and 20 show shock-train progression andthe simultaneous rise in pressure distribution upstream inthe isolator with back pressure for theLc/Hth = 6.25 shortcowl at inlet convergence angles of 8.5° ± 0.3° (highconvergence angle) and 5.5° ± 0.5° (medium conver-gence angle) with inlet throat Mach numbers of2.27± 0.02 and 2.40, respectively. The inlet throat Machnumber and the normal shock pressure were calculatedbased on the isolator inflow Mach number andstatic pressure at the shoulder. Figures 19(a)–19(f)and 20(a)–20(f) show that the maximum static pressurerise on the body side and cowl side increases with isola-tor lengths fromL/Hth = 2.7 to 8.7. The continuous risein isolator maximum pressure with isolator length indi-cates the progression of the partial shock train to contain-ment of the full shock train with increased isolatorlength. However, the gain in pressure rise levels off witha further increase in isolator length beyond 8.7. Theshock train is considered fully contained within the isola-tor if a further addition of isolator length does not con-tinue to increase the pressure level within the isolator. Ifthe isolator length is shorter than the shock-train length,the pressure decreases rapidly with decreasing isolatorlength. If the isolator length is longer than the shock-trainlength, the additional viscous losses decrease the maxi-mum pressure recovery only gradually with increasingisolator length. This becomes evident when comparingfigure 19(e) with 19(g) and figure 20(e) with 20(g). Anisolator length of 8.7 was sufficient to achieve a maxi-mum pressure recovery for both high and medium inletconvergence angles at these particular isolator inflowconditions. However, the maximum pressure rise for thehigh and medium inlet convergence angles is only63 percent and 71 percent of inlet throat normal shockpressure, respectively. For theLc/Hth = 6.25 cowl, thelarge isolator inflow distortion may be a cause in reduc-ing the isolator pressure rise.
The 6° expanding section added to the constant-areaisolator length ofL/Hth = 4.7 yields a total isolator lengthequivalent toL/Hth = 16.0. The 6° expanding section wasadded to examine the maximum back-pressure capabilityof an expanding diffuser flow as compared with a flow ofconstant area with the same equivalent isolator length.Figures 19(i) and 20(i) show that the addition of the 6°divergent section reduces the diffusion of the flow. Thisfact is evident from comparing the pressure rise infigure 19(g) with 19(i), and in figure 20(g) with 20(i).The pressure rise slope is steeper in the constant-area dif-fuser than in the 6° expanding section. As compared withthe constant-area isolator, the differential Mach numberin the expanding 6° diffuser section is higher, which con-sequently, results in a decrease in shock-angle distribu-tion within the expanding 6° diffuser section. Smaller
shock angles associated with the higher Mach numberincrease the shock-train length as compared with the con-stant-area duct of the same length. Thus, higher shocklosses lower total pressure recovery and decrease themaximum pressure rise before inlet unstart. However, the6° expanding isolator does diffuse the flow as opposed tothe 20° expanding section, which separates and providesminimal additional back-pressure capability.
The Lc/Hth = 9.75 cowl was tested only with theconstant-area isolator length of 4.7 (figs. 21 and 22). Theinlet convergence angles were 9.8° with an inlet throatMach number of 1.70 and 5.8° with an inlet throat Machnumber of 2.15. Because of reasons noted previously,this inlet was expected to have a minimum distortionlevel at the inlet throat in comparison with theconfiguration havingLc/Hth = 6.25 and 11.00 cowls. TheLc/Hth = 9.75 inlet cowl with theL/Hth = 4.7 isolatorproduced a shock-train system in which the isolator max-imum pressure rise was 67 percent and 50 percent of thenormal shock pressure rise associated with the throatMach number at the inlet convergence angles of9.8° and 5.8°, respectively. Comparable values for theLc/Hth = 6.25 cowl at inlet convergence angles of 8.4°and 6° with a constant-area isolator length ofL/Hth = 4.7are 47 percent and 46 percent, respectively.
Figures 23 and 24 also show an isolator pressure dis-tribution for theLc/Hth = 11.00 inlet cowl at convergenceangles of 9.55° ± 0.25° and 6.1° with inlet throat Machnumbers of 1.74± 0.03 and 2.14, respectively. The pres-sure levels are somewhat higher throughout each isolatorwith theLc/Hth = 11.00 cowl than with theLc/Hth = 9.75cowl. Again, the maximum pressure level in the isolatorwas about the same for isolator lengths of 8.7 to 16.7.(See, e.g., figs. 23(e) and 23(g), and figs. 24(e)and 24(g).)
Other experimental data (not shown) indicate thatthe addition of the forebody boundary-layer plate andsudden area changes in the isolator (steps) slightly reducethe isolator maximum pressure level. However, the gen-eral pressure distribution characteristics throughout theisolator remained unchanged. The maximum isolatorpressure rise for both the thin and thick boundary layersis summarized in the next section.
Maximum Capability of Inlet-Isolator MaximumBack Pressure
Figures 25–27 show the maximum inlet-isolatorpressure rise on the body side (ps/p1) that each isolatorwas able to sustain before the inlet unstarted. Themaximum inlet-isolator back pressure is an implicitinterdependent parameter between the inlet and the
16
isolator. This parameter is significant only if the com-bined performance of the inlet and the isolator as a singleunit is under evaluation. When evaluating the inlet-isola-tor combination as a single unit, one must remember thatthe maximum obtainable pressure rise in the isolator is afunction of both inlet contraction ratio and isolatorlength. As explained previously, the degree of inlet con-traction ratio depends on the inlet cowl length and angle,and the shock-train containment in the isolator dependson the physical isolator length. At a fixed inlet contrac-tion ratio, the relative impact of an increase in incremen-tal isolator length on the maximum back pressure beforeunstart can be examined in figures 25, 26, and 27 for theLc/Hth = 6.25, 9.75, and 11.00 cowls, respectively.
Figure 25(a) demonstrates the general trends ofincreased maximum back pressure with increased inletcontraction ratio. Supersonic inlet throat conditions at theinlet shoulder are a strong function of inlet contractionratio and distortion level (due to cowl length and angle).Thus, for a fixed inlet contraction ratio, the relativeincrease in maximum inlet-isolator pressure with isolatorlength is solely attributed to the extent of the containmentof the shock train within the isolator. Figure 25(a) alsoshows that the increase in the maximum inlet-isolatorpressure rise is negligible with the addition of isolatorlength (L/Hth) from 8.7 to 16.7, indicating that the shocktrain is fully contained within isolator lengths of 8.7throughout the full range of inlet contraction ratio. Foreach isolator length, the maximum inlet-isolator pressurerise was always at about the same level below the calcu-lated rise in normal shock pressure across the full rangeof inlet contraction ratio. TheLc/Hth = 6.25 cowl inletshows the same general trends with a thick boundarylayer (fig. 25(b)) as with a thin boundary layer(fig. 25(a)), but with a lower maximum inlet-isolatorpressure rise. The forebody plate introduced a thickboundary layer which further added to the distortionlevel of an already skewed flow at the inlet throat, whichin turn caused higher inlet losses throughout the range ofinlet contraction ratio.
Figures 26 and 27 show that the maximum inlet-isolator pressure rise for inlets with theLc/Hth = 9.75 and11.00 cowls, respectively possesses the same generaltrends as that for theLc/Hth = 6.25 cowl (fig. 25). Themaximum inlet-isolator pressure rise continues toincrease over the broad range of inlet contraction ratioattainable with the longer cowls.
Effects of Inlet Flow Distortion on Inlet-IsolatorMaximum Pressure
The losses in the inlet are a cumulative combinationof inlet inviscid shock losses, viscous and shockboundary-layer interaction losses, and flow profile dis-
tortion losses. The relative magnitude of these losses var-ied with each cowl length. (See the inlet throat flowproperties in fig. 14 for the total pressure recovery.) Foran isentropic compression inlet with known enteringflow properties, the compression process is primarily afunction of inlet contraction ratio. For a fixed inlet con-traction ratio, the isentropic inlet throat properties wouldbe the same in spite of cowl length. Here, the fact that theinlet throat properties vary for each inlet cowl length forthe same inlet contraction ratio is reflective of losses thatare inherent but different in magnitude for each inletcowl. When comparing configurations that have differentinlet cowl lengths but the same inlet contraction ratios,one is reminded that the amount of mass flow is fixedthroughout the flow path of each configuration.
For a configuration with a common isolator length,the inlet losses attributed to a specific inlet cowl lengthwere quantified in terms of the relative impact of thoselosses on inlet-isolator maximum pressure capability fora full range of inlet contraction ratios (figs. 28–32). Themaximum inlet-isolator pressure in figures 28–32 variedwith each cowl length for a fixed inlet contraction ratio,which is reflective of those cumulative losses and theinlet throat distortion just noted herein.
Figure 28(a) shows the inlet-isolator maximum pres-sure rise for theLc/Hth = 6.25 and 11.00 cowls matedwith anL/Hth = 2.7 throat height with constant-area iso-lator length. TheLc/Hth = 6.25 cowl rendered the lowermaximum pressure rise before inlet unstart. To maintainthe same contraction ratio, the shorter cowl must have agreater incidence angle to the free-stream flow. Thus, theflow entering the isolator section for theLc/Hth = 6.25cowl had a higher loss (due to a greater flow turningangle) and distortion level at the throat than theLc/Hth = 11.00 cowl. The high inlet losses of theLc/Hth = 6.25 cowl length when combined with lossesdue to the incomplete shock-train containment of theL/Hth = 2.7 throat height reduced the inlet-isolator maxi-mum pressure capability across the inlet contraction ratiorange. Figures 29(a)–32(a) show that the shock train wasfurther contained with the increase in isolator length,which led to a higher back-pressure capability.
Configurations with thick boundary layers, such asthose shown in figures 28(b)–31(b) (fig. 32(b) has insuf-ficient data available), show the same general trends asthe configuration with a thin boundary layer. Also, withthe thick boundary layer, the inlet-isolator maximumpressure rise for theLc/Hth = 6.25 cowl was near thevalue obtained with theLc/Hth = 11.00 cowl for isolatorlengths (L/Hth) of 8.7–16.7 geometric throat heights(figs. 30(b) and 31(b)).
The sudden step area increase in the isolator isintended to replicate the location of fuel injectors during

17
operation. Figures 29(c)–29(f) show the effects of a steparea increase of 20 percent (rearward-facing steps) on theinlet-isolator maximum pressure rise for theL/Hth = 4.7isolator. The presence of the step area increase loweredthe maximum pressure rise in theLc/Hth = 4.7 isolator.The impact of the step area increase on isolatormaximum pressure rise was more pronounced for theLc/Hth = 6.25 configuration with the thin boundary layerthan for the same configuration with theLc/Hth = 11.00cowl. This is evident when comparing constant-areaisolator results (fig. 29(a)) with the isolator having arearward-facing step (a sudden area increase) (figs. 29(c)and 29(e)).
Isolator Effectiveness
To separate isolator effectiveness from the combinedinlet-isolator performance, the maximum sustainablepressure rise in the isolator (ps) for any given inlet con-traction ratio was divided by the inlet throat static pres-sure (pth) at the junction of the inlet and isolator.Evaluating the effectiveness of an isolator as a singlecomponent, independent of the inlet, is of significanceduring the course of a design process when assessing thecontribution of various isolator lengths to the overallvehicle performance level (i.e., installed thrust). Theincremental vehicle aerodynamic performance gain,obtained from the various isolator lengths with differentisolator inflow conditions, would then be traded againstthe adverse impact of isolator dry weight on vehicletakeoff gross weight (TOGW) over the integrated flighttrajectory.
Figures 33–35 show the effectiveness of four differ-ent isolator lengths in terms of the pressure ratio (ps/pth).The figures show that, in general, the isolator effective-ness decreases with increasing inlet contraction ratio.However, one must note that the decrease in isolatoreffectiveness for any given inlet cowl and isolator lengthis expected because the Mach number at the inlet throator isolator entrance decreases with increasing inlet con-traction ratio; consequently, a reduction in Mach numberat the isolator entrance also reduces both the normalshock pressure rise and the pressure rise in the isolatordue to back pressuring.
The isolator effectiveness with inlet contraction ratiocan also be related to combustion heat release and, con-sequently, the maximum permissible combustion heatrelease is one that generates a combustion pressure riseconsistent with the isolator maximum pressure capabilityand still avoids unstarting the inlet. It can be inferredfrom figures 33–35 that the fuel equivalence ratiorequired to unstart the inlet decreases with increasinginlet contraction ratio. This behavior is consistent withRayleigh flow in which the amount of heat (i.e., combus-
tion heat) necessary to generate a normal shock in theisolator section is lower for low-supersonic isolatorinflow Mach numbers created by high inlet contractionratios. However, the amount of combustion that can beaccomplished in a larger downstream area is more afunction of the absolute pressure level that can be con-tained by the inlet-isolator combination.
Figures 33–35 also reveal that isolator effectivenessdecreases more rapidly with inlet contraction ratio for theshort inlet cowl (fig. 33) than for the same isolator con-figurations with long cowls (figs. 34 and 35). In addition,in the thin-boundary-layer tests (solid symbols), configu-rations with a short cowl possess a higher isolator effec-tiveness (isolator pressure rise) than those with the longcowl. The sharp decrease in isolator effectiveness withinlet contraction ratio for the configuration with the shortcowl can be attributed to the effect of inlet diffusion andthe degree of inlet flow distortion. Thus, the isolatoreffectiveness data suggest that in the case of the shortcowl, in which flow distortion and high inflow Machnumber to the isolator section are prevalent, the isolatorplays a major role in the diffusion of the flow in theisolator with back pressuring. However, for the inlet-isolator configurations with longer cowls, the isolatoreffectiveness would gradually phase out and further dif-fuse the flow in the isolator section.
The data presented in figures 33–35 for given inletgeometries and isolator lengths are of eminent value tooptimize the integration of the inlet and isolator geome-tries in the design of lifting-body hypersonic vehicles inorder to obtain the proper combustor pressure rise withminimum structural weight.
Conclusions
Combinations of different constant-area isolatorlengths, with and without rearward-facing steps, werecoupled to a supersonic inlet with three different rotatingcowl lengths to investigate the maximum isolator pres-sure rise. The results in this report explore theoperational characteristics of various inlet/isolator con-figurations in terms of pressure rise in the isolator. Testresults for inlet and isolator coupling provide a novelparametric state-of-the-art database that is necessary forthe design of a hypersonic vehicle, and this enables theuse of a cycle deck to predict inlet-isolator performanceover the ramjet envelope. In conclusion, the salient fea-tures observed from this study include the following:
1. The examination of static pressure measurementsobtaining at the inlet geometric throat (inlet-isolatorjunction) showed that depending on the inlet cowl length,the interaction of the cowl shock with the expandingwaves at the compression ramp shoulder generated vari-ous levels of flow distortion which impacted the isolator

18
performance. The inlet throat distortion level was at amaximum for the short cowl, which had a limited rangeof inlet contraction ratio and a high isolator entranceMach number. The inlet throat distortion level enteringthe isolator was minimized by a cowl length that focusedthe cowl shock on the ramp shoulder.
2. The addition of a boundary-layer plate to simulatethe thicker turbulent boundary layer (from 0.25Hth to0.55Hth, whereHth denotes the inlet throat or isolatorentrance height) of the forebody of a hypersonic vehiclereduced the maximum operational inlet convergenceangle by approximately 1.4°, and correspondingly themaximum operability of the inlet contraction ratio wasreduced by about 5 percent.
3. An examination of the pressure distributionthroughout the inlet showed that independent of isolatorlength, the inlet pressure distribution reached a maxi-mum near the inlet geometric throat on both the body andcowl sides for any inlet convergence angle above 5°for long cowls (i.e.,Lc/Hth = 9.75 and 11.00, whereLcdenotes the inlet cowl length), and above 7° for the shortcowl (i.e.,Lc/Hth = 6.25). This indicated that within theirlimits, the location of the inlet aerodynamic throat areacoincided with the inlet geometric throat.
4. Data showed that the inlet unstarted at approxi-mately the same convergence angle despite inlet cowllength and inlet contraction ratio. This result indicatesthat the shock boundary-layer interactions were themechanism for inlet unstart independent of inlet contrac-tion ratio and mass capture.
5. The inlet unstart load (unstart drag) reflected by ahigher pressure level increased on both the inlet rampand the cowl with an increase in cowl length. The thick-boundary-layer experimental results (with foreplate) alsoshowed the unstart pressure distribution to be about thesame as that of the thin boundary layer (withoutforeplate).
6. The shock train was considered to be fully con-tained within the isolator if further addition of isolatorlength did not continue to increase the isolator pressure
level. If the isolator length was shorter than the shock-train length, the maximum value of back pressure beforeinlet unstart decreased rapidly with decreasing isolatorlength. The results also showed that if the isolator lengthwas longer than the shock-train length, the additional vis-cous losses decreased pressure recovery gradually withincreasing isolator length. Optimal isolator length (L/Hth)was 8.7, whereL denotes the isolator length.
7. When evaluating the inlet-isolator model as a sin-gle unit, the combination of inlet and isolator caused themaximum pressure rise in the isolator to increase withinlet contraction ratio and isolator length before unstart-ing the inlet.
8. An increase in the step rearward-facing area of20 percent reduced the inlet-isolator maximum back-pressure rise before inlet unstart, as opposed to the sameconfiguration with constant-area isolator length. Thisresult was more pronounced for the shortLc/Hth = 6.25cowl than for the same isolator configuration with thelongLc/Hth = 11.00 cowl.
9. The sharp decrease in isolator effectiveness withincreasing inlet contraction ratio for the configurationwith a short inlet cowl indicated that the isolator played amajor role in the diffusion of the flow in the isolator.However, for the inlet-isolator configurations withlonger cowls, the isolator effectiveness gradually phasedout further diffusion of the flow in the isolator section,thus diminishing the need for further reliance on anextended isolator section.
10. Isolator effectiveness data showed that therequired combustion heat release for inlet unstartincreased with increasing inlet contraction ratio becausethe amount of combustion that can be accomplished in alarger downstream area is a function of the absolute pres-sure level that can be contained by the combined inlet-isolator model.
NASA Langley Research CenterHampton, VA 23681-0001February 14, 1995

19
Appendix
Inlet Performance Definitions
The inlet used in this experiment was designed to compress the approaching supersonic air (M = 4.03) externallyand internally at subcritical mode. In all test cases, the external compression process was accomplished by a ramp shockat a wedge angle of 11° that simulated a portion of a hypersonic vehicle forebody (fig. A1). The inlet internal compres-sion was achieved via a combination of several reflective oblique shock waves (initiated by the cowl) and was containedby surfaces that were contracted two dimensionally in the lateral direction. The oblique shock waves reflected from thecompression ramp and cowl progressed toward and into the geometric throat (Ath = HthW), with the number of reflec-tions dependent on the inlet cowl length. The projected frontal stream tube area of the inlet is often referred to as the“captured stream tube area” (Acap= HcapW). The number of shock reflections and the magnitude of the projected frontalstream tube area directly depend on the cowl length (Lc), cowl angle position (θc), precompression-ramp wedgeangle (α), and shock-wave angle (θw).
One parameter that governs the inlet performance is based on the inviscid stream tube area captured by the inlet(Acap). Flow visualization of the surface oil on the inlet body side showed that the flow was mainly two dimensionalthroughout the body side of the inlet. The two dimensionality of the flow and the constant width (W) of the model flowpath justify the simplification that the captured area is equal to the product of captured height (Hcap) and model width.Because of the boundary layer on the ramp, the actual captured stream tube is reduced to less than the inviscid streamtube. The integrated boundary-layer displacement thickness (δ*) obtained from the ramp pitot pressure measurementsbehind the wedge shock immediately upstream of the inlet entrance was used to calculate the actual captured stream tubefrom that of the inviscid capture area. A relationship was derived to relate the inlet inviscid captured height to the inletgeometry and compression shock-wave angle. Thus, from the schematic diagram in figure A1, we derive
(A1)
Additionally for any given inlet cowl length and inlet cowl angle, the height of the flow path at the cowl leadingedge (Hg) is also related toHcap through a constant derived from the geometric relation
(A2)
Thus, the same geometric relation was also used to account for the effect of boundary-layer displacement thicknesson the inlet mass deficit, yielding
(A3)
Inlet aerodynamic contraction ratio ((CR)a), and inlet mass capture ratio (CAP) usually describe the inlet perfor-mance. Here, the inlet contraction ratio is defined as the ratio of the actual projected area of the inlet frontal stream tube(parallel to the free stream) to the inlet geometric throat area, and the inlet mass capture ratio is defined as the ratio ofmass flow rate actually passing through the inlet to that approaching the projected frontal model area (Am = HmW).These parameters are given, respectively, as
(A4)
(A5)
The substitution of each cowl length, the cowl angle positions, and the compression shock-wave angle for a givenwedge angle at any approaching flow Mach number in equations (A1) and (A3) would render the actual captured height.Inlet (CR)a and CAP can be calculated from equations (A4) and (A5), whereHth andHm are invariable inlet throat geo-metric dimensions throughout the course of these test series. Figures A2 and A3 show the inlet (CR)a and CAP versusinlet convergence angle (β) for 4.4, 3.9, and 2.5 in. inlet cowl lengths for cowl angle variations from 0° to 11°. The
Hcap Lr α Lc θc Hth+sin–tanα θwtantan
αtan θwtan–--------------------------------+= Lr 1 αtan
θwtan--------------–
Lc
θcsin
θwtan-------------- θccos–
Hth1θwtan
-------------- –+×
Hcap 1.876Hg=
Hcap, act Hcap 1.876δ*–=
CR( ) a
Acap
Ath----------
Hcap, act
Hth-------------------= =
CAPHcap, act
Hm-------------------=

20
compression wedge angle of 11° and the Mach number approaching 4.03 remained the same for all calculations. Fromfigure A1, the relationship between cowl angle (θc) and cowl convergence angle (β) is
(A6)
Inlet mass capture ratio was also used to calculate mass flow rate through the inlet for each cowl for the same rangeof convergence angles (fig. A4).
Another parameter often used to define the inlet is the geometric internal contraction ratio ((CR)i) given as
(A7)
The inlet mass capture ratio can also be related to free-stream and throat flow properties by equating the continuityequation at free-stream and throat conditions. This relationship can be expressed as
(A8)
wheref (γ, M) is given by
(A9)
Further manipulation of equation (A8) allows flow properties to be determined by recognizing that
β 11° θc–=
CR( ) i
Ag
Ath-------
Hg
Hth--------= =
pt cap, act,ppt----f γ M,( )
cap, actAcap, act
Tt cap,---------------------------------------------------------------------------------------
pt th a, ,p
pt th a, ,---------------f γ M,( )
th a,Ath a,
Tt th a, ,--------------------------------------------------------------------------------=
f γ M,( ) γR--- M 1
γ 1–2
-----------M2
+ 1/ 2
=
Tt cap, Tt th a, , Tt 1,= =
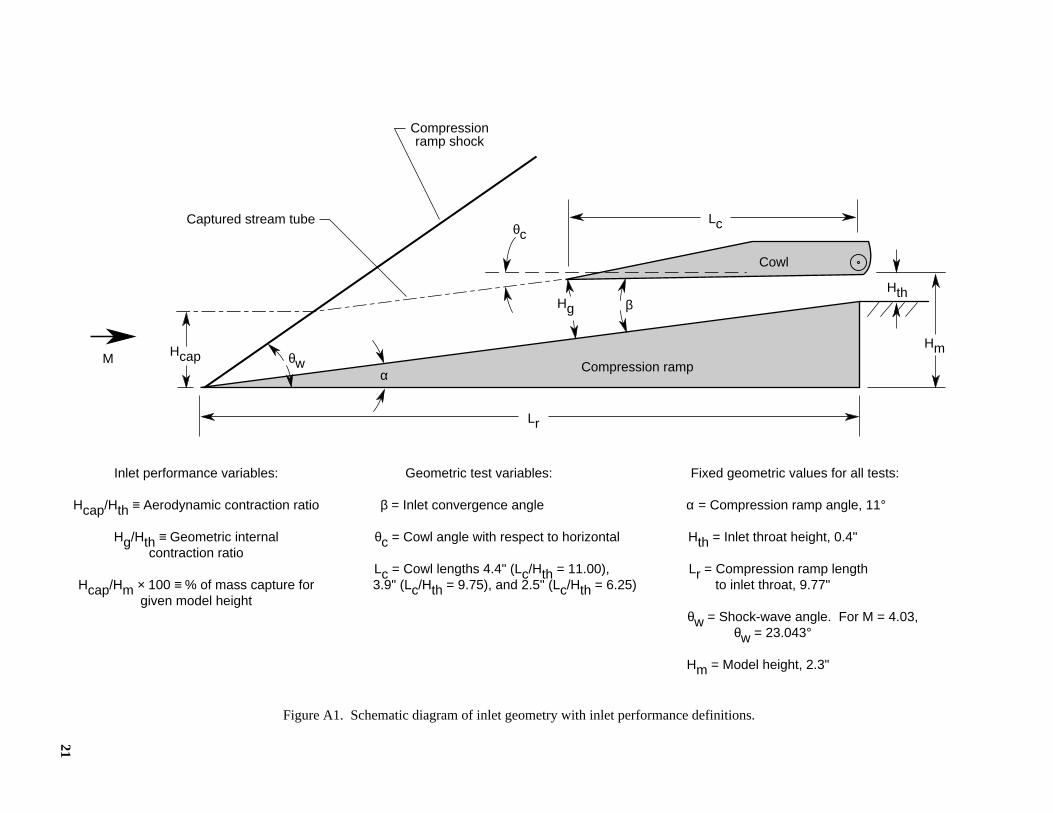
21
Figure A1. Schematic diagram of inlet geometry with inlet performance definitions.
Hcap
Lr
Lc
Cowl
Compression ramp
Compressionramp shock
Captured stream tube
β
θc
θwα
Hth
M
Hg
Hm
Inlet performance variables:
Hcap/Hth ≡ Aerodynamic contraction ratio
Hg/Hth ≡ Geometric internalcontraction ratio
Hcap/Hm × 100 ≡ % of mass capture forgiven model height
Geometric test variables:
β = Inlet convergence angle
θc = Cowl angle with respect to horizontal
Lc = Cowl lengths 4.4" (Lc/Hth = 11.00), 3.9" (Lc/Hth = 9.75), and 2.5" (Lc/Hth = 6.25)
Fixed geometric values for all tests:
α = Compression ramp angle, 11°
Hth = Inlet throat height, 0.4"
Lr = Compression ramp lengthto inlet throat, 9.77"
θw = Shock-wave angle. For M = 4.03,θw = 23.043°
Hm = Model height, 2.3"

22
Figure A2. Aerodynamic contraction ratio versus inlet convergence angle.
Figure A3. Inlet theoretical mass capture ratio versus inlet convergence angle.
Figure A4. Inlet theoretical mass flow rate versus inlet convergence angle.
6
5
4
3
2
Aerodynamiccontraction
ratio,(CR)a
2.53.94.4
6.259.75
11.00
Cowl length,in.
Lc/Hth
1 2 3 4 5 6 7 8 9 10 11Inlet convergence angle, β
.7
.6
.5
.4
.3
Masscaptureratio,CAP
2.53.94.4
6.259.75
11.00
Cowl length,in.
Lc/Hth
1 2 3 4 5 6 7 8 9 10 11Inlet convergence angle, β
.8
.9
1.0
1.0
.9
.8
.7
.6
Inlet massflow rate,lbm/sec
2.53.94.4
6.259.75
11.00
Cowl length,in.
Lc/Hth
1 2 3 4 5 6 7 8 9 10 11Inlet convergence angle, β
1.1
1.21.3
1.4
1.5
1.6
1.7
1.8
23
References1. Billig, F. S.; Dugger, G. L.; and Waltrup, P. J.: Inlet-
Combustor Interface Problems in Scramjet Engines.1st Inter-national Symposium on Air Breathing Engines. Institut deMechanique des Fluides, June 1972.
2. Pratt, David T.; and Heiser, William H.: Isolator-CombustorInteraction in a Dual-Mode Scramjet Engine. AIAA-93-0358,Jan. 1993.
3. McLafferty, G. H.; Krasnoff, E. L.; Ranard, E. D.; Rose,W. G.; and Vergara, R. D.:Investigation of Turbojet InletDesign Parameters. Rep. R-0790-13, Res. Dep., United Air-craft Corp., Dec. 1955.
4. Hataue, Itaru: Computational Study of the Shock-Wave/Boundary-Layer Interaction in a Duct.Fluid Dyn. Res., vol. 5,Dec. 1989, pp. 217–234.
5. Lin, Pei; Rao, G. V. R.; and O’Connor, George M.: NumericalInvestigation on Shock Wave/Boundary-Layer Interactions ina Constant Area Diffuser at Mach 3. AIAA-91-1766,June 1991.
6. Lin, Pei; Rao, G. V. R.; and O’Connor, George M.: NumericalAnalysis of Normal Shock Train in a Constant Area Isolator.AIAA-91-2162, June 1991.
7. Hunter, L. G.; and Couch, B. D.: A CFD Study of Precombus-tion Shock-Trains From Mach 3–6. AIAA-90-2220,July 1990.
8. Carroll, B. F.; and Dutton, J. C.: Characteristics of MultipleShock Wave/Turbulent Boundary-Layer Interactions in Rect-angular Ducts.J. Propuls. & Power, vol. 6, no. 2, Mar.–Apr. 1990, pp. 186–193.
9. Carroll, B. F.; and Dutton, J. C.: Multiple Normal ShockWave/Turbulent Boundary-Layer Interactions.J. Propuls. &Power, vol. 8, no. 2, Mar.–Apr. 1992, pp. 441–448.
10. Mahoney, John J.:Inlets for Supersonic Missiles, AIAA Edu-cation Series, 1990.
11. Korkegi, R. H.: Comparison of Shock-Induced Two- andThree-Dimensional Incipient Turbulent Separation.AIAA J.,vol. 13, no. 4, Apr. 1975, pp. 534–535.
12. Kuehn, Donald M.:Experimental Investigation of the PressureRise Required for the Incipient Separation of TurbulentBoundary Layers in Two-Dimensional Supersonic Flow.NASA MEMO 1-21-59A, 1959.
13. Reddy, D. R.; and Weir, L. J.: Three-Dimensional ViscousAnalysis of a Mach 5 Inlet and Comparison With Experimen-tal Data.J. Propuls. & Power, vol. 8, no. 2, Mar.–Apr. 1992,pp. 432–440.
14. Settles, Gary S.; and Dolling, David S.: Swept Shock Wave/Boundary-Layer Interactions.Tactical Missile Aerodynamics,Michael J. Hemsch and Jack N. Nielson, eds., AIAA, 1986,pp. 297–379.
15. Settles, G. S.; and Dolling, D. S.: Swept Shock/Boundary-Layer Interactions—Tutorial and Update. AIAA-90-0375,Jan. 1990.
16. Kantrowitz, Arthur; and Donaldson, Coleman duP.:Prelimi-nary Investigation of Supersonic Diffusers. NACA WR L-713,1945. (Formerly NACA ACR L5D20.)

24
L-91-16292 L-91-16290(a) Model assembly. (b) Model assembly without left side fence, left sidewall, and cowl.
Figure 1. Uninstalled inlet-isolator model.
11° compressionramp
Fence
Sidewall
Rotating cowl Isolatorsection
Flow
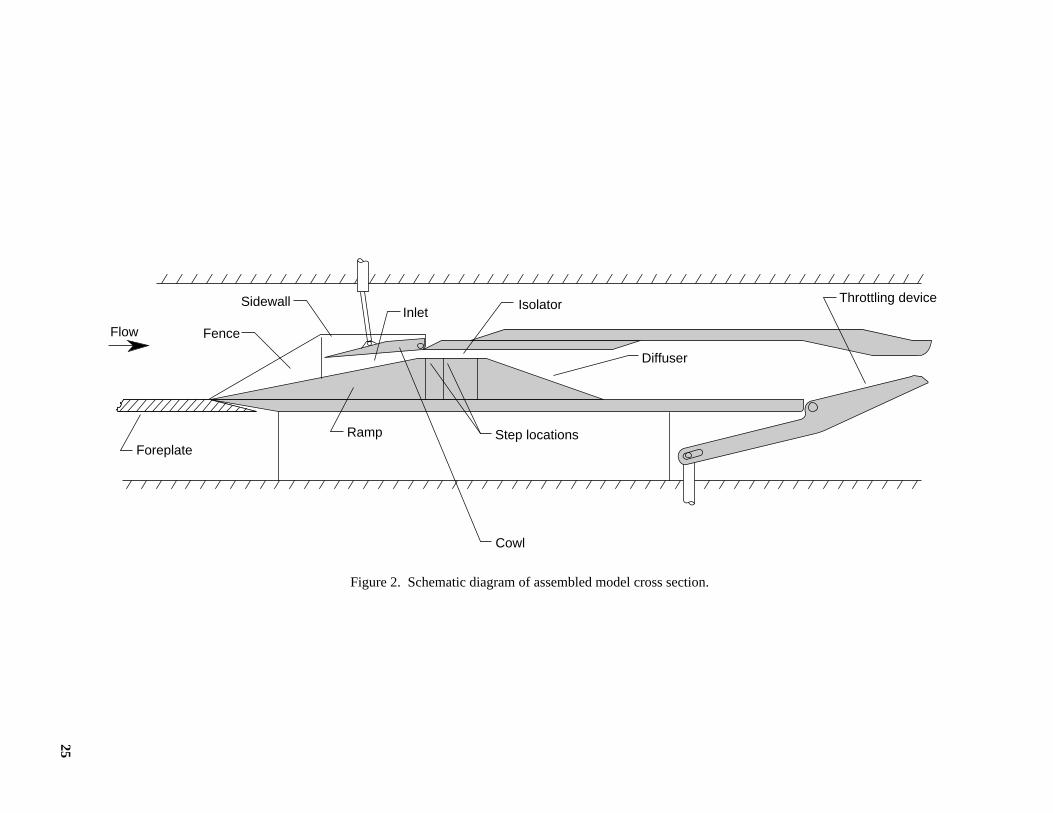
25
Figure 2. Schematic diagram of assembled model cross section.
Foreplate
InletIsolator
Diffuser
Throttling deviceSidewall
Flow
Cowl
Step locationsRamp
Fence

26
Figure 3. Schematic diagram of model. Linear dimensions are given in inches.
Flow
Top view - Body side
Side view
.8
1.620°
Aft wedge translates axiallyto insert variable-length
isolator blocks
Shims removableto create steps
12" foreplateHcowl
Aft cowl section
Removable isolator blocks
11°
Cowl
Static tips
Hth =0.40
β
Hm = 2.75
Boundary-layer rakelocation
Compression ramp
SidewallFence
θc
2.0
9.776.810Station

27
(a) Compression ramp (aluminum).
Figure 4. Instrumentation layouts. See figure 4(h) for orifice locations. Linear dimensions are given in inches.
11°
Side view
1 4
1.90
Lr = 9.77
5.18
2.02.8
Top view
Rear view
Station A
.4
0.272
2 3 5 6 7 8 914
1520
2122
2728
29
33
231610
9.9
Flow
Ref. 0
Start of isolator section
Inlet throat location
+z'
37
x'
0.005 rad.
32

28
(b) Isolator blocks (aluminum).
Figure 4. Continued.
Flow55 62
3.2
2.0
Flow38
43
39
2.0
0.8
44
1.85 1.85
2.0
1.6
4550
46
54Flow
Side RearIsolator section
Block #1
Top
2.0
Isolator sectionBlock #2
Isolator sectionBlock #3
Ref. 0
0Ref. Ref. 0x'
+z'
x'
+z'
x'
+z'
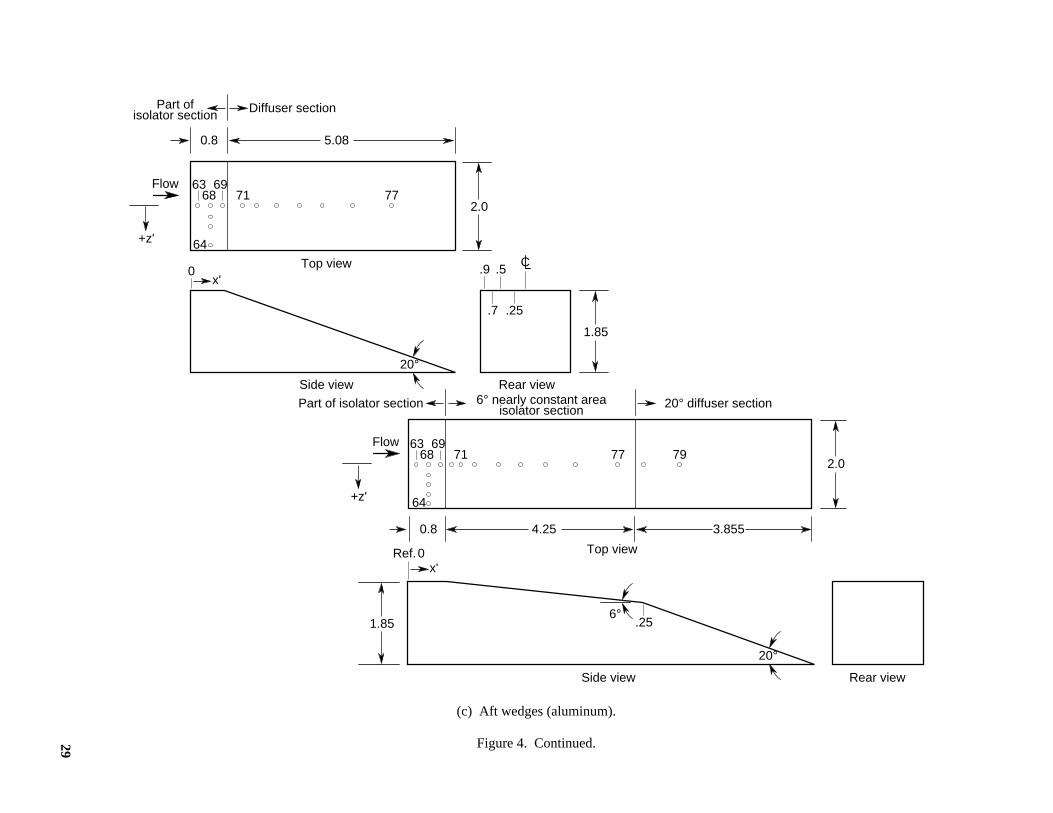
29
(c) Aft wedges (aluminum).
Figure 4. Continued.
3.855
20°
Flow 6368 71 77
64
1.85
2.0
4.25
1.85
.9 C
.7
.5
.25
0
20°
6°
5.08
2.0
0.8
0.8
.25
Flow
Top view
Side view Rear view
Top view
Side view Rear view
0Ref.
Part of isolator section 6° nearly constant areaisolator section 20° diffuser section
Part ofisolator section Diffuser section
x'
x'
69
6368 71 77
64
6979
+z'
+z'

30
(d) Forward cowl sections (stainless steel).
Figure 4. Continued.
2.84 2.14
Lc = 3.90
1.998
Lc = 4.40
0.5 0.5
1.998
0.5 0.5
0.5
0.5
1.998
Lc = 2.50
10°
13.15°10°
0.2 rad.
82 84 86
3.9" cowl (Lc/Hth = 9.75)
82 84 8680
Flow
FlowFlow
Top view Top view
Side view
Top view
Side view
Ref. 0 Ref. 0
Ref. 0
82 84 8680
.272 .272
.272
Side view
x'x'
x'
0.005 rad.
4.4" cowl (Lc/Hth = 11.00)
2.5" cowl (Lc/Hth = 6.25)
0.005 rad.
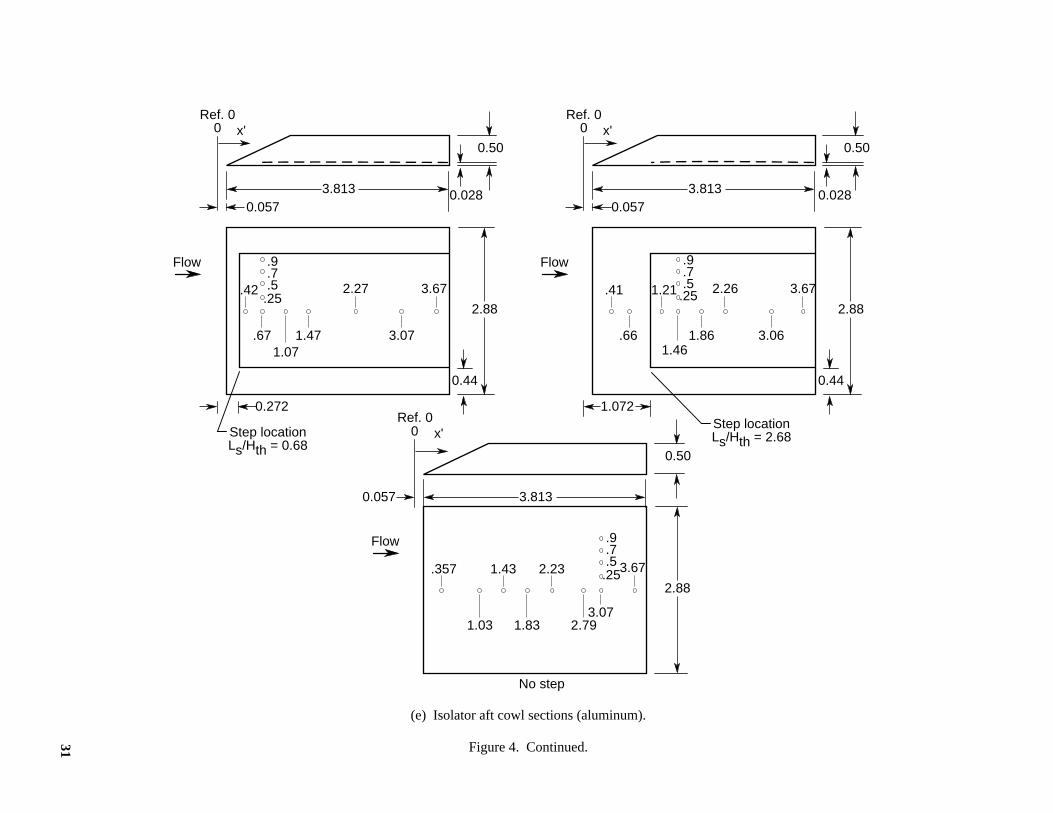
31
(e) Isolator aft cowl sections (aluminum).
Figure 4. Continued.
Flow
Step locationLs/Hth = 0.68
3.813
2.88
.67
.42
1.07
2.27
1.47
3.67
3.07
0Ref. 0
0.057
0.272
0.028
0.44
.25.5.7.9 Flow
3.813
2.88
.66
.41 2.26
1.46
3.67
3.06
0
0.057
1.072
0.028
0.50
0.44
.25.5.7.9
Flow
3.813
2.88
3.07
.357
1.03
2.23 3.67
2.79
0
0.057
0.50
.25.5.7.9
1.86
1.21
1.83
1.43
No step
Step locationLs/Hth = 2.68
x'Ref. 0
x'
Ref. 0x'
0.50
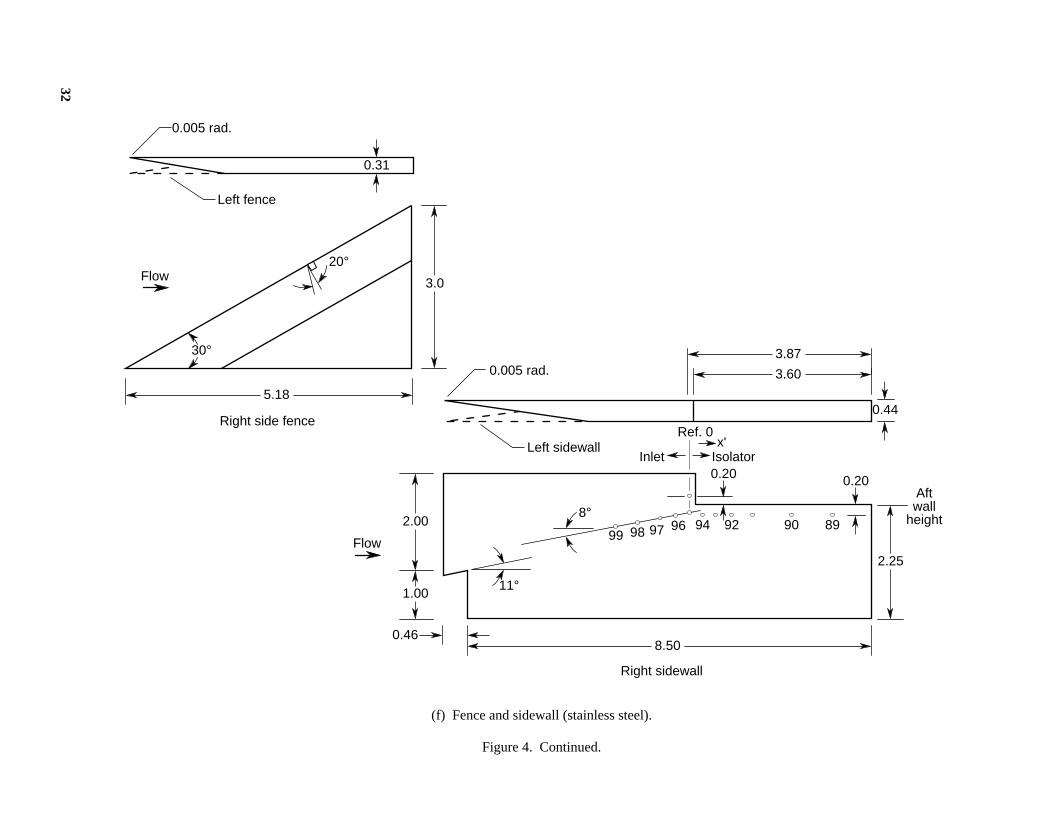
32
(f) Fence and sidewall (stainless steel).
Figure 4. Continued.
0.44
3.60
11°
89
Right side fence
Flow
3.0
5.18
2.00
1.00
2.25
8.50
90929496979899
8°
20°
0.31
0.46
Right sidewall
Flow
Left fence
Left sidewall
30°
Ref. 0
Isolatorx'
Inlet
0.20Aftwall
height
0.005 rad.
0.005 rad.
3.87
0.20

33
(g) Schematic diagram of back-pressure throttling device (aluminum).
Figure 4. Continued.
100
19.75
2.043
Flow 2.75
101 102 103 104 105
107
106 108
Pitot tube(109)
Ref. 0
x'
Movable flap
Fully openposition
Pitot tube(109)
Aft cowlinterface
Side view
AA
Section A-A
Static orifice

34
(h) Instrumentation layout locations for figures 4(a)–4(d) and 4(f).
Figure 4. Concluded.
Compression ramp(see fig. 4(a))
Orifice x' z'
12345678910111213141516171819202122232425262728293031323334
1.793.093.684.275.025.516.006.496.987.477.477.477.477.477.968.458.458.458.458.458.949.199.439.439.439.439.439.689.919.919.919.919.919.91
0.000.000.000.000.000.000.000.000.000.900.700.500.250.000.000.900.700.500.250.000.000.000.900.700.500.250.000.000.900.700.500.250.00
–0.25
Compression ramp (cont.)
Orifice x' z'
353637
9.919.919.91
–0.50–0.70–0.90
Orifice
38394041424344
45464748495051525354
5556575859606162
0.150.400.400.400.400.400.65
0.150.400.400.400.400.400.650.901.151.40
0.150.400.651.001.502.002.503.00
0.000.900.700.500.250.000.00
0.000.900.700.500.250.000.000.000.000.00
0.000.000.000.000.000.000.000.00
Diffuser section(see fig. 4(c))
Orifice x' z'
6364656667686970717273747576777879
0.250.400.400.400.400.400.650.901.151.502.002.503.003.804.805.306.05
0.000.900.700.500.250.000.000.000.000.000.000.000.000.000.000.000.00
Isolator blocks(see fig. 4(b))
x' z'
Forward cowl sections(see fig. 4(d))
Orifice x' z'
80818283848586
3.102.602.101.601.100.600.35
0.000.000.000.000.000.000.00
Cowl aft sections(refer to fig. 4(e))
Sidewall(see fig. 4(f))
Orifice x' z'
8990919293949596979899
2.802.001.200.800.400.15
–0.20–0.37–0.62–1.11–1.60
2.002.002.002.002.002.002.002.002.002.002.00
Back pressure mechanism(see fig. 4(g))
Orifice x' z'
100101102103104105106107108109
0.603.105.608.10
10.6013.1018.6018.9019.1019.00
0.000.000.000.000.000.000.000.000.000.00
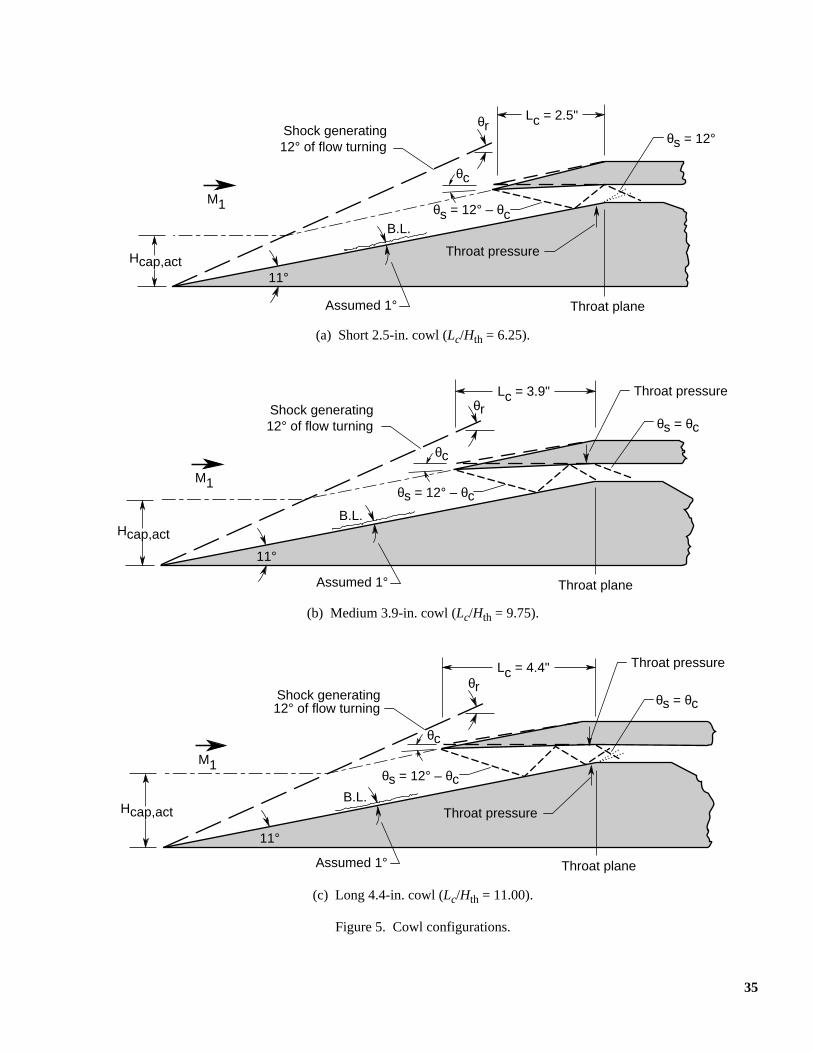
35
(a) Short 2.5-in. cowl (Lc/Hth = 6.25).
(b) Medium 3.9-in. cowl (Lc/Hth = 9.75).
(c) Long 4.4-in. cowl (Lc/Hth = 11.00).
Figure 5. Cowl configurations.
Hcap,actThroat pressure
M1
11°
Shock generating12° of flow turning
B.L.
Throat plane
Lc = 2.5"
θs = 12°θr
θs = 12° – θc
θc
Assumed 1°
Hcap,act
M1
11°
Throat plane
B.L.
Shock generating12° of flow turning
Throat pressureLc = 3.9"
θs = θc
θr
θs = 12° – θc
θc
Assumed 1°
Hcap,act Throat pressure
M1
11°
Throat plane
B.L.
Shock generating12° of flow turning
Throat pressureLc = 4.4"
θs = θc
θr
θc
θs = 12° – θc
Assumed 1°

36
(a) Pitot pressure profile for thin boundary layer.
(b) Pitot pressure profile for thick boundary layer.
Figure 6. Measured pitot pressure profiles and calculated flow profiles with and without foreplate behind compressionshock. Thick boundary layer (B.L.) refers to configuration with foreplate.
0 5 10 15 20 25 30 35 40 450
.25
.50
.75
1.00
y/Hth
pt,2/p1
Measured pitot pressure profile
0 5 10 15 20 25 30 35 40 450
.25
.50
.75
1.00
y/Hth
pt,2/p1
Measured pitot pressure profile

37
(c) Velocity profiles.u/Uedge= (y/δ)1/n.
(d) Mach number profiles.M ∝ u/Uedge= (y/δ)1/n.
Figure 6. Concluded.
.25 .50 .75 1.000
.25
.50
.75
1.00
δ
u/Uedge
y/Hth
δ
Data, thin B.L.
Velocity profile for thin B.L. if n = 7,δ = 0.25Hth
Data, thick B.L.
Velocity profile for thick B.L. if n = 7,δ = 0.55Hth
Velocity profile for thick B.L. if n = 10,δ = 0.55Hth
0 .5 1.0 1.5 2.0 2.5 3.0 3.50
.25
.50
.75
1.00
y/Hth
M
δ
δ
Data, thin B.L.
Velocity profile for thin B.L. if n = 7,δ = 0.25Hth
Data, thick B.L.
Velocity profile for thick B.L. if n = 7,δ = 0.55Hth
Velocity profile for thick B.L. if n = 10,δ = 0.55Hth
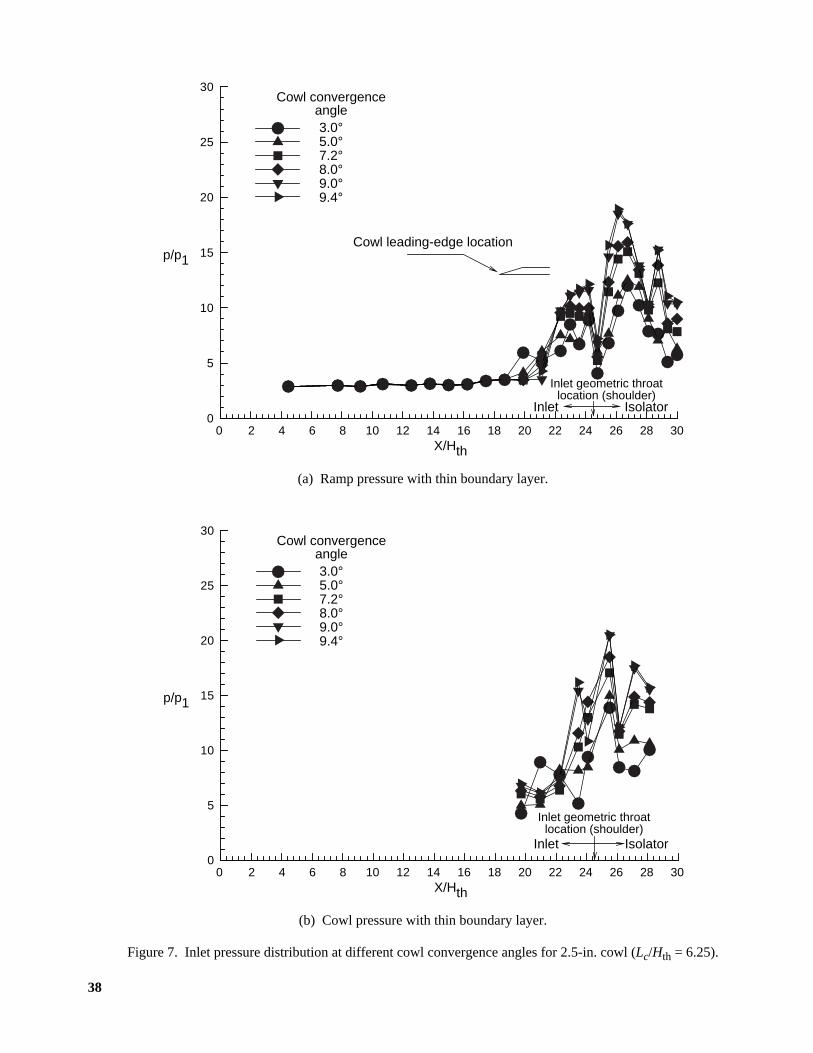
38
(a) Ramp pressure with thin boundary layer.
(b) Cowl pressure with thin boundary layer.
Figure 7. Inlet pressure distribution at different cowl convergence angles for 2.5-in. cowl (Lc/Hth = 6.25).
0 2 4 6 8 10 12 14 16 18 20 22 24 26 28 300
5
10
15
20
25
30
p/p1
X/Hth
Cowl leading-edge location
Cowl convergenceangle3.0°5.0°7.2°8.0°9.0°9.4°
Inlet geometric throatlocation (shoulder)
IsolatorInlet
0
5
10
15
20
25
30
p/p1
Cowl convergenceangle3.0°5.0°7.2°8.0°9.0°9.4°
0 2 4 6 8 10 12 14 16 18 20 22 24 26 28 30X/Hth
Inlet geometric throatlocation (shoulder)
IsolatorInlet

39
(c) Ramp pressure with thick boundary layer.
(d) Cowl pressure with thick boundary layer.
Figure 7. Concluded.
0 2 4 6 8 10 12 14 16 18 20 22 24 26 28 300
5
10
15
20
25
30
p/p1
X/Hth
Cowl leading-edge location
Cowl convergenceangle3.0°5.0°7.0°8.0°8.5°
Inlet geometric throatlocation (shoulder)
IsolatorInlet
0 2 4 6 8 10 12 14 16 18 20 22 24 26 28 300
5
10
15
20
25
30
p/p1
X/Hth
Cowl leading-edge location
Cowl convergenceangle3.0°5.0°7.0°8.0°8.5°
Inlet geometric throatlocation (shoulder)
IsolatorInlet

40
(a) Ramp pressure with thin boundary layer.
(b) Cowl pressure with thin boundary layer.
Figure 8. Inlet pressure distribution at different cowl convergence angles for 3.9-in. cowl (Lc/Hth = 9.75).
0
5
10
15
20
25
30
35
0 2 4 6 8 10 12 14 16 18 20 22 24 26 28 30
p/p1
X/Hth
Cowl leading-edge location
Cowl convergenceangle3.0°5.0°6.0°8.0°
10.0°
Inlet geometric throatlocation (shoulder)
IsolatorInlet
0
5
10
15
20
25
30
35
0 2 4 6 8 10 12 14 16 18 20 22 24 26 28 30
p/p1
X/Hth
Cowl convergenceangle3.0°5.0°6.0°8.0°
10.0°
Inlet geometric throatlocation (shoulder)
IsolatorInlet

41
(c) Ramp pressure with thick boundary layer.
(d) Cowl pressure with thick boundary layer.
Figure 8. Concluded.
0
5
10
15
20
25
30
35
0 2 4 6 8 10 12 14 16 18 20 22 24 26 28 30
p/p1
X/Hth
Cowl convergenceangle3.0°5.0°5.9°6.9°8.0°8.6°
Inlet geometric throatlocation (shoulder)
IsolatorInlet
Cowl leading-edge location
0
5
10
15
20
25
30
35
0 2 4 6 8 10 12 14 16 18 20 22 24 26 28 30
p/p1
X/Hth
Cowl convergenceangle3.0°5.0°5.9°6.9°8.0°8.6°
Inlet geometric throatlocation (shoulder)
IsolatorInlet
Cowl leading-edge location
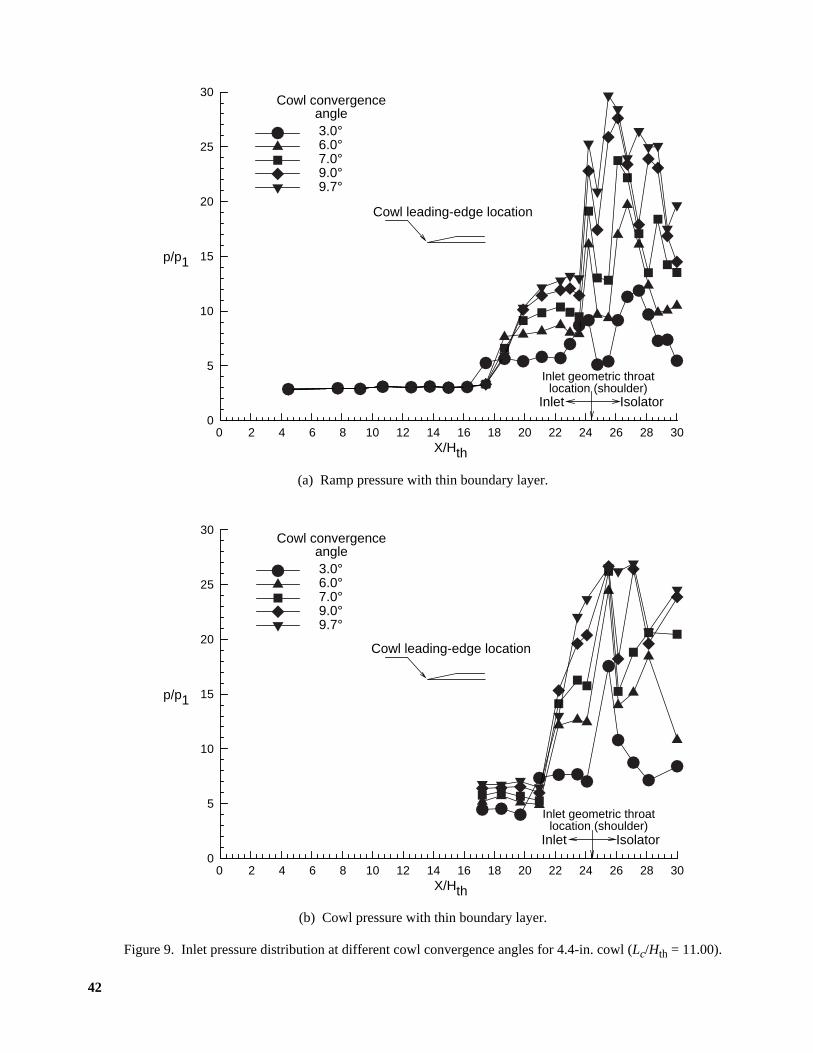
42
(a) Ramp pressure with thin boundary layer.
(b) Cowl pressure with thin boundary layer.
Figure 9. Inlet pressure distribution at different cowl convergence angles for 4.4-in. cowl (Lc/Hth = 11.00).
5
10
15
20
25
30
00 2 4 6 8 10 12 14 16 18 20 22 24 26 28 30
p/p1
X/Hth
Cowl convergenceangle3.0°6.0°7.0°9.0°9.7°
Inlet geometric throatlocation (shoulder)
IsolatorInlet
Cowl leading-edge location
5
10
15
20
25
30
00 2 4 6 8 10 12 14 16 18 20 22 24 26 28 30
p/p1
X/Hth
Cowl convergenceangle3.0°6.0°7.0°9.0°9.7°
Inlet geometric throatlocation (shoulder)
IsolatorInlet
Cowl leading-edge location

43
(c) Ramp pressure with thick boundary layer.
(d) Cowl pressure with thick boundary layer.
Figure 9. Concluded.
5
10
15
20
25
30
00 2 4 6 8 10 12 14 16 18 20 22 24 26 28 30
p/p1
X/Hth
Cowl convergenceangle3.0°5.0°6.0°8.0°8.3°
Inlet geometric throatlocation (shoulder)
IsolatorInlet
Cowl leading-edge location
5
10
15
20
25
30
00 2 4 6 8 10 12 14 16 18 20 22 24 26 28 30
p/p1
X/Hth
Cowl convergenceangle3.0°5.0°6.0°8.0°8.3°
Inlet geometric throatlocation (shoulder)
IsolatorInlet
Cowl leading-edge location
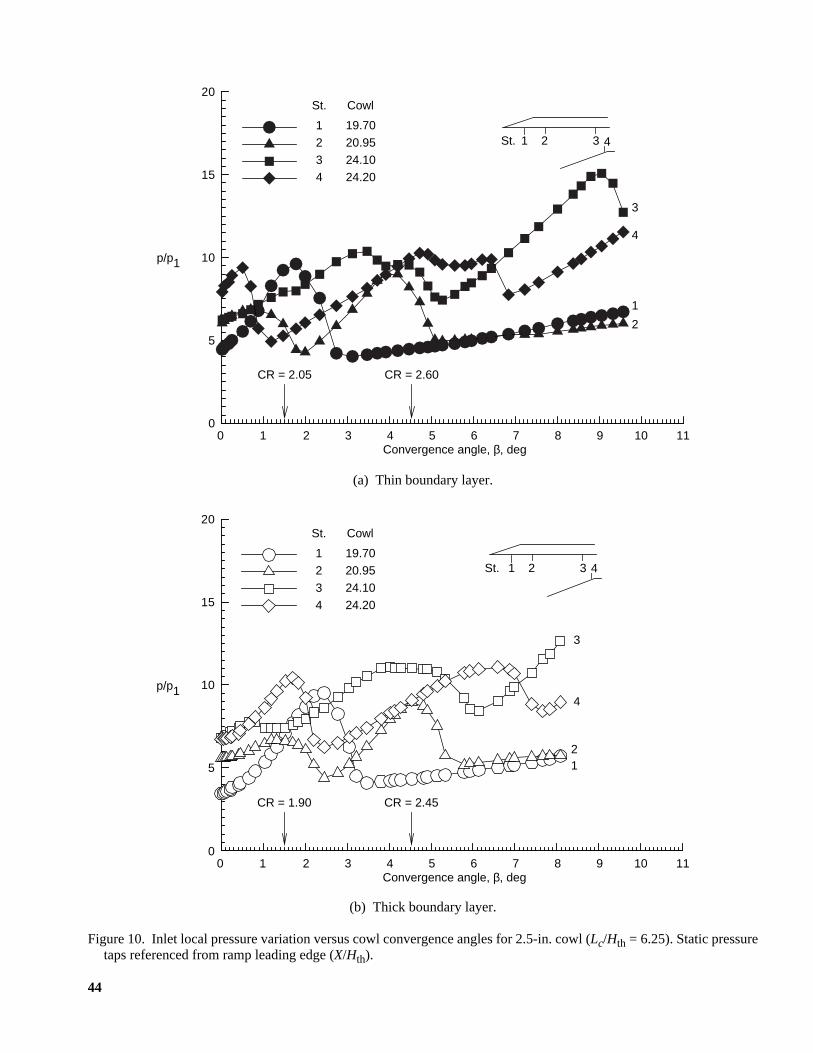
44
(a) Thin boundary layer.
(b) Thick boundary layer.
Figure 10. Inlet local pressure variation versus cowl convergence angles for 2.5-in. cowl (Lc/Hth = 6.25). Static pressuretaps referenced from ramp leading edge (X/Hth).
0 1 2 3 4 5 6 7 8 9 10 110
5
10
15
20
2St. 1 3 4
1
2
3
4
p/p1
Convergence angle, β, deg
St. Cowl
1234
19.7020.9524.1024.20
CR = 2.05 CR = 2.60
5
10
15
20
2St. 1 3 4
4
3
21
0 1 2 3 4 5 6 7 8 9 10 110
p/p1
Convergence angle, β, deg
St. Cowl
1234
19.7020.9524.1024.20
CR = 1.90 CR = 2.45

45
(a) Thin boundary layer.
(b) Thick boundary layer.
Figure 11. Inlet local pressure variation versus convergence angles for 4.4-in. cowl (Lc/Hth = 11.00). Static pressure tapsreferenced from ramp leading edge (X/Hth).
5
10
15
20
25
30
41 2 3 5
12
3
45
St.
0 1 2 3 4 5 6 7 8 9 10 110
p/p1
Convergence angle, β, deg
St. Cowl
12345
17.2019.7022.2024.1024.20
CR = 2.2 CR = 3.3 CR = 4.55
5
10
15
20
25
30
41 2 3 5
1, 2
3
5
4
St.
0 1 2 3 4 5 6 7 8 9 10 110
p/p1
Convergence angle, β, deg
St. Cowl
12345
17.2019.7022.2024.1024.20
CR = 2.05 CR = 3.16 CR = 4.4
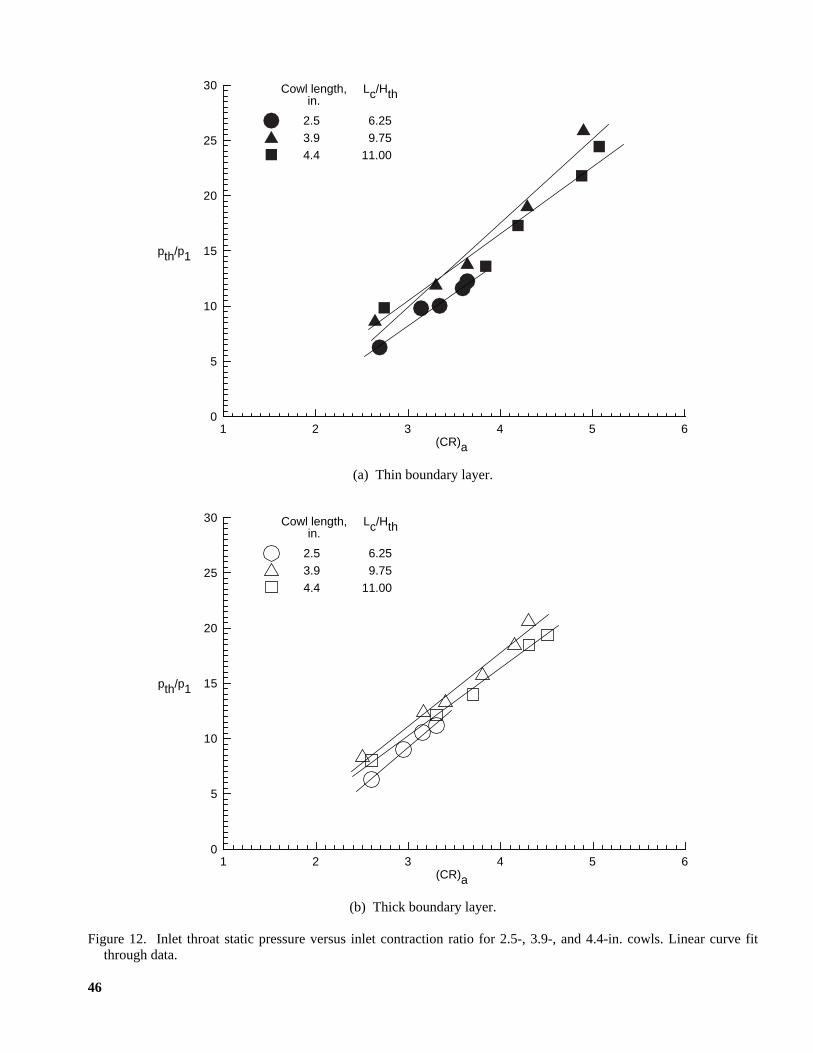
46
(a) Thin boundary layer.
(b) Thick boundary layer.
Figure 12. Inlet throat static pressure versus inlet contraction ratio for 2.5-, 3.9-, and 4.4-in. cowls. Linear curve fitthrough data.
1 2 3 4 5 60
5
10
15
20
25
30
pth/p1
(CR)a
Cowl length,in.
Lc/Hth
2.53.94.4
6.259.75
11.00
5
10
15
20
25
30
1 2 3 4 5 60
pth/p1
(CR)a
Cowl length,in.
Lc/Hth
2.53.94.4
6.259.75
11.00

47
(a) Thin boundary layer.
(b) Thick boundary layer.
Figure 13. Inlet throat Mach number versus inlet contraction ratio for 2.5-, 3.9-, and 4.4-in. cowls. Linear curve fitthrough data.
1.5
2.0
2.5
3.0
1 2 3 4 5 6
M
(CR)a
Cowl length,in.
Lc/Hth
2.53.94.4
6.259.75
11.00
1.5
2.0
2.5
3.0
1 2 3 4 5 6
M
(CR)a
Cowl length,in.
Lc/Hth
2.53.94.4
6.259.75
11.00

48
(a) Thin boundary layer.
(b) Thick boundary layer.
Figure 14. Inlet throat total pressure recovery versus inlet contraction ratio for 2.5-, 3.9-, and 4.4-in. cowls. Linear curvefit through data.
.7
.75
.80
.85
.90
.95
1.00
1 2 3 4 5 60
pt,th/pt,1
(CR)a
Cowl length,in.
Lc/Hth
2.53.94.4
6.259.75
11.00
.7
.75
.80
.85
.90
.95
1.00
1 2 3 4 5 60
pt,th/pt,1
(CR)a
Cowl length,in.
Lc/Hth
2.53.94.4
6.259.75
11.00
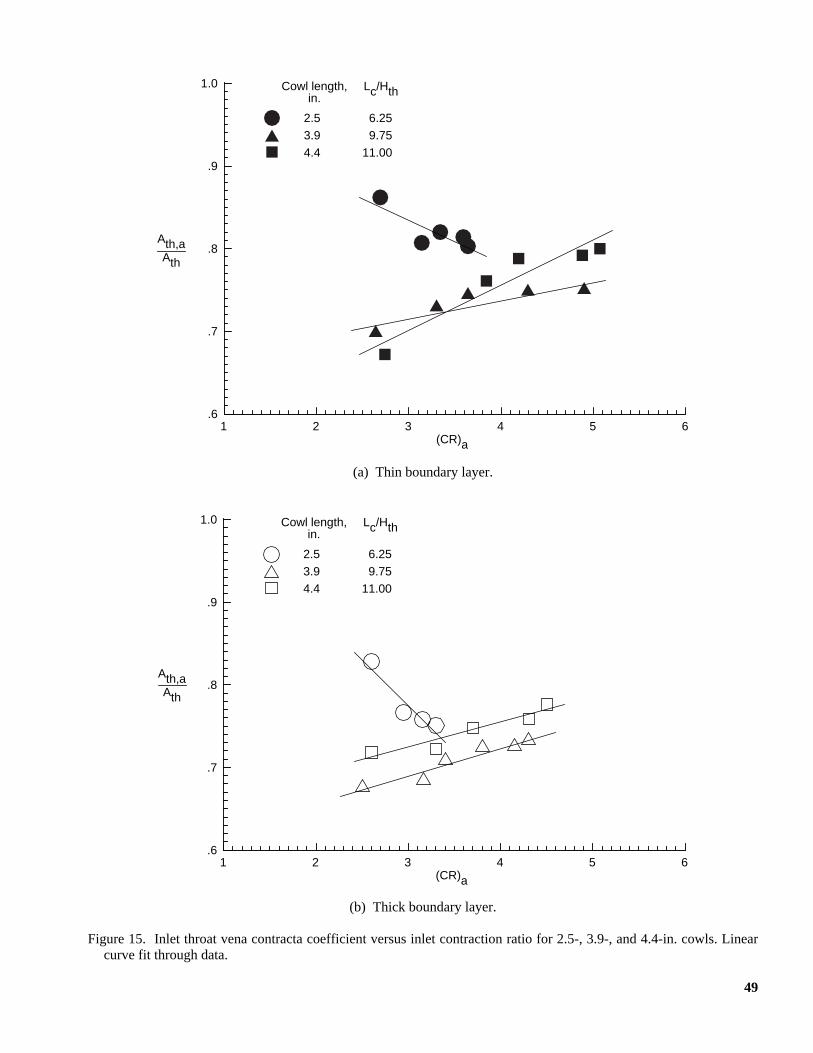
49
(a) Thin boundary layer.
(b) Thick boundary layer.
Figure 15. Inlet throat vena contracta coefficient versus inlet contraction ratio for 2.5-, 3.9-, and 4.4-in. cowls. Linearcurve fit through data.
.6
.7
.8
.9
1.0
1 2 3 4 5 6(CR)a
Cowl length,in.
Lc/Hth
2.53.94.4
6.259.75
11.00
Ath,aAth
.6
.7
.8
.9
1.0
1 2 3 4 5 6
Ath,aAth
(CR)a
Cowl length,in.
Lc/Hth
2.53.94.4
6.259.75
11.00

50
(a) Thin boundary layer (without foreplate).
(b) Thick boundary layer (with foreplate).
Figure 16. Inlet unstart and restart convergence angle range for each cowl with thin and thick boundary layers.
1 2 3 4 5 6 7 8 9 10 111.5
2.0
2.5
3.03.5
4.0
4.5
5.0
5.56.0
6.5
7.0
7.5
8.0
8.59.0
9.5
10.0
10.5
11.0
β,deg
UnstartRestart
Cowl length, Lc/Hth
1.5
2.0
2.5
3.0
3.54.0
4.5
5.0
5.5
6.0
6.57.0
7.5
8.0
8.5
9.09.5
10.0
10.5
11.0
β,deg
UnstartRestart
1 2 3 4 5 6 7 8 9 10 11Cowl length, Lc/Hth

51
(a) Inlet ramp with thin boundary layer.
(b) Inlet cowl with thin boundary layer.
Figure 17. Inlet unstart pressure distribution for each cowl with thin and thick boundary layers.
0
5
10
15
20
25
30
35
40
5
10
15
20
25
30
35
40
0 2.5 5.0 7.5 10.0 12.5 15.0 17.5 20.0 22.5 25.0 27.50
X/Hth
p/p1
Inletunstart
Cowllength,
in.
Lc/Hth Typical inlet start atmax. β before unstart
2.53.94.4
6.259.75
11.00
9.4°10.4°10.1°
Inlet throat(shoulder)
IsolatorInlet
5
10
15
20
25
30
35
40
5
10
15
20
25
35
40
0 2.5 5.0 7.5 10.0 12.5 15.0 17.5 20.0 22.5 25.0 27.50
X/Hth
p/p1
Inletunstart
Cowllength,
in.
Lc/Hth Typical inlet start atmax. β before unstart
2.53.94.4
6.259.75
11.00
9.4°10.4°10.1°
Inlet throat(shoulder)
IsolatorInlet

52
(c) Inlet ramp with thick boundary layer.
(d) Inlet cowl with thick boundary layer.
Figure 17. Concluded.
5
10
15
20
25
30
35
40
5
10
15
20
25
30
35
40
0 2.5 5.0 7.5 10.0 12.5 15.0 17.5 20.0 22.5 25.0 27.50
X/Hth
p/p1
Inletunstart
Cowllength,
in.
Lc/Hth Typical inlet start atmax. β before unstart
2.53.94.4
6.259.75
11.00
9.0°8.8°8.5°
Inlet throat(shoulder)
IsolatorInlet
5
10
15
20
25
30
35
40
5
10
15
20
25
30
35
40
0 2.5 5.0 7.5 10.0 12.5 15.0 17.5 20.0 22.5 25.0 27.50
X/Hth
p/p1
Inletunstart
Cowllength,
in.
Lc/Hth Typical inlet start atmax. β before unstart
2.53.94.4
6.259.75
11.00
9.0°8.8°8.5°
Inlet throat(shoulder)
IsolatorInlet
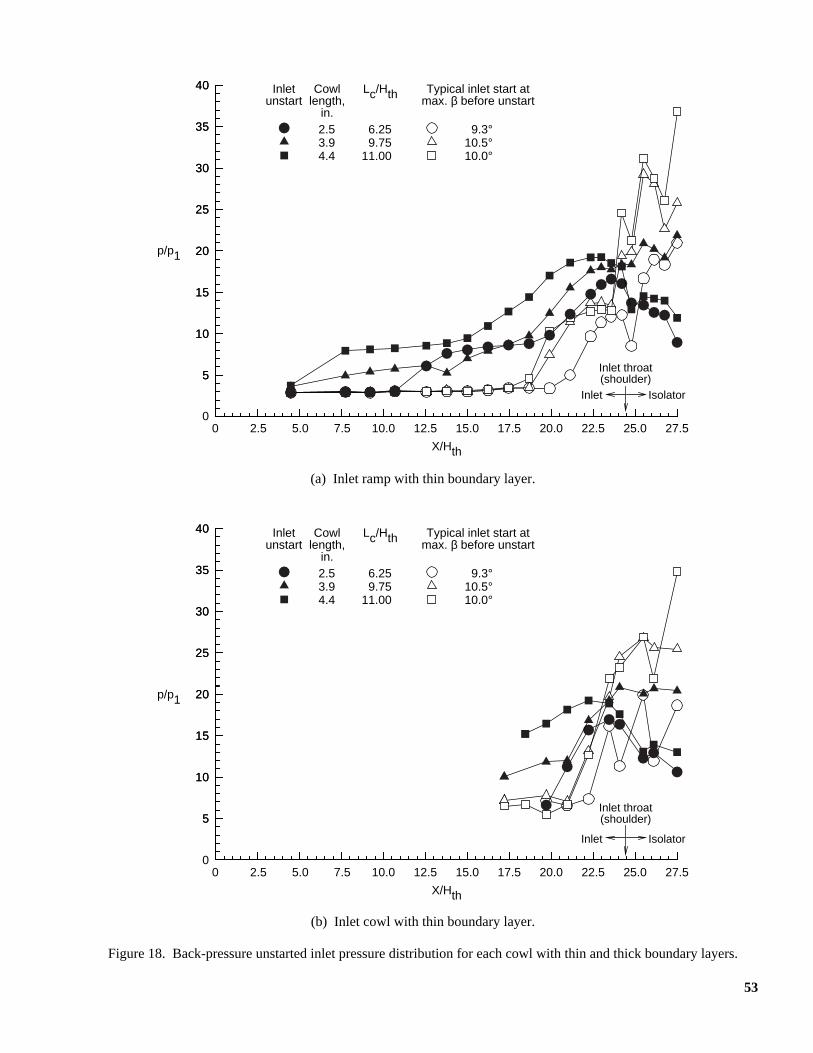
53
(a) Inlet ramp with thin boundary layer.
(b) Inlet cowl with thin boundary layer.
Figure 18. Back-pressure unstarted inlet pressure distribution for each cowl with thin and thick boundary layers.
5
10
15
20
25
30
35
40
5
10
15
20
25
30
35
40
0 2.5 5.0 7.5 10.0 12.5 15.0 17.5 20.0 22.5 25.0 27.50
X/Hth
p/p1
Inletunstart
Cowllength,
in.
Lc/Hth Typical inlet start atmax. β before unstart
2.53.94.4
6.259.75
11.00
9.3°10.5°10.0°
Inlet throat(shoulder)
IsolatorInlet
5
10
15
20
25
30
35
40
5
10
15
20
25
30
35
40
0 2.5 5.0 7.5 10.0 12.5 15.0 17.5 20.0 22.5 25.0 27.50
X/Hth
p/p1
Inletunstart
Cowllength,
in.
Lc/Hth Typical inlet start atmax. β before unstart
2.53.94.4
6.259.75
11.00
9.3°10.5°10.0°
Inlet throat(shoulder)
IsolatorInlet

54
(c) Inlet ramp with thick boundary layer.
(d) Inlet cowl with thick boundary layer.
Figure 18. Concluded.
5
10
15
20
25
30
35
40
5
10
15
20
25
30
35
40
0 2.5 5.0 7.5 10.0 12.5 15.0 17.5 20.0 22.5 25.0 27.50
X/Hth
p/p1
Inletunstart
Cowllength,
in.
Lc/Hth Typical inlet start atmax. β before unstart
2.53.94.4
6.259.75
11.00
8.9°9.5°8.5°
Inlet throat(shoulder)
IsolatorInlet
5
10
15
20
25
30
35
40
5
10
15
20
25
30
35
40
0 2.5 5.0 7.5 10.0 12.5 15.0 17.5 20.0 22.5 25.0 27.50
X/Hth
p/p1
Inletunstart
Cowllength,
in.
Lc/Hth Typical inlet start atmax. β before unstart
2.53.94.4
6.259.75
11.00
8.9°9.5°8.5°
Inlet throat(shoulder)
IsolatorInlet

55
(a) Body side atβ = 8.8° with L/Hth = 2.7. Run 40;Mth = 2.25;pN.S./p1 = 71.75.
(b) Cowl side atβ = 8.8° with L/Hth = 2.7. Run 40;Mth = 2.25;pN.S./p1 = 71.75.
Figure 19. Back-pressure effects for 2.5-in. cowl (Lc/Hth = 6.25) with thin boundary layer and high inlet convergenceangle (β = 8.4°–8.8°) for L/Hth = 2.7, 4.7, 8.7, and 16.7, and also forL/Hth = 4.7 followed by divergence angle of 6°.Constant-area isolator.
5
10
15
20
25
30
35
40
45
50
0 5 10 15 20 25 30 35 40 45 500
X/Hth
p/p1Cowl leading-edge location
Minimum back pressure
Incremental increasein back pressure
Peak pressure before inlet unstart
L/Hth = 2.7isolator
20° nozzleInlet
5
10
15
20
25
30
35
40
45
50
0 5 10 15 20 25 30 35 40 45 500
X/Hth
p/p1
Cowl leading-edge location
Minimum back pressure
Incremental increasein back pressure
Peak pressure before inlet unstart
L/Hth = 2.7isolator
20° nozzleInlet

56
(c) Body side atβ = 8.4° with L/Hth = 4.7. Run 110;Mth = 2.29;pN.S./p1 = 62.50.
(d) Cowl side atβ = 8.4° with L/Hth = 4.7. Run 110;Mth = 2.29;pN.S./p1 = 62.50.
Figure 19. Continued.
0 5 10 15 20 25 30 35 40 45 500
X/Hth
p/p1Cowl leading-edge location
Minimum back pressure
Incremental increasein back pressure
Peak pressure before inlet unstart
L/Hth = 4.7isolator
20° nozzleInlet
5
10
15
20
25
30
35
40
45
50
0 5 10 15 20 25 30 35 40 45 500
X/Hth
p/p1Cowl leading-edge location
Minimum back pressure
Incremental increasein back pressure
Peak pressure before inlet unstart
L/Hth = 4.7isolator
20° nozzleInlet
5
10
15
20
25
30
35
40
45
50

57
(e) Body side atβ = 8.7° with L/Hth = 8.7. Run 6;Mth = 2.26;pN.S./p1 = 70.0.
(f) Cowl side atβ = 8.7° with L/Hth = 8.7. Run 6;Mth = 2.26;pN.S./p1 = 70.0.
Figure 19. Continued.
0 5 10 15 20 25 30 35 40 45 55X/Hth
Cowl leading-edge location
Minimum back pressure
Incremental increasein back pressure
Peak pressure before inlet unstart
L/Hth = 8.7isolator
20° nozzle
Inlet
5
10
15
20
25
30
35
40
45
50
0
p/p1
50
0 5 10 15 20 25 30 35 40 45 55X/Hth
Cowl leading-edge location
Minimum back pressure
Incremental increasein back pressure
Peak pressure before inlet unstart
L/Hth = 8.7isolator
20° nozzleInlet
5
10
15
20
25
30
35
40
45
50
0
p/p1
50
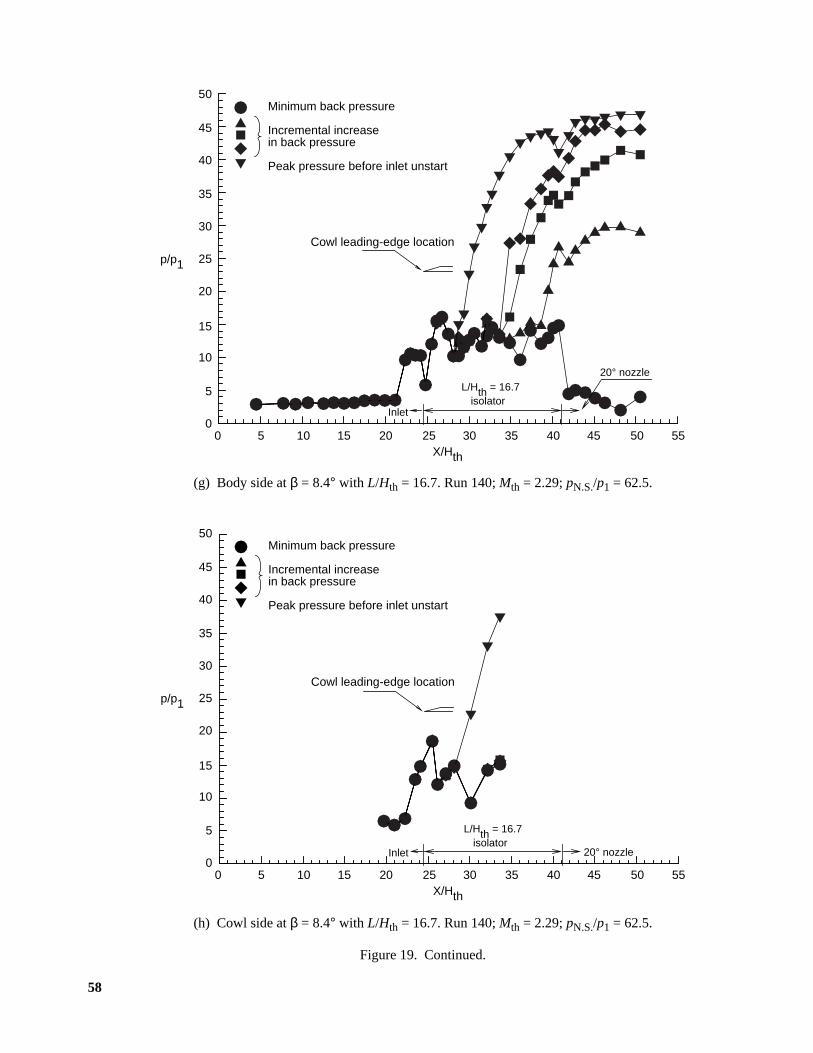
58
(g) Body side atβ = 8.4° with L/Hth = 16.7. Run 140;Mth = 2.29;pN.S./p1 = 62.5.
(h) Cowl side atβ = 8.4° with L/Hth = 16.7. Run 140;Mth = 2.29;pN.S./p1 = 62.5.
Figure 19. Continued.
0 5 10 15 20 25 30 35 40 45 55X/Hth
Cowl leading-edge location
Minimum back pressure
Incremental increasein back pressure
Peak pressure before inlet unstart
L/Hth = 16.7isolator
20° nozzle
Inlet
5
10
15
20
25
30
35
40
45
50
0
p/p1
50
0 5 10 15 20 25 30 35 40 45 55X/Hth
Cowl leading-edge location
Minimum back pressure
Incremental increasein back pressure
Peak pressure before inlet unstart
L/Hth = 16.7isolator
20° nozzleInlet
5
10
15
20
25
30
35
40
45
50
0
p/p1
50

59
(i) Body side atβ = 8.4° with L/Hth = 4.7 followed by angle of 6° divergence. Run 115;Mth = 2.29;pN.S./p1 = 62.5.
(j) Cowl side atβ = 8.4° with L/Hth = 4.7 followed by angle of 6° divergence. Run 115;Mth = 2.29;pN.S./p1 = 62.5.
Figure 19. Concluded.
0 5 10 15 20 25 30 35 40 45 55X/Hth
Cowl leading-edge location
Minimum back pressure
Incremental increasein back pressure
Peak pressure before inlet unstart
L/Hth = 4.7isolator
20° nozzleInlet
5
10
15
20
25
30
35
40
45
50
0
p/p1
50
6° expandingdiffuser
0 5 10 15 20 25 30 35 40 45 55X/Hth
Cowl leading-edge location
Minimum back pressure
Incremental increasein back pressure
Peak pressure before inlet unstart
L/Hth = 4.7isolator
20° nozzleInlet
5
10
15
20
25
30
35
40
45
50
0
p/p1
50
6° expandingdiffuser

60
(a) Body side atβ = 6° with L/Hth = 2.7. Run 40;Mth = 2.40;pN.S./p1 = 56.0.
(b) Cowl side atβ = 6° with L/Hth = 2.7. Run 40;Mth = 2.40;pN.S./p1 = 56.0.
Figure 20. Back-pressure effects for 2.5-in. cowl (Lc/Hth = 2.7) with thin boundary layer and medium inlet convergenceangle (β = 5.0°–6.0°) for L/Hth = 2.7, 4.7, 8.7, and 16.7, and also forL/Hth = 4.7 followed by divergence angle of 6°.Constant-area isolator.
0 5 10 15 20 25 30 35 40 45 50X/Hth
Cowl leading-edge location
Minimum back pressure
Incremental increasein back pressure
Peak pressure before inlet unstart
L/Hth = 2.7isolator
20° nozzleInlet
5
10
15
20
25
30
35
40
45
50
0
p/p1
0 5 10 15 20 25 30 35 40 45 50X/Hth
Cowl leading-edge location
Minimum back pressure
Incremental increasein back pressure
Peak pressure before inlet unstart
L/Hth = 2.7isolator
20° nozzleInlet
5
10
15
20
25
30
35
40
45
50
0
p/p1
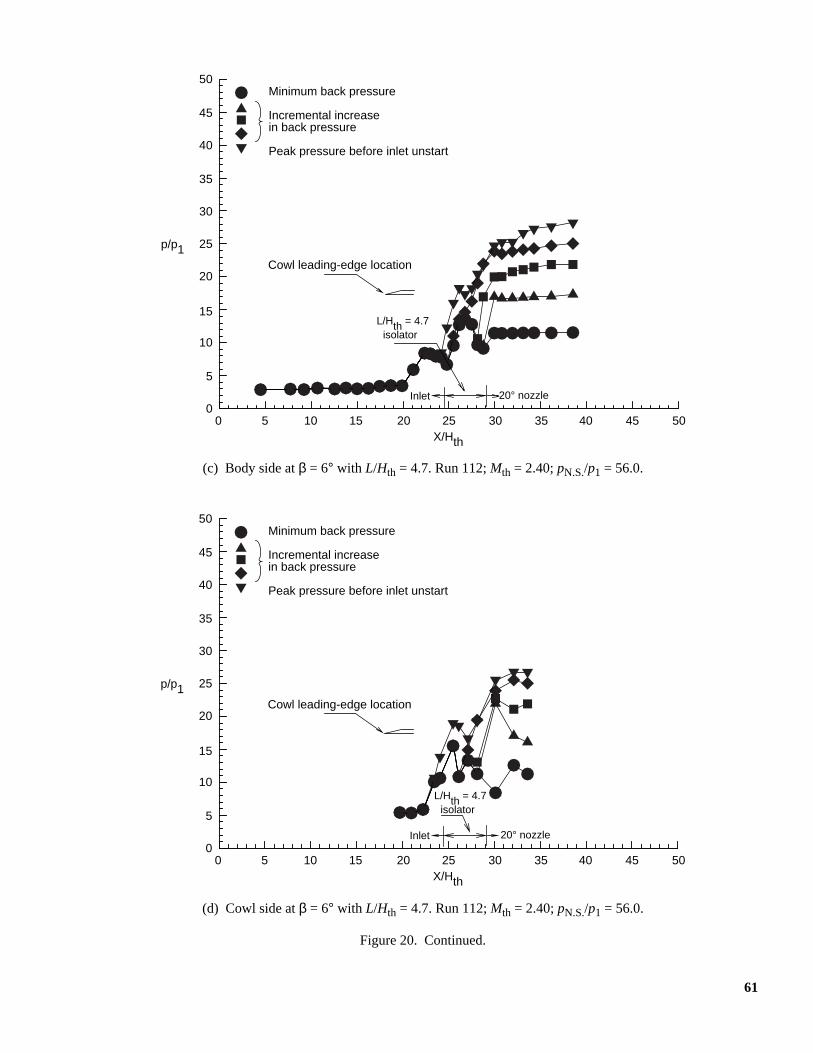
61
(c) Body side atβ = 6° with L/Hth = 4.7. Run 112;Mth = 2.40;pN.S./p1 = 56.0.
(d) Cowl side atβ = 6° with L/Hth = 4.7. Run 112;Mth = 2.40;pN.S./p1 = 56.0.
Figure 20. Continued.
0 5 10 15 20 25 30 35 40 45 50X/Hth
Cowl leading-edge location
Minimum back pressure
Incremental increasein back pressure
Peak pressure before inlet unstart
L/Hth = 4.7isolator
20° nozzleInlet
5
10
15
20
25
30
35
40
45
50
0
p/p1
0 5 10 15 20 25 30 35 40 45 50X/Hth
Cowl leading-edge location
Minimum back pressure
Incremental increasein back pressure
Peak pressure before inlet unstart
L/Hth = 4.7isolator
20° nozzleInlet
5
10
15
20
25
30
35
40
45
50
0
p/p1

62
(e) Body side atβ = 5° with L/Hth = 8.7. Run 5;Mth = 2.403;pN.S./p1 = 52.0.
(f) Cowl side atβ = 5° with L/Hth = 8.7. Run 5;Mth = 2.403;pN.S./p1 = 52.0.
Figure 20. Continued.
0 5 10 15 20 25 30 35 40 45 55X/Hth
Cowl leading-edge location
Minimum back pressure
Incremental increasein back pressure
Peak pressure before inlet unstart
L/Hth = 8.7isolator
20° nozzle
Inlet
5
10
15
20
25
30
35
40
45
50
0
p/p1
50
Cowl leading-edge location
Minimum back pressure
Incremental increasein back pressure
Peak pressure before inlet unstart
L/Hth = 8.7isolator
20° nozzleInlet
5
10
15
20
25
30
35
40
45
50
0
p/p1
0 5 10 15 20 25 30 35 40 45 55X/Hth
50
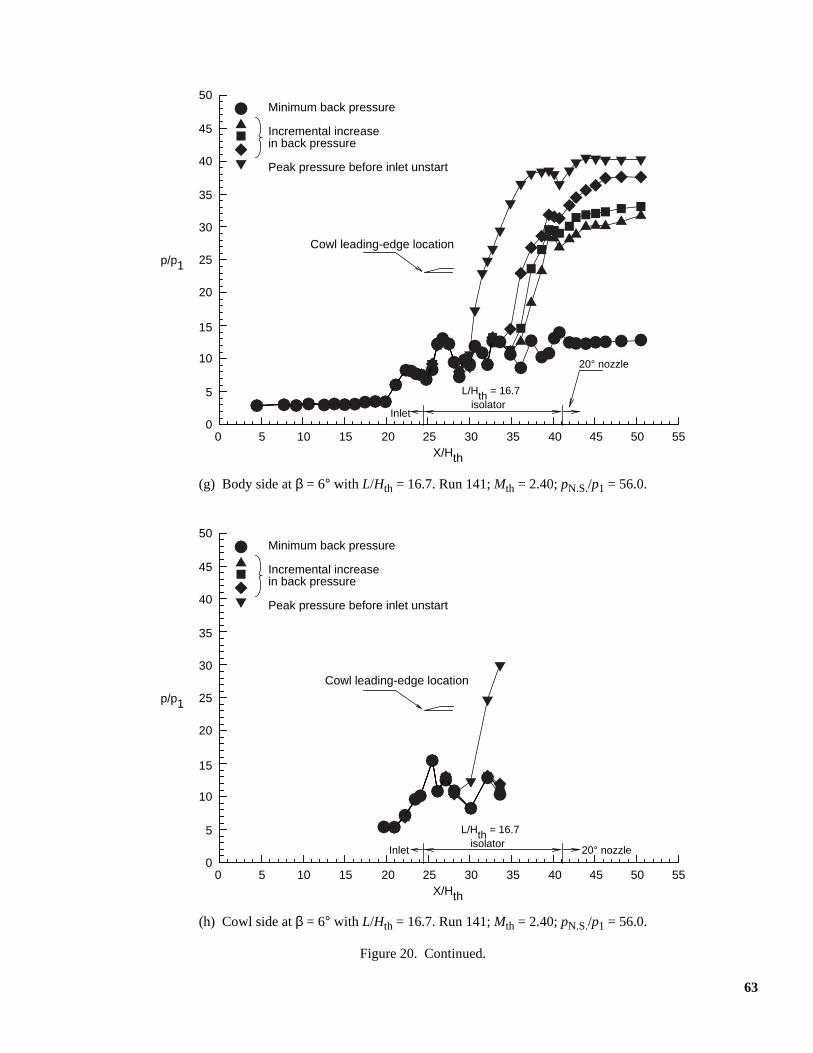
63
(g) Body side atβ = 6° with L/Hth = 16.7. Run 141;Mth = 2.40;pN.S./p1 = 56.0.
(h) Cowl side atβ = 6° with L/Hth = 16.7. Run 141;Mth = 2.40;pN.S./p1 = 56.0.
Figure 20. Continued.
0 5 10 15 20 25 30 35 40 45 55X/Hth
Cowl leading-edge location
Minimum back pressure
Incremental increasein back pressure
Peak pressure before inlet unstart
L/Hth = 16.7isolator
20° nozzle
Inlet
5
10
15
20
25
30
35
40
45
50
0
p/p1
50
0 5 10 15 20 25 30 35 40 45 55X/Hth
Cowl leading-edge location
Minimum back pressure
Incremental increasein back pressure
Peak pressure before inlet unstart
L/Hth = 16.7isolator
20° nozzleInlet
5
10
15
20
25
30
35
40
45
50
0
p/p1
50

64
(i) Body side atβ = 6° with L/Hth = 4.7 followed by angle of 6° divergence. Run 116;Mth = 2.40;pN.S./p1 = 56.0.
(j) Cowl side atβ = 6° with L/Hth = 4.7 followed by angle of 6° divergence. Run 116;Mth = 2.40;pN.S./p1 = 56.0.
Figure 20. Concluded.
0 5 10 15 20 25 30 35 40 45 55X/Hth
Cowl leading-edge location
Minimum back pressure
Incremental increasein back pressure
Peak pressure before inlet unstart
L/Hth = 4.7isolator
20° nozzleInlet
5
10
15
20
25
30
35
40
45
50
0
p/p1
50
6° expandingdiffuser
0 5 10 15 20 25 30 35 40 45 55X/Hth
Cowl leading-edge location
Minimum back pressure
Incremental increasein back pressure
Peak pressure before inlet unstart
L/Hth = 4.7isolator
20° nozzleInlet
5
10
15
20
25
30
35
40
45
50
0
p/p1
50
6° expandingdiffuser

65
(a) Body side atβ = 9.8° with L/Hth = 4.7. Run 188;Mth = 1.70;pN.S./p1 = 64.0.
(b) Cowl side atβ = 9.8° with L/Hth = 4.7. Run 188;Mth = 1.70;pN.S./p1 = 64.0.
Figure 21. Back-pressure effects for 3.9-in. cowl (Lc/Hth = 9.75) with thin boundary layer and high inlet convergenceangle (β = 9.8°) for L/Hth = 4.7. Constant-area isolator.
0 5 10 15 20 25 30 35 40 45 50X/Hth
Cowl leading-edge location
Minimum back pressure
Incremental increasein back pressure
Peak pressure before inlet unstart
L/Hth = 4.7isolator
20° nozzleInlet
5
10
15
20
25
30
35
40
45
50
0
p/p1
0 5 10 15 20 25 30 35 40 45 50X/Hth
Cowl leading-edge location
Minimum back pressure
Incremental increasein back pressure
Peak pressure before inlet unstart
L/Hth = 4.7isolator
20° nozzleInlet
5
10
15
20
25
30
35
40
45
50
0
p/p1

66
(a) Body side atβ = 5.8° with L/Hth = 4.7. Run 189;Mth = 2.15;pN.S./p1 = 68.0.
(b) Cowl side atβ = 5.8° with L/Hth = 4.7. Run 189;Mth = 2.15;pN.S./p1 = 68.0.
Figure 22. Back-pressure effects for 3.9-in. cowl (Lc/Hth = 9.75) with thin boundary layer and medium inlet conver-gence angle (β = 5.8°) for L/Hth = 4.7. Constant-area isolator.
0 5 10 15 20 25 30 35 40 45 50X/Hth
Cowl leading-edge location
Minimum back pressure
Incremental increasein back pressure
Peak pressure before inlet unstart
L/Hth = 4.7isolator
20° nozzleInlet
5
10
15
20
25
30
35
40
45
50
0
p/p1
0 5 10 15 20 25 30 35 40 45 50X/Hth
Cowl leading-edge location
Minimum back pressure
Incremental increasein back pressure
Peak pressure before inlet unstart
L/Hth = 4.7isolator
20° nozzleInlet
5
10
15
20
25
30
35
40
45
50
0
p/p1

67
(a) Body side atβ = 9.8° with L/Hth = 2.7. Run 48;Mth = 1.71;pN.S./p1 = 80.20.
(b) Cowl side atβ = 9.8° with L/Hth = 2.7. Run 48;Mth = 1.71;pN.S./p1 = 80.20.
Figure 23. Back-pressure effects for 4.4-in. cowl (Lc/Hth = 11.00) with thin boundary layer and high inlet convergenceangle (β = 9.3°–9.8°) for L/Hth = 2.7, 4.7, 8.7, and 16.7, and also forL/Hth = 4.7 followed by divergent angle of 6°.Constant-area isolator.
0
5
10
15
20
25
30
35
40
45
50
55
60
65
0 5 10 15 20 25 30 35 40 45 50X/Hth
Cowl leading-edge location
Minimum back pressure
Incremental increasein back pressure
Peak pressure before inlet unstart
L/Hth = 2.7isolator
20° nozzleInlet
p/p1
0
5
10
15
20
25
30
35
40
45
50
55
60
65
0 5 10 15 20 25 30 35 40 45 50X/Hth
Cowl leading-edge location
Minimum back pressure
Incremental increasein back pressure
Peak pressure before inlet unstart
L/Hth = 2.7isolator
20° nozzleInlet
p/p1
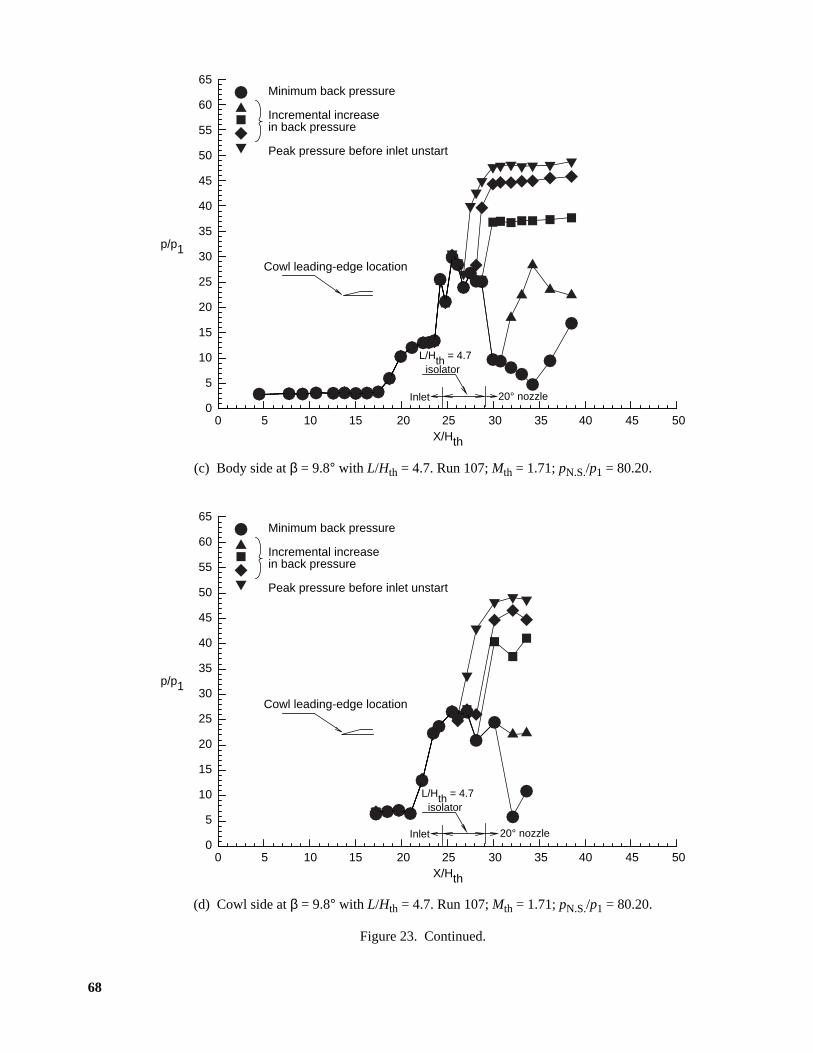
68
(c) Body side atβ = 9.8° with L/Hth = 4.7. Run 107;Mth = 1.71;pN.S./p1 = 80.20.
(d) Cowl side atβ = 9.8° with L/Hth = 4.7. Run 107;Mth = 1.71;pN.S./p1 = 80.20.
Figure 23. Continued.
0
5
10
15
20
25
30
35
40
45
50
55
60
65
0 5 10 15 20 25 30 35 40 45 50X/Hth
Cowl leading-edge location
Minimum back pressure
Incremental increasein back pressure
Peak pressure before inlet unstart
L/Hth = 4.7isolator
20° nozzleInlet
p/p1
0
5
10
15
20
25
30
35
40
45
50
55
60
65
0 5 10 15 20 25 30 35 40 45 50X/Hth
Cowl leading-edge location
Minimum back pressure
Incremental increasein back pressure
Peak pressure before inlet unstart
L/Hth = 4.7isolator
20° nozzleInlet
p/p1

69
(e) Body side atβ = 9.3° with L/Hth = 8.7. Run 10;Mth = 1.77;pN.S./p1 = 79.50.
(f) Cowl side atβ = 9.3° with L/Hth = 8.7. Run 10;Mth = 1.7;pN.S./p1 = 79.50.
Figure 23. Continued.
0
5
10
15
20
25
30
35
40
45
50
55
60
65
p/p1
0 5 10 15 20 25 30 35 40 45 55X/Hth
50
Cowl leading-edge location
Minimum back pressure
Incremental increasein back pressure
Peak pressure before inlet unstart
L/Hth = 8.7isolator
20° nozzle
Inlet
0
5
10
15
20
25
30
35
40
45
50
55
60
65
p/p1
0 5 10 15 20 25 30 35 40 45 55X/Hth
50
Cowl leading-edge location
Minimum back pressure
Incremental increasein back pressure
Peak pressure before inlet unstart
L/Hth = 8.7isolator
20° nozzleInlet

70
(g) Body side atβ = 9.8° with L/Hth = 16.7. Run 137;Mth = 1.71;pN.S./p1 = 80.20.
(h) Cowl side atβ = 9.8° with L/Hth = 16.7. Run 137;Mth = 1.71;pN.S./p1 = 80.20.
Figure 23. Continued.
0
5
10
15
20
25
30
35
40
45
50
55
60
65
p/p1
0 5 10 15 20 25 30 35 40 45 55X/Hth
50
Cowl leading-edge location
Minimum back pressure
Incremental increasein back pressure
Peak pressure before inlet unstart
L/Hth = 16.7isolator
20° nozzle
Inlet
0
5
10
15
20
25
30
35
40
45
50
55
60
65
p/p1
0 5 10 15 20 25 30 35 40 45 55X/Hth
50
Cowl leading-edge location
Minimum back pressure
Incremental increasein back pressure
Peak pressure before inlet unstart
L/Hth = 16.7isolator
20° nozzleInlet

71
(i) Body side atβ = 9.8° with L/Hth = 4.7 followed by angle of 6° divergence. Run 120;Mth = 1.71;pN.S./p1 = 80.20.
(j) Cowl side atβ = 9.8° with L/Hth = 4.7 followed by angle of 6° divergence. Run 120;Mth = 1.71;pN.S./p1 = 80.20.
Figure 23. Concluded.
0
5
10
15
20
25
30
35
40
45
50
55
60
65
p/p1
0 5 10 15 20 25 30 35 40 45 55X/Hth
50
Cowl leading-edge location
Minimum back pressure
Incremental increasein back pressure
Peak pressure before inlet unstart
L/Hth = 4.7isolator
20° nozzleInlet
6° expandingdiffuser
0
5
10
15
20
25
30
35
40
45
50
55
60
65
p/p1
0 5 10 15 20 25 30 35 40 45 55X/Hth
50
Cowl leading-edge location
Minimum back pressure
Incremental increasein back pressure
Peak pressure before inlet unstart
L/Hth = 4.7isolator
20° nozzleInlet
6° expandingdiffuser
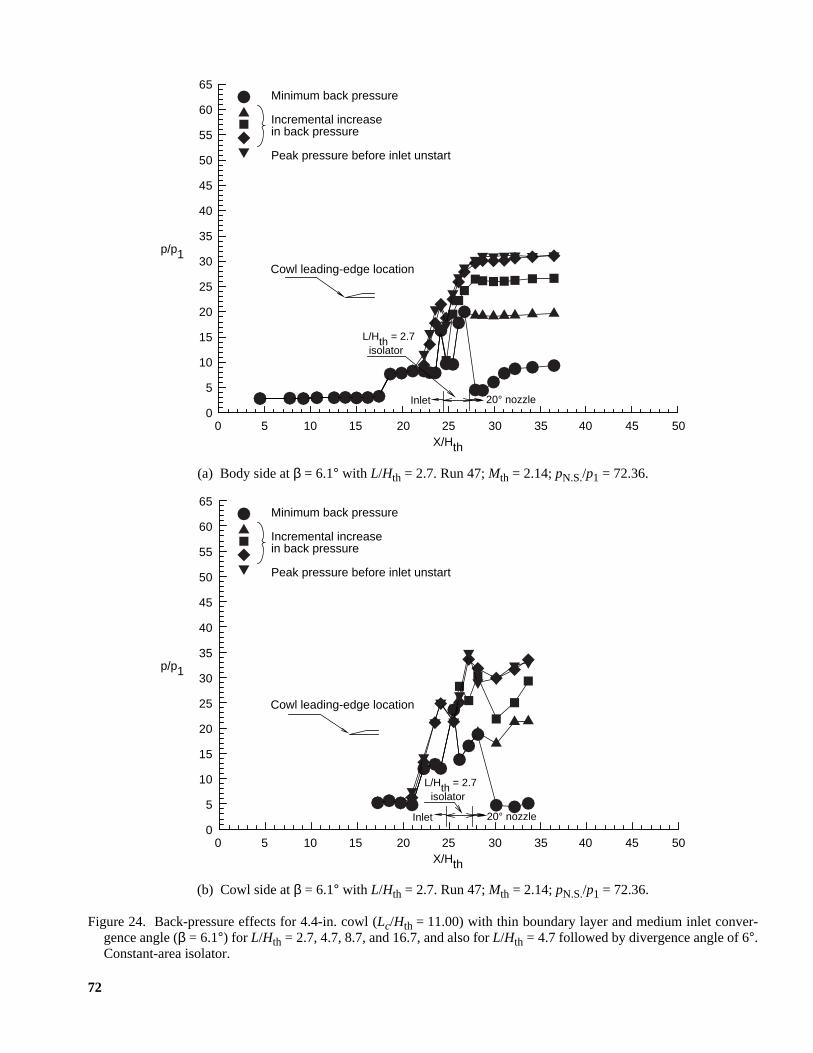
72
(a) Body side atβ = 6.1° with L/Hth = 2.7. Run 47;Mth = 2.14;pN.S./p1 = 72.36.
(b) Cowl side atβ = 6.1° with L/Hth = 2.7. Run 47;Mth = 2.14;pN.S./p1 = 72.36.
Figure 24. Back-pressure effects for 4.4-in. cowl (Lc/Hth = 11.00) with thin boundary layer and medium inlet conver-gence angle (β = 6.1°) for L/Hth = 2.7, 4.7, 8.7, and 16.7, and also forL/Hth = 4.7 followed by divergence angle of 6°.Constant-area isolator.
0
5
10
15
20
25
30
35
40
45
50
55
60
65
p/p1Cowl leading-edge location
Minimum back pressure
Incremental increasein back pressure
Peak pressure before inlet unstart
L/Hth = 2.7isolator
20° nozzleInlet
0 5 10 15 20 25 30 35 40 45 50X/Hth
0
5
10
15
20
25
30
35
40
45
50
55
60
65
p/p1
Cowl leading-edge location
Minimum back pressure
Incremental increasein back pressure
Peak pressure before inlet unstart
L/Hth = 2.7isolator
20° nozzleInlet
0 5 10 15 20 25 30 35 40 45 50X/Hth

73
(c) Body side atβ = 6.1° with L/Hth = 4.7. Run 108;Mth = 2.14;pN.S./p1 = 72.36.
(d) Cowl side atβ = 6.1° with L/Hth = 4.7. Run 108;Mth = 2.14;pN.S./p1 = 72.36.
Figure 24. Continued.
0
5
10
15
20
25
30
35
40
45
50
55
60
65
p/p1Cowl leading-edge location
Minimum back pressure
Incremental increasein back pressure
Peak pressure before inlet unstart
L/Hth = 4.7isolator
20° nozzleInlet
0 5 10 15 20 25 30 35 40 45 50X/Hth
0
5
10
15
20
25
30
35
40
45
50
55
60
65
p/p1Cowl leading-edge location
Minimum back pressure
Incremental increasein back pressure
Peak pressure before inlet unstart
L/Hth = 4.7isolator
20° nozzleInlet
0 5 10 15 20 25 30 35 40 45 50X/Hth

74
(e) Body side atβ = 6.1° with L/Hth = 8.7. Run 11;Mth = 2.14;pN.S./p1 = 72.36.
(f) Cowl side atβ = 6.1° with L/Hth = 8.7. Run 11;Mth = 2.14;pN.S./p1 = 72.36.
Figure 24. Continued.
0
5
10
15
20
25
30
35
40
45
50
55
60
65
p/p1Cowl leading-edge location
Minimum back pressure
Incremental increasein back pressure
Peak pressure before inlet unstart
L/Hth = 8.7isolator
20° nozzle
Inlet
0 5 10 15 20 25 30 35 40 45 55X/Hth
50
0
5
10
15
20
25
30
35
40
45
50
55
60
65
p/p1Cowl leading-edge location
Minimum back pressure
Incremental increasein back pressure
Peak pressure before inlet unstart
L/Hth = 8.7isolator
20° nozzleInlet
0 5 10 15 20 25 30 35 40 45 55X/Hth
50
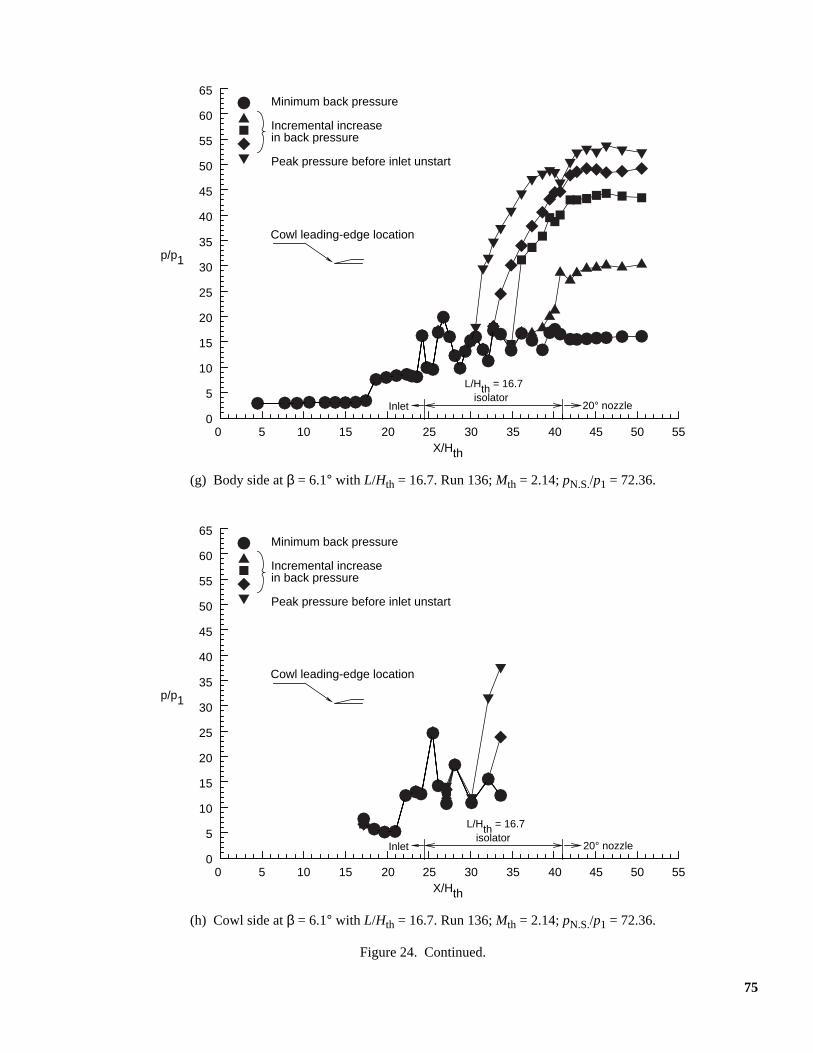
75
(g) Body side atβ = 6.1° with L/Hth = 16.7. Run 136;Mth = 2.14;pN.S./p1 = 72.36.
(h) Cowl side atβ = 6.1° with L/Hth = 16.7. Run 136;Mth = 2.14;pN.S./p1 = 72.36.
Figure 24. Continued.
0
5
10
15
20
25
30
35
40
45
50
55
60
65
p/p1
Cowl leading-edge location
Minimum back pressure
Incremental increasein back pressure
Peak pressure before inlet unstart
L/Hth = 16.7isolator
20° nozzleInlet
0 5 10 15 20 25 30 35 40 45 55X/Hth
50
0
5
10
15
20
25
30
35
40
45
50
55
60
65
p/p1
Cowl leading-edge location
Minimum back pressure
Incremental increasein back pressure
Peak pressure before inlet unstart
L/Hth = 16.7isolator
20° nozzleInlet
0 5 10 15 20 25 30 35 40 45 55X/Hth
50
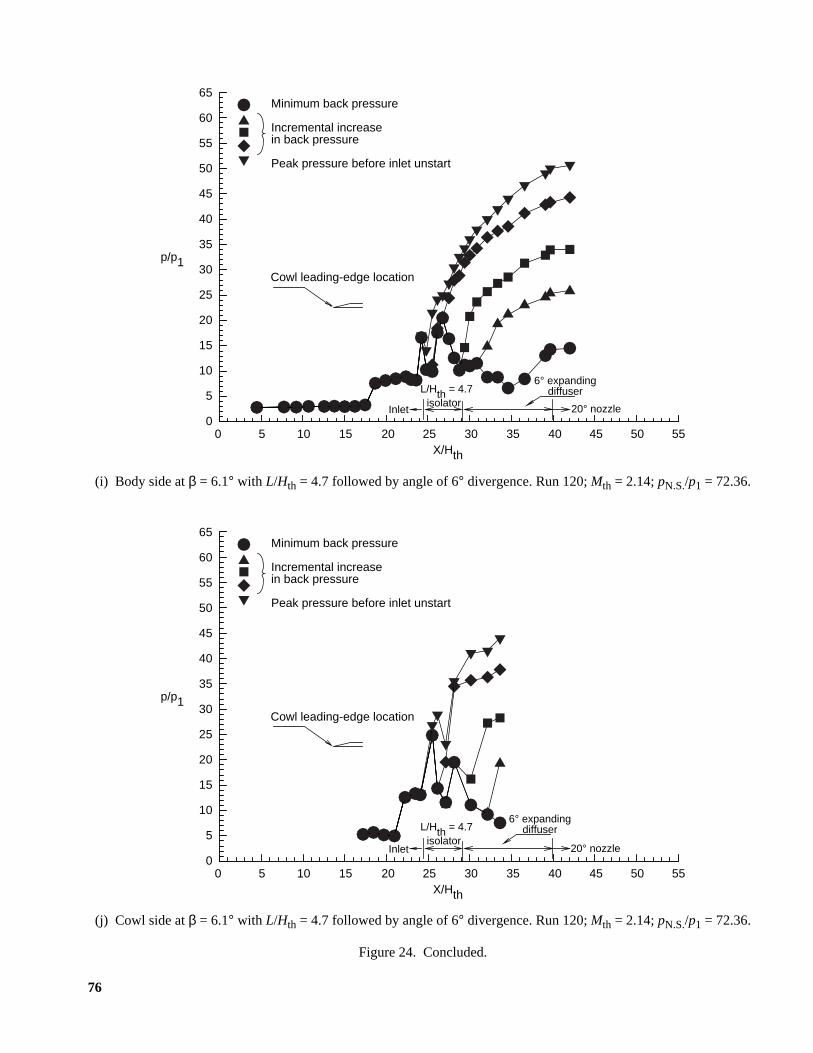
76
(i) Body side atβ = 6.1° with L/Hth = 4.7 followed by angle of 6° divergence. Run 120;Mth = 2.14;pN.S./p1 = 72.36.
(j) Cowl side atβ = 6.1° with L/Hth = 4.7 followed by angle of 6° divergence. Run 120;Mth = 2.14;pN.S./p1 = 72.36.
Figure 24. Concluded.
0
5
10
15
20
25
30
35
40
45
50
55
60
65
p/p1Cowl leading-edge location
Minimum back pressure
Incremental increasein back pressure
Peak pressure before inlet unstart
L/Hth = 4.7isolator 20° nozzleInlet
0 5 10 15 20 25 30 35 40 45 55X/Hth
50
6° expandingdiffuser
0
5
10
15
20
25
30
35
40
45
50
55
60
65
p/p1Cowl leading-edge location
Minimum back pressure
Incremental increasein back pressure
Peak pressure before inlet unstart
L/Hth = 4.7isolator
20° nozzleInlet
0 5 10 15 20 25 30 35 40 45 55X/Hth
50
6° expandingdiffuser

77
(a) Thin boundary layer.
(b) Thick boundary layer.
Figure 25. Inlet-isolator maximum back pressure with constant-area isolator lengths (L/Hth) of 2.7, 4.7, 8.7, and 16.7 for2.5-in. cowl (Lc/Hth = 6.25). Linear curve fit through data.
85
80
75
70
65
60
55
50
45
40
35
30
25
20
15
ps/p1
1 2 3 4 5 6(CR)a
2.7
4.7
8.7
16.7
Calculated normalshock pressure
L/Hth
85
80
75
70
65
60
55
50
45
40
35
30
25
20
15
ps/p1
1 2 3 4 5 6(CR)a
2.7
4.7
8.7
16.7
Calculated normalshock pressure
L/Hth

78
(a) Thin boundary layer.
(b) Thick boundary layer.
Figure 26. Inlet-isolator maximum back pressure with constant-area isolator lengths (L/Hth) of 2.7, 4.7, 8.7, and 16.7 for3.9-in. cowl (Lc/Hth = 9.75). Linear curve fit through data.
85
80
75
70
65
60
55
50
45
40
35
30
25
20
15
ps/p1
1 2 3 4 5 6(CR)a
4.7
Calculated normalshock pressure
L/Hth
85
80
75
70
65
60
55
50
45
40
35
30
25
20
15
ps/p1
1 2 3 4 5 6(CR)a
4.7
Calculated normalshock pressure
L/Hth

79
(a) Thin boundary layer.
(b) Thick boundary layer.
Figure 27. Inlet-isolator maximum back pressure with constant-area isolator lengths (L/Hth) of 2.7, 4.7, 8.7, and 16.7 for4.4-in. cowl (Lc/Hth = 11.00). Linear curve fit through data.
85
80
75
70
65
60
55
50
45
40
35
30
25
20
15
ps/p1
1 2 3 4 5 6(CR)a
2.7
4.7
8.7
16.7
Calculated normalshock pressure
L/Hth
85
80
75
70
65
60
55
50
45
40
35
30
25
20
15
ps/p1
1 2 3 4 5 6(CR)a
2.7
4.7
8.7
16.7
Calculated normalshock pressure
L/Hth

80
(a) Thin boundary layer.
(b) Thick boundary layer.
Figure 28. Effects of 2.5- and 4.4-in. cowls on inlet-isolator maximum pressure capability with constant-area isolatorlength (L/Hth) of 2.7. Linear curve fit through data.
70
65
60
55
50
45
40
35
30
25
20
15
ps/p1
1 2 3 4 5 6(CR)a
6.25
11.00
2.5
4.4
Cowl length,in.
Lc/Hth
70
65
60
55
50
45
40
35
30
25
20
15
ps/p1
1 2 3 4 5 6(CR)a
6.25
11.00
2.5
4.4
Cowl length,in.
Lc/Hth

81
(a) Thin boundary layer.
(b) Thick boundary layer.
Figure 29. Effects of 2.5-, 3.9-, and 4.4-in. cowls on inlet-isolator maximum pressure capability with constant-areaisolator length (L/Hth) of 4.7 and with step area increase. Linear curve fit through data.
70
65
60
55
50
45
40
35
30
25
20
15
ps/p1
1 2 3 4 5 6(CR)a
6.25
9.75
11.00
2.5
3.9
4.4
Cowl length,in.
Lc/Hth
70
65
60
55
50
45
40
35
30
25
20
15
ps/p1
1 2 3 4 5 6(CR)a
6.25
9.75
11.00
2.5
3.9
4.4
Cowl length,in.
Lc/Hth

82
(c) Thin boundary layer and rearward-facing steps (Ls/Hth = 0.7). Step heights are 0.050 in. on body side and 0.028 in.on cowl side.
(d) Thick boundary layer and rearward-facing steps (Ls/Hth = 0.7). Step heights are 0.050 in. on body side and 0.028 in.on cowl side.
Figure 29. Continued.
70
65
60
55
50
45
40
35
30
25
20
15
ps/p1
1 2 3 4 5 6(CR)a
6.25
11.00
2.5
4.4
Cowl length,in.
Lc/Hth
70
65
60
55
50
45
40
35
30
25
20
15
ps/p1
1 2 3 4 5 6(CR)a
6.25
11.00
2.5
4.4
Cowl length,in.
Lc/Hth

83
(e) Thin boundary layer and rearward-facing steps (Ls/Hth = 2.7). Step heights are 0.050 in. on body side and 0.028 in.on cowl side.
(f) Thick boundary layer and rearward-facing steps (Ls/Hth = 2.7). Step heights are 0.050 in. on body side and 0.028 in.on cowl side.
Figure 29. Concluded.
70
65
60
55
50
45
40
35
30
25
20
15
ps/p1
1 2 3 4 5 6(CR)a
6.25
11.00
2.5
4.4
Cowl length,in.
Lc/Hth
70
65
60
55
50
45
40
35
30
25
20
15
ps/p1
1 2 3 4 5 6(CR)a
6.25
11.00
2.5
4.4
Cowl length,in.
Lc/Hth

84
(a) Thin boundary layer.
(b) Thick boundary layer.
Figure 30. Effects of 2.5- and 4.4-in. cowls on inlet-isolator maximum pressure capability with constant-area isolatorlength (L/Hth) of 8.7. Linear curve fit through data.
70
65
60
55
50
45
40
35
30
25
20
15
ps/p1
1 2 3 4 5 6(CR)a
6.25
11.00
2.5
4.4
Cowl length,in.
Lc/Hth
70
65
60
55
50
45
40
35
30
25
20
15
ps/p1
1 2 3 4 5 6(CR)a
6.25
11.00
2.5
4.4
Cowl length,in.
Lc/Hth
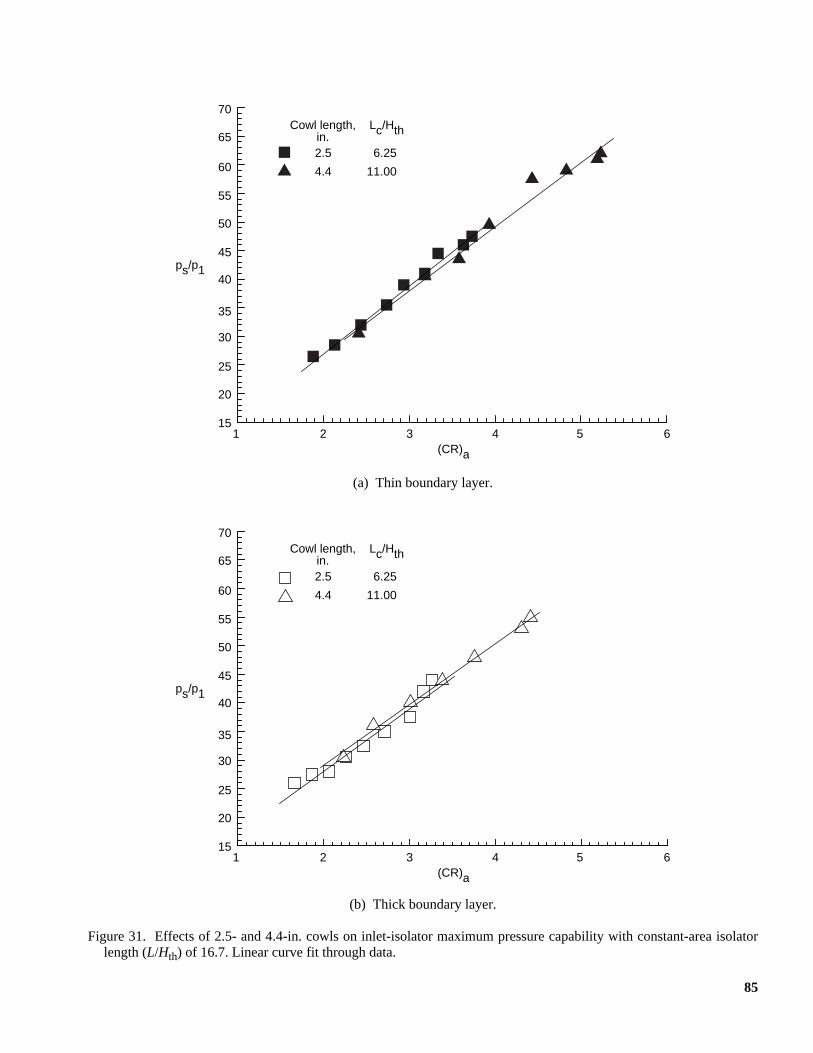
85
(a) Thin boundary layer.
(b) Thick boundary layer.
Figure 31. Effects of 2.5- and 4.4-in. cowls on inlet-isolator maximum pressure capability with constant-area isolatorlength (L/Hth) of 16.7. Linear curve fit through data.
70
65
60
55
50
45
40
35
30
25
20
15
ps/p1
1 2 3 4 5 6(CR)a
6.25
11.00
2.5
4.4
Cowl length,in.
Lc/Hth
70
65
60
55
50
45
40
35
30
25
20
15
ps/p1
1 2 3 4 5 6(CR)a
6.25
11.00
2.5
4.4
Cowl length,in.
Lc/Hth
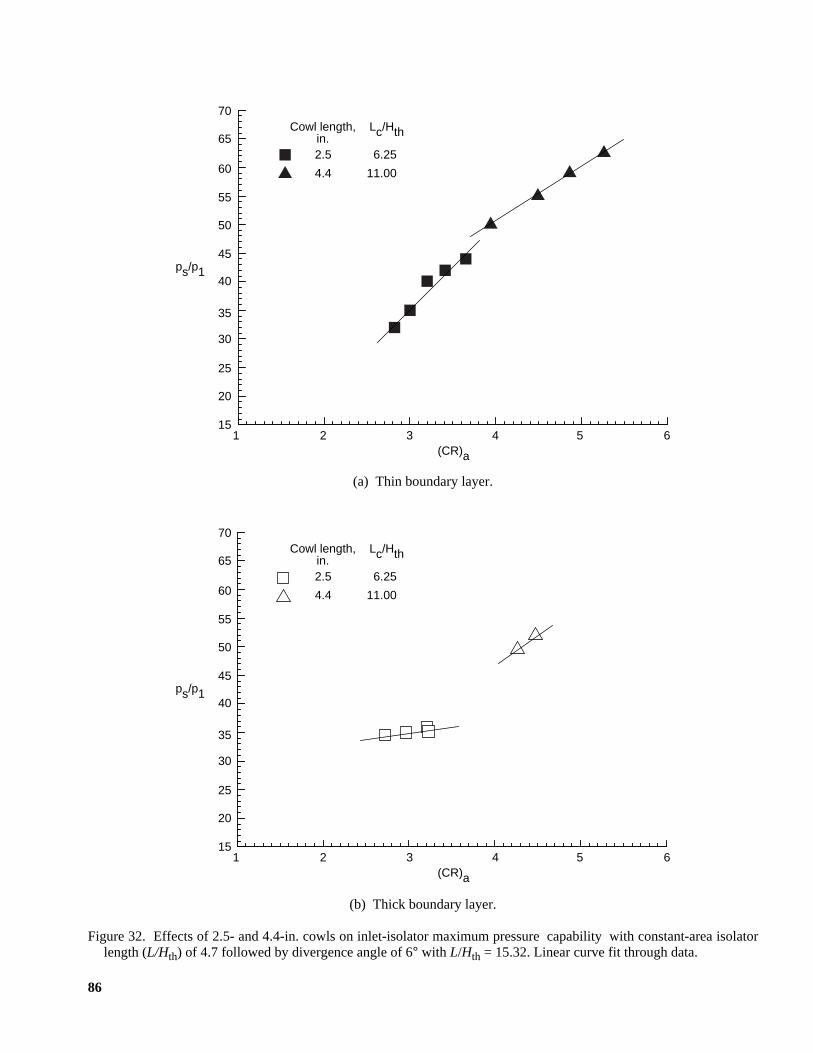
86
(a) Thin boundary layer.
(b) Thick boundary layer.
Figure 32. Effects of 2.5- and 4.4-in. cowls on inlet-isolator maximum pressure capability with constant-area isolatorlength (L/Hth) of 4.7 followed by divergence angle of 6° with L/Hth = 15.32. Linear curve fit through data.
70
65
60
55
50
45
40
35
30
25
20
15
ps/p1
1 2 3 4 5 6(CR)a
6.25
11.00
2.5
4.4
Cowl length,in.
Lc/Hth
70
65
60
55
50
45
40
35
30
25
20
15
ps/p1
1 2 3 4 5 6(CR)a
6.25
11.00
2.5
4.4
Cowl length,in.
Lc/Hth
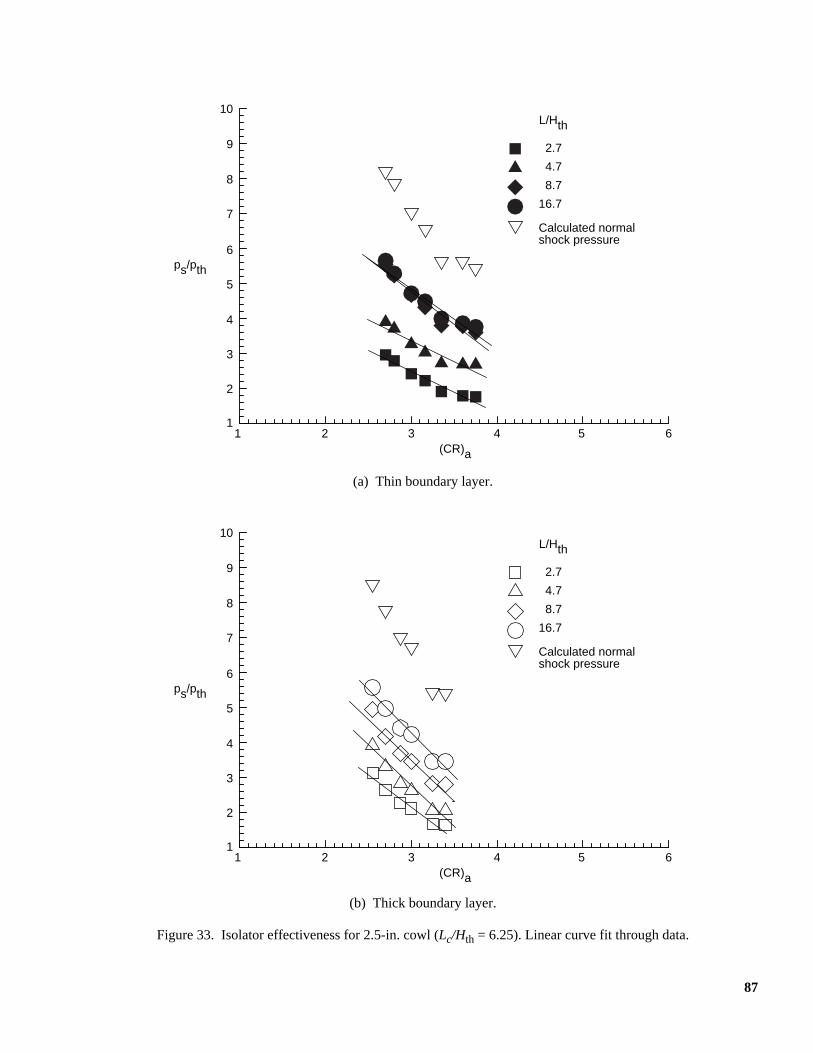
87
(a) Thin boundary layer.
(b) Thick boundary layer.
Figure 33. Isolator effectiveness for 2.5-in. cowl (Lc/Hth = 6.25). Linear curve fit through data.
10
1
ps/pth
1 2 3 4 5 6(CR)a
2.7
4.7
8.7
16.7
L/Hth
9
8
7
6
5
4
3
2
Calculated normalshock pressure
10
1
ps/pth
1 2 3 4 5 6(CR)a
2.7
4.7
8.7
16.7
L/Hth
9
8
7
6
5
4
3
2
Calculated normalshock pressure
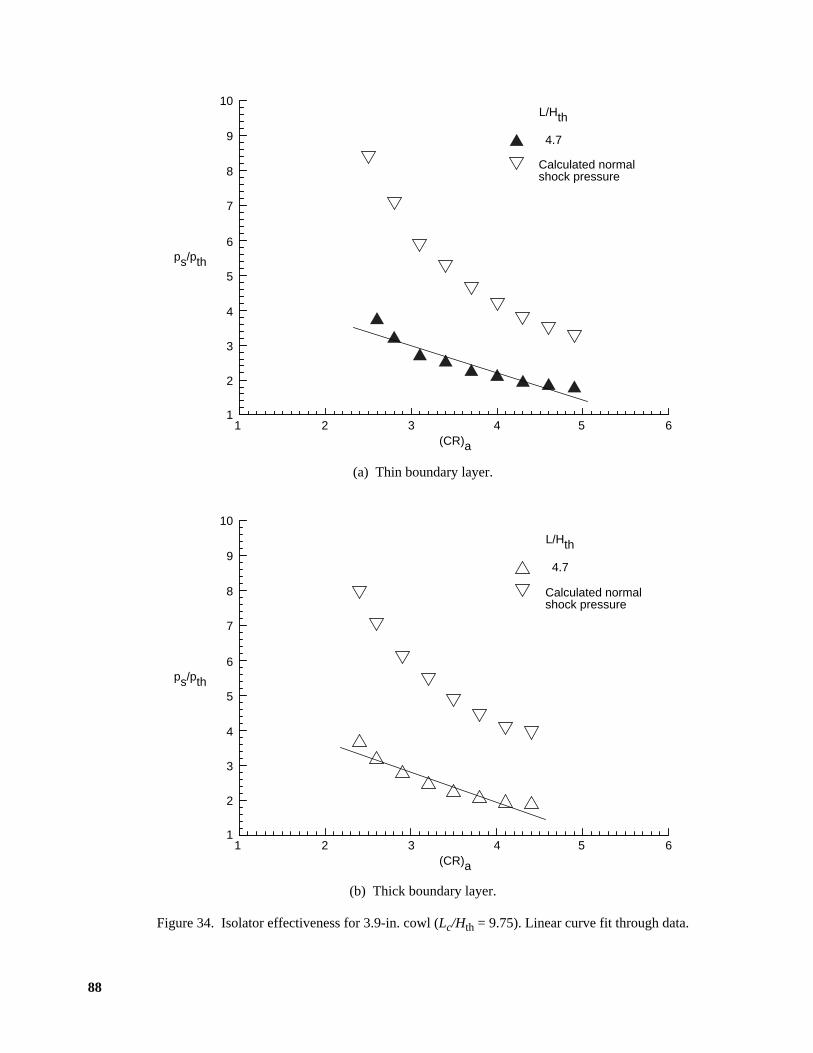
88
(a) Thin boundary layer.
(b) Thick boundary layer.
Figure 34. Isolator effectiveness for 3.9-in. cowl (Lc/Hth = 9.75). Linear curve fit through data.
10
1
ps/pth
1 2 3 4 5 6(CR)a
4.7
L/Hth
9
8
7
6
5
4
3
2
Calculated normalshock pressure
10
1
ps/pth
1 2 3 4 5 6(CR)a
4.7
L/Hth9
8
7
6
5
4
3
2
Calculated normalshock pressure

89
(a) Thin boundary layer.
(b) Thick boundary layer.
Figure 35. Isolator effectiveness for 4.4-in. cowl (Lc/Hth = 11.00). Linear curve fit through data.
10
1
ps/pth
1 2 3 4 5 6(CR)a
2.7
4.7
8.7
16.7
L/Hth
9
8
7
6
5
4
3
2
Calculated normalshock pressure
10
1
ps/pth
1 2 3 4 5 6(CR)a
2.7
4.7
8.7
16.7
L/Hth
9
8
7
6
5
4
3
2
Calculated normalshock pressure

Form ApprovedOMB No. 0704-0188
Public reporting burden for this collection of information is estimated to average 1 hour per response, including the time for reviewing instructions, searching existing data sources,gathering and maintaining the data needed, and completing and reviewing the collection of information. Send comments regarding this burden estimate or any other aspect of thiscollection of information, including suggestions for reducing this burden, to Washington Headquarters Services, Directorate for Information Operations and Reports, 1215 JeffersonDavis Highway, Suite 1204, Arlington, VA 22202-4302, and to the Office of Management and Budget, Paperwork Reduction Project (0704-0188), Washington, DC 20503.
1. AGENCY USE ONLY (Leave blank) 2. REPORT DATE 3. REPORT TYPE AND DATES COVERED
4. TITLE AND SUBTITLE 5. FUNDING NUMBERS
6. AUTHOR(S)
7. PERFORMING ORGANZATION NAME(S) AND ADDRESS(ES)
9. SPONSORIING/MONITORING AGENCY NAME(S) AND ADDRESS(ES)
11. SUPPLEMENTARY NOTES
8. PERFORMING ORGANIZATIONREPORT NUMBER
10. SPONSORING/MONITORINGAGENCY REPORT NUMBER
12a. DISTRIBUTION/AVAILABILITY STATEMENT 12b. DISTRIBUTION CODE
13. ABSTRACT (Maximum 200 words)
14. SUBJECT TERMS
17. SECURITY CLASSIFICATIONOF REPORT
18. SECURITY CLASSIFICATIONOF THIS PAGE
19. SECURITY CLASSIFICATIONOF ABSTRACT
20. LIMITATIONOF ABSTRACT
15. NUMBER OF PAGES
16. PRICE CODE
NSN 7540-01-280-5500 Standard Form 298 (Rev. 2-89)Prescribed by ANSI Std. Z39-18298-102
REPORT DOCUMENTATION PAGE
May 1995 Technical Paper
Experimental Investigation of Inlet-Combustor Isolators for a Dual-ModeScramjet at a Mach Number of 4 WU 505-70-62-01
Saied Emami, Carl A. Trexler, Aaron H. Auslender, and John P. Weidner
L-17422
NASA TP-3502
Emami and Auslender: Lockheed Engineering & Sciences Company, Hampton, VA; Trexler and Weidner: LangleyResearch Center, Hampton, VA.
This report details experimentally derived operational characteristics of numerous two-dimensional planar inlet-combustor isolator configurations at a Mach number of 4. Variations in geometry included (1) inlet cowl length,(2) inlet cowl rotation angle, (3) isolator length, and (4) utilization of a rearward-facing isolator step. To obtaininlet-isolator maximum pressure-rise data relevant to ramjet-engine combustion operation, configurations weremechanically back pressured. Results demonstrated that the combined inlet-isolator maximum back-pressure capa-bility increases as a function of isolator length and contraction ratio, and that the initiation of unstart is nearly inde-pendent of inlet cowl length, inlet cowl contraction ratio, and mass capture. Additionally, data are presentedquantifying the initiation of inlet unstarts and the corresponding unstart pressure levels.
Inlet and isolator; Inlet unstart; Inlet restart; Supersonic inlet; Isolator back pressure;Isolator performance; Inlet operation; Ramjet; Scramjet; Combustion back pressure
90
A05
NASA Langley Research CenterHampton, VA 23681-0001
National Aeronautics and Space AdministrationWashington, DC 20546-0001
Unclassified–UnlimitedSubject Category 07Availability: NASA CASI (301) 621-0390
Unclassified Unclassified Unclassified