InTech-Discrete Damage Modelling for Computer Aided Acoustic Emissions in Health Monitoring

Experimental investigation of acoustic emissions and their momenttensors in rock during failure
Eyvind Aker a,n, Daniela Kühn b, Václav Vavryčuk c, Magnus Soldal a, Volker Oye b
a Norwegian Geotechnical Institute, Sognsveien 72, 0806 Oslo, Norwayb NORSAR, Gunnar Randers vei 15, 2007 Kjeller, Norwayc Institute of Geophysics, Academy of Sciences, Boční II/1401, Praha 4, 141 00 Praha, Czech Republic
a r t i c l e i n f o
Article history:Received 29 November 2012Received in revised form13 February 2014Accepted 4 May 2014
Keywords:Acoustic emissionsFocal mechanismsMoment tensorsRock fracturingHoop stressesLaboratory experiment
a b s t r a c t
We study acoustic emissions (AEs) associated with shear and tensile failures around a horizontalborehole in a sandstone sample subjected to triaxial stress. The aim is to relate the AE event rate tomacroscopic observations of sample deformation and the percentage of isotropic and deviatoriccomponents of the seismic moment tensors to the expected failure mechanisms. The horizontal holeinterferes with the applied load and forms a strongly spatially dependent anisotropic stress field,focusing the crack initiation into both shear and tensile failures. The recorded AEs follows reasonablywell existing damage models, but the elastic solution of hoop stress does not represent the onset offailure around the borehole. The focal mechanisms correlate with the orientation of macroscopicfractures in the sample. Events close to the borehole show a higher fraction of isotropic percentage inmoment tensors compared to events occurring in the macroscopic fracture featuring higher double-couple percentages. The inhomogeneous stress field due to the borehole and the stress induced damageis strongly affecting the axial and radial velocities which in turn affect the waveforms of the recorded AEsand the resulting moment tensors. The VP/VS ratio obtained from the ratio of isotropic to compensatedlinear vector dipole components of the moment tensors is close to that obtained from ultrasonic velocitymeasurements.
& 2014 Elsevier Ltd. All rights reserved.
1. Introduction
Acoustic emissions (AEs) are elastic waves generated sponta-neously from the creation of micro-cracks (micro-fractures) whena rock is subjected to sufficiently high load. The AE waveformsfeature remarkable similarities with earthquakes and thus, record-ing and analyzing them may improve understanding of a widerange of fracture processes [1]. So far, the failure processes havebeen studied by AEs in various types of rocks, concretes and inengineered materials finding applications in material science aswell as in geosciences (e.g. [2]). Often cited is the classical work byLockner et al. [3], studying fracture propagation in granite usingAEs as feedback control to the loading system to slow down themacroscopic failure of the sample. More recently, AEs have beenused to study fracturing due to fluid injection and pore pressurechanges [4,5], the formation of compaction bands [6,7], theevolution of borehole breakouts [8], and the creation of fracturesunder polyaxial stress conditions [9].
The aim of the paper is to study a variety of source mechanismsof AE events associated with crack initiation, coalescence andmacroscopic failure of a rock sample subjected to increasing loadand forming complex stress conditions. The sample is loaded in atriaxial apparatus where AE waveforms and macroscopic para-meters like stress, strain and acoustic velocities are recorded. Thesample contains a small cylindrical hole to simulate a situationobserved in situ in boreholes (e.g., during hydrocarbon production,subsurface waste or CO2 injection) and in mining seismology (e.g.,stress accumulation close to tunnels and shafts). The cylindricalhole interferes with the applied load and forms a strongly spatiallydependent anisotropic stress field focusing the crack initiation intoshear and tensile failures.
A detailed spatio-temporal evolution of the AE activity ismonitored from the very beginning of loading to the final stageof creating a major fracture in the sample. The AE events arelocated and compared to the macroscopic failure planes using anX-ray CT scanner. The AE event rate is related to macroscopicstress and strain behavior using existing damage models. Fullwaveforms of AEs are investigated to calculate source mechanismsand seismic moment tensors which proved to be a useful toolfor quantitative characterization of source mechanisms of AEs[1,10–14]. In contrast to standard fault-plane solutions assuming
Contents lists available at ScienceDirect
journal homepage: www.elsevier.com/locate/ijrmms
International Journal ofRock Mechanics & Mining Sciences
http://dx.doi.org/10.1016/j.ijrmms.2014.05.0031365-1609/& 2014 Elsevier Ltd. All rights reserved.
n Correspondence to: AGR Petroleum Services, Karenslyst allé 4, 0213 Oslo,Norway. Tel.: þ47 47 90 77 02.
E-mail address: [email protected] (E. Aker).
International Journal of Rock Mechanics & Mining Sciences 70 (2014) 286–295
pure shear fracturing, moment tensors take into account volu-metric components of the source as well as combinations of shearwith tensile or compressive motions [15,16] and can thus be usedfor interpreting a non-reversible decrease or increase of rockvolume during uniaxial or triaxial laboratory experiments on rockspecimens [e.g. 17,18]. The moment tensors were computed fora subset of recorded events and associated with the expectedfailure mechanisms around the borehole. We also discuss how theanisotropic stress field influences the macroscopic velocities andthe resulting moment tensors. Finally, we estimate the ratio ofcompressional to shear velocity (VP/VS) using the ratio of isotropic(ISO) to compensated linear vector dipole (CLVD) components ofthe moment tensors and compare it to the velocity measurements.
2. The experimental setup
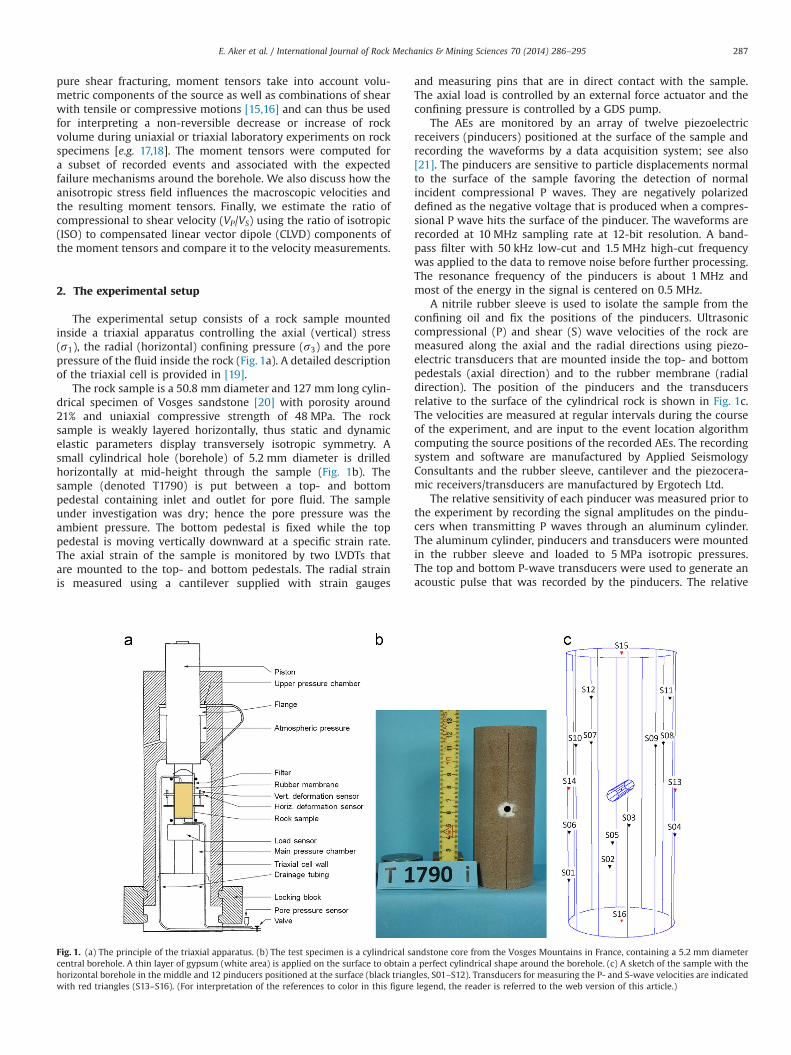
The experimental setup consists of a rock sample mountedinside a triaxial apparatus controlling the axial (vertical) stress(s1), the radial (horizontal) confining pressure (s3) and the porepressure of the fluid inside the rock (Fig. 1a). A detailed descriptionof the triaxial cell is provided in [19].
The rock sample is a 50.8 mm diameter and 127 mm long cylin-drical specimen of Vosges sandstone [20] with porosity around21% and uniaxial compressive strength of 48 MPa. The rocksample is weakly layered horizontally, thus static and dynamicelastic parameters display transversely isotropic symmetry. Asmall cylindrical hole (borehole) of 5.2 mm diameter is drilledhorizontally at mid-height through the sample (Fig. 1b). Thesample (denoted T1790) is put between a top- and bottompedestal containing inlet and outlet for pore fluid. The sampleunder investigation was dry; hence the pore pressure was theambient pressure. The bottom pedestal is fixed while the toppedestal is moving vertically downward at a specific strain rate.The axial strain of the sample is monitored by two LVDTs thatare mounted to the top- and bottom pedestals. The radial strainis measured using a cantilever supplied with strain gauges
and measuring pins that are in direct contact with the sample.The axial load is controlled by an external force actuator and theconfining pressure is controlled by a GDS pump.
The AEs are monitored by an array of twelve piezoelectricreceivers (pinducers) positioned at the surface of the sample andrecording the waveforms by a data acquisition system; see also[21]. The pinducers are sensitive to particle displacements normalto the surface of the sample favoring the detection of normalincident compressional P waves. They are negatively polarizeddefined as the negative voltage that is produced when a compres-sional P wave hits the surface of the pinducer. The waveforms arerecorded at 10 MHz sampling rate at 12-bit resolution. A band-pass filter with 50 kHz low-cut and 1.5 MHz high-cut frequencywas applied to the data to remove noise before further processing.The resonance frequency of the pinducers is about 1 MHz andmost of the energy in the signal is centered on 0.5 MHz.
A nitrile rubber sleeve is used to isolate the sample from theconfining oil and fix the positions of the pinducers. Ultrasoniccompressional (P) and shear (S) wave velocities of the rock aremeasured along the axial and the radial directions using piezo-electric transducers that are mounted inside the top- and bottompedestals (axial direction) and to the rubber membrane (radialdirection). The position of the pinducers and the transducersrelative to the surface of the cylindrical rock is shown in Fig. 1c.The velocities are measured at regular intervals during the courseof the experiment, and are input to the event location algorithmcomputing the source positions of the recorded AEs. The recordingsystem and software are manufactured by Applied SeismologyConsultants and the rubber sleeve, cantilever and the piezocera-mic receivers/transducers are manufactured by Ergotech Ltd.
The relative sensitivity of each pinducer was measured prior tothe experiment by recording the signal amplitudes on the pindu-cers when transmitting P waves through an aluminum cylinder.The aluminum cylinder, pinducers and transducers were mountedin the rubber sleeve and loaded to 5 MPa isotropic pressures.The top and bottom P-wave transducers were used to generate anacoustic pulse that was recorded by the pinducers. The relative
Fig. 1. (a) The principle of the triaxial apparatus. (b) The test specimen is a cylindrical sandstone core from the Vosges Mountains in France, containing a 5.2 mm diametercentral borehole. A thin layer of gypsum (white area) is applied on the surface to obtain a perfect cylindrical shape around the borehole. (c) A sketch of the sample with thehorizontal borehole in the middle and 12 pinducers positioned at the surface (black triangles, S01–S12). Transducers for measuring the P- and S-wave velocities are indicatedwith red triangles (S13–S16). (For interpretation of the references to color in this figure legend, the reader is referred to the web version of this article.)
E. Aker et al. / International Journal of Rock Mechanics & Mining Sciences 70 (2014) 286–295 287

sensitivity of the pinducers was defined as the relative amplitudeof the first phase after compensating the amplitude for source-receiver distance. These relative sensitivity values were used whenlater computing moment tensors of the AE sources (after Pettitt[14]). The absolute sensitivity of the transducers has not beenmeasured and therefore the seismic moment reported here is arelative measure.
3. Relating AEs to macroscopic deformation and failure
The sample was first loaded isotropically to s1 ¼s3 ¼ 10 MPa.Then the deviatoric stress ðs1�s3Þ was increased until failure ofthe sample while keeping the confining stress constant. The maxi-mum vertical stress before macroscopic failure was 76.3 MPa.The AE activity was monitored when s1�s340 (shearing phase)until post-failure of the sample. In total, more than 33,000 hits(i.e., a voltage signals recorded by a receiver being above a pre-defined threshold value) were registered on individual receivers.An AE event constitutes a set of hits that triggered three or morereceivers within a small time window. The hits were grouped intoAE events and their full waveforms were recorded with length ofthe 102.4 ms. The data acquisition system captured 2551 AE events.
Fig. 2 shows the stress–strain curves and the rate of AEs forincreasing deviatoric stress. The recorded event rate at peak stressis about 250 events per minute followed by a peak in event rate of550 during shearing on the failure plane. The estimated event rateis based on the 2551 recorded events with waveforms. The stress–strain curve can be divided into six phases corresponding to [22]:i) micro-crack closure and stiffening of the sample; ii) linear elasticbehavior; iii) initiation of dilatancy and non-linear behavior; iv)localization of deformation during hardening; v) peak strengthand macroscopic failure; and vi) residual behavior. In the figure,the deviatoric stress–axial strain curve is reasonably matched upto peak with a damage model based on AEs [23]. The modelassumes isotropic damage from open cracks and a crack densityproportional to the number of AEs giving:
s1�s3 ¼ε1E0
1þkNAEð1Þ
where E0 is the initial elastic modulus, k is a constant, and NAE isthe number of AEs and ε1 the axial strain. In Fig. 2, the curve fit isobtained using E0 ¼ 12 GPa and k¼ 10�4.
Fig. 3 shows the volumetric strain (positive means contraction)and cumulative number of AEs as a function of the vertical stressapplied up to peak strength. Four stages of AEs are clearly seen:before point A, no AEs are detected. After a first phase of slowlinear increase (A to B), the cumulative number of AEs increasesharply until point C, where an accelerated phase of AEs starts.Intuitively, we expect that the first phase of AEs is related todevelopment of borehole breakouts in a global contracting beha-vior of the sample. Phases B to C corresponds to the localization ofmacroscopic shear bands associated with dilatancy of the sample.The last phase, initiated from point C (before peak stress), leads tocatastrophic failure of the sample. These stages will be referred toas phases 1 to 4 in the following.
Based on the Kirsch elastic stress concentration [24], the onsetof shear failure at the unsupported borehole wall is expected whenthe hoop stress is equal to the uniaxial compressive strength (UCS)of the rock, giving a vertical stress equal to (10þ48)/3¼19 MPa.The first AE is recorded for a vertical stress equal to 43 MPa(point A, Fig. 3), indicating that the elastic solution may not berepresentative for the stress concentrations around the borehole.The effect of scale on the strength of boreholes is well known inthe literature. For example, Dresen et al. [8] indicated that thecritical hoop stress for nucleation of borehole breakouts exceeds2.5 times the uniaxial compressive strength for borehole dia-meters less than 20 mm. Experiment T1790 gives a ratio equal to2.5, on the lower range of the values reported in [8]. However,in our case, the borehole is subjected to large stress anisotropyduring loading.
The sample was imaged post-test using an X-ray micro-com-puted tomography scanner (Nikon Metrology XT H 225 LC indus-trial type with a 225 kV micro‐focus X‐ray source, minimum 3 μmfocal spot size) to map the internal damage and the macro-scopic failure plane. The processed images are shown in Fig. 4and clearly display the macroscopic failure plane (Fig. 4a) anddebris that have fallen into the horizontal hole (Fig. 4c).
4. Effect of rock damage and stresses on acoustic velocities
The ultrasonic P- and S-wave velocities in the axial and radialdirections were measured at intervals of 1 MPa between 3 and10 MPa of the isotropic horizontal stress, and at intervals of 3 MPafrom 10 to 76 MPa of the vertical stress. S-wave velocities weremeasured for two polarization directions. In the vertical direction,the polarization of the S wave was normal and parallel to the
0.1
1.0
10.0
100.0
1000.0
0
10
20
30
40
50
60
70
80
-5 0 5 10 15
AE
rate
[eve
nts/
min
]
13 [
MPa
]
Strain [mS]
Vertical Strain Horizontal Strain Volumetric Strain Damage model AE event rate
Fig. 2. Deviatoric stress ðs1�s3Þ versus vertical (axial), horizontal and volumetricstrains for T1790 (red solid, dashed and stippled lines). Also shown is the recordedAE event rate (blue points) plotted versus vertical strain. Black stippled line showsthe predicted stress–strain behavior using the damage model based on AEs. (Forinterpretation of the references to color in this figure legend, the reader is referredto the web version of this article.)
0
200
400
600
800
1000
1200
1400
1600
1800
-2.0
-1.5
-1.0
-0.5
0.0
0.5
1.0
1.5
2.0
2.5
10 20 30 40 50 60 70 80
Cum
ulat
ive
AE
even
ts
Volu
met
ric S
trai
n [m
S]
Vertical Stress [MPa]
Volumetric Strain
Cumulative sum of AE events
B A
C
1 2 3 4
Fig. 3. Volumetric strain and cumulative number of AE events versus vertical stressfor T1790. During measurement of P- and S-wave velocities (approximately every3 MPa) loading is paused while AE events still continue, which results in saw teethon the AE curve. The behavior can be divided into four phases indicated by thenumbers above the panel; see text for details.
E. Aker et al. / International Journal of Rock Mechanics & Mining Sciences 70 (2014) 286–295288

borehole axis denoted as VS1 and VS2, respectively. In the hori-zontal direction, the polarization was normal and parallel to thebedding plane (i.e. the horizontal plane) denoted as VSV and VSH,respectively (see Fig. 5a for details). The vertical and horizontalP-wave velocity (VP0 and VP90) and the horizontal S-wave velocityof the two polarizations (VSV and VSH) are plotted in Fig. 5b. Theratio of VP0 to VP90 is about 0.88 while the ratio of VSV to VSH isabout 0.92 at 10 MPa of the isotropic stress. Thus, the samplecomplies with transversely isotropic symmetry along thevertical axis.
When increasing the deviatoric stresses (s1�s340), the P-and S-wave velocities in vertical and horizontal directions areaffected by the induced stress field and by the creation of micro-fractures. Velocity VP0 increases with the vertical stress due to thestiffening of the grain–grain contacts, while VP90 decreases andbecomes less than VP0 as the sample gets closer to failure (Fig. 5b,refer also to phases 3 and 4 in Fig. 3). Similar behavior is observedfor VSV and VSH where VSH becomes less than VSV at abouts1 ¼ 55 MPa, coinciding with the progressive growth of shearbands associated with sample dilatancy (refer to point B in
Fig. 4. 3D high-resolution X-ray CT scan of the sample after testing. (a) Pore volume (red), fractured volume (green), (b) surface of the whole sample, and (c) close up of thehorizontal hole. Note debris inside the hole. (For interpretation of the references to color in this figure legend, the reader is referred to the web version of this article.)
E. Aker et al. / International Journal of Rock Mechanics & Mining Sciences 70 (2014) 286–295 289

Fig. 3). Fig. 5b supports the assumption that the deviatoric stressesfavor creation of vertical micro-fractures causing a reduction inVP90 and VSH relative to VP0 and VSV. We also notice that the ratioof VS1 to VS2 (in the vertical direction) decreases slightly withincreasing deviatoric stresses (Fig. 5c). Thus, the S wave polarizedparallel to the borehole axis becomes a few percent faster than theone polarized normal to the borehole axis probably due to stressinduced anisotropy and damage close to the borehole.
The effect of the borehole on the internal stresses was inves-tigated by simulating the rock deformation by a geomechanicalfinite element code. The internal deviatoric stresses are displayedin Fig. 6 at s1�s3 ¼ 55 MPa (corresponding to phase 3 in Fig. 3).The borehole causes the deviatoric forces to concentrate in a winglike pattern favoring vertically oriented micro-fractures along theborehole axis in accordance to the observed stress dependency ofP- and S-wave velocities.
Because of the stress concentration around the borehole it isdifficult to estimate a consistent ratio of P- to S-wave velocities(VP/VS ratio) for the entire sample. This is illustrated in Fig. 5dplotting the VP/VS ratio for the different combinations in thevertical and the horizontal directions. The sample starts to dilateat about s1 ¼ 55 MPa (point B in Fig. 3); the VP/VS ratio in thehorizontal direction is about 1.62. In the vertical direction, theVP/VS ratio is between 1.52 and 1.58 depending on which of the Swaves (S1 or S2) is considered. Closer to failure, the VP/VS ratio isabout 1.55–1.60. In the following section we will compute momenttensors of selected events and obtain the VP/VS ratio by applyingthe model of tensile fracturing [15,16].
5. Source locations and moment tensor inversion
The InSite software package [25] based on the so-calledcollapsing grid search algorithm was applied for the event loca-tion. The locations are computed by minimizing the residuals ofthe P-wave arrival times. The velocity model is obtained frommeasurements on the sample being approximated by homoge-neous and transversely isotropic medium. In total, 1072 eventsthat triggered a minimum of six receivers were located. A subset of305 events that triggered a minimum of 10 receivers are shownin Fig. 7a overlaid on a cross-sectional X-ray CT image. The eventlocations match well the macroscopic fractures developed duringthe experiment. Of these events, 162 were considered havingsufficiently high quality for moment tensor inversion (see detailsbelow) and is plotted in Fig. 7b and c. In Fig. 7b the events arecolored according to their origin time. First, the events occur nearto the borehole; later, the events concentrate near the developingmacroscopic fractures on both sides of the borehole (later referredto as fracture wings A and B).
Events in both additional wings not developing into a macro-seismic fracture occur at the same time as events close to theborehole. In Fig. 7c, events are colored according to the differentphases of the experiment as described in Section 3 and illustratedin Fig. 3 (green: phase 2, blue: phase 3, red: phase 4).
In order to compute moment tensors, the pinducers werecalibrated (see Section 2) and the recorded amplitudes werecorrected. In addition, we assume a cosine sensitivity functionfor the sensor directivity (i.e., the sensitivity of amplitudes of
VP0
VP90
VS1
VS2
VSH
VSV
1 500
2 000
2 500
3 000
3 500
4 000
10 20 30 40 50 60 70 80
Velo
city
[m/s
]
Vertical stress [MPa]
VP0VP90 VSVVSH
0.90
0.91
0.92
0.93
0.94
0.95
0.96
0.97
0.98
0.99
1.00
0 10 20 30 40 50 60 70 80
V S1/V
S2
Vertical stress [MPa]
Post failure
Isotropicstress
Increasing deviatoric stress
1.40
1.45
1.50
1.55
1.60
1.65
1.70
1.75
1.80
10 20 30 40 50 60 70 80
V P/V
Sra
tio
Vertical stress [MPa]
VP90/VSVVP90/VSHVP0/VS1VP0/VS2
Fig. 5. (a) The orientation and polarization of the different P- and S-wave velocities that were measured with ultrasonic transducers. (b) Ultrasonic P-wave velocities in thevertical (VP0) and horizontal (VP90) directions, and horizontal S-wave velocities polarized in the vertical (VSV) and horizontal (VSH) directions as a function of vertical stress.(c) The ratio of vertical S-wave velocity polarized normal to the borehole axis (VS1) and the vertical S-wave velocity polarized parallel to the borehole axis (VS2) as a functionof vertical stress. Under isotropic stresses, the ratio is close to 1 as expected, while the borehole induces stress anisotropy lowering the VS1/VS2 ratio at increasing deviatoricstresses. (d) VP/VS ratios for the different combinations of vertical and horizontal P and S waves as a function of vertical stress.
E. Aker et al. / International Journal of Rock Mechanics & Mining Sciences 70 (2014) 286–295290

waves arriving at different incidence angles) exhibiting the highestsensitivity for the normal incidence. Example waveforms aredisplayed in Fig. 8 for an event close to the borehole and for anevent situated in one of the macroscopic fracture wings. In bothcases, no S wave can be distinguished due to the proximity of thesource and receivers. The waveforms are complex and character-ized by long coda waves produced by interaction of emitted waveswith the surface of the borehole or with the specimen's walls. Inorder to suppress the effects of wave propagation on the momenttensor inversion, we perform an inversion of P-wave first-onsetamplitudes. The signal-to-noise ratio was not sufficiently highenough at all receivers to allow for picking the P-wave amplitudesreliably. Therefore, we selected a subset of 162 high-quality events,for which the P-wave first onset amplitudes were picked manuallywith sufficient quality at minimum of six receivers and with goodfocal sphere coverage. The maximum azimuthal gap was 1351 andthe maximum take-off angle gap was 601. The moment tensorswere calculated using the amplitude inversion in time domain (see[26, eq. (3.23)]). The ray-theoretical P-wave amplitudes of theGreen's function were calculated assuming a homogeneous velo-city model. The time-dependence of the source-time function wasneglected [27,28]. The time-independent moment tensors werecomputed using a generalized linear inversion [29].
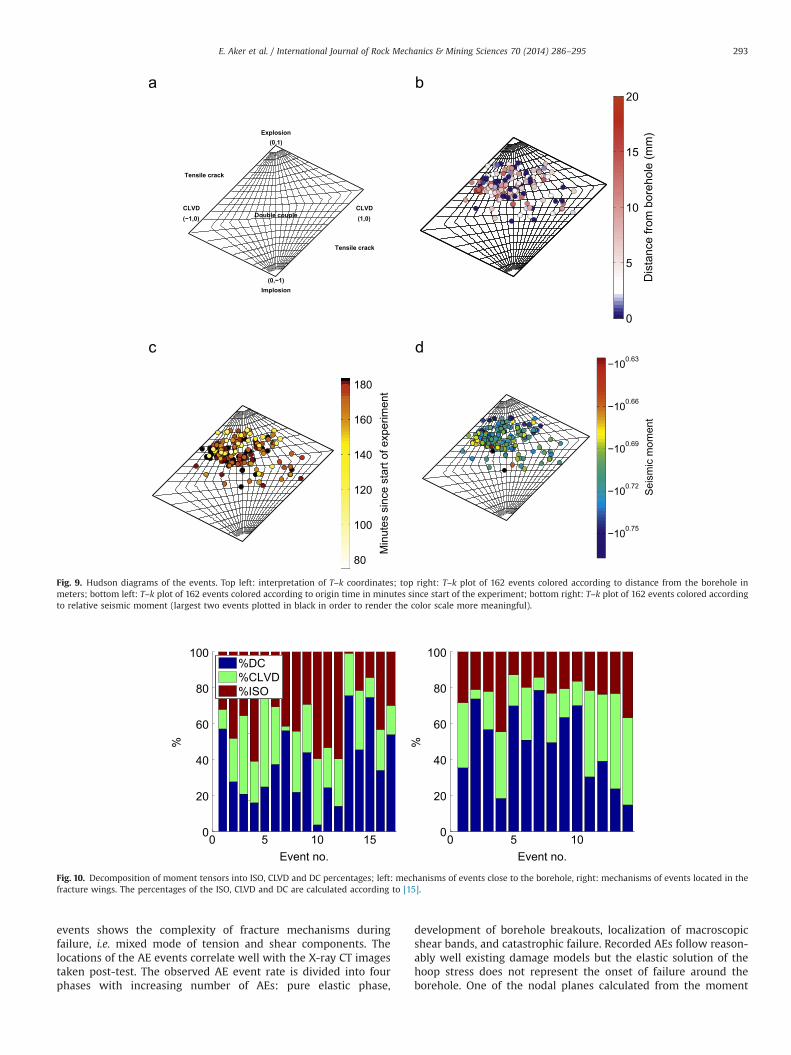
The results of the moment tensor inversion are shown in theHudson T–k plot in Fig. 9. Fig. 9a displays the Hudson plotsubdividing the coordinate space into different source mechan-isms. Fig. 9b–d displays the solutions for all 162 events coloredaccording to their distance from the borehole, their origin time,and their seismic moment. The seismic moments of the analyzedevents as well as their double-couple percentages increase in time(and thus with increasing the deviatoric stress); the isotropiccomponents decrease in time. The majority of events are situatedin the upper half of the Hudson plot indicating a tendency offractures to be opened. We observe that events with small seismicmoments are related to more tensile mechanisms, whereas eventshaving large seismic moments are close to pure shear mechan-isms. Similar observations (tensile micro-cracks in early stages ofloading, localized shear fracturing at later stages) were alsoreported in [1,12,30–32]. Such behavior is expected for materialshaving a low porosity and no pre-existing cracks [1].
Fig. 10 shows the decomposition of moment tensors intoisotropic (red), double-couple (blue) and compensated linearvector dipole (green) parts for events close to the borehole (left)and within the fracture wings (right). Although the distribution ofthe percentages is irregular, events occurring close to the boreholeshow a higher fraction of isotropic percentage compared to eventsoccurring within the fracture wings mostly featuring a higherfraction of DC percentages. (For interpretation of the references tocolor in this figure, the reader is referred to the web version of thisarticle.)
Fig. 11 displays event locations colored according to theirdistance from the borehole (middle plot) and the double-coupleand non-double-couple components of events occurring in thefracture wings A (left-hand plots) and fracture wing B (right-handplots). The arrows highlight the strike direction of the borehole.The lower left and right plots illustrate the P (compressional) and T(tensional) axes calculated from eigenvectors of the momenttensors. The plots indicate that the source mechanisms basicallycoincide with the orientation of the fractures in the sample. One ofthe nodal lines has a strike close to the strike of the hole. Thefractures are almost vertical, so the focal mechanisms are close tonormal/reverse faulting. The P and T axes are more stronglyclustered for fracture wing B than wing A, most likely becausethe events in wing B are situated at larger distances from the holeand therefore the waveforms are less affected by the borehole. Onthe other hand, the focal mechanisms in wing A are more scattereddue to the more complex stress conditions close to the borehole(see Fig. 6) and due to the interaction of the wave field with theborehole. The events of both wings display significant non-double-couple components. The isotropic (ISO) and compensated linearvector dipole (CLVD) components have positive values as illu-strated in the upper left and right plots. This indicates tensilefracturing, which is predicted also by the stress and velocityanalysis. Applying the model of tensile fracturing [15], the P- toS-wave velocity ratio can be retrieved employing a linear regres-sion (see dashed lines in Fig. 11, left and right top plots) attaining arealistic value of VP/VS¼1.73. For a comparison, the VP/VS ratiodetermined from velocity measurements in the axial and radialdirections close to failure is about 1.55–1.60 (see Fig. 5d) beingreasonably close to the obtained value in Fig. 11.
When interpreting the focal mechanisms and particularly thenon-double-couple components of the moment tensors, we haveto keep in mind that the moment tensor solutions have a limitedaccuracy. The errors of the moment tensors can be producedby noise and limited amount of data and by various approxima-tions made during the inversion. For example, the applied Green'sfunctions may not describe the medium appropriately, because weomit anisotropy of the specimen during the inversion (see Section4). In addition, the coupling effects between the sensors and the
Fig. 6. Simulated internal deviatoric stress due to the presence of borehole, ats1�s3 ¼ 55 MPa. Colors correspond to the internal deviatoric stresses; red ishighest (90 MPa) and blue is lowest (0 MPa). The upper panel displays a long-itudinal cross section and the lower panel displays a horizontal cross sectionthrough the center of the borehole. (For interpretation of the references to color inthis figure legend, the reader is referred to the web version of this article.)
E. Aker et al. / International Journal of Rock Mechanics & Mining Sciences 70 (2014) 286–295 291

rock specimen during the experiment were disregarded whenassessing the relative pinducer sensitivities. Inaccuracies in eventlocations produce errors of the moment tensor solutions. Finally,the P-wave first-onset amplitudes may contain noise and maypartly be distorted by reflected or scattered waves arrivingimmediately after the direct P wave.
6. Conclusions
In this paper, the results of a triaxial experiment carried out toinvestigate the source mechanisms of AE events during loading ofa perforated sandstone sample have been presented. The decom-position of the moment tensors associated with the recorded
Fig. 7. Location of events. (a) Locations of 305 events overlaid on a 2D longitudinal cross sectional cut of the 3D X-ray CT image. The color scale of the events represents therelative amplitude defined as the logarithm of the sum of the waveform root-mean-square (RMS) amplitudes multiplied by the source-receiver distance. (b) 162 eventsselected for moment tensor inversion, colored according to origin time in minutes after start of the experiment. (c) The same events as shown in panel (b) colored accordingto the phase of the experiment, green: phase 2, blue: phase 3, and red: phase 4. (For interpretation of the references to color in this figure legend, the reader is referred to theweb version of this article.)
0 0.2 0.4 0.6 0.8 1
1E1N2E2N3E3N4E4N5E5N6E6N7E7N8E8N9E9N
10E10N11E11N12E12N
Time(ms)0 0.2 0.4 0.6 0.8 1
1E1N2E2N3E3N4E4N5E5N6E6N7E7N8E8N9E9N
10E10N11E11N12E12N
Time(ms)
Fig. 8. Example seismograms for an event close to the borehole (left) and located in the fracture wing (right). Traces recorded by pinducers are split into East and Northcomponent.
E. Aker et al. / International Journal of Rock Mechanics & Mining Sciences 70 (2014) 286–295292
events shows the complexity of fracture mechanisms duringfailure, i.e. mixed mode of tension and shear components. Thelocations of the AE events correlate well with the X-ray CT imagestaken post-test. The observed AE event rate is divided into fourphases with increasing number of AEs: pure elastic phase,
development of borehole breakouts, localization of macroscopicshear bands, and catastrophic failure. Recorded AEs follow reason-ably well existing damage models but the elastic solution of thehoop stress does not represent the onset of failure around theborehole. One of the nodal planes calculated from the moment
Dis
tanc
e fro
m b
oreh
ole
(mm
)
0
5
10
15
20
Min
utes
sin
ce s
tart
of e
xper
imen
t
80
100
120
140
160
180
−100.63
−100.66
−100.69
−100.72
−100.75
Sei
smic
mom
ent
Fig. 9. Hudson diagrams of the events. Top left: interpretation of T–k coordinates; top right: T–k plot of 162 events colored according to distance from the borehole inmeters; bottom left: T–k plot of 162 events colored according to origin time in minutes since start of the experiment; bottom right: T–k plot of 162 events colored accordingto relative seismic moment (largest two events plotted in black in order to render the color scale more meaningful).
0 5 10 150
20
40
60
80
100
Event no.
%
%DC%CLVD%ISO
0 5 100
20
40
60
80
100
Event no.
%
Fig. 10. Decomposition of moment tensors into ISO, CLVD and DC percentages; left: mechanisms of events close to the borehole, right: mechanisms of events located in thefracture wings. The percentages of the ISO, CLVD and DC are calculated according to [15].
E. Aker et al. / International Journal of Rock Mechanics & Mining Sciences 70 (2014) 286–295 293

tensors coincides with the orientation of the macroscopic fracturesin the sample. Events close to the borehole show a higher fractionof isotropic percentage compared to the events occurring in themacroscopic fracture featuring higher fraction of the DC percen-tage. Analysis of axial and radial P- and S-wave velocities togetherwith modeling of internal stresses highlight the effects of stressinduced damage and the influence of the borehole on themeasured P- and S-wave velocities. As a result is it difficult toestimate a consistent VP/VS ratio for the entire sample. Despite this,the ratio obtained from the ISO and CLVD cross plots using themodel of tensile fracturing [16] is close to values obtained fromthe ultrasonic measurements. Since the waveforms are affectedstrongly by the presence of the horizontal borehole and probablyalso by the specimen's walls, the moment tensors computedfrom the P-wave first-onset amplitudes are not highly accurate.To improve their accuracy, a full waveform inversion should beapplied using Green's functions computed for the actual geometryof the sample including the borehole. In general, events located inthe vicinity of the borehole display complex focal mechanismsbecause of the complex stress field.
Acknowledgments
We thank Will Pettitt for his review. The work was funded bythe ACUPS Project (financed by the Norwegian Research Counciland industry partners BP, Statoil and Total; Grant no. 176016),Grant Agency of the Czech Republic, Grant no. P210/12/1491, andby the European Community's FP7 Consortium Project AIM“Advanced Industrial Microseismic Monitoring”, Grant agreementno. 230669. Support from these organizations is greatly acknowl-edged. Contributions and comments from Huynh Dat Vu Khoa,Hom Nath Gharti and Fabrice Cuisiat (post-mortem) are greatlyappreciated.
References
[1] Graham CC, Stanchits S, Main IG, Dresen G. Comparison of polarity andmoment tensor inversion methods for source analysis of acoustic emissiondata. Int J Rock Mech Min Sci 2010;47:161–9.
[2] Michlmayr G, Denis C, Dani O. Sources and characteristics of acousticemissions from mechanically stressed geologic granular media—a review.Earth Sci Rev 2012;112:97–114.
[3] Lockner DA, Madden TR. Quasi-static failure growth and shear fracture energyin granite. Nature 1991;350:39–42.
[4] Stanchits S, Mayr S, Shapiro S, Dresen G. Fracturing of porous rock induced byfluid injection. Tectonophysics 2011;503:129–45.
[5] Mayr SI, Stanchits S, Langenbruch C, Dresen G, Shapiro SA. Acoustic emissioninduced by pore-pressure changes in sandstone samples. Geophysics 2011;76:MA21–MA32.
[6] Fortin J, Stanchits S, Dresen G, Gueguen Y. Acoustic emission and velocitiesassociated with the formation of compaction bands in sandstone. J GeophysRes 2006;111(B10):B10203.
[7] Townend E, Thompson BD, Benson PM, Meredith PG, Baud P, Young RP.Imaging compaction band propagation in Diemelstadt sandstone usingacoustic emission locations. Geophys Res Lett 2008;35:L15301.
[8] Dresen G, Stanchits S, Rybacki E. Borehole breakout evolution through acousticemission location analysis. Int J Rock Mech Min Sci 2010;47:426–35.
[9] King MS, Pettitt WS, Haycox JR, Young RP. Acoustic emissions associated withthe formation of fracture sets in sandstone under polyaxial stress conditions.Geophys Prospect 2012;60:93–102.
[10] Dahm T, Manthei G, Eisenblätter J. Relative moment tensors of thermallyinduced microcracks in salt rock. Tectonophysics 1998;289:61–74.
[11] Ohtsu M. Moment tensor analysis of AE and SiGMA code. In: Kishi T, Ohtsu M,Yuyama S, editors. Acoustic emission—beyond the millenium. Amsterdam:Elsevier; 2000. p. 19–34.
[12] Chang SH, Lee CI. Estimation of cracking and damage mechanisms in rockunder triaxial compression by moment tensor analysis of acoustic emission.Int J Rock Mech Min Sci 2004;41:1069–86.
[13] Manthei G. Characterization of acoustic emission sources in a rock salt specimenunder triaxial compression. Bull Seismol Soc Am 2005;95(5):1674–700.
[14] Pettitt WS. Acoustic emission source studies of microcracking in rock[Ph.D. thesis]. UK: Keele University; 1998.
[15] Vavryčuk V. Inversion for parameters of tensile earthquakes. J Geophys Res2001;106(B8):16.339–55.
[16] Vavryčuk V. Tensile earthquakes: theory, modeling and inversion. J GeophysRes 2011;116(B12):320.
[17] Brace WF, Paulding BW, Scholz C. Dilatancy in the fracture of crystalline rocks.J Geophys Res 1966;71:3939–53.
A
B
Wing A Wing B
Strike of the hole
T
P
N Strike of the hole
T
P
N
0 10 20 30 40 500
10
20
30
40
50
0 10 20 30 40 500
10
20
30
40
50
vP / vS = 1.73 vP / vS = 1.73
CLVD [%] CLVD [%]
ISO
[%]
ISO
[%]
Fig. 11. Fault plane solutions for selected events; middle: locations of events, colored according to distance from the borehole; left: results for events situated in wing A (fromtop to bottom: CLVD-ISO plot, fault plane solutions, P and T axes); right: the same for events situated in wing B. The percentages of the ISO, CLVD and DC are calculatedaccording to [15].
E. Aker et al. / International Journal of Rock Mechanics & Mining Sciences 70 (2014) 286–295294

[18] Miller AD, Julian BR, Foulger GR. Non-double-couple earthquakes. 2. Observa-tions. Rev Geophys 1998;133:309–25.
[19] Berre T. Triaxial testing of soft rocks. Geotech Test J 2011;34:61–75.[20] Bésuelle P. Déformation et rupture dans les roches tendres et les sols indurés:
comportement homogène et localization [Ph.D. thesis].Grenoble, France:Université de Grenoble I; 1999.
[21] Aker E, Cuisiat F, Soldal M, Kühn D. Relating acoustic emission sources to rockfailure around a borehole. In: Proceedings of the 72nd EAGE conference &exhibition. Barcelona; 2010. p. 569.
[22] Wawersick WR, Fairhurst C. A study of brittle rock fracture in laboratorycompression experiments. Int J Rock Mech Min Sci 1970;7:561–75.
[23] Amitrano D. Emission acoustique des roches et endommagement. Approchesexpérimentale et numérique—application à la seismicité minière [Ph.D.thesis]. Grenoble, France: Université Joseph Fourier; 1999.
[24] Fjaer E, Holt RM, Horsrud P, Raaen AM, Risnes R. Petroleum related rockmechanics. 2nd ed.. Amsterdam: Elsevier; 2008.
[25] Pettitt W, Young RP. InSite user operations manual. Shrewsbury, UK: AppliedSeismology Consultants; 2007.
[26] Aki K, Richards PG. Quantitative seismology. Sausalito, Cailf: UniversityScience Books; 2002.
[27] Sokos E, Zahradník J. ISOLA—a fortran code and matlab GUI to performmultiple point source inversion of seismic data. Comput Geosci 2008;34:967–77.
[28] Vavryčuk V, Kühn D. Moment tensor inversion of waveforms: a two-steptime-frequency approach. Geophys J Int 2012;190:1761–76.
[29] Menke W. Geophysical data analysis: discrete inverse theory. New York:Academic Press; 1989.
[30] Reches Z, Lockner DA. Nucleation and growth of faults in brittle rocks.J Geophys Res 1994;99(B9):18159–73.
[31] Katz O, Reches Z. Microfracturing, damage, and failure of brittle granites.J Geophys Res 2004;109:B01206.
[32] Stanchits S, Vinciguerra S, Dresen G. Ultrasonic velocities, acoustic emissioncharacteristics and crack damage of basalt and granite. Pure Appl Geophys2006;163:974–93.
E. Aker et al. / International Journal of Rock Mechanics & Mining Sciences 70 (2014) 286–295 295