Experimental investigation and optimization of MRR … · AISI 446 Stainless steel Fig: 3.1.1...
7
International Journal of Application or Innovation in Engineering & Management (IJAIEM) Web Site: www.ijaiem.org Email: [email protected] Volume 6, Issue 10, October 2017 ISSN 2319 - 4847 Volume 6, Issue 10, October 2017 Page 38 Abstract EDM is one where electrical sparks are generated by creating voltage difference between the electrode and work piece. The eroding of material takes place. To machine the materials which are difficult to machine in traditional machining and for temperature resistant high strength alloys EDM is applicable. The practical applications include dies in watches, mould cavity with deeper and narrow slots, mould cavity for the injection molding. The theme of this project is to optimize the machining parameters in die sinking electrical discharge machining in order to able the best parameter to get the high MRR and low SR. In present the work pieces is AISI 446 stainless steel material is used to conduct the experiments by varying the control factors Process responses such as material removal rate (MRR) and surface roughness (SR) are determined for every experimental run. With a minimum amount of experimentation Taguchi’s L9 orthogonal array (OA) is used to study the response of control factors with varying levels in commercial tool MINITAB 17. To get the optimized results individually for process responses, Taguchi single objective optimization is used. And finally, a mathematical and statistical technique called Response surface methodology (RSM) has been used for the analysis and modeling of the MRR and SR by using the commercial tool Design expert 9.0.3.1. Key words: EDM, AISI, SS446, L9 OA, Taguchi, RSM, MRR and SR 1. Introduction of EDM Electro Discharge Machining (sometimes also referred to as spark machining, spark eroding, die sinking) (EDM) is an electro-thermal non-traditional machining Process, where electrical energy is used to generate electrical spark and material removal mainly occurs due to thermal energy of the spark [3]. EDM is mainly used to machine difficult-to- machine materials and high strength temperature resistant alloys. In this machining process work piece is called the anode because it is connected with positive terminal and electrode is connected with negative terminal i.e. called cathode. Dielectric fluid may be kerosene, transformer oil, distilled water, etc [4].The layout of EDM is shown in below figure1.1. Figure 1.1: Schematic of EDM process The machining process is carried out within the dielectric fluid which creates path for discharge. When potential difference is applied between the two surfaces of work piece and tool, the dielectric gets ionized and electric sparks/discharges are generated across the two terminals. The application of focused heat of the tool raises the temperature of work piece in that region, which consequently melts and evaporates the metal. In this way small volumes of work piece material are removed by the mechanism of melting and vaporization during a discharge. In a single spark volume of material removed is very small in the range of 10 -6 to 10 -4 mm3, but this basic process is continuous around 10,000 times per second [5]. The erosion process consists of five phases, namely pre breakdown, breakdown, discharge, end of discharge and post discharge which are shown in figure 1.2. Plasma channel is created between the electrode and work piece with the help of electro thermal energy and temperature ranges are 8000˚c to 12000˚c. With this high temperature of plasma state eroding occurs. Experimental investigation and optimization of MRR and SR for AISI 446 Stainless steel in EDM Machining Dr. R. RAMACHANDRA Principal & Professor, Dept. of Mechanical Engineering, SKD Engineering College, Gooty.
Transcript of Experimental investigation and optimization of MRR … · AISI 446 Stainless steel Fig: 3.1.1...
International Journal of Application or Innovation in Engineering & Management (IJAIEM) Web Site: www.ijaiem.org Email: [email protected]
Volume 6, Issue 10, October 2017 ISSN 2319 - 4847
Volume 6, Issue 10, October 2017 Page 38
Abstract EDM is one where electrical sparks are generated by creating voltage difference between the electrode and work piece. The eroding of material takes place. To machine the materials which are difficult to machine in traditional machining and for temperature resistant high strength alloys EDM is applicable. The practical applications include dies in watches, mould cavity with deeper and narrow slots, mould cavity for the injection molding. The theme of this project is to optimize the machining parameters in die sinking electrical discharge machining in order to able the best parameter to get the high MRR and low SR. In present the work pieces is AISI 446 stainless steel material is used to conduct the experiments by varying the control factors Process responses such as material removal rate (MRR) and surface roughness (SR) are determined for every experimental run. With a minimum amount of experimentation Taguchi’s L9 orthogonal array (OA) is used to study the response of control factors with varying levels in commercial tool MINITAB 17. To get the optimized results individually for process responses, Taguchi single objective optimization is used. And finally, a mathematical and statistical technique called Response surface methodology (RSM) has been used for the analysis and modeling of the MRR and SR by using the commercial tool Design expert 9.0.3.1. Key words: EDM, AISI, SS446, L9 OA, Taguchi, RSM, MRR and SR
1. Introduction of EDM Electro Discharge Machining (sometimes also referred to as spark machining, spark eroding, die sinking) (EDM) is an electro-thermal non-traditional machining Process, where electrical energy is used to generate electrical spark and material removal mainly occurs due to thermal energy of the spark [3]. EDM is mainly used to machine difficult-to-machine materials and high strength temperature resistant alloys. In this machining process work piece is called the anode because it is connected with positive terminal and electrode is connected with negative terminal i.e. called cathode. Dielectric fluid may be kerosene, transformer oil, distilled water, etc [4].The layout of EDM is shown in below figure1.1.
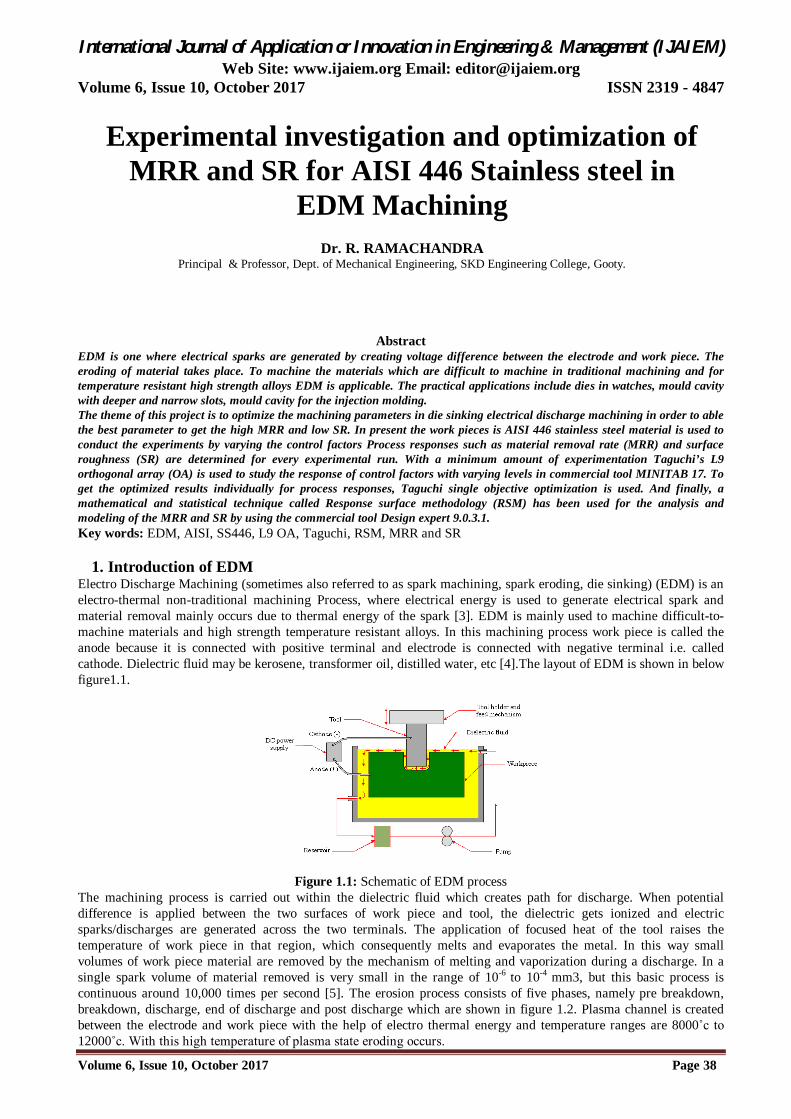
Figure 1.1: Schematic of EDM process The machining process is carried out within the dielectric fluid which creates path for discharge. When potential difference is applied between the two surfaces of work piece and tool, the dielectric gets ionized and electric sparks/discharges are generated across the two terminals. The application of focused heat of the tool raises the temperature of work piece in that region, which consequently melts and evaporates the metal. In this way small volumes of work piece material are removed by the mechanism of melting and vaporization during a discharge. In a single spark volume of material removed is very small in the range of 10-6 to 10-4 mm3, but this basic process is continuous around 10,000 times per second [5]. The erosion process consists of five phases, namely pre breakdown, breakdown, discharge, end of discharge and post discharge which are shown in figure 1.2. Plasma channel is created between the electrode and work piece with the help of electro thermal energy and temperature ranges are 8000˚c to 12000˚c. With this high temperature of plasma state eroding occurs.
Experimental investigation and optimization of MRR and SR for AISI 446 Stainless steel in
EDM Machining
Dr. R. RAMACHANDRA Principal & Professor, Dept. of Mechanical Engineering, SKD Engineering College, Gooty.
International Journal of Application or Innovation in Engineering & Management (IJAIEM) Web Site: www.ijaiem.org Email: [email protected]
Volume 6, Issue 10, October 2017 ISSN 2319 - 4847
Volume 6, Issue 10, October 2017 Page 39
a) Pre-breakdown: During this phase the tool moves closer to the work piece and voltage (V) is applied between the electrodes. b) Breakdown: As the applied voltage cross the boundary limit of dielectric strength of dielectric fluid, this initiates the breakdown of the dielectric. Usually the dielectric breaks near the closest point between the tool and work piece, but it also depend on conductive particles present between the gaps [6]. c) Discharge: During this phase the discharge current is maintained at a constant level for a continuous bombardment of ions and electrons on the electrodes. Due to which there is strong heating of the work piece (and also on the electrode), One of the important parameter in the discharge phase is the Inter Electrode Gap (IEG) which is estimated to be around 10 to 100 micrometers and is directly proportional to discharge current. d) End of the discharge: At the end of the discharge phase the current and the voltage supply stops. The plasma collapses as there is no spark and also due to the pressure enforced by the surrounding dielectric. e) Post-discharge: As during the end of discharge phase the plasma extinguishes. Here a small portion of metal will be removed and a thin layer of metal will recast on the surface of work piece due to the cooling and collapsing of plasma. The thickness of the layer is around 20 to 100 microns and is known as white layer.
(a) (b) (c) (d) (e) Figure 1.2: (a) Pre-breakdown phase (b) Breakdown phase (c) Discharge phase (d) End of the discharge and (e) Post-
discharge phase.
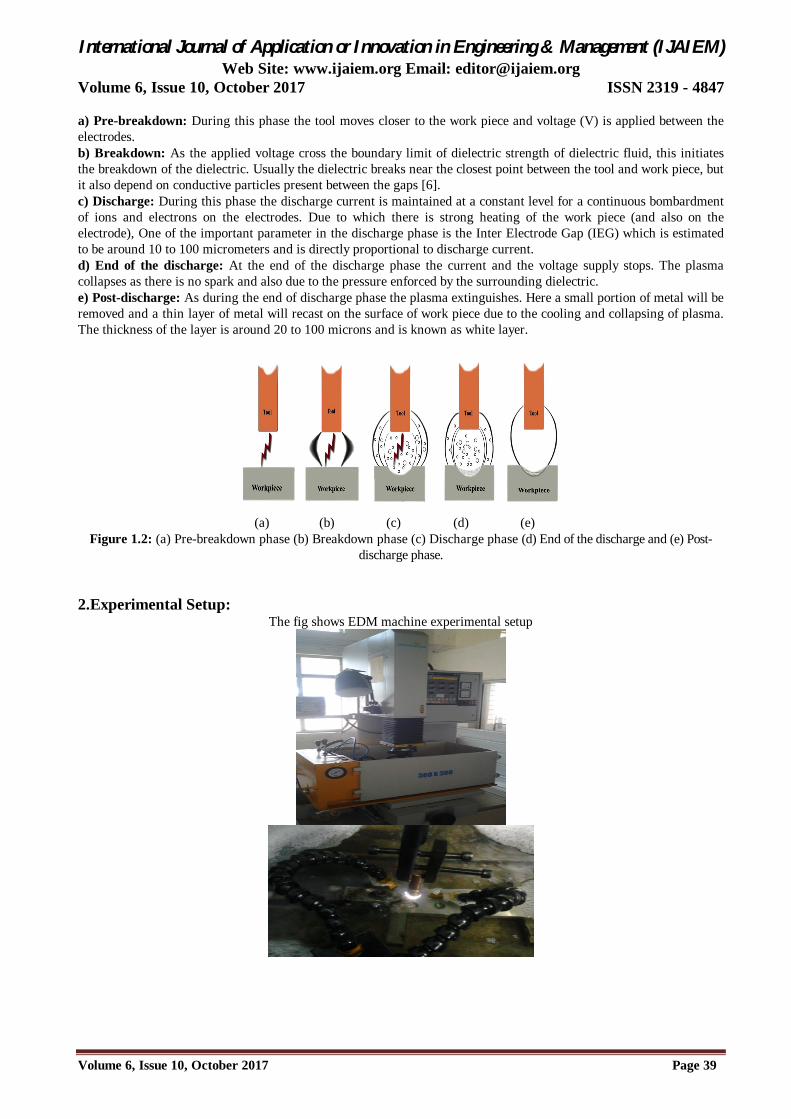
2.Experimental Setup: The fig shows EDM machine experimental setup
International Journal of Application or Innovation in Engineering & Management (IJAIEM) Web Site: www.ijaiem.org Email: [email protected]
Volume 6, Issue 10, October 2017 ISSN 2319 - 4847
Volume 6, Issue 10, October 2017 Page 40
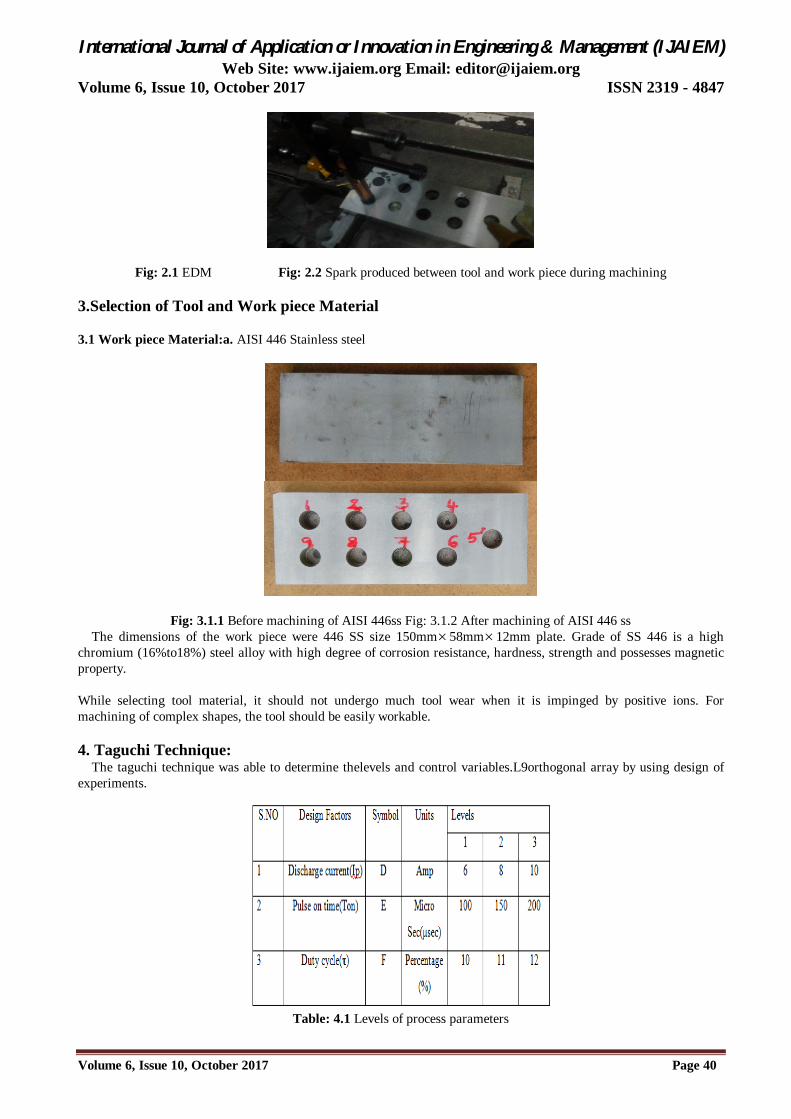
Fig: 2.1 EDM Fig: 2.2 Spark produced between tool and work piece during machining 3.Selection of Tool and Work piece Material 3.1 Work piece Material:a. AISI 446 Stainless steel
Fig: 3.1.1 Before machining of AISI 446ss Fig: 3.1.2 After machining of AISI 446 ss The dimensions of the work piece were 446 SS size 150mm58mm12mm plate. Grade of SS 446 is a high
chromium (16%to18%) steel alloy with high degree of corrosion resistance, hardness, strength and possesses magnetic property.
While selecting tool material, it should not undergo much tool wear when it is impinged by positive ions. For machining of complex shapes, the tool should be easily workable. 4. Taguchi Technique:
The taguchi technique was able to determine thelevels and control variables.L9orthogonal array by using design of experiments.
Table: 4.1 Levels of process parameters

International Journal of Application or Innovation in Engineering & Management (IJAIEM) Web Site: www.ijaiem.org Email: [email protected]
Volume 6, Issue 10, October 2017 ISSN 2319 - 4847
Volume 6, Issue 10, October 2017 Page 41
4.1 Material Removal Rate It is the ratio of weight loss of the work piece plate before and after machining to machining time.
4.2 Surface Roughness Mitutoyo Talysurf electronic device is used to calculate surface roughness (Ra) values.
Fig:4.2 Mituyo Talysurf Equipment
4.3 The experimental results of SS446 plate
Table:4.2 SS446 experimental results for MRR and SR
5. Response surface Method RSM is a group of mathematical and statistical methods that are suitable for applications such as modeling and analysis. An optimal response was obtained by choosing a proper choice of design and operating conditions on a set of controllable variables. Here output is influenced by the number of input factors. 5.1 Procedure: RSM comprises the following steps
Prepare a set of trials for sufficient and consistent extent of the output. Progress an empirical model of the 2nd order response surface with the suitable sets. Identify the efficient set of trial variables that gives a maximum and minimum response values. Characterize the direct and the collaborative effects of variables through 2D and 3D graphs.
5.2 Analysis of variance (ANOVA) ANOVA is conducted for the experimental results to find out the effect of process parameters on process responses.
The ANOVA for material removal rate (MRR) and surface roughness (SR) are given in the Table 6.1 and Table 6.2 respectively.
RUN NO. DISCHARGE CURRENT(D)
PULSE-ON TIME(E)
DUTY CYCLE(F)
MRR SR
1 6 100 10 0.1945 4.105
2 6 150 11 0.2514 4.175
3 6 200 12 0.3576 5.4
4 8 100 11 0.1995 6.3
5 8 150 12 0.5598 6.2
6 8 200 10 0.4745 5.5
7 10 100 12 0.6324 5.9
8 10 150 10 0.5185 7.03
9 10 200 11 0.7832 6.91

International Journal of Application or Innovation in Engineering & Management (IJAIEM) Web Site: www.ijaiem.org Email: [email protected]
Volume 6, Issue 10, October 2017 ISSN 2319 - 4847
Volume 6, Issue 10, October 2017 Page 42
Source Sum of Squares d. f. Mean Square F-Value Prob > F
Model 0.30 3 0.077 11.24 0.0192
D 0.19 1 0.20 24.95 0.0059
E 0.056 1 0.044 6.14 0.0827
F 0.026 1 0.025 3.64 0.1853
Residual 0.046 5 6.563E-003
Total 0.55 8
Std. Dev. 0.081 R2 0.8900
Mean 0.37 Adj. R2 0.7961
Pred. R2 0.5437
Table 5.1 ANOVA for MRR Multiple regression coefficient (R2) is used, to check whether the fitted models actually describe the experimental
data or not. From the table 5.1, R2 value for MRR is found to be 0.8900. This shows that the linear model can explain the variation in MRR up to the extent of 89.00%. And adjusted R2 and Pred. R2 for MRR are found to be 0.7961, 0.5437. It can be observed that the values of pred. R2 and adjusted R2 are closer to each other which is difference is 0.4. This means that the developed model can represent the process adequately. From the Table 5.2, R2 value for SR is found to be 0.9882. This shows that the linear model can explain the variation in SR up to the extent of 98.82%. And adjusted R2 and Pred. R2 values for SR are found to be 0.9552, 0.9433. It can be observed that the values of pred. R2 and adjusted R2 are closer to each other which is difference is 0.04. This means that the developed model can represent the process adequately .
Source Sum of Squares d. f. Mean Square F-Value Prob > F
Model 9.89 3 3.30 74.94 0.0001
D 9.53 1 9.53 216.42 <0.0001 E 0.35 1 0.35 8.02 0.0366
F 0.017 1 0.017 0.38 0.5667 Residual 0.22 5 0.044 Total 10.12 8 Std. Dev. 0.21 R2 0.9882 Mean 5.23 Adj. R2 0.9552 Pred. R2 0.9433
Table 5.2: ANOVA for SR 6. Normal plots for MRR and SR The normal probability plots indicates whether residual follow a normal distribution or not. The plots are shown in figures 6.1 & 6.2. From the plots it can be perceived that residuals are located on a straight line, which means that errors are distributed normally.
Figure 6.1: Normal probability plot of residuals for MRR
International Journal of Application or Innovation in Engineering & Management (IJAIEM) Web Site: www.ijaiem.org Email: [email protected]
Volume 6, Issue 10, October 2017 ISSN 2319 - 4847
Volume 6, Issue 10, October 2017 Page 43
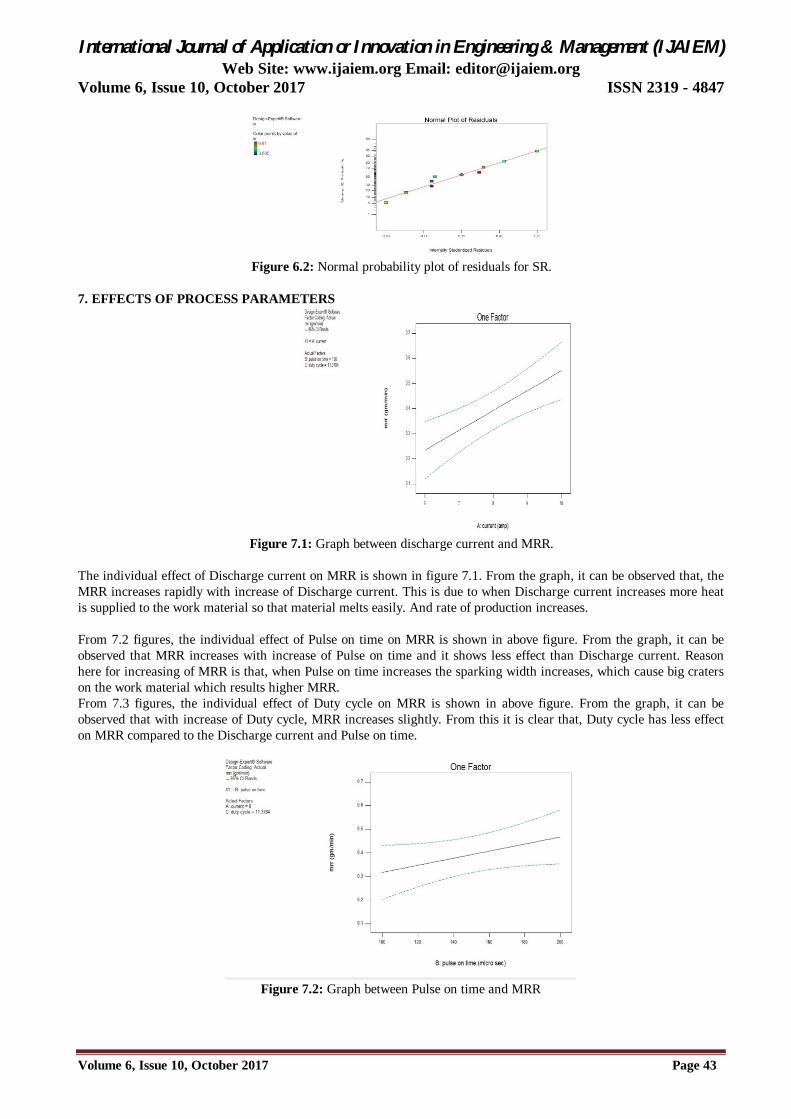
Figure 6.2: Normal probability plot of residuals for SR.
7. EFFECTS OF PROCESS PARAMETERS
Figure 7.1: Graph between discharge current and MRR.
The individual effect of Discharge current on MRR is shown in figure 7.1. From the graph, it can be observed that, the MRR increases rapidly with increase of Discharge current. This is due to when Discharge current increases more heat is supplied to the work material so that material melts easily. And rate of production increases. From 7.2 figures, the individual effect of Pulse on time on MRR is shown in above figure. From the graph, it can be observed that MRR increases with increase of Pulse on time and it shows less effect than Discharge current. Reason here for increasing of MRR is that, when Pulse on time increases the sparking width increases, which cause big craters on the work material which results higher MRR. From 7.3 figures, the individual effect of Duty cycle on MRR is shown in above figure. From the graph, it can be observed that with increase of Duty cycle, MRR increases slightly. From this it is clear that, Duty cycle has less effect on MRR compared to the Discharge current and Pulse on time.
Figure 7.2: Graph between Pulse on time and MRR

International Journal of Application or Innovation in Engineering & Management (IJAIEM) Web Site: www.ijaiem.org Email: [email protected]
Volume 6, Issue 10, October 2017 ISSN 2319 - 4847
Volume 6, Issue 10, October 2017 Page 44
Figure 7.3: Graph between Duty cycle and MRR
Graph, it can be observed that with increase of Discharge current SR increases. The reason for this is, when the Discharge current increases sparking energy increases. This causes big craters on the work surface.
Figure 7.4: Graph between Pulse on time and SR
8. CONCLUSION: In the earlier chapters, the consequences of process parameters on process responses of the discharge machining (EDM) method are mentioned and additionally best setting of method parameters has been obtained for max MRR and minimum SR individually at the same time. The vital conclusions from this work square measure summarized as follows: The optimum set of method parameters are response surface method linear model individually in MRR and SR in terms of multiple regressions co-efficient (R2) is up to the extent of 89.00% and 98.82% respectively for the material of SS330. It was also observed that the Discharge current is the most significant design variable influencing the MRR and SR for machining SS330 material. REFERENCES: 1. Raghuraman S., Thiruppathi K., Panneerselvam T., Santos S, “Optimization of EDM parameters using Taguchi
method and Grey Relational analysis for mild steel is 2026” International journal of Innovative research in science, engineering and technology vol. 2, issue 7, July 2013.
2. Milan Kumar das, Kaushik Kumar, Tappan kr. Barman and Prasanta Sahoo, “Application of Artificial Bee Colony algorithm for optimization of MRR and surface roughness in edm of EN 31 tool steel”, 3rd international conference on materials processing and Characterization (ICMPC 2014), Procedia material science 6(2014) 741-751.
3. Jain V.K. “Advanced Machining Processes” Allied Publishers Pvt. Limited, New Delhi, 2005. 4. Vikas, kaushik Kumar, Apurba Kumar Roy, “Effect and optimization of various machine process parameters on
the Surface roughness in EDM for an EN 41 material using Grey Taguchi”. 3rd international conference on Material processing and characterization (ICMPCV2014), Procedia material science 6(2014) 383-390.