
Experimental investigation and Analysis of Thrust Force in ... · CARBON FIBER REINFORCED PLASTIC...
5
International Journal of Modern Engineering Research (IJMER) www.ijmer.com Vol.2, Issue.4, July-Aug. 2012 pp-2719-2723 ISSN: 2249-6645 www.ijmer.com 2719 | Page S. Madhavan 1 , S. Balasivanadha Prabu 2 1, 2 Department of Mechanical Engineering, College of Engineering Guindy, Anna University, Chennai-600025, India ABSTRACT: This paper reports the effect of thrust force during drilling of 10mm diameter holes in 20mm thick Carbon Fibre Reinforced Plastic composite laminate using HSS, Solid Carbide (K20) and Poly Crystalline Diamond insert drills. Experiments are conducted on a vertical machining centre using Taguchi design of experiments. A model is developed to correlate the drilling parameters with thrust force using Response surface Methodology (RSM).The results indicate that the developed model is suitable for prediction of thrust forces in drilling of CFRP composites. The influence of different parameters on thrust force of CFRP composites have been analyzed through contour graphs and 3D plots. The investigation has revealed that the type of drill geometry affects the thrust force significantly followed by the feed rate and the speed. Keywords: Drilling, CFRP, response surface methodology, Thrust Force I. INTRODUCTION CARBON FIBER REINFORCED PLASTIC (CFRP) composite materials are continuously replacing conventional metals and alloys in many applications such as automotives, aircraft etc. The combination of superior mechanical properties such as high specific strength, stiffness and fatigue strength, enable the structural design more reliable than conventional metals [1]. They can be easily fabricated to near net shapes by processes such as hand lay-up, filament winding, pultrusion; etc.Machining is required in places where composites are assembled by joining processes. Machining of composites has been recognized as a process different from that of conventional materials. A proper selection of cutting parameters facilitates good machinability since the coexistence of hard abrasive fibres and a soft matrix behave differently during machining [2]. Drilling is a frequently employed in industries owing to the need for component assembly in mechanical structures. Many researchers [3-5] reported that the quality of the drilled surfaces depend strongly on the tool geometry, drilling parameters and tool material. An inappropriate selection of these parameters can lead to material degradations, such as fiber pull-out, matrix cratering, thermal damage and delamination [3]. Tsao [6] reported that the feed rate and the drill diameter are recognized as the most significant factors affecting the thrust force. The radial basis function network is demonstrated more effective than multi- variable regression analysis for the evaluation of drilling- induced thrust force and surface roughness in drilling of composite material. Latha and Senthilkumar [10] used fuzzy logic technique to predict thrust force in drilling of composite materials. Davim [11] presented a study for selecting the cutting parameters for damage-free drilling in carbon fiber reinforced epoxy composite material which was based on a combination of Taguchi’s techniques and on the analysis of variance (ANOVA). Karnik et al., [12] carried out drilling as per full factorial design using cemented carbide (grade K20) twist drills that serve as input–output patterns for ANN training and reported that the developed ANN model shows a good correlation both for training and testing data sets, thus validating the model. Two-factor interaction effects were also analyzed by generating 3D surface plots. The interaction effects analysis demonstrates the advantages of employing a high spindle speed for drilling CFRP composite material which reduces the delamination at the entrance of the holes. This paper investigates the effect of different drilling parameters on Thrust force in drilling CFRP composites. The experiments were conducted on a Vertical machining centre using HSS,Carbide(K20) and PCD drills of diameter 10mm. Response surface model is developed to correlate the thrust force with respect to different drilling parameters. The machining parameters considered for the experiments are spindle speed, feed rate, and type of drills. The results proved that the developed model can be effectively used for the prediction of Thrust forces in machining of CFRP laminates. II. EXPERIMENTAL 2.1Materials and Methods The CFRP laminates were fabricated using the hand lay- up technique. Carbon fibre (Zoltek, PANEX® 35)was used as a reinforcement in the Epoxy matrix(Huntsman, Warm curing epoxy system based on Araldite® LY 1564 SP/Hardener XB3486formulated amine hardener) and was cured at 220 deg Celsius for 90 minutes. This composite laminate was produced with a fiber orientation of 0/90 degrees with 20 layers of the fabric and resin used successively. The properties of the fibre are listed in Table 1.The different types of drill used in this study are shown in Fig 1. Experimental investigation and Analysis of Thrust Force in Drilling of Carbon Fibre Reinforced Plastic Composites using Response Surface Methodology
-
Upload
phungtuong -
Category
Documents
-
view
216 -
download
2
Transcript of Experimental investigation and Analysis of Thrust Force in ... · CARBON FIBER REINFORCED PLASTIC...
International Journal of Modern Engineering Research (IJMER)
www.ijmer.com Vol.2, Issue.4, July-Aug. 2012 pp-2719-2723 ISSN: 2249-6645
www.ijmer.com 2719 | Page
S. Madhavan1, S. Balasivanadha Prabu
2
1, 2 Department of Mechanical Engineering, College of Engineering Guindy,
Anna University, Chennai-600025, India
ABSTRACT: This paper reports the effect of thrust force
during drilling of 10mm diameter holes in 20mm thick
Carbon Fibre Reinforced Plastic composite laminate using HSS, Solid Carbide (K20) and Poly Crystalline
Diamond insert drills. Experiments are conducted on a
vertical machining centre using Taguchi design of
experiments. A model is developed to correlate the
drilling parameters with thrust force using Response
surface Methodology (RSM).The results indicate that the
developed model is suitable for prediction of thrust forces
in drilling of CFRP composites. The influence of different
parameters on thrust force of CFRP composites have been
analyzed through contour graphs and 3D plots. The
investigation has revealed that the type of drill geometry affects the thrust force significantly followed by the feed
rate and the speed.
Keywords: Drilling, CFRP, response surface
methodology, Thrust Force
I. INTRODUCTION CARBON FIBER REINFORCED PLASTIC
(CFRP) composite materials are continuously replacing
conventional metals and alloys in many applications such
as automotives, aircraft etc. The combination of superior
mechanical properties such as high specific strength,
stiffness and fatigue strength, enable the structural design
more reliable than conventional metals [1]. They can be
easily fabricated to near net shapes by processes such as hand lay-up, filament winding, pultrusion; etc.Machining
is required in places where composites are assembled by
joining processes. Machining of composites has been
recognized as a process different from that of
conventional materials. A proper selection of cutting
parameters facilitates good machinability since the
coexistence of hard abrasive fibres and a soft matrix
behave differently during machining [2].
Drilling is a frequently employed in industries
owing to the need for component assembly in mechanical
structures. Many researchers [3-5] reported that the
quality of the drilled surfaces depend strongly on the tool geometry, drilling parameters and tool material. An
inappropriate selection of these parameters can lead to
material degradations, such as fiber pull-out, matrix
cratering, thermal damage and delamination [3].
Tsao [6] reported that the feed rate and the drill
diameter are recognized as the most significant factors
affecting the thrust force. The radial basis function
network is demonstrated more effective than multi-
variable regression analysis for the evaluation of drilling-
induced thrust force and surface roughness in drilling of
composite material. Latha and Senthilkumar [10] used
fuzzy logic technique to predict thrust force in drilling of composite materials. Davim [11] presented a study for
selecting the cutting parameters for damage-free drilling
in carbon fiber reinforced epoxy composite material
which was based on a combination of Taguchi’s
techniques and on the analysis of variance (ANOVA).
Karnik et al., [12] carried out drilling as per full
factorial design using cemented carbide (grade K20) twist
drills that serve as input–output patterns for ANN training
and reported that the developed ANN model shows a
good correlation both for training and testing data sets,
thus validating the model. Two-factor interaction effects were also analyzed by generating 3D surface plots. The
interaction effects analysis demonstrates the advantages
of employing a high spindle speed for drilling CFRP
composite material which reduces the delamination at the
entrance of the holes.
This paper investigates the effect of different
drilling parameters on Thrust force in drilling CFRP
composites. The experiments were conducted on a
Vertical machining centre using HSS,Carbide(K20) and
PCD drills of diameter 10mm. Response surface model is
developed to correlate the thrust force with respect to
different drilling parameters. The machining parameters considered for the experiments are spindle speed, feed
rate, and type of drills. The results proved that the
developed model can be effectively used for the
prediction of Thrust forces in machining of CFRP
laminates.
II. EXPERIMENTAL
2.1Materials and Methods The CFRP laminates were fabricated using the hand lay-
up technique. Carbon fibre (Zoltek, PANEX® 35)was
used as a reinforcement in the Epoxy matrix(Huntsman,
Warm curing epoxy system based on Araldite® LY 1564
SP/Hardener XB3486formulated amine hardener) and
was cured at 220 deg Celsius for 90 minutes. This
composite laminate was produced with a fiber orientation
of 0/90 degrees with 20 layers of the fabric and resin used
successively. The properties of the fibre are listed in
Table 1.The different types of drill used in this study are
shown in Fig 1.
Experimental investigation and Analysis of Thrust Force in Drilling
of Carbon Fibre Reinforced Plastic Composites using Response
Surface Methodology

International Journal of Modern Engineering Research (IJMER)
www.ijmer.com Vol.2, Issue.4, July-Aug. 2012 pp-2719-2723 ISSN: 2249-6645
www.ijmer.com 2720 | Page
Figure 1.a) HSS Ball Nose, b) Carbide Ball Nose, c) PCD
Ball Nose
Table 1. Properties Carbon Fibre
TYPE
OF
FIBR
E
TEN
SILE
STR
ENGTH
(MPa
)
TEN
SILE
MO
DUL
US
E
(GPa
)
ELEC
TRIC
AL
RESIS
TIVITY
Ω-cm
%CA
RBO
N
CON
TENT
DE
NSI
TY
ρ
(g/c
c)
FIBR
E
DIA
MET
ER d (micr
ons)
Stitch
Bonde
d
Unidir
ection
al
3800 228 0.0015
5
95 1.81 7.2
2.2Experimental Procedure:
The experimental setup is shown in Fig.2 Arix VMC 100 CNC drilling machining centre was used for making drills
in the CFRP composites using different drill bits such as
HSS, Solid Carbide and PCD.The experiments were
conducted as per the L27 orthogonal array. The computer
controlled data acquisition system was used to collect and
record the data during experiments. The Kistler
dynamometer was used to record the cutting forces.
Figure 2.Experiment setup with dynamometer
arrangement
2.3 Response Surface Modelling
Response surface methodology (RSM) is a collection of
mathematical and statistical techniques that are useful for
the modelling and analysis of problems in which a
response of interest is influenced by several variables and
the objective is to minimize this response [10].
The process parameters, their notations, and their ranges
are given in Table 2.The experiments for the present work
have been carried out using full factorial taguchi design
of experiments. In the current investigation the number of variables considered for the response surface modelling is
three and the numbers of experiments conducted are 27.
The independently controllable process parameters
identified for the experimentation are: Spindle speed (V)
rpm, feed rate (f) in mm/min, and type of drills (d) used.
The steps involved in the RSM technique [3] are as
follows: (i) designing of a set of experiments for adequate
and reliable measurement of the true mean response of
interest, (ii) determination of mathematical model which
best fits; (iii) finding the optimum set of experimental
factors that produces maximum or minimum value of
response; and (iv) representing the direct and interactive effects of process variables on the best parameters
through two-dimensional and three-dimensional graphs.
Table 2.Process Parameters used for modelling
Control
Paramete
rs
Unit Symbol
s
Levels
-1 0 1
Cutting
Speed
rpm v 250
0
3000 350
0
Feed
Rate
mm/mi
n
f 50 75 100
Drill
Type
- d HS
S
CARBID
E
PC
D
In most RSM problems, the form of relationship between the response and the independent variable are
unknown.When the experimenter is close to optimum, a
model that incorporates curvature is usually required to
approximate the response. Usually a second order model
is utilized in response surface methodology.
Least square method is used to determine the
βcoefficients, in the model. Values of the controllable
parameters that results in optimization of response or
discover what values for the‘x’values will result in a
product (process) satisfying several requirements or
specifications can be determined by using RSM [8].A
second-order model is normally used when the response
function is not known or nonlinear. In the present study a
second-order model has been utilized. The thrust force F is given by
Thrust Force = 81.56- 25.56 * V+ 55.22*f + 202.5 * d +
12.67 * V * f -54.58* V * d +9.58 * f * d-5.33*V2 +20 *
f2 +442.83*d2- equation (2)
R2 is called coefficient of determination, is used to judge
the capability of regression model developed,
0≤R2≤1.The R2 value is the variability in the data
accounted by the model in percentage [8].After
estimating the sum of squares (SS) and mean squares

International Journal of Modern Engineering Research (IJMER)
www.ijmer.com Vol.2, Issue.4, July-Aug. 2012 pp-2719-2723 ISSN: 2249-6645
www.ijmer.com 2721 | Page
(MS), R2 value can be used to check the adequacy of the
model developed
R2 = 1-SSerror /SS Total
There is good concurrence between the experimental and
predicted values since the coefficient of determination
calculated is 95.10%.The diagnostic checking of
developed model can be checked by residual analysis.
The normal probabilities of residuals are shown in
Fig.3.The normal probability plot is used to verify the
normality assumption.
Design-Expert® SoftwareThrust force
Color points by value ofThrust force:
950
65
Internally Studentized Residuals
No
rma
l % P
rob
ab
ility
Normal Plot of Residuals
-2.00 -1.00 0.00 1.00 2.00 3.00
1
5
10
20
30
50
70
80
90
95
99
Figure .3 Normal residuals Plot
From the Fig.3 it is clear that the data are spread roughly
along the straight line. Hence, it can be concluded that the
data are normally distributed. Fig.4 shows predicted
results against the actual results. It is understood that
predicted results are very close to the experimental results
so response surface models are suitable for predicting
Thrust force of CFRP composites.
Design-Expert® SoftwareThrust force
Color points by value ofThrust force:
950
65
Actual
Pre
dic
ted
Predicted vs. Actual
0.00
200.00
400.00
600.00
800.00
1000.00
0.00 200.00 400.00 600.00 800.00 1000.00
Figure.4 Graph showing variation of Experimental
Values with predicted values
III. RESULTS AND DISCUSSION It can be seen that effect of cutting speed on the cutting
forces differs with various tool geometry and material. As
expected, the type of drill used has a greater influence on
thrust force. From Fig.5 it is observed that thrust force is
high as feed rate increases due to the change in the shear
area. There is tremendous increase in thrust force values
for PCD because the amount of margin left after
providing the flute is more. This reveals that drill
geometry has significant effect on the thrust force. The
thrust force generally increases as the speed increases but decreases further in the case of Carbide and PCD tool. On
contrary to carbide, the cutting force observed during
drilling using PCD is quite different. The value of cutting
force is high as compared with the carbide. The analysis
of response variable thrust force can be explained through
contour and surface plots. The typical three-dimensional
(3D) surface plots and two-dimensional (2D) contour
plots for Thrust force in terms of the process variable are
shown in Figures.6-11
Figure 5.Measured thrust force at different speeds
Equation (2) is plotted in Fig.6-8 as contours for each of
the response surfaces .These response contours can be
used to predict of thrust force at any point of the
experimental domain. Design-Expert® SoftwareFactor Coding: ActualThrust force
Design Points950
65
X1 = A: FeedX2 = B: Speed
Actual FactorC: Drill = 0.00
50.00 55.00 60.00 65.00 70.00 75.00 80.00 85.00 90.00 95.00 100.00
2500.00
2750.00
3000.00
3250.00
3500.00Thrust force
A: Feed
B:
Sp
ee
d
50
100
150
Figure.6 Estimated contour plots for Thrust force (Drill)
Fig.9 illustrates the surface plot for thrust force by
varying the two variables Spindle speed and type of drill
by keeping the feed as constant. It is found that the thrust force is high at lower speeds and found to decrease as
speed increases.
International Journal of Modern Engineering Research (IJMER)
www.ijmer.com Vol.2, Issue.4, July-Aug. 2012 pp-2719-2723 ISSN: 2249-6645
www.ijmer.com 2722 | Page
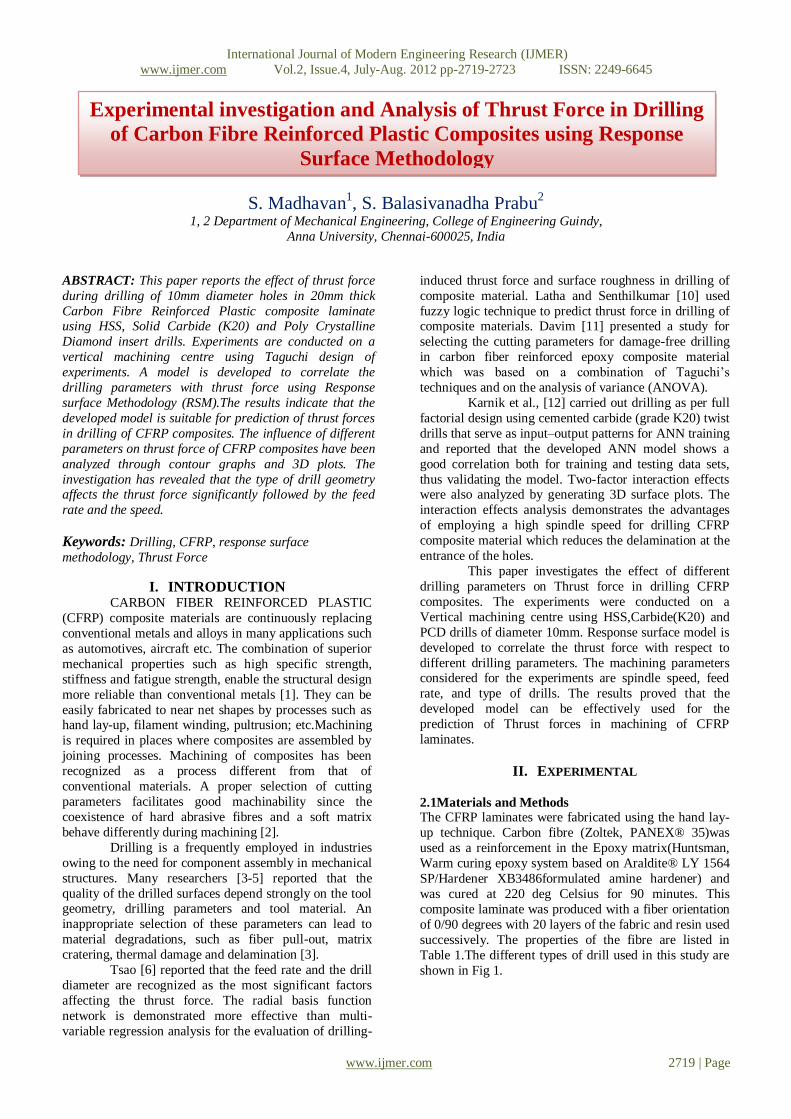
Figure.7 Estimated contour plots for Thrust force
(Speed=3000rpm), Figure.8 (Feed=75mm/min)
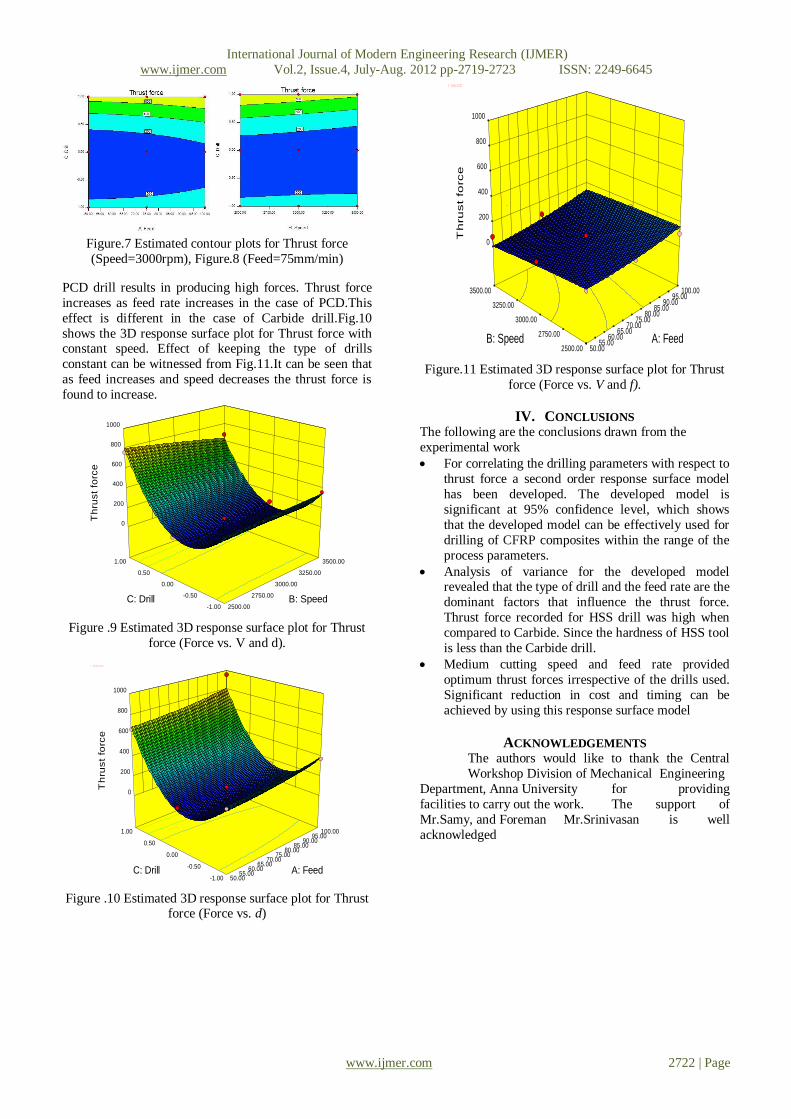
PCD drill results in producing high forces. Thrust force
increases as feed rate increases in the case of PCD.This
effect is different in the case of Carbide drill.Fig.10
shows the 3D response surface plot for Thrust force with constant speed. Effect of keeping the type of drills
constant can be witnessed from Fig.11.It can be seen that
as feed increases and speed decreases the thrust force is
found to increase.
Design-Expert® SoftwareFactor Coding: ActualThrust force
Design points above predicted valueDesign points below predicted value950
65
X1 = B: SpeedX2 = C: Drill
Actual FactorA: Feed = 75.00
-1.00
-0.50
0.00
0.50
1.00
2500.00
2750.00
3000.00
3250.00
3500.00
0
200
400
600
800
1000
T
hru
st
forc
e
B: Speed C: Drill
Figure .9 Estimated 3D response surface plot for Thrust
force (Force vs. V and d).
Design-Expert® SoftwareFactor Coding: ActualThrust force
Design points above predicted valueDesign points below predicted value950
65
X1 = A: FeedX2 = C: Drill
Actual FactorB: Speed = 3000.00
-1.00
-0.50
0.00
0.50
1.00
50.00 55.00
60.00 65.00
70.00 75.00
80.00 85.00
90.00 95.00
100.00
0
200
400
600
800
1000
T
hru
st
forc
e
A: Feed C: Drill
Figure .10 Estimated 3D response surface plot for Thrust
force (Force vs. d)
Design-Expert® SoftwareFactor Coding: ActualThrust force
Design points above predicted valueDesign points below predicted value950
65
X1 = A: FeedX2 = B: Speed
Actual FactorC: Drill = 0.00
2500.00
2750.00
3000.00
3250.00
3500.00
50.00 55.00
60.00 65.00
70.00 75.00
80.00 85.00
90.00 95.00
100.00
0
200
400
600
800
1000
T
hru
st
force
A: Feed B: Speed
Figure.11 Estimated 3D response surface plot for Thrust
force (Force vs. V and f).
IV. CONCLUSIONS The following are the conclusions drawn from the
experimental work
For correlating the drilling parameters with respect to
thrust force a second order response surface model
has been developed. The developed model is
significant at 95% confidence level, which shows
that the developed model can be effectively used for
drilling of CFRP composites within the range of the
process parameters.
Analysis of variance for the developed model revealed that the type of drill and the feed rate are the
dominant factors that influence the thrust force.
Thrust force recorded for HSS drill was high when
compared to Carbide. Since the hardness of HSS tool
is less than the Carbide drill.
Medium cutting speed and feed rate provided
optimum thrust forces irrespective of the drills used.
Significant reduction in cost and timing can be
achieved by using this response surface model
ACKNOWLEDGEMENTS The authors would like to thank the Central
Workshop Division of Mechanical Engineering
Department, Anna University for providing
facilities to carry out the work. The support of
Mr.Samy, and Foreman Mr.Srinivasan is well
acknowledged

International Journal of Modern Engineering Research (IJMER)
www.ijmer.com Vol.2, Issue.4, July-Aug. 2012 pp-2719-2723 ISSN: 2249-6645
www.ijmer.com 2723 | Page
REFERENCES 1. Ramesh.S, Karunamoorthy.L, Palanikumar.K
Surface Roughness Analysis in Machining of
Titanium Alloy,Materials and Manufacturing
Processes, 2008,Vol.23,175-181
2. A.Riaz Ahamed & Paravasu Asokan & Sivanandam
Aravindan & M. K. Prakash Drilling of hybrid Al-
5%SiC-5%B4Cp metal matrix composites
International journal of
Adv.Manuf.Technol,2009,Vol.49,871-877
3. Bhattacharya,BandSorkhel,S.K.InvestigationforContr
olledElectrochemical Machining Through Response Surface Methodology Based Approach,Journal of
Materials Processing Technology,1999,Vol 86,200-
207
4. Palanikumar, K. Application of Taguchi and
response surface methodologies for surface
roughness in machining glass fiber reinforced
plastics by PCD tooling. Int. J. Adv. Manuf.
Technol,2008,Vol 30,19-27
5. S. Arul,D. Samuel Raj,L. Vijayaraghavan,S. K.
Malhotra,R. Krishnamurthy Modeling and
Optimization of Process Parameters for Defect
Toleranced Drilling of GFRP Composites,Materials and Manufacturing Processes, 2006 Vol 21, 354-365
6. C.C. Tsao, H. Hocheng, Evaluation of thrust force
and surface roughness in drillingcomposite material
using Taguchi analysis and neural network,Journal of
materials processing technology ,2008,Vol 2 0 3,
342–348
7. L. Krishnamurthy; B. K. Sridhar; D. Abdul Budan
Comparative Study on the Machinability Aspects of
Aluminium Silicon Carbide and Aluminium Graphite
Composites,Materials and
ManufacturingProcesses,2007,Vol.22, 903-908. 8. Montgomery, D.C. Design and Analysis of
Experiments; 4th Ed.John Wiley and Sons: New
York, 1997
9. D. Iliescu, D.Gehin, M.E.Gutierrez, F.Girot ,
Modeling and tool wear in drilling of CFRP,
International Journal of Machine Tools &
Manufacture,2010,50,204–213
10. B. Latha V. S. Senthilkumar Analysis of Thrust
Force in Drilling Glass Fiber-Reinforced Plastic
Composites Using Fuzzy Logic,Materials and
Manufacturing Processes, 2009 ,Vol.24,509 – 516
11. J.P. Davim, Pedro Reis, Study of delamination in drilling carbon fiber reinforced plastics (CFRP) using
design experiments, Composite Structures,2003,59
481–487
12. R.Thanigaivelan,RM.Arunachalam,Experimental
Study on the Influence of Tool Electrode Tip Shape
on Electrochemical Micromachining of 304
Stainless Steel, Materials and
ManufacturingProcesses,2010,10,1166
13. V. N. Gaitonde S. R. Karnik J. Paulo Davim
Prediction and Minimization ofDelamination in
Drilling of Medium-Density Fiberboard (MDF)
Using Response Surface Methodology and Taguchi Design,Materials and Manufacturing Processes,
2008, Vol.23, 377 – 384
14. S. Basavarajappa Tool Wear in Turning of Graphitic
Hybrid Metal Matrix Composites,Materials and
ManufacturingProcesses,2009,Vol.24, pages 484 –
487
15. Y. W. Seo, D. Ki,M. Ramulu ,Electrical Discharge
Machining of Functionally Graded15–35 Vol%
SiCp/Al Composites,Materials and Manufacturing
Processes, 2006 ,Vol21,479 – 487
16. T. M. El-Hossainy, A. A. El-Zoghby, M. A. Badr, K.
Y. Maalawi,, M. F. Nasr ,Cutting Parameter Optimization when Machining Different
Materials,Materials and ManufacturingProcesses
,25,10,2010 ,1101
17. M. Dhananchezian, M. Pradeep Kumar, T.
Sornakumar, Cryogenic Turning of AISI 304
Stainless Steel with Modified Tungsten Carbide Tool
Inserts, Materials and
ManufacturingProcesses,2011,26,5781
18. K.Palani Kumar,Modeling and Analysis of
Delamination Factor and Surface Roughness in
Drilling GFRP Composites, Materials and ManufacturingProcesses,2010,25,1059
19. Sundaravel Vijayan, R. Raju,S,R. K.
Rao,Multiobjective Optimization of Friction Stir
Welding Process Parameters on Aluminum Alloy
AA 5083 Using Taguchi-Based Grey Relation
Analysis, Materials and
ManufacturingProcesses,2010,25,11,
20. S. Ranganathan,T. Senthilvelan,G. Sriram Evaluation
of Machining Parameters of Hot Turning of Stainless
Steel (Type 316) by Applying ANN and
RSM,Materials
andManufacturingProcesses,2010,10,1120 21. Erol Kilickap ,Mesut Huseyinoglu ,Selection of
Optimum Drilling Parameters on Burr Height Using
Response Surface Methodology and Genetic
Algorithm in Drilling of AISI 304 Stainless Steel ,
Materials and Manufacturing Processes, 2010, 25,
10, 1068
22. A. M. El-Tamimi, M. S. Soliman, T. M. El-Hossainy,
and J. A. Muzher ,Developed Models for
Understanding and Predicting the Machinability of a
Hardened Martensitic Stainless Steel, Materials
andManufacturingProcesses,2010,25,8,758


![CFRP [Wet-preg]](https://static.fdocuments.net/doc/165x107/546e6828b4af9faa268b4674/cfrp-wet-preg.jpg)