Experimental evidence on the long term impacts of a youth ...webfac/card/ikrrnov2016.pdf ·...
41
Experimental evidence on the long term impacts of a youth training program 1 Pablo Ibarrarán* Jochen Kluve** Laura Ripani*** David Rosas Shady*** 25 November 2016 1 This project is a collaborative effort involving many people. First, we want to recognize the support of Gavino Severino, director of the programs and projects executing unit at the Ministry of Labor in the Dominican Republic. We are especially thankful for the collaboration of Brígida García, advisor on the evaluation of the program, as well as to Douglas Hasbun from the Ministry of Labor. We acknowledge excellent comments and suggestions from Juan Miguel Villa Lora and Oscar Mitnik, as well as from participants of the 10th IZA/World Bank conference on employment and development, the 1 st Impact Evaluation Workshop of the IDB’s Labor Markets and Social Security Unit (LMK), and the ILO/INSEAD RCT-Lab Evidence Symposium. Special thanks to Barbara Buchbinder, Juan Mejalenko and Camila Mejia Giraldo for excellent research assistance. The views expressed in this paper are those of the authors and should not be attributed to the Inter- American Development Bank or any other institution that the authors are affiliated with. This research has been supported by the Technical Cooperation ATN/OC-13955-DR “Long Term Impacts of the Youth and Employment Program” financed by the Social Fund of the Inter-American Development Bank. Jochen Kluve gratefully acknowledges financial support from the Leibniz Association within the Leibniz Competition project “The effectiveness of youth employment programs”. * Inter-American Development Bank (IDB) and IZA; ** Humboldt-Universität zu Berlin, RWI and IZA; *** Inter- American Development Bank (IDB)
Transcript of Experimental evidence on the long term impacts of a youth ...webfac/card/ikrrnov2016.pdf ·...

Experimental evidence on the long term impacts
of a youth training program1
Pablo Ibarrarán*
Jochen Kluve**
Laura Ripani***
David Rosas Shady***
25 November 2016
1 This project is a collaborative effort involving many people. First, we want to recognize the support of Gavino Severino, director of the programs and projects executing unit at the Ministry of Labor in the Dominican Republic. We are especially thankful for the collaboration of Brígida García, advisor on the evaluation of the program, as well as to Douglas Hasbun from the Ministry of Labor. We acknowledge excellent comments and suggestions from Juan Miguel Villa Lora and Oscar Mitnik, as well as from participants of the 10th IZA/World Bank conference on employment and development, the 1st Impact Evaluation Workshop of the IDB’s Labor Markets and Social Security Unit (LMK), and the ILO/INSEAD RCT-Lab Evidence Symposium. Special thanks to Barbara Buchbinder, Juan Mejalenko and Camila Mejia Giraldo for excellent research assistance. The views expressed in this paper are those of the authors and should not be attributed to the Inter-American Development Bank or any other institution that the authors are affiliated with. This research has been supported by the Technical Cooperation ATN/OC-13955-DR “Long Term Impacts of the Youth and Employment Program” financed by the Social Fund of the Inter-American Development Bank. Jochen Kluve gratefully acknowledges financial support from the Leibniz Association within the Leibniz Competition project “The effectiveness of youth employment programs”. * Inter-American Development Bank (IDB) and IZA; ** Humboldt-Universität zu Berlin, RWI and IZA; *** Inter-American Development Bank (IDB)
2
Abstract Identifying the right human capital investments for disadvantaged young adults is a key policy concern worldwide. While many studies on the (very) short-term impacts of youth skills training programs exist, there is almost no rigorous evidence on the long-run effects of these policies outside the US. This paper presents the results of a large-scale randomized controlled trial of a youth training program, estimating treatment effects six years after random assignment, including long-term labor market trajectories of young people. We are able to track a representative sample of more than 3,200 youths at the six-year follow-up. The intervention is prototypical of many skills training programs worldwide, and has been implemented at scale in the Dominican Republic for more than a decade. Our empirical findings indicate mixed results: on the one hand, we document significant impacts on the formality of employment, particularly for men, and impacts for both men and women in Santo Domingo, the capital. The long-term analysis shows that these impacts are sustained and growing over time. On the other hand, there are no significant impacts on average employment; which appears consistent with the low unemployment in countries with high informality and no unemployment insurance. Looking at the local labor market context, the analysis suggests that skills training programs work better in more dynamic local contexts, where there is actual demand for the skills provided. Keywords: Long-term, impact evaluation, Randomized Controlled Trial, Dominican Republic, youth training, labor market outcomes. JEL Classification: J24, J64, O15, O17. Pablo Ibarrarán Laura Ripani David Rosas Shady Inter-American Development Bank 1300 New York Avenue Washington, DC, 20577 [email protected] [email protected] [email protected] Jochen Kluve Humboldt-Universität zu Berlin and RWI School of Business and Economics Spandauer Str.1 10178 Berlin, Germany [email protected]

3
1. Introduction
Investments in human capital are decisive for the economic success of individuals in the labor market.
In developed and developing countries alike, however, there are disadvantaged groups in need of
support to upgrade, modernize or simply build their skills. The fact of being disadvantaged can arise
for several reasons, such as lack of access to education, or dropping-out of education; a history or
background of poverty; and/or being unemployed and looking for a job. Job training programs of
various types have been implemented in many countries to address issues of skills shortages, to help
jobseekers find jobs, and to increase individual productivity and labor earnings.
A large number of program evaluation studies over the last decades have addressed the effectiveness of
these training programs in terms of increasing participant earnings and employment probability (for
systematic overviews of the evidence see Heckman et al. 1999, Greenberg et al. 2003, Betcherman et
al. 2004, Kluve 2010, Card et al. 2010, 2015). A key result emerging from the overall evidence is that
the timing of measuring program impacts matters: short-term effects during the first year post-program
are often small or even negative, reflecting the “lock-in” nature of a skills-enhancing treatment. With
increasing time between the end of the program and measurement of the effects, the size of the effects
and their positive significance generally tends to increase. Card et al. (2010, 2015) e.g. show that
medium- and long-run estimates of training impacts are more likely to be positive and significant than
the shorter term estimates. One caveat of this finding is, however, that the number of available long-run
estimates is small, and that the “long-run” is typically defined only as impacts measured more than 24
months after the program. Thus, the importance of the pattern notwithstanding, this type of evidence
also implies that our knowledge on long-term impacts remains quite limited.
In fact, only very few studies of long-term impacts of training programs exist, such that there is little
knowledge regarding the question whether the human capital investment contained in these – typically
post-secondary – training programs has any significant returns over an extended time horizon. Our
paper contributes to filling this knowledge gap by investigating the long-term effects of a youth
training program using a Randomized Controlled Trial (RCT). The empirical analysis is based on
experimental data tracing 3,279 young people six years after random assignment. Our study is

4
implemented in the Dominican Republic and covers a cohort of the training program Juventud y
Empleo (i.e. “youth and employment”). A previous cohort of the previous version of the program
served to evaluate the short-term impacts also using an RCT (Card et al. 2011), and short-term results
for the training cohort serving for our long-term experiment are presented in Ibarrarán et al. (2014).
Along with a parallel study by Attanasio et al. (2015) for Colombia, our paper is one of the very few
experimental long-term impact evaluations of a youth training program outside the US, where a series
of large-scale experimental evaluations investigated the impacts of the National Supported Work
Demonstration in the 1970s, JOBSTART in the 1980s, and Job Corps in the 1990s. The Juventud y
Empleo program is interesting and relevant to study, because it is prototypical of many youth training
programs worldwide, and it has been implemented at scale for more than a decade.
As our review of the literature shows (section 2), the evidence on long-term impacts of job training
programs is quite limited and inconclusive, despite the policy relevance of these programs. On the one
hand, a series of studies for Germany uses non-experimental identification strategies on specific
cohorts of registered unemployed and generally finds that training programs – at least the more
intensive ones – have positive long-term labor market outcomes. These programs are not targeting
specific age groups among the unemployed. On the other hand, the large-scale experimental studies in
the US look specifically at youths and generally find that these programs at best have very small long-
term earnings impacts. This led some authors at the time to conclude that despite the efforts that went
into the experimental evaluations there is no known way to make training programs for disadvantaged
youths work (Bloom et al. 1997).
Our paper contributes to this debate by producing new evidence on the long-run impacts of a job
training program. The intervention itself is less intensive than many training programs in developed
countries, but constitutes a sizeable human capital input combining classroom training and on-the-job
training for disadvantaged youths. Our study has several key advantages: (i) we can rely on
experimental data, (ii) we succeed in tracing a representative and comparatively large sample at the 6-
year follow-up, (iii) together with Attanasio et al. (2015) it is the first such study outside the US, and
since the 1990s, (iv) and we study a prototypical job training implemented at scale.
5
The empirical analysis shows and discusses the representativeness of our sample at the long-term
follow-up and presents intention-to-treat, average treatment, and local average treatment effect
estimates of program impacts. We find persistent effects on the formality of employment, in particular
for men, but not on overall employment. Young individuals in Santo Domingo, the capital, also benefit
significantly in terms of labor earnings. The empirical results therefore suggest that the skills
investment of the program may not bring about large overall impacts, but that it does have a significant
impact on the probability of being formally employed and on labor earnings in an urban labor market.
Moreover, the (small) positive impacts found for subgroups are generally sustained and growing over
time.
The paper is organized as follows. Section 2 reviews the literature on long-term impacts of training
programs. Section 3 describes the Juventud y Empleo program, gives a summary of the previous
findings on short-term impacts, and explains the experimental design and the long-term data collection.
The empirical results are presented in section 4. Section 5 concludes.
2. Related literature
The evidence to date on the long-run effects of job training programs is quite limited and can be
grouped into three types of studies. 2 The first type of studies looks at job training programs in the US;
these studies investigate impacts for the set of well-known US employment training programs that were
evaluated using large-scale experimental designs. A second type of studies looks at the long-run effects
of training for the unemployed (youth and adult) in Germany; these studies are based on administrative
data and use non-experimental identification strategies. Third, there is one parallel study by Attanasio
2 Note that our review of the related literature focuses specifically on long-run impact studies. There is a large number of impact evaluations of (youth) training programs in developing and developed countries that estimate short-run effects, typically during the first year after end of program participation; these studies are contained and discussed e.g. in the reviews and meta-analyses provided by Heckman et al. (1999), Greenberg et al. (2003), Ibarrarán and Rosas (2009), Card et al. (2010, 2015), and Kluve (2010).

6
et al. (2015) looking at long-run impacts of youth training in Colombia. We will review the three types
of studies in turn.
Couch (1992) uses Social Security data to track annual earnings for the treatment and control groups in
the National Supported Work (NSW) demonstration for 8 years following the end of the program. The
NSW provided subsidized employment opportunities – essentially work experience and on-the-job
training – to individuals “severely handicapped in the labor market” and operated experimentally at 10
sites across the US from 1975 to 1979. The study finds significant earnings impacts (in the range of
USD 400 – 500 p.a.) for Aid to Families with Dependent Children (AFDC) recipients during the period
4 to 8 years after treatment, but does not find any significant earnings effects for the youth target group
(sample sizes are not reported for both target groups). That is, for the entire 8-year post-program period
1979-1986 the annual earnings impact estimates for young individuals are close to zero in size and
always insignificant, indicating that the program did not help this group into a better position in the
labor market.
The JOBSTART demonstration was implemented between 1985 and 1988 in 13 sites and specifically
aimed at providing evidence on what works for low-skilled, economically disadvantaged young people
(Cave et al. 1993). The evaluation used an experimental design on the eligible population of 17- to 21-
year old, economically disadvantaged school dropouts with poor reading skills. The treatment group
participated in education and vocational training, and received job placement assistance; the total
average duration of program activities amounted to 400 hours (with wide variation, cf. Cave et al.
1993). The evaluation uses a sample of 1,941 youths who were surveyed in the short- and medium-
term (12, 24, and 48 months after random assignment). Whereas educational outcomes – i.e. passing
the General Educational Development (GED) examination or completing high school – were
significantly improved, labor market outcomes were not enhanced: after the expected “lock-in” effect
in the first year, at the end of the survey period treatment group average earnings “appeared to overtake
those of controls […, but] the magnitude of these impacts was disappointing and they were not
statistically significant according to the usual tests.” (Cave et al. 1993)
7
The Job Corps program is similar to JOBSTART but more intensive: disadvantaged youths between
the ages of 16 to 24 receive academic education, vocational training, and other services (e.g. counseling
and life skills training) during an average period of 8 months (again varying widely) in a residential
setting (Schochet et al. 2008). Placement services are also provided. The large-scale experimental study
uses a sample of 11,131 eligible youths that applied to the program in the mid-1990s. Survey data were
collected at baseline and at 12-, 30-, and 48-month follow-up interviews. The results indicate negative
earnings impacts during the first 5 quarters after random assignment (the “lock-in” phase), before
treatment group youths catch up with the control group and display significantly higher earnings during
the 3rd and 4th year after random assignment.3 This significant medium-term impact found in the survey
data disappears, however, when looking at the long-term impacts (years 5 to 8 after random
assignment) on earnings and employment using annual Social Security records (Schochet et al. 2008).
Hence, despite the intensity of the Job Corps intervention, the long-term impacts appear to be small.
This finding, however, has to be interpreted against the counterfactual of the evaluation, which is given
by a randomized-out control group of youths who to a large extent were offered and took part in
alternative training programs (ibid.).
Hotz et al. (2006) analyze the impacts of California’s Greater Avenues to Independence program
(GAIN) for up to 9 years after random assignment. A key part of the study is an assessment of the
relative effectiveness of alternative strategies for designing welfare-to-work programs: one approach
uses human capital development through education and vocational training, and a second approach
focuses on labor force attachment through job search assistance. Different from the above studies that
assess long-term impacts for disadvantaged youths, GAIN targeted adults on welfare, and contained a
mandatory component (see Hotz et al. 2006 for details). The analysis finds that in the long run the
human capital development approach yields higher employment rates for participants than the labor
force attachment approach. Overall, however, the long-run experimental impact estimates (7-9 years)
on employment rates are statistically significant from zero only for one of the four counties analyzed.
3 This is not the case for all youths. Flores-Lagunes et al. (2010) find that Hispanic youth did not experience earnings gains like whites and blacks – despite similar increases in human capital – and show that this relates to the different (higher) levels of local labor market unemployment rates they face.
8
This evidence on long-run impacts of training programs in the US is complemented by three studies for
Germany using administrative data based on specific cohorts each: inflows into unemployment during
1993 and 1994 (Fitzenberger and Völter 2007), inflows into training for the unemployed from January
1992 to June 1993 (Lechner et al. 2011), and inflows into unemployment within the period July 1999
to December 2001 (Osikominu 2012). Given the non-experimental nature of the data, all three studies
use econometrically involved variants of identifying treatment effects under unconfoundedness. The
results are generally encouraging: Fitzenberger and Völter (2007) find significantly positive long-run
impacts – up to 7.5 years after start of the program – on participants’ employment probability for a
comprehensive classroom training program. Lechner et al. (2011) find significantly positive
employment impacts for up to 8 years after the end of the program for the more comprehensive training
programs. Osikominu (2012) considers impacts for up to 5 years after registering as unemployed, and
finds the longer programs to be effective in creating stable employment spells and higher earnings.
Finally, the parallel study by Attanasio et al. (2015) looks at the Jovenes en Accion ("youth in action")
program in Colombia. The authors link the data from the initial experimental evaluation (Attanasio et
al. 2011) to administrative long-term follow-up data. The results indicate that the program had a
positive and significant effect on the probability to work in the formal sector, and the treatment group
contributed more months to social security during the analyzed period. The effects are more
pronounced for women.
3. The Juventud y Empleo Program: random assignment and data collection
Youth labor market insertion represents a challenge for the majority of Latin American and Caribbean
(LAC) countries. According to ILO (2014), one out of five young individuals are neither working nor
studying, and among those who are employed more than half are in the informal sector. To address this
situation, LAC governments have a long tradition of implementing programs that offer short-term job
training services to youths living in urban areas. These programs are supposed to offer training that
responds to the skills needs of the productive sector (Ibarraran and Rosas 2009, Gonzalez et al. 2012).
The interventions combine technical skills training (of approximately three months) in lower-skilled

9
professions with a subsequent internship period to provide on-the-job work experience (of around three
months). The majority of the programs also comprise a short component of soft skills training.
There is some evidence about the short-term impacts of these training interventions. In general, the
existing impact evaluations find zero or modest impacts on overall employment, but positive impacts
on job quality (formal employment) and earnings. Also, the evidence suggests large heterogeneity in
results by gender (Ibarrarán and Rosas 2009, Urzúa and Puentes 2010, Gonzalez et al. 2012). These
results differ from those for similar programs in developed countries, where, first, youth training
programs rarely show any positive impacts at all, and second, impact estimates generally do not differ
by gender (Card et al. 2010).
Since 2001, the Dominican Republic has been implementing one of the previously described programs,
which is named Juventud y Empleo (“youth and employment”). The Juventud y Empleo program has
been rigorously evaluated in the past, because it considered an experimental design since its inception
(Card et al. 2011). This emphasis on rigorous impact evaluation is striking in LAC, since few
randomized controlled trials to evaluate social policies or labor programs exist. Also, the program has
been characterized by using the findings from earlier evaluations to introduce improvements in its
conceptual and operative design.
Juventud y Empleo targets youths between 16 to 29 years of age that are living in poor neighborhoods
and that are not attending school. Other targeting criteria are that they should have, at most, incomplete
high school education; and they should be unemployed, under-employed or occupationally inactive at
the moment of the registration in the program; and hold a Dominican identity card. The program offers
skills training courses that last 225 hours: 150 hours devoted to teach a wide range of low-skill
qualifications, such as administrative assistant, hair stylist, or mechanic; and 75 hours devoted to
improve the soft skills of participants (mainly, work habits and self-esteem). Courses are followed by a
three-month period internship in a private firm. Both the registration of beneficiaries and the
identification of firms are the responsibility of private training institutions (Centros Operativos del
Sistema, COS) that have been previously approved by the national training institution (INFOTEP for
its acronym in Spanish). Participants receive a monetary stipend of around US$3 per day from the

10
government during both phases of the program. They also receive an insurance against workplace
accidents.
3.1 Previous evaluations
Juventud y Empleo is the first labor training program with an experimental impact evaluation in LAC.
Card et al. (2011) estimate program effects using a sample of youth that applied to the program in
2004. Follow-up data were collected in 2005, approximately 10-14 months after trainees had finished
the program. No impacts on employment but a modest positive impact on wages and formality for men
were found. The evaluation had a relatively small sample and a few other limitations. In particular,
compliance was imperfect: 17.4 per cent of youths randomly assigned to training did not show up for
the course. Moreover, the no-show behavior was selective and the study did not collect follow-up data
for the no-show group. In addition, 36.7 per cent of youths originally assigned to the control group
were re-assigned to the treatment group to replace the no-shows. Whereas, clearly, such a replacement
procedure can be implemented rigorously by randomly assigning control group units as replacements –
as we do in the current study (see section 3.2) – in that first evaluation the training institutions were
allowed to choose the replacements, and they did so in a selective manner (Card et al. 2011).
A second evaluation of the program was performed by Ibarrarán et al. (2014), again focusing on short-
term effects of the program, but using a later cohort of participants. Specifically, the cohort under study
in the second evaluation comprises youths who registered in the COS training centers in 2008, and
follow-up data were collected between November 2010 and February 2011, some 18-24 months after
participants had finished their course. In light of the experiences made in the first evaluation, the study
is based on an improved procedure of random assignment and data collection that also forms the basis
of our analysis (section 3.2).
The results of the evaluation are mixed; as in the first study, program impacts on overall employment
are negligible but there is an impact on job quality for men. Specifically, the impact on the probability
of formal employment for males is a 17 per cent increase. Moreover, the study finds a positive impact
of 7 per cent on monthly earnings, conditional on being employed. Both of these impacts are stronger

11
in Santo Domingo, the capital. Looking at secondary outcomes, the study finds positive impacts on
participants’ perceptions and expectations about the future, particularly for women. The program also
has an impact on the development of soft skills, mainly in the following dimensions: leadership skills,
persistency of effort, and conflict resolution (Ibarrarán et al. 2014).
Despite the fact that the second evaluation managed to solve the methodological problems of the first
impact study, estimates of the short-term effects only provide limited information on the program’s
effectiveness. First, it is imperative to investigate whether the overall relatively modest effects as well
as the stronger effects for some subgroups are sustained in the long run. Second, this is particularly
interesting against the background of the generally disappointing results on long-term impacts for
youth training programs in developed countries (recall section 2). And third, it is important to assess
long-term impacts specifically in LAC, since the series of youth training programs in the region has
been generally perceived as a success, even though this conclusion is derived from short-term impact
estimates only.
3.2 Random assignment and survey implementation
The evaluation design of the Juventud y Empleo program is strongly linked to its targeting method. In
the first stage, for each training course they offer, the COS training centers identify 35 young people
that meet the eligibility criteria described above. In the second stage, the Juventud y Empleo Program
Coordination Unit (PCU; Unidad Coordinadora de Programas) receives the information about the
youths that registered for the course from the COS training centers and proceeds to verify that none of
the applicants has registered before. In the third step, the program runs a lottery in which each of the 35
youths is randomly assigned to one of two groups. The first one is formed by 20 youths who are invited
to attend the training course and the second one by 15 youths who are assigned to the control group;
their identification numbers are locked in order to guarantee that they will not be registered again in the
case of any other attempt.
If any of the 20 youths assigned to the treatment group gives no response when called to attend the
course or if they drop out before the tenth day of classes, the COS may replace up to 5 slots with

12
youths from the control group. This group of five people is again randomly selected out of the 15 in the
control group by the PCU, who provides the names of the up to five replacements directly to the COS.4
Hence, given this procedure and the initial configuration of random assignment to treatment and
control groups, we can define four groups in the data: (A) the beneficiaries: those who were randomly
assigned to the treatment group and actually attend and complete the course, (B) the no-shows: those
who were randomly assigned to the treatment group but fail to show up or fail to complete at least two
weeks of the course, (C) the replacements: those who were randomly assigned to the control group and
then randomly chosen to replace no-shows in the training course, (D) the controls: those who were
randomly assigned to the control group.
The data for the long-term impact evaluation were collected in three waves, one baseline survey at
random assignment in 2008 and two follow-up surveys: the short-term follow-up survey between
November 2010 and February 2011 (18 to 24 months after graduating from the program), and the long-
term follow-up survey between September and December 2014 (six years after the treatment). Both
follow-up surveys were administered using comprehensive face-to-face interviews (the full
questionnaires are available upon request). It has to be emphasized that substantial effort went into
tracking youths at the long-term follow-up, using all resources available (family, friends, neighbors) to
establish contact and make possible the interview. 5
4 This procedure solves a problem that is not uncommon in randomized trials of training or similar programs: typically some share of the units assigned to the treatment group may not show up or drop out very early, while at the same time strong incentives may exist to fill all available slots (e.g. if the program implementing institution is paid to serve a certain number of people). It is then crucial to avoid a non-random process of filling-up the free slots with control group units, e.g. as happened in the first Juventud y Empleo study, when the training institutions themselves selected the replacements, biasing both treatment and control groups (Card et al. 2011). A related approach is the “waitlist” procedure used e.g. in Hirshleifer et al. (2014), in which eligible units are assigned to treatment group, control group or waitlist, and implementing institutions can replace no-shows choosing units from the waitlist. While the waitlist units are excluded from the analysis (as their selection into training is non-random), the advantage of the procedure is that it maintains a valid control group. Our procedure has the additional advantage that also the replacements can be included in the analysis, since they are randomly drawn from the control group – this was feasible because, if replacements were needed, it could be put into practice very quickly at the COS training course level (i.e. the cell of 35 eligible youths). 5 Data collection proceeded using several incentives and instruments for quality assurance. For instance, external advisors were hired to supervise the field experiment, and the data processing system was implemented using the Computer Assisted Field Editing (CAFÉ) methodology. A system of double entry was used in 20 per cent of the cases to ensure that the CAFÉ methodology was working as expected. Finally, monetary incentives of RD$600 (around 15 dollars) per respondent were offered in order to minimize attrition.

13
At baseline in the year 2008, 10,309 eligible applicants were randomly assigned to 5,914 treated and
4,395 control units. Following the (expected) occurrence of no-shows and the replacement procedure
delineated above, the eventual distribution of the entire baseline sample into the four groups was as
follows: (A) 4,937 beneficiaries, (B) 977 no-shows, (C) 977 replacements, (D) 3,418 controls. The
short-term follow-up targeted a random sample of 5,000 out of the 10,309 young people who had
initially registered.6 This target sample had 3,250 individuals from the treatment group and 1,750 from
the control group. From this sample, 4,033 individuals were found and interviewed, 2,626 of the
treatment group and 1,407 of the control group (Ibarrarán et al. 2014). These formed the target sample
for our long-term follow-up in 2014: From the 4,033 individuals interviewed in 2010, 3,279 were
found and have complete surveys: 2,163 individuals in the treatment group and 1,116 in the control
group (as initially assigned). In sum, in both follow-up surveys about 80 percent of the sample were
located at their households, and this percentage was balanced between treatment and control groups.
If Zi represents the random assignment of each youth i (Zi = 1 assigned to the treatment group and Zi =
0 assigned to the control group) and Di the final treatment status (Di = 1 attended the course and Di = 0
do not), Table 1 shows the distribution of the long-term follow-up between the four groups in 2014.
Table 1. Participants by lottery assignment and treatment status, long-term follow-up sample
Selected in the Lottery, Zi=1 Not selected in the Lottery, Zi=0
Participated in the
program, Di=1
Group A: Beneficiaries,
N=1,901
Group C: Replacements,
N=438
Did not participate in
the program, Di=0
Group B: No-shows,
N=262
Group D: Controls,
N=678
Source: 2014 long-term follow-up survey. 6 The sample size was set at 5,000 to detect an 8 percent increase in income with a power of 0.8 and an attrition of 30 percent of the sample.

14
3.3 Identification strategy and data
Given the randomized experiment described above, the first step in our analysis is to estimate the
causal effect of Zi on labor market outcomes using an Intention to Treat (ITT) analysis, i.e. a linear
regression of the outcome on Zi. This approach uses the full sample of treatment (A and B) and control
group units (C and D).7 Since youths in the replacements group were eventually randomly selected to
take part in the course, we also estimate Average Treatment on the Treated (ATT) effects that compare
the combination of the groups A and C – both of which effectively received the treatment – with the
group D as control group (i.e. the “pure” randomized-out control units). In both cases, the regressions
include fixed effects for training institutions COS, and robust standard errors are computed using
clusters defined by the course within which randomization took place. Finally, we also estimate the
Local Average Treatment Effects (LATE), in which participation is instrumented by randomization
status.
Ibarrarán et al. (2014) show that the complete cohort (N=10,305)8 as well as both the target sample
(N=5,000) and the realized sample (N=4,033) at short-term follow-up are balanced in baseline
characteristics of the treatment and control groups. Table 2 validates the long-term follow-up and
shows that, at baseline, there are no significant differences between the long-term follow-up sample
(N=3,279) and the rest of the sample (N=7,026). As shown, the characteristics of the sample that we
track in 2014 are statistically equivalent to the rest of the 2008 training cohort. The same holds if we
focus on differences at baseline between the 2014 sample and the rest of the sample within the
treatment and control groups.9
7 An alternative definition of the ITT in this set-up would be to compare A, B, and C together against D. Estimation results for this ITT are reported in Appendix Table A1. 8 The complete cohort of 10,305 individuals comes from the original randomization group of 10,309, taking out four individuals that did not have identification numbers. 9 The tables showing the descriptive statistics within treatment and control groups at baseline for the 2014 sample and the rest are available upon request. They find the same results in terms of balancing as the overall sample shown in table 2. As a robustness check, and additional validation of the long-term follow-up sample, we re-estimated the regressions for the short-term analysis in Ibarrarán et al. (2014) restricting the sample to the 3,279 observations with complete long-term data in 2014, and the results remain essentially unchanged.

15
After having shown that the long-term follow-up sample is representative of the complete cohort, we
proceed to show that, within the 2014 sample, there is balance in the characteristics of treated and
control youths (as defined by the lottery) as well as between participants and non-participants. That is,
using the definition of the four groups presented above, Table 3 shows the mean characteristics at
baseline for each of the groups defined by the assignment/participation matrix (Table 1), as well as for
the groups defined by the lottery (AB vs CD) and by participation (AC vs D). The results show that
balance is maintained in the 2014 sample. In the first comparison (based on the results of the lottery)
there is only one unbalanced variable out of 25, and in the second comparison (based on participation)
there are only two unbalanced variables (but only at the 10% significance level). In sum, these tables
show that the long-term follow-up data are representative of the whole cohort, and that the data are
balanced between the four subgroups defined by lottery assignment and participation, essentially also
validating the replacement procedure.
Table 2. Representativeness of the long-term follow-up sample, characteristics at baseline
Mean P-value
Sample 2014=0
Sample 2014=1
Age 21.54 21.51 0.61 Age 16-19 0.35 0.35 1.00 Age 20-24 0.43 0.44 0.49 Age >24 0.22 0.21 0.41 % Women 0.63 0.62 0.41 % Married 0.03 0.03 0.70 Number of people in HH 4.36 4.53 0.00 Number of children 0.70 0.70 0.88 % Currently attending school 0.22 0.24 0.03 Fraction with prior work experience 0.16 0.17 0.46 Worked during last 2 years 0.21 0.21 0.79 Rosenberg (0 to 30) a 23.85 23.95 0.25 Urban areas 0.90 0.88 0.04 Lives in Santo Domingo 0.25 0.23 0.02 Receives remittances 1.89 1.90 0.43 Owns home 0.06 0.06 0.20 Concrete, brick or wood walls 0.97 0.97 0.54 Concrete or zinc ceilings 1.00 1.00 0.22 Cement, ceramic or wood floors 0.98 0.98 0.94 % connected to aqueduct 0.50 0.49 0.39 % Proper sanitation 0.99 0.99 0.31 % Garbage collection 0.83 0.85 0.07

16
% Refrigerator 0.71 0.72 0.41 % TV 0.88 0.88 0.76 % Wash Machine 0.72 0.72 0.61 % Car 0.14 0.15 0.30 % AC 0.02 0.02 0.99 % Computer 0.09 0.08 0.59 % Electricity Generator 0.08 0.09 0.75 Observations 7,026 3,279 10,305
Sources: Long-term follow-up survey, baseline survey. Notes: The “Sample 2014=1” group denotes the long-term follow-up sample available for analysis. The “Sample2014=0” group comprises the remaining observations from the full cohort of 10,305 youths that formed part of the random assignment in 2008. a The Rosenberg Scale is a tool used in clinical-psychometric practice to measure self-esteem levels. It was first introduced in 1965 and revised in 1989 (see Rosenberg 1989). Higher scores on the scale indicate greater self-esteem. The balancing test for the scale is based on the 9,692 observations with available data -3,096 of them in the follow-up sample. The complete set of balancing tests for all the variables for this subsample yield the same conclusions and are available upon request.

17
Table 3. Baseline characteristics of subgroups defined by lottery assignment and participation: long-term follow-up sample
Characteristic Mean P-value
A B C D AB CD AC AB/CD AC/D Age 21.99 22.27 21.79 22.03 22.03 21.94 21.96 0.470 0.604 Age 16-19 0.19 0.19 0.22 0.22 0.19 0.22 0.20 0.050 0.170 Age 20-24 0.53 0.54 0.54 0.50 0.53 0.52 0.53 0.292 0.116 Age >24 0.27 0.27 0.24 0.28 0.27 0.26 0.27 0.555 0.601 % Women 0.62 0.65 0.59 0.63 0.63 0.61 0.62 0.511 0.645 % Married 0.24 0.24 0.25 0.23 0.24 0.23 0.24 0.603 0.360 Number of people in HH 4.50 4.49 4.45 4.64 4.50 4.56 4.49 0.341 0.071 Number of children 0.69 0.80 0.63 0.73 0.70 0.69 0.68 0.783 0.230
Currently attending school 0.25 0.21 0.24 0.24 0.24 0.24 0.25 0.898 0.823 Incomplete elementary 0.19 0.21 0.18 0.20 0.19 0.19 0.19 0.938 0.493 Complete elementary 0.05 0.04 0.04 0.06 0.05 0.05 0.05 0.874 0.573 Incomplete high school 0.58 0.56 0.55 0.58 0.58 0.57 0.57 0.612 0.892 Complete high school 0.04 0.03 0.04 0.03 0.03 0.03 0.04 0.966 0.295 More than high school 0.00 0.00 0.00 0.00 0.00 0.00 0.00 0.401 0.235 Missing education 0.04 0.04 0.04 0.03 0.04 0.04 0.04 0.991 0.750 No data on education 0.10 0.12 0.14 0.10 0.10 0.12 0.11 0.202 0.651 Prior work experience 0.17 0.19 0.16 0.16 0.17 0.16 0.17 0.365 0.603 Currently employeda 0.04 0.04 0.06 0.04 0.04 0.05 0.04 0.224 0.912 Currently salaried workera 0.01 0.01 0.02 0.02 0.01 0.02 0.01 0.225 0.241 Currently unemployeda 0.52 0.55 0.50 0.51 0.53 0.51 0.52 0.417 0.810 ICV Score (0 to 100) b 62.66 62.70 63.25 62.29 62.66 62.66 62.77 0.993 0.288 Rosenberg (0 to 30) c 24.00 23.89 24.09 23.73 23.99 23.87 24.02 0.385 0.075 Urban areas 0.89 0.87 0.86 0.90 0.88 0.88 0.88 0.944 0.117 Lives in Santo Domingo 0.31 0.30 0.28 0.32 0.31 0.31 0.31 0.662 0.603 Receives remittances 0.11 0.08 0.10 0.11 0.10 0.11 0.10 0.806 0.551
Observations 1,901 262 438 678 2163 1,116 2,339 Sources: Long-term follow-up survey. Notes: Groups as defined by lottery assignment and participation: A = beneficiaries, B = no-shows, C = replacements, D = controls. See also section 3.2 and Table 1. AB = treatment group according to random assignment, CD = control group according to random assignment; these groups are used to identify ITT program effects. AC = all youths that actually received the treatment, AC vs. D used to identify ATT program effects. a Tests for current job status were run for the available observations: 1,708 from group A, 230 group B, 375 group C, 606 group D, 1,938 AB, 981 CD, 2,083 AC. b The test for ICV scores was run for the available observations: 1,592 from group A, 221 group B, 364 group C, 574 group D, 1,813 AB, 938 CD, 1,956 AC. c The test for Rosenberg scores was run for available observations: 1,795 from group A, 251 group B, 409 group C, 641 group D, 2,046 AB, 1,050 CD, 2,204 AC. Balancing tests for all variables with the same sub-sample yield the same conclusions and are available upon request..

18
Table 4 displays sample characteristics and raw outcomes at the time of the long-term follow-up in
2014. Again, we group the data based on the subgroups defined above, to illustrate the summary
statistics in relation to the two alternative identification strategies: the first based on the results from the
lottery (AB vs CD, the ITT), and the second considering actual participation in the program (AC vs D,
the ATT). Table 4 shows that the age at the time of the long-term follow-up is 28 years on average, so
the group is at the upper end of the youth age range (if we consider youths as individuals between 15
and 29 years of age), entirely in line with the timing of the survey six years after random assignment.
Half of the sample is married (in contrast with 20 per cent at baseline), and about 32 per cent are heads
of household. Looking at gender separately, the respective probabilities for men and women to be
married at the long-term follow-up are 0.41 and 0.56, and to be head of household the probabilities are
0.42 and 0.25. In terms of demographics, the only statistically significant difference is in marital status,
due to a higher share of males being married in the treatment group: those males assigned to participate
in the program (AB) and those that completed the program (AC) are more likely to be married in 2014
than the control group. A plausible mechanism for this result lies in the positive impacts on quality of
employment (explored below) that may in turn impact positively the probability of getting married.
Looking at raw outcomes, overall there is little indication of statistically significant differences in the
comparison of the groups assigned to treatment vs. control, and actual participation vs. control. The
average employment rate is 73 per cent, with no statistically significant differences across those
randomly assigned to training (AB vs CD) or across treatment participants and controls (AC vs D). The
employment rate is higher for men than for women, and it is overall substantially higher than at the
short-term follow-up in 2010 (when it was around 62 per cent). In part this can be explained already by
an upward sloping employment-age profile that would be expected in general; and specifically against
the background of high levels of informality in the Dominican labor market, generating pressure on
youths to look for work. We will explore these employment patterns further when we look at the long-
term labor market trajectories of the treatment and control groups in section 4.2.
Regarding employment characteristics, almost 90 per cent of young individuals work in services, and
the average tenure on the job is about 20 months (with a slightly longer tenure for those selected in the

19
lottery). About 56 per cent have a permanent job (but only 21 per cent have a written contract), 44 per
cent are salaried workers and 22 per cent work at large firms. About half of the workers express their
desire to change their current job, but only 19 per cent were seeking for another job at the time of the
survey. Average monthly labor income (calculated with zero earnings for those not working) is
RD$5,300, the equivalent of USD$120.
Table 4. Sample characteristics and raw outcomes at long-term follow-up Mean P-value Characteristic/Outcome AB CD D AC AB/CD AC/D Age 27.93 27.94 28.00 27.89 0.94 0.48 % Women 0.62 0.63 0.63 0.62 0.48 0.37 % Head of Household (all) 0.34 0.30 0.35 0.31 0.04 0.03 % Head of Household (women) 0.26 0.25 0.28 0.25 0.52 0.53 % Head of Household (men) 0.46 0.40 0.50 0.40 0.03 0.01 % Married 0.50 0.50 0.49 0.50 0.97 0.40 % Currently attending school 0.20 0.22 0.20 0.22 0.25 0.34 Years of education 11.48 11.53 11.29 11.60 0.66 0.01 Employed (women) 0.66 0.65 0.64 0.65 0.41 0.61 Employed (men) 0.86 0.86 0.87 0.85 0.80 0.52 Employed (all) 0.74 0.72 0.72 0.73 0.34 0.82 Agriculture and mining 0.02 0.02 0.01 0.02 0.57 0.45 Industry 0.10 0.08 0.11 0.08 0.05 0.01 Services 0.88 0.90 0.87 0.90 0.04 0.03 Duration of current job (months) 21.03 18.67 20.52 19.26 0.03 0.34 Permanent job 0.57 0.56 0.55 0.57 0.65 0.28 Employed at large firms 0.21 0.22 0.22 0.22 0.39 0.87 Salaried workers 0.44 0.44 0.42 0.45 0.75 0.25 Unpaid workers 0.01 0.01 0.01 0.01 0.40 0.88 Self-employed 0.22 0.22 0.22 0.22 0.77 0.87 Workers w/labor risk insurance 0.11 0.13 0.11 0.13 0.11 0.07 Workers w/ health insurance 0.25 0.28 0.24 0.28 0.12 0.02 Workers w/written contract 0.20 0.21 0.19 0.22 0.34 0.13 Weekly worked days 5.72 5.75 5.79 5.72 0.59 0.34 Weekly worked hours 29.31 28.42 28.85 28.85 0.35 1.00 Wants to work more hours 0.47 0.47 0.47 0.47 0.70 0.83 Workers seeking another job 0.21 0.19 0.20 0.19 0.21 0.79 Monthly wage (Dominican peso) 5357.84 5285.06 4999.80 5417.94 0.75 0.12 Hourly wage (Dominican peso) 37.44 39.78 34.57 40.16 0.46 0.14 Observations 2,163 1,116 678 2,339 3,279 3,017
Source: 2014 long-term follow-up survey. Notes: Outcomes are not conditional on employment status. Groups as defined by lottery assignment and participation: A = beneficiaries, B = no-shows, C = replacements, D = controls. See also section 3.2 and Table 1. AB = treatment group according to random assignment, CD = control group according to random assignment; these groups are used to identify ITT program effects. AC = all youths that actually received the treatment, AC vs. D used to identify ATT program effects. a: Large firms are those that employ 51 or more employees -- b: One Dominican Peso = 0.0228 USD (November 2014)

20
4 Empirical results
4.1 Long-term impacts
Tables 5 through 7 present the long-term impact estimates of the Juventud y Empleo job training
program on labor market outcomes, using the experimental design described in the previous section. It
is important to recall that the sample is representative for the young people that this program serves,
and that the large sample size at the six-year long-term follow-up and the virtue of random assignment
allows to provide precise estimates of the intervention effects. It is also worth noting that Juventud y
Empleo is not a pilot program, but has been running for more than a decade as a publicly funded active
labor market program in the Dominican Republic.
The results tables 5 and 6 (displaying ITT and ATT estimates, respectively) show several patterns.
First, the overall average impacts on employment and earnings in the long-run remain close to zero in
size and insignificant. Second, there is heterogeneity in the impact estimates, indicating, in particular,
significant treatment-control differences for several stratifications of the sample population by socio-
demographic characteristics. One key result is that there is a positive long-term impact of the program
on the quality of employment for men, as measured by the job characteristic “employed with health
insurance” (ITT in Table 5: 8 percentage points, i.e. an impact of 25 per cent).10 This finding implies a
sustained positive impact on formality that is consistent with and continues what was found in the
short-run evaluation: in the first follow-up the impact was significant and of smaller magnitude (17 per
cent).
The long-term impact is largest in Santo Domingo, where there is also an important impact for women.
The overall point estimate of 7.3 percentage points in Santo Domingo, representing an impact of 31 per
cent, is higher in the case of men (11.8 percentage points) than for women (6.3 percentage points),
though in relation to the mean outcomes of controls (19.1 for females, 33.3 for males) the per cent
increase is similar. In Santo Domingo, there is also a positive effect on the probability of having a
10 Having a job with health insurance or written contract are used as proxies of formality. Given the high informality rates in the Dominican Republic, having a formal job makes a sizeable difference in the career path of young people.

Table 5. Long-term impacts of the “Juventud y Empleo” training program on labor market outcomes: ITT
(1) (2) (3) (4) (5) (6) (7) (8)
Outcome All Women Men Santo Domingo
Santo Domingo women
Santo Domingo
Men Age 16-21 Age >21
Employed -0.0143 -0.0162 0.0028 0.0250 0.0345 0.0203 -0.0035 -0.0256 (0.0152) (0.0222) (0.0192) (0.0315) (0.0423) (0.0453) (0.0224) (0.0239)
Mean control group 0.740 0.665 0.860 0.719 0.658 0.838 0.739 0.741
Employed with health insurance 0.0256 0.0001 0.0802*** 0.0732*** 0.0625* 0.1176* 0.0227 0.0178 (0.0158) (0.0201) (0.0278) (0.0276) (0.0326) (0.0632) (0.0249) (0.0228)
Mean control group 0.254 0.220 0.309 0.240 0.191 0.333 0.295 0.210
Employed with written contract 0.0173 0.0110 0.0383 0.0441* 0.0318 0.0744 0.0211 0.0033 (0.0141) (0.0176) (0.0259) (0.0246) (0.0296) (0.0523) (0.0219) (0.0197)
Mean control group 0.200 0.163 0.258 0.196 0.164 0.256 0.232 0.164
Monthly earnings -99.7006 82.1841 -91.8111 299.6451 913.9499** -292.7177 44.4220 -312.0953 (222.9148) (221.2317) (477.2564) (391.4541) (371.6096) (935.1086) (311.1643) (337.2968)
Mean control group 5358 3772 7888 5519 3692 9031 5549 5145
Ln Monthly earnings 0.0166 -0.0081 0.0631 -0.0333 0.0234 -0.0633 0.0631 -0.0290 (0.0396) (0.0600) (0.0542) (0.0817) (0.1259) (0.1064) (0.0554) (0.0616)
Mean control group 8.701 8.498 8.930 8.784 8.531 9.111 8.743 8.654
Labor force participation -0.0030 -0.0049 0.0060 0.0287 0.0398 0.0119 0.0041 -0.0100 (0.0115) (0.0182) (0.0101) (0.0205) (0.0305) (0.0173) (0.0161) (0.0176)
Mean control group 0.883 0.832 0.963 0.877 0.831 0.966 0.879 0.887 Observations 3,279 2,041 1,238 1,020 677 343 1,729 1,549
Notes: Regressions use the full sample of groups A and B (treated) and C and D (controls). All specifications control for training institutions (COS) and 10 administrative regions. Standard errors in parentheses. Significance levels are indicated by *10%, **5%, and ***1%.

22
Table 6. Long-term impacts of the “Juventud y Empleo” training program on labor market outcomes: ATT
(1) (2) (3) (4) (5) (6) (7) (8)
Outcome All Women Men Santo Domingo
Santo Domingo women
Santo Domingo
Men Age 16-21 Age >21
Employed 0.0033 0.0148 -0.0103 0.0313 0.0575 -0.0261 -0.0030 0.0183 (0.0182) (0.0255) (0.0231) (0.0364) (0.0476) (0.0509) (0.0266) (0.0279)
Mean control group 0.724 0.641 0.865 0.705 0.635 0.855 0.737 0.711
Employed with health insurance 0.0437** 0.0273 0.0816*** 0.0861** 0.0969** 0.0639 0.0360 0.0488* (0.0194) (0.0240) (0.0314) (0.0342) (0.0398) (0.0683) (0.0290) (0.0249)
Mean control group 0.237 0.202 0.298 0.221 0.162 0.348 0.286 0.187
Employed with written contract 0.0260 0.0178 0.0449 0.0447 0.0407 0.0315 0.0224 0.0172 (0.0169) (0.0207) (0.0284) (0.0292) (0.0360) (0.0566) (0.0266) (0.0226)
Mean control group 0.189 0.155 0.246 0.189 0.155 0.261 0.225 0.151
Monthly earnings 387.6807 304.0351 622.0150 1,029.5949** 1,059.2345** 1,124.5911 557.4660 142.6572 (268.7737) (276.8782) (535.6966) (477.5475) (456.7620) (1,166.3988) (351.6033) (389.7139)
Mean control group 5000 3599 7368 4879 3443 7961 5213 4778
Ln Monthly earnings 0.0451 0.0056 0.1120* 0.0466 0.1082 0.0426 0.0829 -0.0240 (0.0516) (0.0786) (0.0647) (0.1031) (0.1612) (0.1072) (0.0660) (0.0788)
Mean control group 8.677 8.492 8.889 8.725 8.479 9.050 8.728 8.621
Labor force participation 0.0127 0.0162 0.0030 0.0384 0.0485 0.0070 0.0195 0.0115 (0.0137) (0.0206) (0.0131) (0.0244) (0.0312) (0.0255) (0.0206) (0.0190)
Mean control group 0.872 0.819 0.960 0.866 0.824 0.957 0.867 0.877 Observations 3,017 1,872 1,145 938 625 313 1,601 1,415
Notes: Regressions use the sample of groups A and C (treated) and D (controls). All specifications control for training institutions (COS) and 10 administrative regions. Standard errors in parentheses. Significance levels are indicated by *10%, **5%, and ***1%.

written contract – another measure of formality – of 23 per cent. This impact is significant at the 10 per
cent level and measured for men and women together. Overall, the long-term impacts on formality are
substantial and show that the program has an important effect in helping youth get and keep good jobs.
Table 5 also shows that, in Santo Domingo, there is a statistically significant impact on the earnings for
women, representing an increase of 25 per cent in the treatment over the control group.
The results of estimating the ATT impacts (Groups A and C vs. D) shown in Table 6 are consistent
with the findings from the ITT analysis (and also borne out by the alternative definition of the ITT in
Appendix Table A1): there is an important impact on formality (measured by having employer
provided health insurance, in the order of 18 per cent), which is particularly strong for men (27 per
cent) and in Santo Domingo (39 per cent over the control group mean). In this specification, the impact
for men is not concentrated in Santo Domingo, where women do have a very large impact (9.7
percentage points or 60 per cent over the control group mean). The impact on earnings in Santo
Domingo, in particular for women, is also statistically and economically meaningful, of about 30 per
cent. For men the point estimate is similar, but the sample is much smaller and the percentage
difference relative to the control group is also smaller (14 per cent, insignificant).
Finally, we report results from a LATE analysis in Table 7, using random assignment as instrument for
participation. As expected, the coefficients are larger than in the ITT analysis shown in Table 5, by a
factor of close to two (LATE coefficients are the result of dividing the ITT coefficients by the
difference between participation of lottery winners – approximately 87 per cent – and the participation
rate of those who did not win the lottery – about 40 per cent). Statistical significance is largely
unchanged, and the interpretation is that for those that participated in the program due to the lottery, the
impact on formality is substantial. In the case of men, the impact is in the order of 17 percentage
points, representing an increase of 52 per cent over the mean outcome of the control group. This
difference is even stronger in Santo Domingo, representing a 26 percentage point or 70 per cent
increase in formality.11
11 We conducted a series of robustness checks by e.g. re-estimating the regressions including course fixed effects, and controlling for three quality levels of the COS training institutions provided by the Program Coordination Unit. The specifications essentially yield the same results and are available upon request.
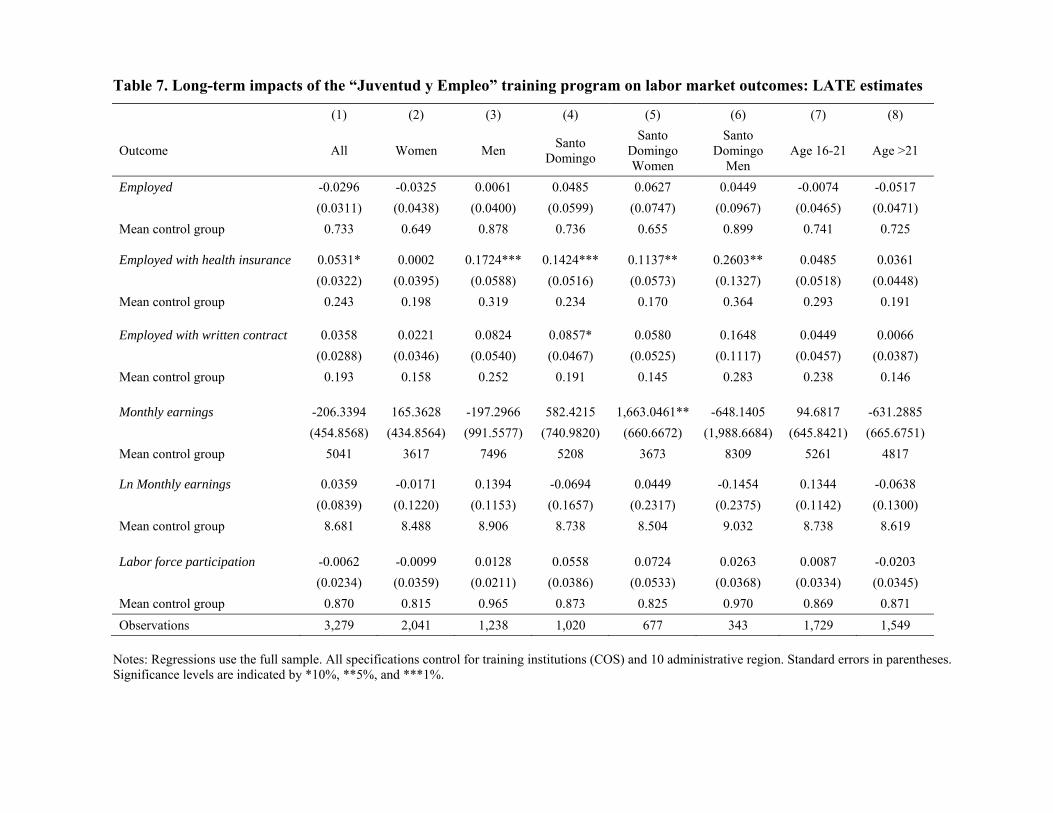
Table 7. Long-term impacts of the “Juventud y Empleo” training program on labor market outcomes: LATE estimates
(1) (2) (3) (4) (5) (6) (7) (8)
Outcome All Women Men Santo Domingo
Santo Domingo Women
Santo Domingo
Men Age 16-21 Age >21
Employed -0.0296 -0.0325 0.0061 0.0485 0.0627 0.0449 -0.0074 -0.0517 (0.0311) (0.0438) (0.0400) (0.0599) (0.0747) (0.0967) (0.0465) (0.0471)
Mean control group 0.733 0.649 0.878 0.736 0.655 0.899 0.741 0.725
Employed with health insurance 0.0531* 0.0002 0.1724*** 0.1424*** 0.1137** 0.2603** 0.0485 0.0361 (0.0322) (0.0395) (0.0588) (0.0516) (0.0573) (0.1327) (0.0518) (0.0448)
Mean control group 0.243 0.198 0.319 0.234 0.170 0.364 0.293 0.191
Employed with written contract 0.0358 0.0221 0.0824 0.0857* 0.0580 0.1648 0.0449 0.0066 (0.0288) (0.0346) (0.0540) (0.0467) (0.0525) (0.1117) (0.0457) (0.0387)
Mean control group 0.193 0.158 0.252 0.191 0.145 0.283 0.238 0.146
Monthly earnings -206.3394 165.3628 -197.2966 582.4215 1,663.0461** -648.1405 94.6817 -631.2885 (454.8568) (434.8564) (991.5577) (740.9820) (660.6672) (1,988.6684) (645.8421) (665.6751)
Mean control group 5041 3617 7496 5208 3673 8309 5261 4817
Ln Monthly earnings 0.0359 -0.0171 0.1394 -0.0694 0.0449 -0.1454 0.1344 -0.0638 (0.0839) (0.1220) (0.1153) (0.1657) (0.2317) (0.2375) (0.1142) (0.1300)
Mean control group 8.681 8.488 8.906 8.738 8.504 9.032 8.738 8.619
Labor force participation -0.0062 -0.0099 0.0128 0.0558 0.0724 0.0263 0.0087 -0.0203 (0.0234) (0.0359) (0.0211) (0.0386) (0.0533) (0.0368) (0.0334) (0.0345)
Mean control group 0.870 0.815 0.965 0.873 0.825 0.970 0.869 0.871 Observations 3,279 2,041 1,238 1,020 677 343 1,729 1,549
Notes: Regressions use the full sample. All specifications control for training institutions (COS) and 10 administrative region. Standard errors in parentheses. Significance levels are indicated by *10%, **5%, and ***1%.

25
Table A2 in the Appendix constructs two versions of a formality index as an outcome: "strong"
formality defined as employment with both health insurance and a written contract, and "weak"
formality as employment with either health insurance or a written contract. The results indicate that,
while outside of Santo Domingo there is no measurable impact on "strong" formality, "weak" formality
is significantly and positively influenced by the program on average and for almost all subgroups.
4.2 Labor market trajectories
The persistent long-term impact of the Juventud y Empleo training program on formality for men is the
most significant and consistent result in all the specifications. The coefficients in Tables 5 through 7
are estimated for the point in time six years after the treatment. In addition to assessing the impacts at
the long-term follow-up, it is of interest to look at the evolution of labor market outcomes over time:
specifically, we can use a set of retrospective questions on labor market status in the short-term and
long-term surveys to construct labor market trajectories on a monthly basis over the full time horizon
(with a very small gap of four months from September to December 2010 not covered by the data due
to the timing of the surveys). For this purpose, we merge the short-term and long-term data to combine
individual trajectories.
We construct these labor market trajectories for the formal employment rate, as this has been identified
as the most relevant outcome in the previous section. Figure 1 depicts the long-term trajectory of
formal employment for men, separately for the treatment and control groups. The figure shows several
patterns. First, the percentage of men that hold formal sector jobs increases over time for both
treatment and controls. It starts at around 5 per cent for both groups before the start of the program, and
increases over the six years to approximately 32 per cent for the control group and 40 per cent for the
treatment group. Second, the trajectories indicate a slight lock-in effect: the treatment group
employment rate is lower than the control group employment rate initially, but the curves soon
intersect once the program is over. Third, from that point in time onward the average monthly
employment rate for men in the treatment group lies always above the average for the control group.
Fourth, this difference is not statistically significant for a substantial time period, but the gap widens
and becomes statistically significant during the last 1 to 1.5 years. This indicates that the initially small

26
gains are consistent and increase over time.
Figure 1. Labor market trajectory: Formal employment rate – ITT men
Notes: The figure depicts monthly averages for treatment and control groups from the time of random assignment until long-term follow-up. Dashed lines correspond to 95% confidence intervals. The labor market trajectories are constructed from merging retrospective information collected in the 2010 and 2014 surveys. Due to the timing of the two surveys, the 4-month-period from September to December 2010 is not covered by the data.
Figures A1 to A6 in the appendix depict corresponding labor market trajectories for several other (sub-)
samples: for the full sample as ITT and ATT; for women; for youths in Santo Domingo; and separately
for the younger age group (<= 21 years of age) and the older age group (>21 years of age). Overall, the
figures strengthen several of the patterns seen in Figure 1: First, a continuously increasing trend in
employment rates over time for all (sub-) samples, in both treatment and control groups. Second, a
lock-in effect during the year 2008, such that the treatment group trajectory typically crosses the
0
0.05
0.1
0.15
0.2
0.25
0.3
0.35
0.4
0.45
Mean Treatment Mean Control

27
control group trajectory during the year 2009. Third, for the years three to six after treatment in all
(sub-) samples the treatment group has a consistently higher employment rate than the control group –
a rather pronounced pattern, despite the fact that the confidence intervals indicate that the difference is
often not statistically significant. However, fourth, in several of the graphs the treatment-control
difference does become significantly positive during the last 1 to 1.5 years prior to the long-term
follow-up. Overall, this suggests that program gains do develop over time and do persist.
4.3 Local labor market context
Local labor market conditions may play a role in determining labor market outcomes and also the
effectiveness of labor market interventions, as is the case e.g. for Job Corps in the US (Flores-Lagunes
et al. 2010). In the main specifications (Tables 5 to 7, also Figure A4) we find that it is particularly
youths in Santo Domingo, the capital, that benefit from participation in Juventud y Empleo. We
investigate the role of local labor market further by looking at results by the three Dominican macro-
regions, “Cibao” (North), “Sur” (South), and “Este” (East), where the latter excludes Santo Domingo.
The corresponding regression results are reported in Tables A3 to A5 in the appendix.
In general, the results are not very strong, but do show some coarse pattern by macro-region. First, the
North is the region for which we find significantly negative impacts on overall employment and labor
force participation, driven by the results for the young women in the sample. For women themselves,
also the impact on monthly earnings is significantly negative. At the same time, the North is the one
region with a significantly higher rate of youths being in education: the overall average probability to
report “currently being studying” is 6.2 percentage points or 11.1 per cent higher in the North (base
probability 54.8 per cent, numbers not reported in the table). This pattern would be in line with the
lower level of labor market outcomes, in particular for the labor force participation rate. Since marriage
rates or number of children are not significantly different between regions, these are unlikely to be key
explaining factors.
Looking at the South, almost all estimated coefficients are not significantly different from zero, the sole
exception being a positive impact on formality for males. Different from the results for North and

28
South, the regressions for the East do show the main impacts we saw for the overall sample on
formality (Table A2), driven mainly by the male population. One might argue that these results for the
East are in line with the positive findings for the Santo Domingo subpopulation, in a way that also the
region surrounding the capital benefits more strongly than other parts of the country. This may have to
do mostly with the fact that the capital is characterized by the most dynamic labor market of the
country, such that a skills training program may be more beneficial in a context where these skills are
actually in demand.
5 Conclusions
Experimental evidence on long-term impacts of (youth) training programs had not been produced
outside the US until now, and the large-scale experiments in the US date back two decades. This lack
of rigorous evidence on such an important policy question – the longer-term effectiveness of human
capital interventions for disadvantaged youths – is surprising. Together with a parallel study for
Colombia (Attanasio et al. 2015), this paper contributes to closing this knowledge gap.
The evidence from the earlier experimental US studies points to long-run impacts that are small
positive at best, but generally tend to be close to zero. In the case of Job Corps, a comprehensive
intervention for the most disadvantaged youths, positive medium-run impacts on earnings do not seem
to be sustained in the longer run. Against the background that some of these programs are
comparatively intensive (and costly), these are certainly not encouraging results for the conception and
design of youth training programs.
In the case of this new experimental long-term impact evaluation, we find a series of interesting results:
because of the program, young men seem to have a better start of their careers, in the formal sector, and
urban women improve their earnings. Specifically, our results show that there is a statistically
significant long-run impact on the formality of employment for men (as measured by jobs with health
insurance benefits, and a "weak formality index") participating in the Juventud y Empleo program.
This effect of the Juventud y Empleo program was previously reported in the short-run evaluations, and

29
it is important to see that this impact is sustained over a long time horizon. Moreover, the long-term
labor market trajectories we construct suggest that the effect is growing over time. Such lasting impacts
in the quality of employment can make an important difference in the employment experience of young
people and their lifetime labor market trajectories.
Second, the ITT and ATT estimates also provide evidence of sustained earnings impacts for female
youths in the country’s most important urban labor market, Santo Domingo. This, together with the
impacts on formality for males, suggests that the returns to skills investments may be particularly
relevant in the context of a more dynamic labor market where the demand for these skills is higher. The
East region surrounding the capital also seems to benefit from this local labor market context (although
to a lesser extent), whereas for the other two macro-regions North and South this does not seem to be
the case.
Finally, for the full sample, the long-term impacts on labor earnings and overall employment
probability are frequently close to zero in size and not statistically significant, which is compatible with
the US studies. This result also has to be seen against the background that the total skills investment
implied by the program is not very large compared to training programs in developed countries.
Overall we interpret our results as indicating that training programs for disadvantaged youth can have
positive long-term outcomes: the Juventud y Empleo training improves formality in a context of high
informality; and it seems to increase earnings in that part of the labor market in the Dominican
Republic that is comparatively dynamic and where actual demand for skills exists. It is important to
highlight the fact that a program of this kind has impacts on formality: given the high rate of
informality of young people in LAC, impacts on the probability of being formally employed may
change the path on which young people start their careers and can have lifelong impacts.
These findings are relevant for a much broader set of countries, since a multitude of economies
worldwide face similar types of labor markets, and challenges for youths. Moreover, the training
offered here, while not as comprehensive as the very intensive – and costly – interventions analyzed in
previous research on long-term impacts (e.g. Job Corps in the US) does combine a sizeable investment

30
in both classroom and on-the-job training, and is thus comparable and similar to many youth
interventions that are used across countries. Moreover, additional external validity comes from the fact
that this is not a pilot intervention or pilot evaluation, but a rigorous long-term study on an active labor
market program that is part of the set of public policies offered in a developing country to improve
labor market opportunities for youth.

31
References
Attanasio, O., A. Kugler and C. Meghir (2011), Subsidizing Vocational Training for Disadvantaged
Youth in Colombia: Evidence from a Randomized Trial", American Economic Journal: Applied
Economics 3, 188-220.
Attanasio, O., A. Guarin, C. Medina, and C. Meghir (2015), Long term impacts of vouchers for
vocational training: experimental evidence for Colombia", University College London.
Betcherman, G., K. Olivas and A. Dar (2004), Impacts of Active Labor Market Programs: New
Evidence from Evaluations with Particular Attention to Developing and Transition Countries, Social
Protection Discussion Paper Series 0402, Washington, D.C.: World Bank.
Bloom, H.S., L.L. Orr, S.H. Bell, G. Cave, F. Doolittle, W. Lin and J.M. Bos (1997), The Benefits and
Costs of JTPA Title II-A Programs – Key findings from the National Job Training Partnership Act
Study, Journal of Human Resources 32, 549-576.
Card, D., P. Ibarraran, F. Regalia, D. Rosas-Shady and Y. Soares (2011), The labor market impacts of
youth training in the Dominican Republic, Journal of Labor Economics 29, 267-300.
Card, D., J. Kluve and A. Weber (2010), Active Labour Market Policy Evaluations: A Meta-analysis,
The Economic Journal 120, F452-F477.
Card, D., J. Kluve and A. Weber (2015), What Works? A Meta Analysis of Recent Active Labor
Market Program Evaluations, NBER Working Paper 21431.
Cave, G., H. Bos, F. Doolittle and C. Toussaint (1993), JOBSTART: Final Report on a Program for
School Dropouts, Manpower Demonstration Research Corporation MDRC.

32
Couch, K.A. (1992), New Evidence on the Long-Term Effects of Employment Training Programs,
Journal of Labor Economics 10, 380-388.
Fitzenberger, B. and R. Völter (2007), Long-run effects of training programs for the unemployed in
East Germany, Labour Economics 14, 730-755.
Flores-Lagunes, A., A. Gonzalez and T. Neumann (2010), Learning but not earning? The impact of Job
Corps training on Hispanic youth, Economic Inquiry 48, 651-667.
Gonzalez, C., L. Ripani and D. Rosas (2012), Mejorando las Oportunidades de Inserción Laboral de
Jóvenes en América Latina, BID Nota Técnica, Washington, DC.
Greenberg, D.H., C. Michalopoulos and P.K.Robins (2003), A Meta-Analysis of Government-
Sponsored Training Programs, Industrial and Labor Relations Review 57, 31-53.
Heckman, J.J., R.J. LaLonde and J.A. Smith (1999), The economics and econometrics of active labour
market programs, in Ashenfelter, O. and D. Card (eds.), Handbook of Labor Economics 3, Elsevier,
Amsterdam.
Hirshleifer, S., D. McKenzie, R. Almeida, C. Ridao-Cano (2014), The Impact of Vocational Training
for the Unemployed: Experimental Evidence from Turkey, IZA Discussion Paper 8059.
Hotz, V.J., G.W. Imbens and J.A. Klerman (2006), Evaluating the Differential Effects of Alternative
Welfare-to-Work Training Components: A Reanalysis of the California GAIN program, Journal of
Labor Economics 24, 521-566.
Ibarrarán, P., L. Ripani, B. Taboada, J.M. Villa and B. Garcia (2014), Life skills, employability and
training for disadvantaged youth: Evidence from a randomized evaluation design, IZA Journal of Labor
and Development 3, 1-24.
33
Ibarrarán, P. and D. Rosas (2009), Evaluating the impact of Job Training Programs in Latin America:
evidence from IDB funded operations, Journal of Development Effectiveness 2, 195-216.
ILO (2014), Global Employment Trends: Risk of a jobless recovery? International Labour Office.
Geneva.
Kluve, J. (2010), The effectiveness of European active labor market programs, Labour Economics 17,
904-918.
Lechner, M., R. Miquel and C. Wunsch (2011), Long-run effects of public sector sponsored training in
West Germany, Journal of the European Economic Association 9, 742-784.
Oficina Nacional de Estadística (ONE) (2008), Madres Adolescentes en República Dominicana, Santo
Domingo: Dominican Republic.
Osikominu, A. (2012), Quick Job Entry or Long-Term Human Capital Development? The Dynamic
Effects of Alternative Training Schemes, The Review of Economic Studies 80, 313-342.
Rosenberg, M. (1989), Society and the Adolescent Self-Image. Revised Edition, Middletown, C.T.
Wesleyan University Press.
Schochet, P.Z., J. Burghardt and S. McConnell (2008), Does Job Corps Work? Impact Findings from
the National Job Corps Study, American Economic Review 98, 1864-1886.
Urzúa, S. and E. Puentes (2010), La evidencia del impacto de los programas de capacitación en el
desempeño en el mercado laboral, Banco Interamericano de Desarrollo – Unidad de Mercados
Laborales del Sector Social, Notas Técnicas #268, BID: Washington, DC.

34
Appendix
Figure A1. Labor market trajectory: Formal employment rate – ITT full sample
Notes: See notes to Figure 1.
Figure A2. Labor market trajectory: Formal employment rate – ATT full sample
Notes: See notes to Figure 1.
0
0.05
0.1
0.15
0.2
0.25
0.3
0.35
0.4
Mean Treatment Mean Control
0
0.05
0.1
0.15
0.2
0.25
0.3
0.35
0.4
Mean Treatment Mean Control

35
Figure A3. Labor market trajectory: Formal employment rate – ITT women
Notes: See notes to Figure 1.
Figure A4. Labor market trajectory: Formal employment rate – ITT Santo Domingo
Notes: See notes to Figure 1.
0
0.05
0.1
0.15
0.2
0.25
0.3
0.35
0.4
Mean Treatment Mean Control
0
0.05
0.1
0.15
0.2
0.25
0.3
0.35
0.4
Mean Treatment Mean Control

36
Figure A5. Labor market trajectory: Formal employment rate – ITT age group <=21 years
Notes: See notes to Figure 1.
Figure A6. Labor market trajectory: Formal employment rate – ITT age group > 21 years
Notes: See notes to Figure 1.
0
0.05
0.1
0.15
0.2
0.25
0.3
0.35
0.4
Mean Treatment Mean Control
0
0.05
0.1
0.15
0.2
0.25
0.3
0.35
0.4
Mean Treatment Mean Control
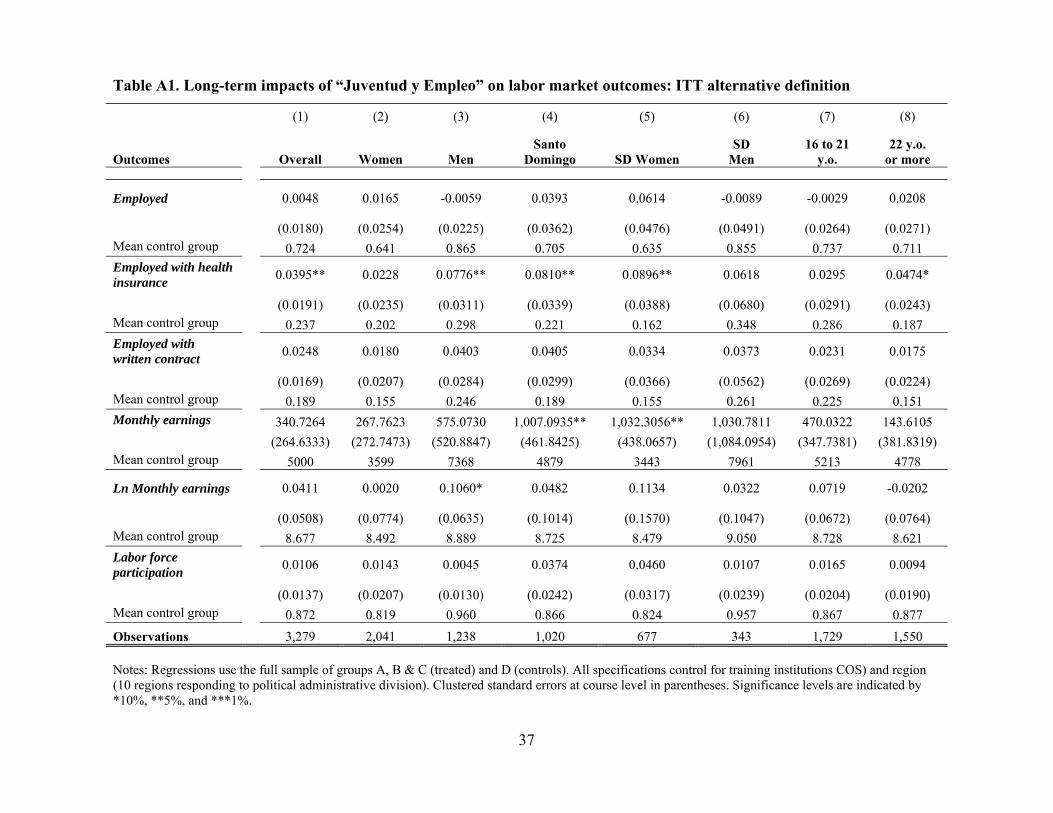
37
Table A1. Long-term impacts of “Juventud y Empleo” on labor market outcomes: ITT alternative definition
(1) (2) (3) (4) (5) (6) (7) (8)
Outcomes Overall Women Men Santo
Domingo SD Women SD
Men 16 to 21
y.o. 22 y.o.
or more
Employed 0.0048 0.0165 -0.0059 0.0393 0.0614 -0.0089 -0.0029 0.0208
(0.0180) (0.0254) (0.0225) (0.0362) (0.0476) (0.0491) (0.0264) (0.0271) Mean control group 0.724 0.641 0.865 0.705 0.635 0.855 0.737 0.711 Employed with health insurance 0.0395** 0.0228 0.0776** 0.0810** 0.0896** 0.0618 0.0295 0.0474*
(0.0191) (0.0235) (0.0311) (0.0339) (0.0388) (0.0680) (0.0291) (0.0243) Mean control group 0.237 0.202 0.298 0.221 0.162 0.348 0.286 0.187 Employed with written contract 0.0248 0.0180 0.0403 0.0405 0.0334 0.0373 0.0231 0.0175
(0.0169) (0.0207) (0.0284) (0.0299) (0.0366) (0.0562) (0.0269) (0.0224) Mean control group 0.189 0.155 0.246 0.189 0.155 0.261 0.225 0.151 Monthly earnings 340.7264 267.7623 575.0730 1,007.0935** 1,032.3056** 1,030.7811 470.0322 143.6105
(264.6333) (272.7473) (520.8847) (461.8425) (438.0657) (1,084.0954) (347.7381) (381.8319) Mean control group 5000 3599 7368 4879 3443 7961 5213 4778
Ln Monthly earnings 0.0411 0.0020 0.1060* 0.0482 0.1134 0.0322 0.0719 -0.0202
(0.0508) (0.0774) (0.0635) (0.1014) (0.1570) (0.1047) (0.0672) (0.0764) Mean control group 8.677 8.492 8.889 8.725 8.479 9.050 8.728 8.621 Labor force participation 0.0106 0.0143 0.0045 0.0374 0.0460 0.0107 0.0165 0.0094
(0.0137) (0.0207) (0.0130) (0.0242) (0.0317) (0.0239) (0.0204) (0.0190) Mean control group 0.872 0.819 0.960 0.866 0.824 0.957 0.867 0.877 Observations 3,279 2,041 1,238 1,020 677 343 1,729 1,550
Notes: Regressions use the full sample of groups A, B & C (treated) and D (controls). All specifications control for training institutions COS) and region (10 regions responding to political administrative division). Clustered standard errors at course level in parentheses. Significance levels are indicated by *10%, **5%, and ***1%.

38
Table A2. Long-term impacts of “Juventud y Empleo”: ITT for "strong" and "weak" formality index
(1) (2) (3) (4) (5) (6) (7) (8)
Outcomes Overall Women Men Santo
Domingo SD
Women SD
Men 16 to 21
y.o. 22 y.o.
or more
Strong Formality index 0.0100 -0.0001 0.0362 0.0442* 0.0328 0.0824 -0.0004 0.0135
(Having both Health insurance & Written Contract) (0.0134) (0.0164) (0.0259) (0.0228) (0.0271) (0.0521) (0.0212) (0.0190) Mean control group 0.174 0.138 0.230 0.164 0.129 0.231 0.210 0.134
Weak Formality index 0.0330** 0.0112 0.0824*** 0.0731** 0.0615* 0.1096* 0.0444* 0.0104
(Either Health insurance or Written Contract) (0.0163) (0.0208) (0.0275) (0.0298) (0.0352) (0.0615) (0.0254) (0.0230) Mean dep. var for control group 0.280 0.245 0.337 0.272 0.227 0.359 0.317 0.240 Notes: Regressions use the full sample of groups A and B (treated) vs. C and D (controls). All specifications control for training institutions COS) and region (10 regions responding to political administrative division). Clustered standard errors at course level in parentheses. Significance levels are indicated by *10%, **5%, and ***1%.
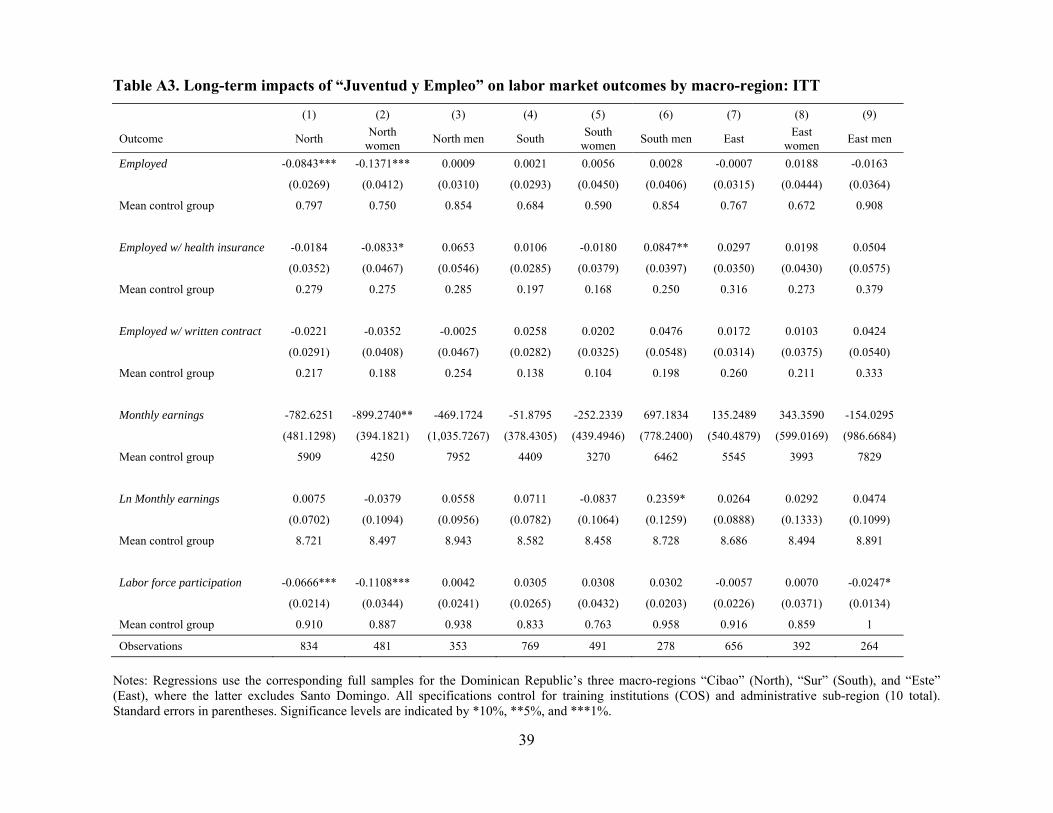
39
Table A3. Long-term impacts of “Juventud y Empleo” on labor market outcomes by macro-region: ITT
(1) (2) (3) (4) (5) (6) (7) (8) (9)
Outcome North North women North men South South
women South men East East women East men
Employed -0.0843*** -0.1371*** 0.0009 0.0021 0.0056 0.0028 -0.0007 0.0188 -0.0163
(0.0269) (0.0412) (0.0310) (0.0293) (0.0450) (0.0406) (0.0315) (0.0444) (0.0364)
Mean control group 0.797 0.750 0.854 0.684 0.590 0.854 0.767 0.672 0.908
Employed w/ health insurance -0.0184 -0.0833* 0.0653 0.0106 -0.0180 0.0847** 0.0297 0.0198 0.0504
(0.0352) (0.0467) (0.0546) (0.0285) (0.0379) (0.0397) (0.0350) (0.0430) (0.0575)
Mean control group 0.279 0.275 0.285 0.197 0.168 0.250 0.316 0.273 0.379
Employed w/ written contract -0.0221 -0.0352 -0.0025 0.0258 0.0202 0.0476 0.0172 0.0103 0.0424
(0.0291) (0.0408) (0.0467) (0.0282) (0.0325) (0.0548) (0.0314) (0.0375) (0.0540)
Mean control group 0.217 0.188 0.254 0.138 0.104 0.198 0.260 0.211 0.333
Monthly earnings -782.6251 -899.2740** -469.1724 -51.8795 -252.2339 697.1834 135.2489 343.3590 -154.0295
(481.1298) (394.1821) (1,035.7267) (378.4305) (439.4946) (778.2400) (540.4879) (599.0169) (986.6684)
Mean control group 5909 4250 7952 4409 3270 6462 5545 3993 7829
Ln Monthly earnings 0.0075 -0.0379 0.0558 0.0711 -0.0837 0.2359* 0.0264 0.0292 0.0474
(0.0702) (0.1094) (0.0956) (0.0782) (0.1064) (0.1259) (0.0888) (0.1333) (0.1099)
Mean control group 8.721 8.497 8.943 8.582 8.458 8.728 8.686 8.494 8.891
Labor force participation -0.0666*** -0.1108*** 0.0042 0.0305 0.0308 0.0302 -0.0057 0.0070 -0.0247*
(0.0214) (0.0344) (0.0241) (0.0265) (0.0432) (0.0203) (0.0226) (0.0371) (0.0134)
Mean control group 0.910 0.887 0.938 0.833 0.763 0.958 0.916 0.859 1
Observations 834 481 353 769 491 278 656 392 264 Notes: Regressions use the corresponding full samples for the Dominican Republic’s three macro-regions “Cibao” (North), “Sur” (South), and “Este” (East), where the latter excludes Santo Domingo. All specifications control for training institutions (COS) and administrative sub-region (10 total). Standard errors in parentheses. Significance levels are indicated by *10%, **5%, and ***1%.
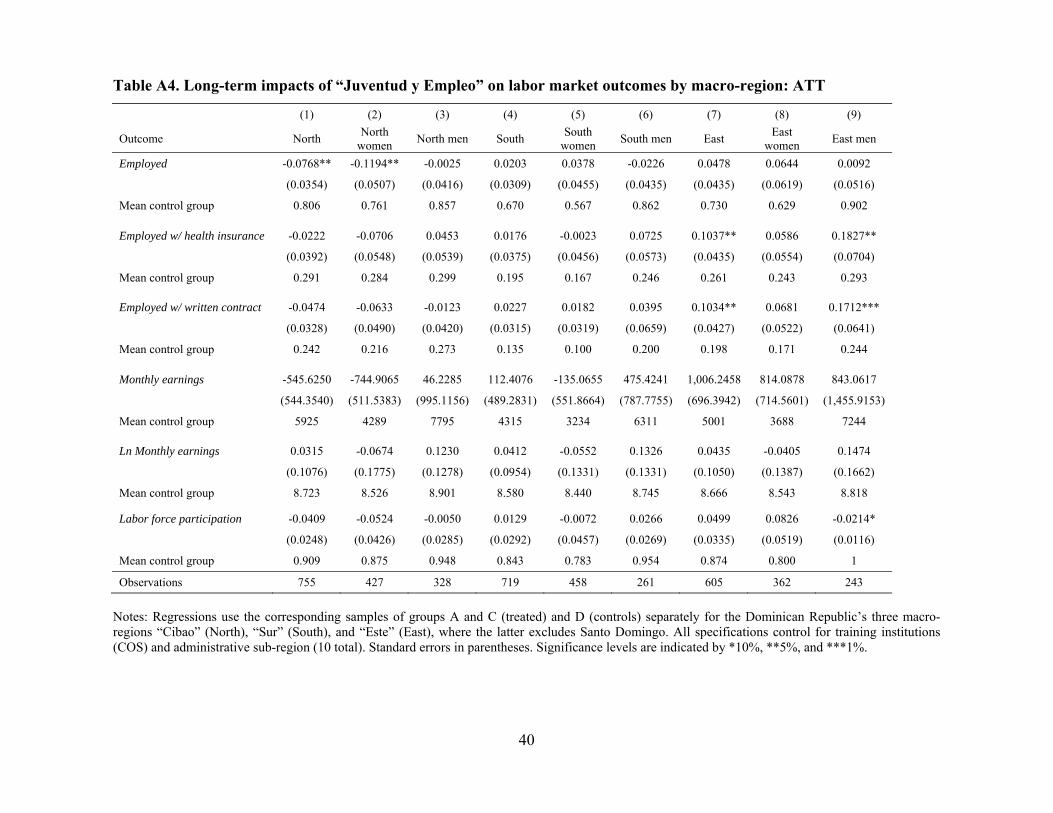
40
Table A4. Long-term impacts of “Juventud y Empleo” on labor market outcomes by macro-region: ATT
(1) (2) (3) (4) (5) (6) (7) (8) (9)
Outcome North North women North men South South
women South men East East women East men
Employed -0.0768** -0.1194** -0.0025 0.0203 0.0378 -0.0226 0.0478 0.0644 0.0092
(0.0354) (0.0507) (0.0416) (0.0309) (0.0455) (0.0435) (0.0435) (0.0619) (0.0516)
Mean control group 0.806 0.761 0.857 0.670 0.567 0.862 0.730 0.629 0.902
Employed w/ health insurance -0.0222 -0.0706 0.0453 0.0176 -0.0023 0.0725 0.1037** 0.0586 0.1827**
(0.0392) (0.0548) (0.0539) (0.0375) (0.0456) (0.0573) (0.0435) (0.0554) (0.0704)
Mean control group 0.291 0.284 0.299 0.195 0.167 0.246 0.261 0.243 0.293
Employed w/ written contract -0.0474 -0.0633 -0.0123 0.0227 0.0182 0.0395 0.1034** 0.0681 0.1712***
(0.0328) (0.0490) (0.0420) (0.0315) (0.0319) (0.0659) (0.0427) (0.0522) (0.0641)
Mean control group 0.242 0.216 0.273 0.135 0.100 0.200 0.198 0.171 0.244
Monthly earnings -545.6250 -744.9065 46.2285 112.4076 -135.0655 475.4241 1,006.2458 814.0878 843.0617
(544.3540) (511.5383) (995.1156) (489.2831) (551.8664) (787.7755) (696.3942) (714.5601) (1,455.9153)
Mean control group 5925 4289 7795 4315 3234 6311 5001 3688 7244
Ln Monthly earnings 0.0315 -0.0674 0.1230 0.0412 -0.0552 0.1326 0.0435 -0.0405 0.1474
(0.1076) (0.1775) (0.1278) (0.0954) (0.1331) (0.1331) (0.1050) (0.1387) (0.1662)
Mean control group 8.723 8.526 8.901 8.580 8.440 8.745 8.666 8.543 8.818
Labor force participation -0.0409 -0.0524 -0.0050 0.0129 -0.0072 0.0266 0.0499 0.0826 -0.0214*
(0.0248) (0.0426) (0.0285) (0.0292) (0.0457) (0.0269) (0.0335) (0.0519) (0.0116)
Mean control group 0.909 0.875 0.948 0.843 0.783 0.954 0.874 0.800 1
Observations 755 427 328 719 458 261 605 362 243 Notes: Regressions use the corresponding samples of groups A and C (treated) and D (controls) separately for the Dominican Republic’s three macro-regions “Cibao” (North), “Sur” (South), and “Este” (East), where the latter excludes Santo Domingo. All specifications control for training institutions (COS) and administrative sub-region (10 total). Standard errors in parentheses. Significance levels are indicated by *10%, **5%, and ***1%.

41
Table A5. Long-term impacts of “Juventud y Empleo” on labor market outcomes by macro-region: LATE estimates
(1) (2) (3) (4) (5) (6) (7) (8) (9)
Outcome North North women North men South South women South men East East women East men
Employed -0.2036*** -0.3720*** 0.0019 0.0035 0.0094 0.0048 -0.0018 0.0431 -0.0472
(0.0645) (0.1113) (0.0645) (0.0000) (0.0000) (0.0667) (0.0767) (0.0987) (0.1016)
Mean control group 0.787 0.739 0.853 0.681 0.575 0.878 0.722 0.620 0.887
Employed w/ health insurance -0.0444 -0.2259* 0.1398 0.0183 -0.0303 0.1460** 0.0740 0.0453 0.1457
(0.0826) (0.1204) (0.1178) (0.0000) (0.0000) (0.0645) (0.0850) (0.0938) (0.1614)
Mean control group 0.270 0.246 0.304 0.196 0.157 0.268 0.284 0.250 0.339
Employed w/ written contract -0.0534 -0.0956 -0.0055 0.0444 0.0340 0.0820 0.0429 0.0235 0.1226
(0.0675) (0.1041) (0.0970) (0.0000) (0.0000) (0.0880) (0.0768) (0.0826) (0.1536)
Mean control group 0.225 0.204 0.255 0.149 0.118 0.207 0.210 0.180 0.258
Monthly earnings -1,890.6513* -2,439.5573** -1,003.9579 -89.2155 -424.7839 1,201.4129 337.1953 785.6898 -444.9637
(1,137.6799) (1,018.7876) (2,157.1896) (0.0000) (0.0000) (1,328.6650) (1,318.1609) (1,328.5032) (2,712.5867)
Mean control group 5592 4066 7717 4348 3129 6622 4906 3615 6989
Ln Monthly earnings 0.0181 -0.1092 0.1167 0.1263 -0.1463 0.4270* 0.0684 0.0655 0.1453
(0.1654) (0.0000) (0.1943) (0.0000) (0.0000) (0.2428) (0.2229) (0.2839) (0.3200)
Mean control group 8.708 8.501 8.937 8.576 8.409 8.769 8.676 8.546 8.828
Labor force participation -0.1610*** -0.3007*** 0.0090 0.0525 0.0518 0.0520 -0.0143 0.0161 -0.0715**
(0.0535) (0.0987) (0.0503) (0.0000) (0.0000) (0.0334) (0.0548) (0.0818) (0.0364)
Mean control group 0.889 0.852 0.941 0.847 0.784 0.963 0.870 0.790 1
Observations 834 481 353 769 491 278 656 392 264 Notes: Regressions use the corresponding full samples for the Dominican Republic’s three macro-regions “Cibao” (North), “Sur” (South), and “Este” (East), where the latter excludes Santo Domingo. All specifications control for training institutions (COS) and administrative sub-region (10 total). Standard errors in parentheses. Significance levels are indicated by *10%, **5%, and ***1%.