Experimental Evaluation of Design Procedures for Shear ...
10
ACI STRUCTURAL JOURNAL TECHNICAL PAPER Title no. 99-856 Experimental Evaluation of Design Procedures for Shear Strength of Deep Reinforced Concrete Beams by Gerardo Aguilar, Adolfo B. Matamoros, Gustavo J. Parra-Montesinos, Julio A. Ramirez, and James K. Wight In this paper; results from the monotonic testing of four reinforced concret e deep beams are presented. The behavior of the deep beams is described in te rms of c racking pattern, load-versus-de flection response, failure mode, and strains in steel reinforcement and concrete. Despite different f ailure modes, the failure Loads and corresponding ultimate deflections were similar in all four specimens. Yielding of both Longi- tudinal and transverse reinforcement occurred prior to failure. Based on the test results, the shear design procedures contained in the AC/ 31 8-99 Code and Appendix A of the AC/ 318-02 Code were evaluated. Both design procedures yielded conservative pre- dictions of the shear strength of the single-span deep beams. Keywords: beam; reinforced concrete; shear strength; strut; test. INTRODUCTION In this study, an evaluation was conducted of the behavior and strength of deep reinforced concrete beams based on re- sults from the monotonic test of four beam specimens. The test specimens were designed with two different approaches, which consisted of: 1) the procedure described in Sections 10.7 and 11.8 of the ACI 318-99 Code (ACI Committee 318 1999); and 2) the Strut-and-Tie Method given in Appendix A of the ACI 318-02 Building Code (Cagley 2001), which is intended to replace the procedure given in Section 11.8 of the ACI 318-99 Code. The behavior of the deep beams is de- scribed in terms of cracking pattern, load-versus-deflection response, reinforcement and concrete strains, failure load, and failure mode. The experimental failure load of each spec- imen is compared with the load capacities calculated using the procedures given in the ACI 318-99 Code, and Appendix A of the ACI 318-02 Building Code. RESEARCH SIGNIFICANCE This paper presents experimental evidence that supports the use of the design procedures contained in Appendix A of the ACI 318-02 Code in reinforced concrete deep beams. BACKGROUND Over the past several decades, new approaches to the shear design of structural concrete have been implemented in codes of practice (Joint ACI-ASCE Committee 445 1998). One such procedure, the Strut-and-Tie Method (Schlaich, Schafer, and Jennewein 1987), has already been incorporated into the AASHTO-LRFD Bridge Specifications and several international model codes (JointACI-ASCECommittee4451998). Thestrut- and-tie model (STM) procedure is widely used in the design of regions where the distribution of longitudinal strains is nonlinear, such as deep beams, beams with large operungs, corbels, and <lapped-end beams. Furthermore, the STM approach provides a unified framework for the extension of the ACI Code provisions to members and regions of members ACI Structural Journal/July-August 2002 not adequately covered by the existing code requirements, such as beams with large openings and beams loaded in the tension flange, amongst others. SCOPE The Reinforced Concrete Research Council (RCRC) sup- ported this research to investigate and compare the behavior and strength of deep flexural members designed using Appendix A of the ACI 318-02 Building Code to that of members designed with the ACI 318-99 procedure in Section 11. 8. In this paper, a summary of the experimental work conducted as part of this research project is presented. A complete set of the experimental data is available elsewhere (Aguilar et al. 2002). ACI 318-99 DEEP BEAM DESIGN According to Section 11.8 of the ACI 318-99 Code, the sectional shear strength for deep flexural members is calcu- lated by adding the contributions from the concrete and the distributed vertical and horizontal reinforcement. There are various expressions and limits for both the concrete and the steel contributions. The concrete contribution can be com- puted by using either Eq. (1) or Eq. (2) (1) 2Ji/bwd (psi) (Eq. (11-28), ACI 318-99 Code) (2) v = c where ( Mu)( [ii Vud) 3.5 - 2.5- 1.9 ,jfc + 2500pw- b wd Vud Mu less than 6 Ji: b wd (psi) (Eq. (11-29), ACI 318-99 Code) 3.5 -2.5(Mu)ICVud) is to be kept less than or equal to 2.5; and Jc' = specified compressive strength of concrete, psi; bw web width, in.; d effective depth (distance from extreme compression fiber to centroid of longitudinal tension reinforce- ment), in.; Vu factored shear force at the critical section, lb; Mu = factored moment occurring simultaneously with Vu at the critical section, in.-lb. Critical section is located AC/ Structural Journal , V. 99, No. 4, July-August 2002. . MS N?'.02-070 September 25, 2001, and reviewed under Institute publica- P?hc1es. Cop.ynght © American Concrete Institute. All rights reserved, the. of copies unless permission is obtained from the copyright pro- pnetors " Pertinent di scussion will be published in the May-June 2003 AC/ Structural Journal 1f received by January I, 2003. 539
Transcript of Experimental Evaluation of Design Procedures for Shear ...

ACI STRUCTURAL JOURNAL TECHNICAL PAPER Title no. 99-856
Experimental Evaluation of Design Procedures for Shear Strength of Deep Reinforced Concrete Beams by Gerardo Aguilar, Adolfo B. Matamoros, Gustavo J. Parra-Montesinos, Julio A. Ramirez, and James K. Wight
In this paper; results from the monotonic testing of four reinforced concrete deep beams are presented. The behavior of the deep beams is described in terms of cracking pattern, load-versus-deflection response, failure mode, and strains in steel reinforcement and concrete. Despite different f ailure modes, the failure Loads and corresponding ultimate deflections were similar in all four specimens. Yielding of both Longi-tudinal and transverse reinforcement occurred prior to failure. Based on the test results, the shear design procedures contained in the AC/ 318-99 Code and Appendix A of the AC/ 318-02 Code were evaluated. Both design procedures yielded conservative pre-dictions of the shear strength of the single-span deep beams.
Keywords: beam; reinforced concrete; shear strength; strut; test.
INTRODUCTION In this study, an evaluation was conducted of the behavior
and strength of deep reinforced concrete beams based on re-sults from the monotonic test of four beam specimens. The test specimens were designed with two different approaches, which consisted of: 1) the procedure described in Sections 10.7 and 11.8 of the ACI 318-99 Code (ACI Committee 318 1999); and 2) the Strut-and-Tie Method given in Appendix A of the ACI 318-02 Building Code (Cagley 2001), which is intended to replace the procedure given in Section 11.8 of the ACI 318-99 Code. The behavior of the deep beams is de-scribed in terms of cracking pattern, load-versus-deflection response, reinforcement and concrete strains, failure load, and failure mode. The experimental failure load of each spec-imen is compared with the load capacities calculated using the procedures given in the ACI 318-99 Code, and Appendix A of the ACI 318-02 Building Code.
RESEARCH SIGNIFICANCE This paper presents experimental evidence that supports
the use of the design procedures contained in Appendix A of the ACI 318-02 Code in reinforced concrete deep beams.
BACKGROUND Over the past several decades, new approaches to the shear
design of structural concrete have been implemented in codes of practice (Joint ACI-ASCE Committee 445 1998). One such procedure, the Strut-and-Tie Method (Schlaich, Schafer, and Jennewein 1987), has already been incorporated into the AASHTO-LRFD Bridge Specifications and several international model codes (JointACI-ASCECommittee4451998). Thestrut-and-tie model (STM) procedure is widely used in the design of c?n~rete regions where the distribution of longitudinal strains is si~cantly nonlinear, such as deep beams, beams with large operungs, corbels, and <lapped-end beams. Furthermore, the STM approach provides a unified framework for the extension of the ACI Code provisions to members and regions of members
ACI Structural Journal/July-August 2002
not adequately covered by the existing code requirements, such as beams with large openings and beams loaded in the tension flange, amongst others.
SCOPE The Reinforced Concrete Research Council (RCRC) sup-
ported this research to investigate and compare the behavior and strength of deep flexural members designed using Appendix A of the ACI 318-02 Building Code to that of members designed with the A CI 318-99 procedure in Section 11. 8.
In this paper, a summary of the experimental work conducted as part of this research project is presented. A complete set of the experimental data is available elsewhere (Aguilar et al. 2002).
ACI 318-99 DEEP BEAM DESIGN According to Section 11.8 of the ACI 318-99 Code, the
sectional shear strength for deep flexural members is calcu-lated by adding the contributions from the concrete and the distributed vertical and horizontal reinforcement. There are various expressions and limits for both the concrete and the steel contributions. The concrete contribution can be com-puted by using either Eq. (1) or Eq. (2) (1)
2Ji/bwd (psi)
(Eq. (11-28), ACI 318-99 Code) (2)
v = c
where
( Mu)( [ii Vud) 3.5 - 2.5- 1.9 ,jfc + 2500pw- b wd Vud Mu
less than 6 Ji: b wd (psi)
(Eq. (11-29), ACI 318-99 Code)
3.5 -2.5(Mu)ICVud) is to be kept less than or equal to 2.5; and Jc' = specified compressive strength of concrete, psi; bw web width, in.; d effective depth (distance from extreme compression
fiber to centroid of longitudinal tension reinforce-ment), in.;
Vu factored shear force at the critical section, lb; Mu = factored moment occurring simultaneously with Vu at
the critical section, in.-lb. Critical section is located
AC/ Structural Journal, V. 99, No. 4 , July-August 2002. . MS N?'.02-070 re~eived September 25, 2001, and reviewed under Institute publica-~1on P?hc1es. Cop.ynght © ~002, American Concrete Institute. All rights reserved, m~ludmg the. makin~ of copies unless permission is obtained from the copyright pro-pnetors" Pertinent discussion will be published in the May-June 2003 AC/ Structural Journal 1f received by January I, 2003.
539
Gerardo Aguilar is a PhD student in structural engineering at Purdue University, West Lafayette, Ind. His research interests include shear response and seismic behavior of reinforced concrete structures.
AC/ member Adolfo B. Matamoros is an assistant professor of structures in the Department of Civil Engineering at the University of Kansas, Lawrence, Kans. He received his PhD from the University of //linois at Urbana. He is Secretary of AC/ Committee 408, Bond and Development of Reinforcement.
AC/ member Gustavo J. Parra-Montesinos is an assistant professor at the University of Michigan, Ann Arbor, Mich., from which he received his PhD in 2000. He is a mem-ber of AC/ Committee 335, Composite and Hybrid Structures. His research interests include the seismic behavior and rehabilitation of reinforced concrete and hybrid steel-concrete structures.
Julio A. Ramirez, FAC/, is a professor and Assistant Head for Graduate Programs at the School of Civil Engineering, Purdue University. He is a member of AC! Committees 318, Structural Concrete Building Code; and 408, Bond and Development of Reinforce-ment; Joint ACl-ASCE Committees 423, Prestressed Concrete; and 445, Shear and Torsion; and the Technical Activities Committee. He received ACl's Delmar L. Bloem Award for Distinguished Service in 2000.
James K. Wight, FACI, is a professor of civil engineering at the University of Michigan. He is Chair of AC/ Committee 318, Structural Concrete Building Code; and a member of Joint ACI-ASCE Committees 352, Joints and Connections in Monolithic Concrete Structures; and 445, Shear and Torsion. His research interests include earthquake-resistant design of reinforced concrete structures.
with respect to the face of support, at a distance O.l5ln for uniformly loaded beams and at a distance 0.50a for beams with concentrated loads, but not to exceed d (Section 11.8.5, ACI 318-99 Code);
Pw = Asfbwd =ratio of web reinforcement; As area of nonprestressed tension reinforcement, in.2; ln clear span measured face-to-face of supports, in.; and a shear span (distance between concentrated load and
face of support), in. The use of shear reinforcement is required whenever the
factored shear force at the critical section exceeds the shear strength<J>Vc/2 (Section 11.5.5.1, ACI 318-99 Code). The contribution from the shear reinforcement is computed with
[ [ Zn] [ /n]} l+- 11--
Av __ d + A vh __ d d S 12 s2 12 y
(lb) (3)
(Eq. (11-30), ACI 318-99 Code)
where Av = area of shear reinforcement perpendicular to
flexural tension reinforcement within a distance s, in.2; and
Avh = area of shear reinforcement parallel to flexural tension reinforcement within a distance s2, in.2
It must be noted that, in the range of ln/d values between 0 and 5, Eq. (3) apportions the contributions from the vertical and the horizontal reinforcement as a function of the geometry of the member. For the vertical reinforcement, the efficiency ranges between a theoretical minimum of 1112 for ln/d = 0 to a maximum of 1/2 for ln/d = 5. On the other hand, the effective-ness of the horizontal reinforcement ranges from a maximum value of 11112 for lnld = 0 to a minimum of 112 for ln/d = 5. This clearly assumes a superior effectiveness of the distributed horizontal reinforcement in deep flexural members.
The ACI 318-99 Code defines an upper limit for the shear strength of deep flexural members
540
(4)
(Section 11.8.4, Eq. (11-27), ACl 3 I 8-99 Code)
The ACI 318-99 Code sets minimum amounts for both ver-tical and horizontal distributed reinforcement. Sections 11.8.9 and 1I.8.10 of the ACI 3 I 8-99 Code state the following limits, respectively
Av~ 0.0015b~.s; s ~ l ~ 18 in.
(5)
(6)
The ACI 318-99 Code requires that the amount of shear reinforcement determined for the critical section be used throughout the span. Finally, regarding the anchorage of main longitudinal tension reinforcement into the supports, Sections 12.10.6 and 12. 11.4 of the ACI 318-99 Code indicate that, at simple supports of deep flexural members, positive moment-tension reinforcement must be anchored to develop the specified yield strengthfy in tension at the face of the support.
APPENDIX A OF ACI 318-02 BUILDING CODE Appendix A provides code language for the use of the
STM in the design of structural concrete. In this study, STM, although applicable to various design situations, is used only for the design of deep flexural members. In the STM approach, the flow of forces or stresses within the member is represented by means of a truss system. Trusses consist of axially loaded elements in compression (struts) and tension (ties), and the intersections of the truss members are referred to as nodes. All struts, ties, and nodes have finite dimensions.
Appendix A includes a series of factors to be used as limiting values for the concrete stresses in struts ~sand nodes ~n· The limiting values are a function of the uniaxial concrete com-pressive strength and the strain conditions within the struts or at their ends. Values for ~s and ~n range from O.~ t? 1.0. Crack control, provided by the presence of a mm1n:ium amount of grid reinforcement in the struts, is taken rnto account by the ~s factor. For concrete co~pressive streng~~ not exceeding 6000 psi (41 MPa), a 25% increase (from · to 0.75) in the associated ~s factor is given for struts crossed by layers or grids of reinforcement parallel to the plane of the member that satisfies
A . L ~sin)';~ 0.003 bsi
(Eq. (A-4), ACI 318-02 Code)
{7)
ACI Structural Journal/July-August 2002
where
b
= area of surface reinforcement in the i-th layer . . 2 crossmg a strut, m. ;
= thickness of member, in.; = spacing of reinforcement in the i-th layer adjacent
to the surface of the member, in.; and = angle between the axis of a strut and the bars in
the i-th layer of reinforcement crossing that strut. A lower limit of 40 degrees for the angle 'Yi is suggested
when the reinforcement is provided in only one direction. Specific requirements for the development of reinforce-
ment are included in Appendix A. Development of hooks, headed reinforcing bars, mechanical anchorages, or straight bars should be provided at the node . The critical section for development is defined at the plane perpendicular to the tie where its centroid leaves the extended nodal zone.
EXPERIMENTAL PROGRAM The experimental program was carried out at the Karl H.
Kettelhut Structural Engineering Laboratory of the Purdue University School of Civil Engineering. It included the testing to failure of four full-scale deep reinforced concrete beams with different detailing schemes for the horizontal and vertical reinforcement. The design of the specimens and the actual testing was carried out jointly by researchers from Purdue University, the University of Michigan, and the University of Kansas. The details of the four beams tested in this study are described as follows.
TEST SPECIMENS The four reinforced concrete beam specimens had an overall
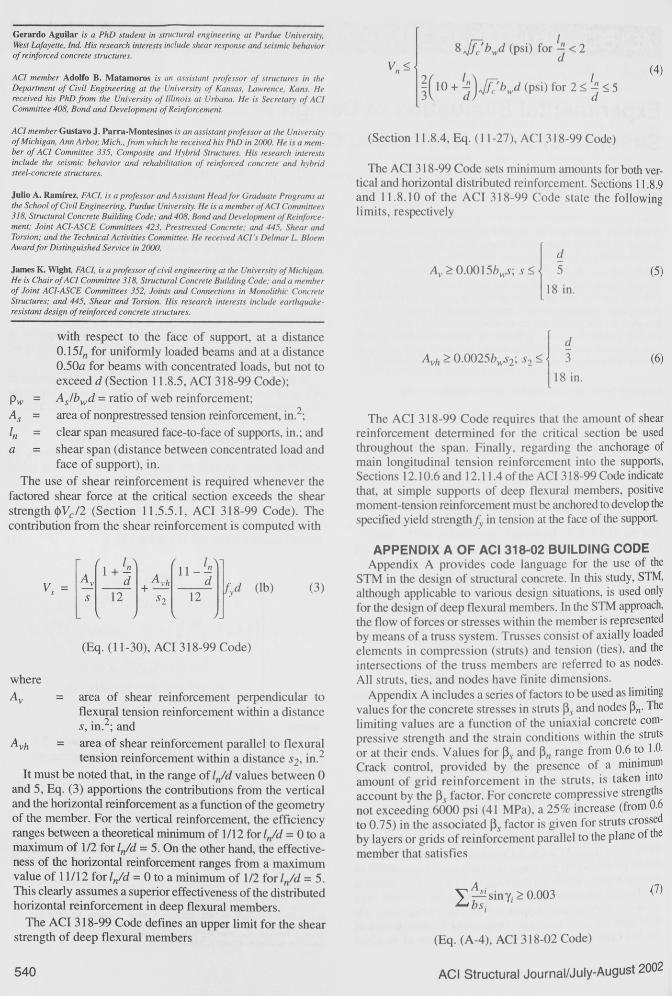
length of 176 in. (4470 mm), and were 36 in. (915 mm) deep and 12 in. (305 mm) wide. Figure 1 shows the general geometry and dimensions of the specimens . They were intended to represent deep members, for which it is plausible to envision a significant amount of the load carried directly from the load points to the supports by single compression struts. The specimens were designed as simply supported beams subjected to concentrated loads on the top face and supported on the
Table 1-Design considerations ~
Beam no. Specimen Features
l ACl-I ACT 318-99 Code
- Mechanical anchorage
2 STM-1 Appendix A of ACI 31 8-02
Mechanical anchorage
3 STM-H Appendix A of ACI 318-02
90-degree hook anchorage
4 STM-M Reduced shear reinforcement in shear span
90-degree hook anchorage
bottom face. Applied loads and support reactions were trans-mitted to the specimens by means of 12 x 12 x 2-in. (305 x 305 x 50 mm) steel plates. The shear span to effective depth ratio (aid) was approximately 1.0.
According to ACI 318-99, Section 10.7.1, a beam is consid-ered a deep flexural member for flexural design when the clear span-to-overall depth ratio ln/h is less than 5/4 for simple spans. On the other hand, Section 11.8.1 specifies that deep beam action must be considered for shear design when the clear span-to-effective depth ratio ln/d is less than 5.0, and the member is loaded on one face and supported on the oppo-site face so that struts can form between the loads and the supports. The specimens tested as part of this research project met the definition of deep flexural members for shear design as per Section 11.8.1. However, they did not satisfy the definition of a deep flexural member given in Section 10.7.1.
The four test specimens were labeled as ACI-1, STM-1, STM-H, and STM-M. The first three letters stand for the design approach used: ACI 318-99 Code (ACI) and Appendix A of the ACI 318-02 Code based on the STM. The second set of letters identifies whether the specimen was part of the first design group (I) with mechanical anchorages at ends of positive longitudinal reinforcement; the second group used 90-degree hooks at the ends of the positive longitudinal reinforcement (H); or used 90-degree hooks and had a modification to the minimum transverse reinforcement provision given in Appendix A (M).
SPECIMEN DESIGN PARAMETERS For design purposes, 4000 psi (28 MPa) concrete compressive
strength and 60 ksi ( 410 MPa) reinforcing steel yield strength were used. General design considerations for the four specimens are presented in Table 1. Figure 2 shows the reinforcement detailing used in the four specimens. The prelim-inary design of Specimens ACI-1, STM-1, and STM-H was carried out using the same factored point load of 175 kips (780 kN) placed at the third points of the span. A very small amount of vertical reinforcement was used in Specimen STM-M in an attempt to induce a compression failure of the strut between the load point and the support (Fig. 3). Only two vertical stirrups were placed within the shear span, as shown in Fig. 2. Table 2 summarizes the reinforcement detailing for the four test specimens.
- 36(915) """' n1 h----.--,..,,-----=1 JJt
-- 176(4470) -- - - 12(305)
Dimensions In inches (mm)
Fig. I-Test specimen's elevation and cross section.
Table 2-Reinforcement of test specimens Vertical reinforcement Main tension Main compression
Constant moment Horizontal longitudinal longitudinal Specimen Shear span region reinforcement reinforcement reinforcement
ACI-1 No. 3@ 6 in. No. 3@ 6 in. No. 3@ 4 in. 6No. 8 2No. 3
STM-1 No. 3@ 6 in. No. 3@ 6 in. No. 3@ 12 in. 6No. 8 2No. 3
STM-H No. 3@ 6 in. No. 3@ 6 in. 2No. 3 6No. 8 2No. 8
STM-M 2 No. 3 No. 3@ 6 in. None 6No. 8 2 No. 8
Note: I in. = 25.4 mm
ACI Structural Journal/July-August 2002 541

n 1 n _,,.,. '/
Specimen ACl-I
/ 4 4 4 4 4 4
C:ll==ll==ll==l==H==#=jl=ll==fl=;=i=t:=ll===ll==t- =--lf---H--.-. :t:=ll:::::=.ll=::l~ =-- b - I:= ~--= -- o e-' J "i-...
;..;I=:-:=_ -- .. l . L-= -=--- e;c - 'J 5 2-3/8
6#8
Specimen STM-1
#3@6 4#3 -- -- -_...-- "// r
-- r -::
- ........_ == ~ j - " ....::::r-... -... ~- 0
~Lenton Terminators " 6#8
Specimen STM-H
#306 2#8 2#3
Specimen STM-M #3@6 #3@6 2#8
--
-~
._____,
ij 1
~
3-1/8 2-7/8
4
12
5-3/81 5-3/8 2-3/8
2 3-1 /8 5-3/4
4
4
12
'-r--~-------'--~,.C-'--'--_.;._-'----'---'-------~-+-rH~ 2-112 4f
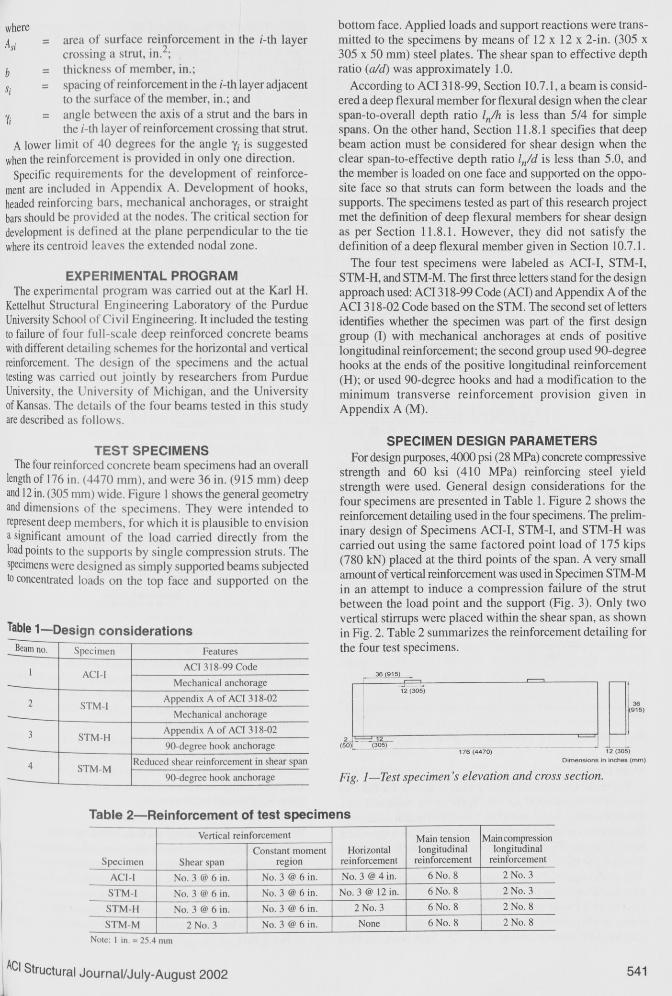
Fig. 2-Reinforcement detailing.
1~-ode 2 NodeiR
Node 1 ~J Node4
Fig. 3-Strut-and-tie model for design using Appendix A.
Main flexural steel The main longitudinal tension reinforcement for the four
specimens consisted of six No. 8, Grade 60 deformed bars. Two specimens, ACI-I and STM-I, had mechanical anchorages (terminators) at the ends of the positive moment longitudinal reinforcement. Figure 4 shows a view of such anchorage devices for both Specimen ACI-I and Specimen STM-I. The anchorage of the same reinforcement in the remaining two specimens was provided by standard 90-degree hooks. Specimen STM-H was built similarly to STM-I, except for a few modifications to the detailing scheme for the main longitudinal reinforcement (Fig. 2). Specimen STM-H
542
4 2 2-3/8 1-3/4
Dimensions In Inches (1 In . = 25.4 mm)
had two layers of main longitudinal tension reinforce-ment instead of the three layers used in STM-1. In STM-H, No. 8 deformed bars were used as compression reinforce-ment instead of the No. 3 bars used in Specimen STM-1. Specimen STM-M had the same longitudinal reinforce-ment as Specimen STM-H.
It is important to observe that the amount of main tens~on reinforcement in the ACI-I specimen was determined usmg standard flexural theory. For Specimen STM-l, the STM approach, using the truss model shown in Fig. 3, required the same longitudinal reinforcement.
Vertical and horizontal web reinforcement The vertical reinforcement consisted of U-shaped, No. 3
deformed bars. The orientation of the open side of this reinforce-ment wa alternated from top to bottom. The beam cross sections shown in all figures illustrate the case of .the free end of the stirrup being placed at the top of the rernf~rce~ ment cage. The distributed horizontal steel also consiste of No. 3 bars.
ACI Structural Journal/July-August 2002
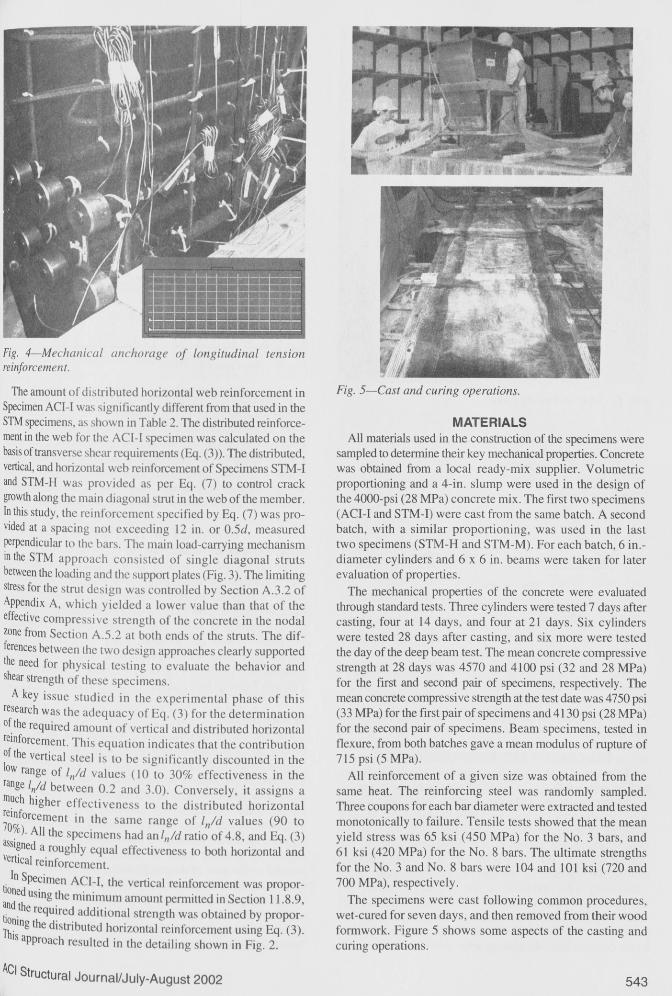
Fig. 4-Mechanical anchorage of longitudinal tension reinforcement.
The amount of distributed horizontal web reinforcement in Specimen ACl-1 wac;; significantly different from that used in the STM specimens, ac;; shown in Table 2. The distributed reinforce-ment in the web for the ACI-1 specimen was calculated on the basis of transverse shear requirements (Eq. (3)). The distributed, vertical, and horizontal web reinforcement of Specimens STM-1 and STM-H was provided as per Eq. (7) to control crack growth along the main diagonal strut in the web of the member. In this study, the reinforcement specified by Eq. (7) was pro-vided at a spacing not exceeding 12 in. or 0.5d, measured perpendicular to the bars. The main load-carrying mechanism in the STM approach consisted of single diagonal struts between the loading and the support plates (Fig. 3). The limiting stress for the strut design was controlled by Section A.3.2 of Appendix A, which yielded a lower value than that of the effective compressive strength of the concrete in the nodal zone from Section A.5.2 at both ends of the struts. The dif-ferences between the two design approaches clearly supported the need for physical testing to evaluate the behavior and shear strength of these specimens.
A key issue studied in the experimental phase of this research was the adequacy of Eq. (3) for the determination of the required amount of vertical and distributed horizontal reinforcement. This equation indicates that the contribution of the vertical steel is to be significantly discounted in the low range of l,/d values (10 to 30% effectiveness in the range Vd between 0.2 and 3.0). Conversely, it assigns a m~ch higher effectiveness to the distributed horizontal remforc · ?Oo/c ement in the same range of ln/d values (90 to
.0
). All the specimens had anlnld ratio of 4.8, and Eq. (3) ~si?ned a roughly equal effectiveness to both horizontal and ertical reinforcement.
t. In Specimen ACI-I, the vertical reinforcement was propor-ioned usin th · · and th g. e mimi:n_um amount permitted in Section 11.8.9, t. . e requued add1t10nal strength was obtained by propor-1orung th d' . Th· e istnbuted horizontal reinforcement using Eq. (3).
is approach resulted in the detailing shown in Fig. 2.
ACI Structural Journal/July-August 2002
Fig. 5-Cast and curing operations.
MATERIALS All materials used in the construction of the specimens were
sampled to determine their key mechanical properties. Concrete was obtained from a local ready-mix supplier. Volumetric proportioning and a 4-in. slump were used in the design of the 4000-psi (28 MPa) concrete mix. The first two specimens (ACI-1 and STM-I) were cast from the same batch. A second batch, with a similar proportioning, was used in the last two specimens (STM-H and STM-M). For each batch, 6 in.-diameter cylinders and 6 x 6 in. beams were taken for later evaluation of properties.
The mechanical properties of the concrete were evaluated through standard tests. Three cylinders were tested 7 days after casting, four at 14 days, and four at 21 days. Six cylinders were tested 28 days after casting, and six more were tested the day of the deep beam test. The mean concrete compressive strength at 28 days was 4570 and 4100 psi (32 and 28 MPa) for the first and second pair of specimens, respectively. The mean concrete compressive strength at the test date was 4750 psi (33 MPa) for the first pair of specimens and 4130 psi (28 MPa) for the second pair of specimens. Beam specimens, tested in flexure, from both batches gave a mean modulus of rupture of 715 psi (5 MPa).
All reinforcement of a given size was obtained from the same heat. The reinforcing steel was randomly sampled. Three coupons for each bar diameter were extracted and tested monotonically to failure. Tensile tests showed that the mean yield stress was 65 ksi ( 450 MPa) for the No. 3 bars, and 61 ksi (420 MPa) for the No. 8 bars. The ultimate strengths for the No. 3 and No. 8 bars were 104 and 101 ksi (720 and 700 MPa), respectively.
The specimens were cast following common procedures, wet-cured for seven days, and then removed from their wood formwork. Figure 5 shows some aspects of the casting and curing operations.
543

Fig. 6-Setup in loading frame.
350 ,...---------------~ 1500
300 1200
250
~ 200 .:
900 ~
! 600
: ~ 150
- <>-ACH 100 -STM·I
---<>· .. STM·H ............ STM·M
• lnibal Flexural Cracl(lng 300
50
0 ~--------·-lnitl_al o;_· a:_gon...:::.al~Cra~ckl:::.::ng___J 0
0.0 0.2 0.4 0.6 0.8 1.0 1.2 1.4 1.6 Midspan Deflection, In
Initial Flexural Initial Dl•gonal
Specimen Cracking Cracking Failure Modeol
Failure V, klp 4,ln. v, kip 4,ln. V,klp 6, In.
ACl-1 120 0.22 200 0 .39 305 1.24 Flexure
STM-1 120 0.23 200 0.38 255 a.so' Flexure STM-H 85 0.20 160 0.38 289 1.32 Shear
STM·M 95 0.17 160 0.32 287 1.27 Shear
' Measurements stopped belore failure 1 kip = 4.448 kN 1 in =25.4 mm
Fig. 7-Comparison of shear force-deflection curves for test specimens.
TEST SETUP AND INSTRUMENTATION The test setup is shown in Fig. 6. Symmetric point loads were
applied using a 600 kip (2670 kN) universal testing machine and a spreader beam. Pin-and-roller supports were approximated with 2 in.-diameter (50 mm) steel rods between two 2 in.-thick (50 mm), 12 in.-square (305 mm) steel plates. The rods and steel plates permitted the placement of concentrated loads at the desired locations. The load was monitored by placing two load cells on the top faces of the specimens. Nine displacement transducers were mounted at the support locations and throughout the span to monitor deflections. The load was applied monotonically up to failure, pausing at key behavior points to mark cracks, collect data from various instrumen-tation devices, and take photographs.
544
Fig. 8- Final crack patterns.
To monitor the behavior of the test specimens, approximately 40 electric strain gages were attached to the longitudinal and transverse reinforcement at key locations for each specimen. In addition, concrete surface-strain gages were placed in the shear spans and between load points. Whittemore points were glued to one of the lateral faces of the beams within the shear span, as well as between point loads. A PC-based data acquisition system was used to monitor and record data during the tests.
BEHAVIOR OF TEST BEAMS Load-deflection relationships
The load-deflection behavior of each specimen is shown in Fig. 7. All four specimens exhibited similar overall behavior, which was characterized by a nearly bilinear response. Companion specimens ACI-1 and STM-1 had similar diagonal tension-cracking strength. This was also true for companion specimens STM-H and STM-M. After flexural cracking, a second, softer linear region was observed in all of the specimens up to the first yielding of the main longitudinal reinforcement. This was followed by a plateau extending to failure.
Failure modes The critical shear crack, later becoming the failure crack,
formed at approximately the same load for all specimens (approximately 240 kips [1070 kN]). The orientation of these cracks was somehow controlled by the geometry of the shear span and the dimensions of the support and loading areas. Failure of the specimens took place only after the primary diagonal crack developed fully between the load and support regions, and after yielding of main tension reinforcement. Significant splitting within the shear span, noted as cracks parallel to the axis of the main struts, was observed for all specimens. At failure, some crushing of the compression zone at midspan was observed. In Specimens ACl-1 and STM-1, which failed in flexure, the crushing covered a relatively large region between point loads. Specimens STM-H and STM-M failed in shear compression. Figure 8 shows the sketches
ACI Structural Journal/July-August 2002

2000 1 ! 1500
j 1()()0
500
2500
.i; 2000 : g 1500 1 :11000
500
Fig. 9-Longitudinal reinforcement strains (Specimen AC/-/).
corresponding to the crack patterns just before failure for all four specimens.
Longitudinal reinforcement strains The distribution of strains along the main longitudinal
reinforcement, determined from electric strain gages, was recorded during the tests. Strain distributions at various stages of loading are presented in Fig. 9 through 11. The strain distribu-tions corresponding to Specimen STM-1, which are not pre-sented, were very similar to those of Specimen ACl-1. The strain distributions for each plot correspond to shear force at initial flexural cracking, first diagonal cracking, first yield of lon-gitudinal reinforcement, and failure. To facilitate comparison, the plotted values of strain were limited to a maximum of 3000 microstrain , although higher strains were recorded at some locations.
As can be seen in Fig. 9 through 11, the strain distributions for all specimens were similar. They are roughly symmetric, with increasing strains towards midspan. For all four specimens, regardless of the type of anchorage, a rapid reduction in reinforcement strain was observed between the inner edge of the support plate (towards the shear span) and the back side of the plate (towards the end of the beam). Near the end of the test, strains in excess of yield were recorded at the face of the support-bearing plate. Throughout the loading operation of all specimens, a roughly constant distribution of strains was recorded from face to face of the support-bearing plates, a result that is consistent with the STM design approach.
The strain measurements highlight the inconsistency resulting from two different definitions for deep flexural members in the A~I 318-99 Code. The tested members exhibited deep beam ~ction characterized by high strains, and hence, high stresses, ~n the main flexural-tension reinforcement almost all the way mto the support. On the other hand, the significant drop in strain through the bearing area indicates a beneficial condition for ~nchorage of this reinforcement. This is not currently reflected m the anchorage requirements given in the ACI 318-99 Code.
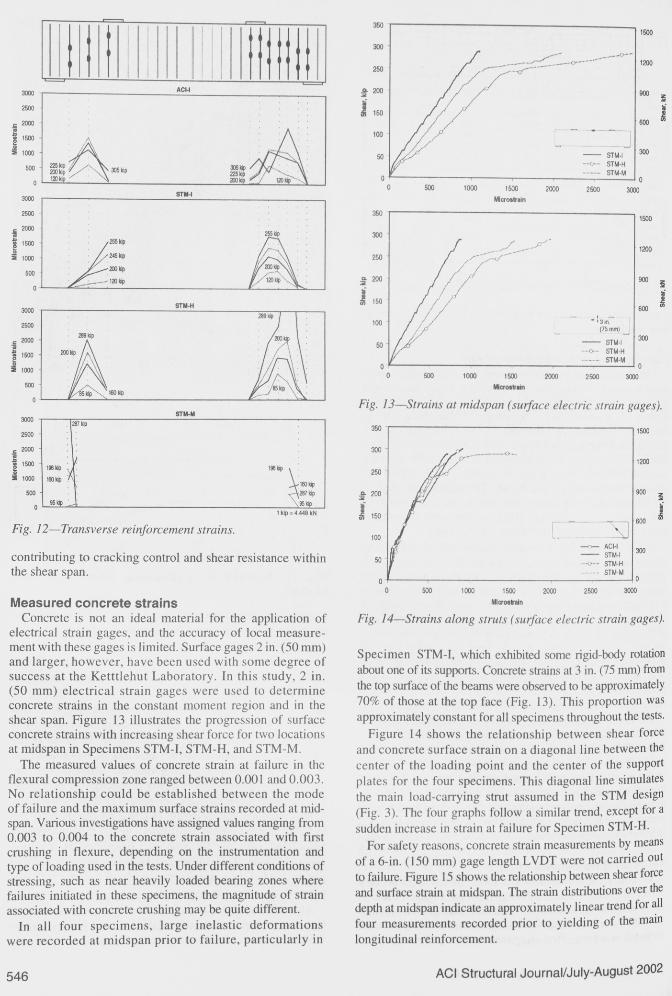
Vertical reinforcement strains ,Vertical reinforcement strains at two different points on a
:~1rrup leg were recorded during the tests. Figure 12 shows e average strain at each instrumented stirrup. The readings
~e shown for four shear-force stages corresponding to initial exural cracking, first diagonal cracking, first yield of
ACI Structural Journal/July-August 2002
600
1~ -=
I ~
-
I{~~~==--------~
= J a -
3000 ..--~......--~~~~~~~~~~~~--=-~~
2500
·5 2000
I 1600 .ii ll 1000
500
1 ldp • 4.448 kN
D
D Fig. 10-Longitu.dinal reinforcement strains (Specimen STM-H).
3000
2500
j 2000
g 1500
j 1000 D 500
3000 297q, 2600
.. 2000
i 1500 .ii ll 1000 0
500
Fig. I I-Longitudinal reinforcement strains (Specimen STM-M).
longitudinal reinforcement, and failure. Again, plots are limited to 3000 microstrain for purposes of clarity.
The plots for Specimens ACl-1, STM-I, and STM-H were relatively similar. The strain readings in the stirrup legs were sensitive to the relative location of the strain gages with respect to the diagonal cracks. As shown in Fig. 12, large strain readings concentrated primarily in one or two stirrups, for which the gage location was either crossed by or near a diagonal crack within the shear span. This is in agree-ment with the findings of previous researchers (Anderson and Ramirez 1989), indicating that the efficiency of the transverse reinforcement is highly dependent on its relative location with respect to the crack pattern (Fig. 8). This obser-vation supports the detailing practice of distributing the vertical reinforcement uniformly, given the uncertainty associated with the location and geometry of diagonal shear cracking. This uncertainty decreases, however, for deep beams loaded with a concentrated load on one face and supported on the opposite face.
At load levels close to failure, tensile strains of 0.0015 or higher were monitored in selected stirrups of all four specimens, indicating that vertical transverse reinforcement was actively
545
~
I I j I lll!HI I 3000 ACl-l
2500
2000
1500 /\
A 1000
500 225kip 200kip ~kip 13) '
3000 STM-1
2500
-: 2000 .e. 1500 255kip g ti :ii 1000 . /245kip
500 (/ 200kip
3000 STM·H
2500
c 2000 289kip
l 1500
:I 1000
500
STM-M 3000 . 2S7kip 2500
.!Z 2000
i 1500 1 196kip x· .!! .\: :I 1000 100kip
500 951do
1 kip = 4.448 kN
Fig. 12-Transverse reinforcement strains.
contributing to cracking control and shear resistance within the shear span.
Measured concrete strains Concrete is not an ideal material for the application of
electrical strain gages, and the accuracy of local measure-ment with these gages is limited. Surface gages 2 in. (50 mm) and larger, however, have been used with some degree of success at the Ketttlehut Laboratory. In this study, 2 in. (50 mm) electrical strain gages were used to determine concrete strains in the constant moment region and in the shear span. Figure 13 illustrates the progression of surface concrete strains with increasing shear force for two locations at midspan in Specimens STM-1, STM-H, and STM-M.
The measured values of concrete strain at failure in the flexural compression zone ranged between 0.001 and 0.003. No relationship could be established between the mode of failure and the maximum surface strains recorded at mid-span. Various investigations have assigned values ranging from 0.003 to 0.004 to the concrete strain associated with fust crushing in flexure, depending on the instrumentation and type of loading used in the tests. Under different conditions of stressing, such as near heavily loaded bearing zones where failures initiated in these specimens, the magnitude of strain associated with concrete crushing may be quite different.
In all four specimens, large inelastic deformations were recorded at midspan prior to failure, particularly in
546
0 500 1000 1500 2000 2500 3000
Mcrostr1ln
350 1500
300 / ,er
./'~ ................ · 1200 250 /" "J ,/· // ...
~200 I/ d 900 I / !ii
l ./ 11 i 150 I / &
/ /' 600
100 ,r' ,.I' -13,"~ I /11 (75mm) ~
50 {/ - STM-1 300 ,, ·····O·- STM·H
STM·M 0
0 500 1000 1500 2000 2500 3000 Mlcrostr1ln
Fig. 13-Strains at midspan (surf ace electric strain gages).
1500
··-·········--·O-... 1200
900 ~
600 l I I.. .
--0-- ACl·I 300 - STM-1 -·-0--· STM-H
... STM·M or--~~,--~~~~~~~~~~~~~---1 0
0 500 1000 1500 2000 2500 3000 Mlcrosraln
Fig. 14-Strains along struts (surface electric strain gages).
Specimen STM-1, which exhibited some rigid-body rotation about one of its supports. Concrete strains at 3 in. (75 mm) from the top surface of the beams were observed to be approximately 70% of those at the top face (Fig. 13). This proportion was approximately constant for all specimens throughout the tests.
Figure 14 shows the relationship between shear force and concrete surface strain on a diagonal line between the center of the loading point and the center of the support plates for the four specimens. This diagonal line simulates the main load-carrying strut assumed in the STM design (Fig. 3). The four graphs follow a similar trend, except for a sudden increase in strain at failure for Specimen STM-H.
For safety reasons, concrete strain measurements by means of a 6-in. ( 150 mm) gage length L VDT were not carried out to failure. Figure 15 shows the relationship between shear force and surface strain at midspan. The strain distributions over the depth at midspan indicate an approximately linear trend for all four measurements recorded prior to yielding of the main longitudinal reinforcement.
ACI Structural Journal/July-August 2002

Specimen ACl-1 36 .----.... ~I)-,..--------.
30
.. 24
f :: 0
-2000
0 60 kip • 100 kip • 140 kip • 180 kip
-1000 0 1000 2000 Mlcro1traln
Specimen STM·H 36 r---....-----v.------~
30
.E 24
~- 18
] 12
0 -2000
0 20 kip • 50 kip • 80 kip • 150 kip
• 1000 0 1000 2000 Mlcro1traln
-2000
-2000
Specimen STM·I
0 60 klp • 100 kip • 140 kip • 180 kip
-1000 0 1000 2000 Mlcroatraln
Specimen STM·M
0 20 kip • 50 kip • 80kip • 150kip
-1000 0 1000 2000 Microatrain
1 kip = 4.448 kN 1in=25.4 mm
Fi~. JS- Strains at midspan (6-in. [150 m] LVDT gage).
Table 3-Measured and calculated capacities Calculated capacities, kips
Measured Nominal properties Measured properties shear
capacity ACI, STM, Specimen VM, kips VACI VsTM
ACI-1 305 169 186 STM-1 255 106 166 STM-H 289 126 188 STM-M 287 98 153 Average - - -
Note: I kip = 4.448 kN
COMPARISON OF MEASURED AND DESIGN CAPACITIES
VACI
VM
0.55 0.42 0.44 0.34 0.44
A comparison between the measured and calculated shear capacities of the specimens was canied out. The shear capacity for all specimens was calculated using both nominal and measured material properties. No strength-reduction factor was used when calculating specimen capacities. Two approaches were used: I) the ACI 318-99 Code; and 2) Appendix A of the ACI 318-02 Code using a four-node statically determined tr~ss model (Fig. 3). Table 3 summarizes the results of this comparison.
It is evident that the shear capacities calculated by both the ACI 318-99 Code and Appendix A are very conservative. !he ACI 318-99 Code, which is based on empirical equations, ls more conservative than the STM approach, which considers a.mor~ realistic representation of the load-carrying mecha-nism m deep flexural members. This assertion is further ~upporte? .by the measured capacity of Specimen STM-M. f he detallmg of this specimen, although not recommended ~ P~actice, clearly demonstrates the fallacy of assigning
e ectiveness to the distributed vertical and horizontal reinforce-~e~ts on the basis of Eq. (3). This specimen, without distributed onzontal reinforcement throughout the web, and with con-c~ntrated vertical reinforcement in the form of two stirrups, 8 owed the ability of the deep beam to carry load primarily
ACI Structural Journal/July-August 2002
VSTM VACI VSTM ACI, STM, VM VACI VsTM VM VM
0.61 214 226 0.70 0.74 0.65 133 203 0.52 0.80 0.65 152 225 0.53 0.78 0.53 117 186 0.41 0.65 0.61 - - 0.54 0.74
by a single strut mechanism between the load and support points. It must be pointed out that the load-carrying mechanism of Specimen STM-M probably included both the participation of the transverse reinforcement and the dowel action of the main longitudinal reinforcement.
SUMMARY OF FINDINGS AND CONCLUSIONS Four deep beams were monotonically tested to failure to
evaluate the adequacy of Appendix A of the 2002 edition of the ACI 318 Code for the design of deep flexural members. The test specimens were subjected to third-point loads in addition to their self-weight. At failure, all specimens exhibited a primary diagonal crack running from the support region to the point load. Some crushing of the concrete in the flexural compression zone near the loading plate was observed in all specimens. Specimens ACI-I and STM-I failed in flexure. Specimens STM-H and STM-M failed in shear compression. Based on the analysis of the test results, the following obser-vations were made:
1. Despite the different modes of failure, failure loads, and corresponding ultimate deflections for Specimens ACI-1, STM-H, and STM-M, they were within 6% of each other. Specimen STM-I recorded the smallest load and deflection at failure;
547

2. Failure occurred after yielding (strain level exceeding 0.~21) of both longitudinal and transverse reinforcement. Large strams were locally recorded in the vertical web reinforcement as all four specimens approached failure;
3. A large reduction in the magnitude of the strains in the main longitudinal reinforcement was observed to occur within the length of the support-bearing plates in all four specimens;
4. Recorded strains in the main longitudinal tension reinforce-ment, anchored either by means of mechanical end anchorages or using standard 90-degree hooks, reached yield levels in the shear span close to the face of the support; and
5. Strains in the vertical web reinforcement were highly dependent on the relative location of this reinforcement with respect to the crack pattern.
CONCLUSIONS Based on the findings, the following conclusions were drawn: 1. The shear designs of the deep beams tested using the ACI
318-99 Code and Appendix A of the ACI 318-02 Code were shown to be conservative. The 25% degree of conservatism observed for Specimens STM-1 and STM-H is deemed appropriate at this time until more experimental information is available. This represents a significant improvement over the current ACI method that resulted in a test load of almost two times the calculated value;
2. Provisions for proportioning the vertical and distrib-uted horizontal reinforcement in the web according to Section 11.8.8 of the ACI 318-99 Code did not properly reflect the overall behavior of the test specimens. The STM gives a better representation of the load-carrying mechanism at failure in deep flexural members, and leads to reductions in the amount of distributed vertical and horizontal reinforcement; and
3. The significant reduction in the magnitude of strains measured in the main longitudinal tension reinforcement over the length of the support-bearing plate indicates a favorable anchorage condition in these highly compressed regions of a deep flexural member. This condition is not presently acknowledged in the ACI 318-99 Code.
ACKNOWLEDGMENTS This study was conducted in the Karl. H. Kettlehut Structural Engineering
Laboratory at Purdue University under the sponsorship of the Reinforced Concrete Research Council. The support of the Erico Corporation, through the donation of the longitudinal reinforcement and the Lenton terminators for Specimens ACI-1 and STM-1 is also recognized. Thanks are extended to
548
Purdue University graduate students Santiago Pujol and Koray Tureyen· undergraduate students James Reisert, Dave Blackman, and Kyle Fisher'. postdoctoral research assistant Lisa Samples; and to University ofMichiga~ graduate students Burcu Burak, Xuemei Liang, and Afsin Canbolat for their help during the experimental phase of the research project.
a
Pw
NOTATION area of nonprestressed tension reinforcement, in.2 area of surface reinforcement in i-th layer crossing strut, in.2 area of shear reinforcement perpendicular to flexural tension reinforcement within distances, in .2
area of shear reinforcement ~arallel to llexural tension reinforce-ment within distance s2, in. shear span (distance between concentrated load and face of support), in. thickness of member, in. web width, in. effective depth (distance from extreme compression fiber to centroid of longitudinal tension reinforcement), in. specified compressive strength of concrete, psi clear span measured face-to-face of supports, in . factored moment occurring simultaneously with Vu at critical section, in. -lb spacing of reinforcement in i-th layer adjacent to surface of member, in. factored shear force at critical section, lb factor to account for effect of anchorage of ties on effective compressive strength of nodal zone factor to account for effect of cracking and confining reinforce-ment on effective compressive strength of concrete in strut angle between axis of strut and bars in i-th layer of reinforce-ment crossing that strut ratio of web reinforcement
REFERENCES ACI Committee 318, 1999, "Building Code Requirements for Structural
Concrete (ACI 3 I 8-99) and Commentary (3 l 8R-99)," American Concrete Institute, Farmington Hills, Mich., 39 I pp.
Aguilar, G.; Matamoros, A.; Parra-Montesinos, G.; Ramirez, J. A.; and Wight, J. K., 2002, "Experimental and Analytical Evaluation of Design Procedures for Shear Strength of Deep Reinforced Concrete Beams," Civil Engineering Report, Purdue University, West Lafayette, Ind.
American Association of State Highway and Transportation Officials, 1994, Standard Specifications for Highway Bridges, 16th Edition.
Anderson, N. S., and Ramirez, J. A., 1989, "Detailing of Stirrup Reinforce-ment," AC/ Structural Journal, V. 86, No. 5, Sept.-Oct., pp. 507-515. (also errata, V. 86, No. 6, Nov.-Dec., p. 767).
Cagley, J. R., 2001, "Changing from ACI 318-99 to ACI 318-02-What's New?," Concrete International, V. 23, No. 6, June, pp. 69-184.
Joint ACI-ASCE Committee 445, 1998, "Recent Approaches to Shear Design of Structural Concrete," Journal of Structural Engineering, ASCE, V. 124, No. 12, Dec., pp. 1375-1417.
Schlaich, J .; Schafer, K.; and Jennewein, M., 1987, "Toward a Consistent Design of Structural Concrete," PC/ Journal, V. 23, No. 3, May-June, pp. 74-150.
ACI Structural Journal/July-August 2002