Experimental Design Approach with Response Surface ... · The Box-Behnken design (BBD), an...
12
Journal of Geoscience and Environment Protection, 2016, 4, 50-61 http://www.scirp.org/journal/gep ISSN Online: 2327-4344 ISSN Print: 2327-4336 DOI: 10.4236/gep.2016.411006 November 11, 2016 Experimental Design Approach with Response Surface Methodology for Removal of Indigo Dye by Electrocoagulation * Nizar Barrak 1,2# , Rabeb Mannai 1 , Manel Zaidi 1 , Moez Kechida 3 , Ahmed Noureddine Helal 1 1 Laboratory Bioressources: Integrative Biology & Valuation “BIOLIVAL”, Higher Institute of Biotechnology of Monastir, University of Monastir, Monastir, Tunisia 2 Faculty of Sciences of Bizerte, University of Carthage, Carthage, Tunisia 3 Textile Industrial Company (SITEX), Monastir, Tunisia Abstract Treatment of Indigo dye (leuco form), reduced in the industrial conditions of the SITEX (Textile Industrial Company), by a batch electrocoagulation using aluminum electrodes. Response Surface Methodology (RSM) and Box-Behnken design were used to optimize for Color Removal (CR(%)). Our results showed that the quadratic second order equation provided the best correlation for the decolorization of Indigo dye (CR(%)). On the other hand, the ANOVA analysis proved the large interaction between the current intensity and the initial concentration of the dye. Experiments were conducted to find the desired conditions for removal of particular concentra- tion of the dye and lower Operation Cost. The results showed that CR(%) = 88.3% (R 2 ) of color removal for initial dye concentration of 12.31 mg/l, with a current den- sity of 2.81 A/m 2 , solution concentration of NaCl of 2.67 g/l. Under these conditions, Electrical Energy Consumption (EEC) and Electrode Consumption (EMC) and Op- eration Cost were 0.01999 kWh/m 3 (R 2 = 93.1%), 0.00142768 Kg/m 3 (R 2 = 79.4%) and 0.000558 US$/m 3 , respectively. Keywords Electrocoagulation, Operation Cost, Optimization, Dye *N.B: This project is in the framework of a doctoral thesis MOBIDOC-PASRI the program financed by the EU and managed by the ANPR (National Agency for Promotion of Scientific Research as at Support Unit Support Program for Research and Innovation System (PASRI)). How to cite this paper: Barrak, N., Man- nai, R., Zaidi, M., Kechida, M. and Helal, A.N. (2016) Experimental Design Approach with Response Surface Methodology for Removal of Indigo Dye by Electrocoagula- tion. Journal of Geoscience and Environ- ment Protection, 4, 50-61. http://dx.doi.org/10.4236/gep.2016.411006 Received: July 30, 2016 Accepted: November 8, 2016 Published: November 11, 2016 Copyright © 2016 by authors and Scientific Research Publishing Inc. This work is licensed under the Creative Commons Attribution International License (CC BY 4.0). http://creativecommons.org/licenses/by/4.0/ Open Access
Transcript of Experimental Design Approach with Response Surface ... · The Box-Behnken design (BBD), an...

Journal of Geoscience and Environment Protection, 2016, 4, 50-61 http://www.scirp.org/journal/gep
ISSN Online: 2327-4344 ISSN Print: 2327-4336
DOI: 10.4236/gep.2016.411006 November 11, 2016
Experimental Design Approach with Response Surface Methodology for Removal of Indigo Dye by Electrocoagulation*
Nizar Barrak1,2#, Rabeb Mannai1, Manel Zaidi1, Moez Kechida3, Ahmed Noureddine Helal1
1Laboratory Bioressources: Integrative Biology & Valuation “BIOLIVAL”, Higher Institute of Biotechnology of Monastir, University of Monastir, Monastir, Tunisia 2Faculty of Sciences of Bizerte, University of Carthage, Carthage, Tunisia 3Textile Industrial Company (SITEX), Monastir, Tunisia
Abstract Treatment of Indigo dye (leuco form), reduced in the industrial conditions of the SITEX (Textile Industrial Company), by a batch electrocoagulation using aluminum electrodes. Response Surface Methodology (RSM) and Box-Behnken design were used to optimize for Color Removal (CR(%)). Our results showed that the quadratic second order equation provided the best correlation for the decolorization of Indigo dye (CR(%)). On the other hand, the ANOVA analysis proved the large interaction between the current intensity and the initial concentration of the dye. Experiments were conducted to find the desired conditions for removal of particular concentra-tion of the dye and lower Operation Cost. The results showed that CR(%) = 88.3% (R2) of color removal for initial dye concentration of 12.31 mg/l, with a current den-sity of 2.81 A/m2, solution concentration of NaCl of 2.67 g/l. Under these conditions, Electrical Energy Consumption (EEC) and Electrode Consumption (EMC) and Op-eration Cost were 0.01999 kWh/m3 (R2 = 93.1%), 0.00142768 Kg/m3 (R2 = 79.4%) and 0.000558 US$/m3, respectively. Keywords Electrocoagulation, Operation Cost, Optimization, Dye
*N.B: This project is in the framework of a doctoral thesis MOBIDOC-PASRI the program financed by the EU and managed by the ANPR (National Agency for Promotion of Scientific Research as at Support Unit Support Program for Research and Innovation System (PASRI)).
How to cite this paper: Barrak, N., Man-nai, R., Zaidi, M., Kechida, M. and Helal, A.N. (2016) Experimental Design Approach with Response Surface Methodology for Removal of Indigo Dye by Electrocoagula-tion. Journal of Geoscience and Environ-ment Protection, 4, 50-61. http://dx.doi.org/10.4236/gep.2016.411006 Received: July 30, 2016 Accepted: November 8, 2016 Published: November 11, 2016 Copyright © 2016 by authors and Scientific Research Publishing Inc. This work is licensed under the Creative Commons Attribution International License (CC BY 4.0). http://creativecommons.org/licenses/by/4.0/
Open Access
N. Barrak et al.
51
1. Introduction
Textile dyes are usually used in excess, especially when they belong to the disperse dye class: this class groups, indeed, organic non-ionic compounds nearly insoluble, applied in aqueous solution using a simple immersion technique, which induces large water consumption [1]. Consequently, up to 40% of the amount of dyes is not fixed to textile fibres [2]. Residual dyestuffs in textile wastewaters present the disadvantage to exhibit simultaneously a high toxicity level and a poor biodegradability with an aesthetic pollu-tion which has a strong psychological effect [3]. As dyestuffs are visible at low concen-trations, aesthetic standards are often more difficult to meet than legal standards.
In recent years, investigations have been focused on the treatment of wastewaters using electrocoagulation (EC). The electrocoagulation has successfully been used for the treatment of wastewaters such as electroplating wastewater [4], laundry wastewater [5], latex particles [6], restaurant wastewater [7] and slaughterhouse wastewater [8]. Meanwhile, electrocoagulation process has been widely used in the removal of arsenic [9], phosphate [10], sulfide, sulfate and sulfite [11] and boron [12]. Treatments of waste- waters containing textile dyes have been studied by electrocoagulation method. The re-sults of these studies show that Chemical Oxygen Demand (COD), color, turbidity and dissolved solids at varying operating conditions are considerably removed [13] [14].
In this study, the aim is to demonstrate that such reactors can be used as electrocoa-gulation cell for studying effects of different parameters like applied current density, in-itial concentration of dye, conductivity in the aim to investigate dye removal and in or-der to determine desired operating conditions. Operating cost for the removal of dye was calculated. In the calculation of the operating cost, only material and energy costs were considered.
2. Materials and Methods 2.1. Conventional Reduction of Indigo
As a vat dye indigo needs to be reduced to its water-soluble form before it can be used in dyeing. The reduction of indigo to leuco-indigo, represents an important type of in-dustrial process which is operated worldwide on a considerable scale [15].
The indigo (BEZEMA AG, Switzerland) reduction is industrially done, in the SITEX (Textile Industrial Company-Ksar Hellal, Tunisia), with Sodium dithionite (Fluka, Germany) as a conventional reducing agent. It is also known as sodium hydrosulphite, or Hydro (Na2S2O4) and has been a major reducing agent [16] in the industrial reduc-tion of vat dyes including indigo due to its chemical as well as economic advantages. It is used with all vat dyes at temperatures ranging up from 30˚C [17].
Indigo is reduced by Sodium Hydroxide, and then the obtained form Leuco is filtered through a sieve of 23 µm to remove fibers. Afterwards, we transfer the filtrate to the electrochemical processing cell.
2.2. Cell Electrochemical Reactor
The electrochemical reactor was a 16.957 L acrylic column with a height of 60 cm and a

N. Barrak et al.
52
diameter of 9.54 cm. It contained a set of one pair of electrodes made of aluminum. Dimensions of each electrode were 335 mm × 130 mm × 2 mm so, its total area (S) was 0.088960 m2 and the distance between two electrodes in electrochemical cell was 7 mm in all experiments (Figure 1). The electrodes were connected to a DC power supply (Laboratory DC. Power supply Model M10-SP600 SL) with galvanostatic operational options for controlling the current density.
All the runs were performed at room temperature. In each run, 30 ml of the dye so-lution was filtered by Whatman® glass microfiber filters (7 µm). The filtrate obtained was collected for the analysis of water properties and the electrodes were well polished by sandpaper before each test. All experiments were repeated twice, and the experi-mental error was 3%.
During the runs, the solution in the reactor unit was stirred at 2 rpm by a magnetic stirrer. The experiments were carried out in a batch mode with a liquid sample of 13.71 L. Different current intensities were applied (0.5 to 1.5A).
The conductivity measurement was performed with a conductimeter (HANNA In-struments). The pH of the solutions was measured by a pH meter (370 pH Meter JENWAY) and adjusted by adding NaOH or H2SO4 (Merck, Germany) solutions. The batch experimental cell is shown in Figure 1. The conductivity of solutions was raised up and adjusted in different values by the addition of NaCl (1 g/L to 6 g/L).
The commercial dyes indigo used in this project were furnished by SITEX. Dye solu-tions were prepared by dissolving dyes in distilled water and reduced by sodium hy-drosulfite under the conditions described above. In the present experimental study, aluminum has been used as elecrodes and the treatment time fixed at 25 min.
2.3. Determining the Characteristic Decolorization of Indigo Dye 2.3.1. Absorbance Characteristics The dye concentrations were determined from their absorbance characteristics in the UV-VIS range (200 - 800 nm) with the calibration method. HACH Lange DR 3900 spectrophotometer was used. For these measurements, the maximum absorption (λmax = 612 nm) wavelength of dyes was determined by measuring their absorbance. The cal- culation of color removal efficiency after electrocoagulation treatment was performed using this formula (Equation (1)) [18]:
Figure 1. Apparatus of the electrocoagulation bench scale reactor: 1-Electrochemical cell; 2- Anode (Aluminum); 3-Cathode (Aluminum); 4-DC Power supply; 5-Magnetic stirring; 6-Mag- netic stirrer. (a) Schematic mounting of the electrochemical cell; (b) Experimental pilot plant of the electrochemical cell.

N. Barrak et al.
53
( ) ( ) ( )( )−612 612
612
Do t = 0 Do t = 25CR % =
Do t = i (1)
where: Do612 (t = 0): measuring the absorbance at 612 nm at initial instant; Do612 (t = i): measuring the absorbance at 612 nm after a 25 min, time.
2.3.2. Current Density The current density (CD) is the important parameter for controlling the electrochemi-cal reaction rate. CD can be formulated as:
The current density (CD) was calculated through the equation as follows (Equation (2)):
⋅ electrode
ICD =2 S
(2)
where CD is the current density (A∙m−2), I is the current (A) and S is surface area of the electrode (m2) [19].
2.3.3. Energy Consumption Electrical energy consumption and current efficiency are very important economical parameters in electrocoagulation process and calculated using the commonly used Eq-uation (3) [20]:
ECE = U.I.t (3)
where E is the electrical energy in kWh, U the cell voltage in volt (V), I the current in ampere (A) and tEC is the time of electrocoagulation process in hours.
The electrical energy consumption (EEC, kWh/m3) has been calculated with Equa-tion (4) [20]:
( )( )U.I.t
EEC =V
(4)
The electrodes consumption (EMC) has been calculated with Equation (5) [20]:
( )t.I.MEMC =
n.F.V (5)
Wher’s V is the volume of the treated water (m3), “n” number of electrons in oxida-tion/reduction reaction (n = 3), Faraday constant (F = 96.487 C/mol), Molecular weight of the Aluminum (g/mol).
2.3.4. Operation Cost It is well-known that the performance of an electrically driven process like electrocoa-gulation is dependent on electrical energy consumption which directly affects the oper-ating cost of the process. For electrocoagulation process the operating cost includes material, mainly electrodes and electrical energy costs, as well as labor, maintenance, sludge dewatering and disposal. In this preliminary economic investigation, energy and electrode material costs have been taken into account as major cost items in the calcu-

N. Barrak et al.
54
lation of the operating cost (US$/m3 of dye solution) (Equation (6)).
⋅ ⋅OC = a EEC + b EMC (6)
where, OC = Operating cost of water treatment (US$/m3 of waste water), EEC = elec-trical energy consumption (KWh/m3 of waste water), EMC = Electrode consumption (kg/m3 of waste water), a = industrial electrical energy price in Tunisia (US$/kWh) and b = wholesale electrode material price in Tunisia (US$/kg Al) for 2015 [20].
2.4. Response Surface Methodology (RSM)
The Box-Behnken design (BBD), an experimental design for Response Surface Metho-dology (RSM) is a useful statistical tool for the optimization of different processes and widely used for experimental design. In this method, the leading objective is to optim-ize the response surface that is influenced by different parameters. RSM also identified the relationship between the controllable input parameters and the response variable [21]. It is usually applied following a screening study to explore the region of interest of the factors identified by the preceding study [22].
3. Results & Discussion
The factors considered in this study are: NaCl concentration (g/l), Current Intensity (A) (or CD: Current Density) and initial concentration of dye (mg/l) whereas the expe-rimental result or the response to treat is the removed dye (CR(%)).
The Response Surface Methodology (RSM) as used experimental design the Box- Behnken, to determine the optimal experimental conditions for maximum color re-moval, minimum energy and electrode consumption, whose objective in view the mi-nimization of the operation cost (OC) minimum.
3.1. Response Regression Equation
The general behaviour of some phenomena in electrocoagulation can be simulated by a mathematical equation: this equation represents the regression model. Response sur-face methods are used to examine the relationship between one or more response va-riables and a set of quantitative experimental variables or factors [23]. The factors con-sidered in this study are: initial concentration of dye (12.310, 21.155 and 31.540 mg/l), NaCl concentration (1, 3.5 and 6 g/l) and current intensity (0.5, 1, 1.5 Ampere) (Table 1), where, the experimental result or the response to treat is the Color Removal (%).
There are many types of equations that can give a good correlation between parame-ters, but the choice of which one should be used is dependent of the R2 value of each model. The most appropriate regression model obtained for the response (CR(%)) is the following:
Equation I: a quadratic equation with interactions for CR(%) in Equation (7):
( ) ( ) ( ) ( )( ) ( ) ( )
( ) ( ) ( )
− −
− −2 2 2
2
CR % =112.2687 +22.1333 I 12.155 NaCl 33.0704 Dye
32.4167 I +0.9233 NaCl 24.7407 Dye
+2.2 I * NaCl +56 I * Dye +2.5333 NaCl * Dye ; R = 88.3%
(7)
N. Barrak et al.
55
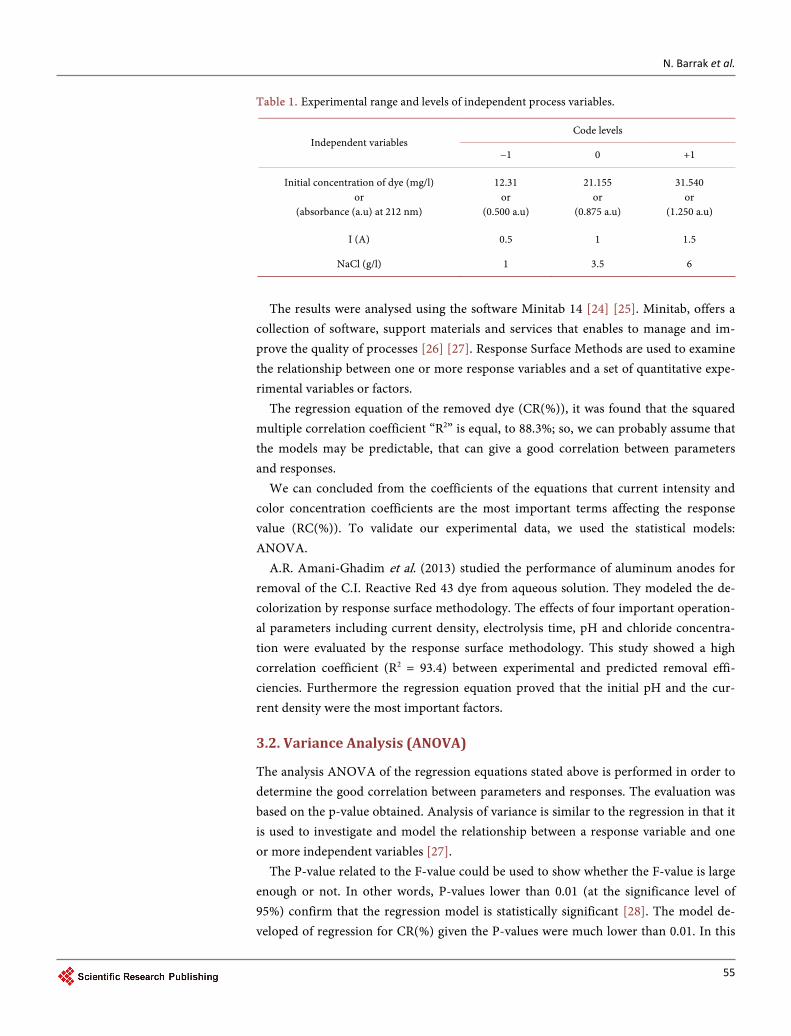
Table 1. Experimental range and levels of independent process variables.
Independent variables Code levels
−1 0 +1
Initial concentration of dye (mg/l) or
(absorbance (a.u) at 212 nm)
12.31 or
(0.500 a.u)
21.155 or
(0.875 a.u)
31.540 or
(1.250 a.u)
I (A) 0.5 1 1.5
NaCl (g/l) 1 3.5 6
The results were analysed using the software Minitab 14 [24] [25]. Minitab, offers a
collection of software, support materials and services that enables to manage and im-prove the quality of processes [26] [27]. Response Surface Methods are used to examine the relationship between one or more response variables and a set of quantitative expe-rimental variables or factors.
The regression equation of the removed dye (CR(%)), it was found that the squared multiple correlation coefficient “R2” is equal, to 88.3%; so, we can probably assume that the models may be predictable, that can give a good correlation between parameters and responses.
We can concluded from the coefficients of the equations that current intensity and color concentration coefficients are the most important terms affecting the response value (RC(%)). To validate our experimental data, we used the statistical models: ANOVA.
A.R. Amani-Ghadim et al. (2013) studied the performance of aluminum anodes for removal of the C.I. Reactive Red 43 dye from aqueous solution. They modeled the de-colorization by response surface methodology. The effects of four important operation-al parameters including current density, electrolysis time, pH and chloride concentra-tion were evaluated by the response surface methodology. This study showed a high correlation coefficient (R2 = 93.4) between experimental and predicted removal effi-ciencies. Furthermore the regression equation proved that the initial pH and the cur-rent density were the most important factors.
3.2. Variance Analysis (ANOVA)
The analysis ANOVA of the regression equations stated above is performed in order to determine the good correlation between parameters and responses. The evaluation was based on the p-value obtained. Analysis of variance is similar to the regression in that it is used to investigate and model the relationship between a response variable and one or more independent variables [27].
The P-value related to the F-value could be used to show whether the F-value is large enough or not. In other words, P-values lower than 0.01 (at the significance level of 95%) confirm that the regression model is statistically significant [28]. The model de-veloped of regression for CR(%) given the P-values were much lower than 0.01. In this

N. Barrak et al.
56
case, the related P-value is lower than 0.01, the regression will adequately be significant as the ANOVA results indicated. On the other hand, the sum of squares (SS) related to Residual Error is very less as compared to the total sum of squares. This confirms our hypothesis (Table 2).
Takes account of all considerations, we can assume, that a second order polynomial model with interaction allows properly explain the phenomenon studied for CR(%).
3.3. Contour Plot
Based on the results Response Surface Regression and Analysis of Variance (ANOVA), as concluded, that current density and initial concentration of dye were the most im-portant factors in electrocoagulation process for response (CR(%)).
Figure 2 shows that, when the decrease of current intensity with increase of color concentration was not suitable for the color removal. On the other hand, the effect of Table 2. Analysis of variance for the removal color (CR(%)).
Source Regression Linear Square Interaction Residual
Error Total
CR(%)
DF 9 3 3 3 20 29
SS 3102.4 1244.1 870.7 987.6 411.0 3513.4
MS 344.712 414.708 290.219 329.208 20.548
F 16.78 20.18 14.12 16.02
P 0.000 0.000 0.000 0.000
Figure 2. Contour plots of CR(%), for two most significant factors (color concentrations ex-pressed by the absorbance value at 612 nm (a.u)) and current intensity (I).
N. Barrak et al.
57
the increase of current intensity until to 1.25 A with decrease of color concentration was suitable for color removal. But the response of CR(%) decease wen the current in-tensity as higher than 1.25 A and the dye concentration was less than 13.85 mg/l.
3.4. Interactions Plot
An interaction between factors occurs when the change in response from the low level to the high level of one factor is different from the change in response at the same two levels of a second factor. In other words, binary interactions between factors presented statistically significant effect, which signifies that the effect of one independent factor on the response depends upon the other factor. Interactions plots could be used to compare the relative strength of the effects across factors.
The analysis of the interactions between the experimental factors studied is shown in Figure 3. The interaction between different factors is obvious for the color removed (CR(%)).
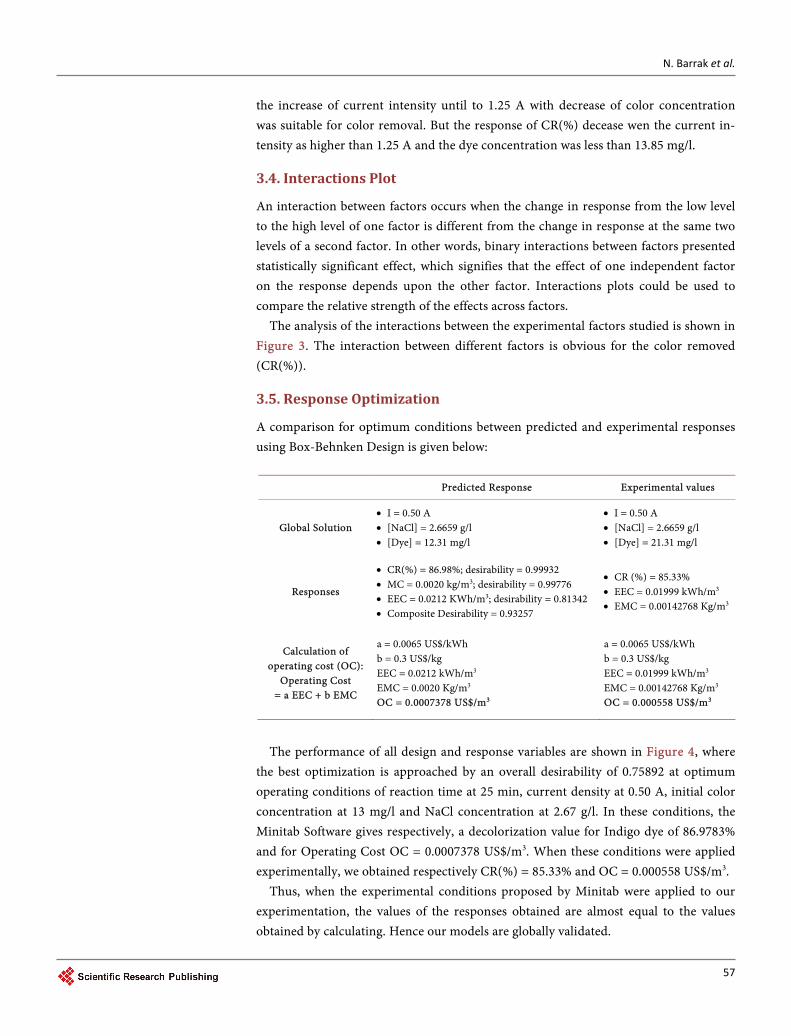
3.5. Response Optimization
A comparison for optimum conditions between predicted and experimental responses using Box-Behnken Design is given below:
Predicted Response Experimental values
Global Solution • I = 0.50 A • [NaCl] = 2.6659 g/l • [Dye] = 12.31 mg/l
• I = 0.50 A • [NaCl] = 2.6659 g/l • [Dye] = 21.31 mg/l
Responses
• CR(%) = 86.98%; desirability = 0.99932 • MC = 0.0020 kg/m3; desirability = 0.99776 • EEC = 0.0212 KWh/m3; desirability = 0.81342 • Composite Desirability = 0.93257
• CR (%) = 85.33% • EEC = 0.01999 kWh/m3 • EMC = 0.00142768 Kg/m3
Calculation of operating cost (OC):
Operating Cost = a EEC + b EMC
a = 0.0065 US$/kWh b = 0.3 US$/kg EEC = 0.0212 kWh/m3 EMC = 0.0020 Kg/m3 OC = 0.0007378 US$/m3
a = 0.0065 US$/kWh b = 0.3 US$/kg EEC = 0.01999 kWh/m3 EMC = 0.00142768 Kg/m3 OC = 0.000558 US$/m3
The performance of all design and response variables are shown in Figure 4, where
the best optimization is approached by an overall desirability of 0.75892 at optimum operating conditions of reaction time at 25 min, current density at 0.50 A, initial color concentration at 13 mg/l and NaCl concentration at 2.67 g/l. In these conditions, the Minitab Software gives respectively, a decolorization value for Indigo dye of 86.9783% and for Operating Cost OC = 0.0007378 US$/m3. When these conditions were applied experimentally, we obtained respectively CR(%) = 85.33% and OC = 0.000558 US$/m3.
Thus, when the experimental conditions proposed by Minitab were applied to our experimentation, the values of the responses obtained are almost equal to the values obtained by calculating. Hence our models are globally validated.

N. Barrak et al.
58
Figure 3. Analysis of interaction Plots of the Color Removed (CR(%), (where: “Dye: a.u; NaCl: g/l; I: A”).
Figure 4. Response optimization of color removal (CR%), Electrical Energy Consumption (EEC) and Electrodes Consumption (EMC).
A.R. Amani-Ghadima et al. (2013) obtained, when using electrocoagulation process
with aluminum anodes, a maximum removal efficiency equal to 98.90 of the C.I. Reac-tive Red 43 dye from aqueous solution. They achieved using the experimental optimum values of each studied factor, which was in a good conformity with the predicted values (99.99%).

N. Barrak et al.
59
4. Conclusions
Electrocoagulation was used to remove Indigo dye (leuco form), reduced in the indus-trial conditions of the SITEX. The effects of various operational parameters on dye re-moval efficiency were investigated. In this study, experimental conditions were opti-mized by observing the effects of interactions among the variables on color removal ef-ficiencies CR(%), using a response surface methodology (RSM). The RSM results dem-onstrated significant effects of two operating variables. Initial concentration of dye and current intensity were the most important factors in electrocoagulation, as well as their interactive effects. Box-Behnken design (BBD) was used to determine the optimal re-moval efficiency and operation cost.
High R2 value of 88.3% for color removal, through ANOVA, verified that the accu-racy of the proposed second-order regression model is acceptable. The maximum pre-dicted and experimental color removal were 86.98% and 85.33% respectively, using op-timized conditions of the current intensity (0.50 A), initial concentration of dye (12.31 mg/l) and NaCl concentration (2.67 g/l).
The optimized data for the economical removal of color at pH 8, inter electrodes distance of 7 mm, electrolysis time of 25 min and NaCl concentration of 2.67 g/l, were respectively 0.0007378 US$/m3 and 0.000558 US$/m3 for predicted and experimental values.
The optimal experimental values for the studied factors were in close agreement with those given by the model predictions (High R2 values and low P values). Our results imply that the Response Surface Methodology (RSM) with a Box-Behnken design (BBD) could be used to identify the most significant operating factors for decolorization of In-digo dye in the textile industrial wastewater during an electrocoagulation reaction.
References [1] Yang, C.L. and McGarrahan, J. (2005) Electrochemical Coagulation for Textile Effluent
Decolorization. Journal of Hazardous Materials, 127, 40-47. http://dx.doi.org/10.1016/j.jhazmat.2005.05.050
[2] Alinsafi, A., Khemis, M., Pons, M.N., Leclerc, J.P., et al. (2005) Electro-Coagulation of Reactive Textile Dyes and Textile Wastewater. Chemical Engineering and Processing, 44, 461-470. http://dx.doi.org/10.1016/S0255-2701(04)00153-9
[3] Kim, T.H., Park, C., Shin, E.B., et al. (2002) Decolorization of Disperse and Reactive Dyes Continuous Electrocoagulation Process. Desalination, 150, 165-175. http://dx.doi.org/10.1016/S0011-9164(02)00941-4
[4] Adhoum, N., Monser, L., Bellakhal, N., et al. (2004) Treatment of Electroplating Wastewa-ter Containing Cu2+, Zn2+ and Cr(VI) by Electrocoagulation. Journal of Hazardous Mate-rials, 112, 207-213.
[5] Ge, J., Qu, J., Lei, P., et al. (2004) New Bipolar Electrocoagulation-Electroflotation Process for the Treatment of Laundry Wastewater. Separation and Purification Technology, 36, 33- 39. http://dx.doi.org/10.1016/S1383-5866(03)00150-3
[6] Larue, O. and Vorobiev, E. (2003) Electrocoagulation and Coagulation by Iron of Latex Particles in Aqueous Suspensions. Separation and Purification Technology, 31, 177-192. http://dx.doi.org/10.1016/S1383-5866(02)00182-X

N. Barrak et al.
60
[7] Chen, X., Chen, G. and Yue, P.L. (2000) Separation of Pollutants from Restaurant Waste-water by Electrocoagulation. Separation and Purification Technology, 19, 65-76. http://dx.doi.org/10.1016/S1383-5866(99)00072-6
[8] Kobya, M., Senturk, E. and Bayramoglu, M. (2006) Treatment of Poultry Slaughterhouse Wastewaters by Electrocoagulation. Journal of Hazardous Materials, 133, 172-176.
[9] Kumar, P.R., Chaudhari, S., Khilar, K.C., et al. (2004) Operating Cost Analysis of Electro-coagulation of Textile Dye Wastewater. Separation and Purification Technology, 55, 1245- 1252.
[10] Bektas, N., Akbulut, H., Inan, H., et al. (2004) Removal of Phosphate from Aqueous Solu-tions by Electrocoagulation. Journal of Hazardous Materials, 106, 101-105.
[11] Murugananthan, M., Raju, G.B. and Prabhakar, S. (2004) Removal of Sulphide, Sulfate and Sulfite Ions by Electro Coagulation. Journal of Hazardous Materials, 109, 37-44. http://dx.doi.org/10.1016/j.jhazmat.2003.12.009
[12] Yilmaz, A.E., Boncukcuoglu, R., Kocakerim, M.M., et al. (2005) The Investigation of Para-meters Affecting Boron Removal by Electrocoagulation Method. Journal of Hazardous Ma-terials, 125, 160-165. http://dx.doi.org/10.1016/j.jhazmat.2005.05.020
[13] Pons, M.N., Alinsafi, A., Khemis, M., et al. (2005) Electro-Coagulation of Reactive Textile Dyes and Textile Wastewater. Chemical Engineering and Processing, 44, 461-470. http://dx.doi.org/10.1016/S0255-2701(04)00153-9
[14] Daneshvar, N., Ashassi-Sorkhabi, H. and Kasiri, M.B. (2004) Decolorization of Dye Solu-tion Containing Acid Red 14 by Electrocoagulation with a Comparative Investigation of Different Electrode Connections. Journal of Hazardous Materials, 112, 55-62. http://dx.doi.org/10.1016/j.jhazmat.2004.03.021
[15] Roessler, A. and Crettenand, D. (2004) Direct Electrochemical Reduction of Vat Dyes in a Fixed Bed of Graphite Granules. Dye and Pigments, 63, 29-37. http://dx.doi.org/10.1016/j.dyepig.2004.01.005
[16] Schlüter, H. (1990) Die vorteile der indanthrene farbstoffe als kriterium für ihre segment-pezifische anwendung. Textilveredlung, 63, 218-221.
[17] Kulandainathan, M.A., Patil, K., Muthukumaran, A., et al. (2007) Review of the Process Development Aspects of Electrochemical Dyeing: Its Impact and Commercial Applications. Coloration Technology, 123, 143-151. http://dx.doi.org/10.1111/j.1478-4408.2007.00082.x
[18] Oladegaragoze, A. and Djafarzadeh, N. (2006) Decolorization of Basic Dye Solutions by Electrocoagulation: An Investigation of the Effect of Operational Parameters. Journal of Hazardous Materials, 129, 116-122. http://dx.doi.org/10.1016/j.jhazmat.2005.08.033
[19] BasiriParsa, J., RezaeiVahidian, H., Soleymani, A.R., et al. (2011) Removal of Acid Brown 14 in Aqueous Media by Electrocoagulation: Optimization Parameters and Minimizing of Energy Consumption, Desalination, 278, 295-302. http://dx.doi.org/10.1016/j.desal.2011.05.040
[20] Ghosh, D., Medhi, C.R., Solanki, H., et al. (2008) Decolorization of Crystal Violet Solution by Electrocoagulation. Journal of Environmental Protection, 2, 25-35.
[21] Khataee, A.R., Zarei, M. and Moradkhannejhad, L. (2010) Application of Response Surface Methodology for Optimization of Azo Dye Removal by Oxalate Catalyzed Photoelectro- Fenton Process Using Carbon Nanotube-PTFE Cathode. Desalination, 258, 112-119. http://dx.doi.org/10.1016/j.desal.2010.03.028
[22] VasiliosSakkas, A., Azharul Islam, M., Stalikas, C., et al. (2010) Photocatalytic Degradation Using Design of Experiments: A Review and Example of the Congo Red Degradation. Journal of Hazardous Materials, 175, 33-44.

N. Barrak et al.
61
http://dx.doi.org/10.1016/j.jhazmat.2009.10.050
[23] Khuri, A.L. and Cornell, J.A. (1987) Response Surfaces: Designs and Analyses. Marcel Dekker Inc., New York.
[24] Shacham, M., Brauner, N. and Cutlip, M.B. (1995) Critical Analysis of Experimental Data, Regression Models and Regression Coefficients in Data Correlation. AIChE Symposium Se-ries, 91, 304-305.
[25] Winer, B.J. (1971) Statistical Principles in Experimental Design. 2nd Edition, McGraw-Hill, New York.
[26] D’Agostino, R.B. and Stephens, M.A. (1986) Goodness-of-Fit Techniques. Marcel Dekker, New York.
[27] Winer, B.J. (1971) Statistical Principles in Experimental Design. 2nd Edition, McGraw-Hill, New York.
[28] Kumar, M., Ponselvan, F.I.A., Malviya, J.R., et al. (2009) Treatment of Bio-Digester Effluent by Electrocoagulation Using Iron Electrodes. Journal of Hazardous Material, 165, 345-352. http://dx.doi.org/10.1016/j.jhazmat.2008.10.041
Submit or recommend next manuscript to SCIRP and we will provide best service for you:
Accepting pre-submission inquiries through Email, Facebook, LinkedIn, Twitter, etc. A wide selection of journals (inclusive of 9 subjects, more than 200 journals) Providing 24-hour high-quality service User-friendly online submission system Fair and swift peer-review system Efficient typesetting and proofreading procedure Display of the result of downloads and visits, as well as the number of cited articles Maximum dissemination of your research work
Submit your manuscript at: http://papersubmission.scirp.org/ Or contact [email protected]