Experimental and numerical investigations of a … · Experimental and numerical investigations of...
12
Experimental and numerical investigations of a pseudo- 2D spout fluidized bed with draft plates Sutkar, V.S.; Deen, N.G.; Salikov, V.; Antonyuk, S.; Heinrich, S.; Kuipers, J.A.M. Published in: Powder Technology DOI: 10.1016/j.powtec.2013.11.030 10.1016/j.powtec.2013.11.030 Published: 01/01/2015 Document Version Publisher’s PDF, also known as Version of Record (includes final page, issue and volume numbers) Please check the document version of this publication: • A submitted manuscript is the author's version of the article upon submission and before peer-review. There can be important differences between the submitted version and the official published version of record. People interested in the research are advised to contact the author for the final version of the publication, or visit the DOI to the publisher's website. • The final author version and the galley proof are versions of the publication after peer review. • The final published version features the final layout of the paper including the volume, issue and page numbers. Link to publication General rights Copyright and moral rights for the publications made accessible in the public portal are retained by the authors and/or other copyright owners and it is a condition of accessing publications that users recognise and abide by the legal requirements associated with these rights. • Users may download and print one copy of any publication from the public portal for the purpose of private study or research. • You may not further distribute the material or use it for any profit-making activity or commercial gain • You may freely distribute the URL identifying the publication in the public portal ? Take down policy If you believe that this document breaches copyright please contact us providing details, and we will remove access to the work immediately and investigate your claim. Download date: 05. Aug. 2018
Transcript of Experimental and numerical investigations of a … · Experimental and numerical investigations of...
Experimental and numerical investigations of a pseudo-2D spout fluidized bed with draft platesSutkar, V.S.; Deen, N.G.; Salikov, V.; Antonyuk, S.; Heinrich, S.; Kuipers, J.A.M.
Published in:Powder Technology
DOI:10.1016/j.powtec.2013.11.03010.1016/j.powtec.2013.11.030
Published: 01/01/2015
Document VersionPublisher’s PDF, also known as Version of Record (includes final page, issue and volume numbers)
Please check the document version of this publication:
• A submitted manuscript is the author's version of the article upon submission and before peer-review. There can be important differencesbetween the submitted version and the official published version of record. People interested in the research are advised to contact theauthor for the final version of the publication, or visit the DOI to the publisher's website.• The final author version and the galley proof are versions of the publication after peer review.• The final published version features the final layout of the paper including the volume, issue and page numbers.
Link to publication
General rightsCopyright and moral rights for the publications made accessible in the public portal are retained by the authors and/or other copyright ownersand it is a condition of accessing publications that users recognise and abide by the legal requirements associated with these rights.
• Users may download and print one copy of any publication from the public portal for the purpose of private study or research. • You may not further distribute the material or use it for any profit-making activity or commercial gain • You may freely distribute the URL identifying the publication in the public portal ?
Take down policyIf you believe that this document breaches copyright please contact us providing details, and we will remove access to the work immediatelyand investigate your claim.
Download date: 05. Aug. 2018
Powder Technology 270 (2015) 537–547
Contents lists available at ScienceDirect
Powder Technology
j ourna l homepage: www.e lsev ie r .com/ locate /powtec
Experimental and numerical investigations of a pseudo-2D spoutfluidized bed with draft plates
Vinayak S. Sutkar a, Niels G. Deen a,⁎, Vitalij Salikov b, Sergiy Antonyuk b, Stefan Heinrich b, J.A.M. Kuipers a
a Multiphase Reactors Group, Department of Chemical Engineering and Chemistry, Eindhoven University of Technology, P.O. Box 513, 5600 MB Eindhoven, The Netherlandsb Institute of Solids Process Engineering and Particle Technology, Hamburg University of Technology, 21071 Hamburg, Germany
⁎ Corresponding author.E-mail address: [email protected] (N.G. Deen).
0032-5910/$ – see front matter © 2013 Elsevier B.V. All rihttp://dx.doi.org/10.1016/j.powtec.2013.11.030
a b s t r a c t
a r t i c l e i n f oAvailable online 2 December 2013
Keywords:Spout fluidized bedsDraft platesFlow regime mapParticle image velocimetryDigital image analysisDiscrete particle model and sub grid scale
Spout fluidized beds are often utilized for gas-solid contacting operations involving physical and/or chemicaltransformationswith simultaneous heat andmass transfer such as drying, coating, granulation, combustion, gas-ification etc. This is because these beds combine advantages of both spouted and fluidized beds. Since the devel-opment of the spout fluidized bed, several geometrical modifications have been proposed to optimize the bedperformance. One of these modifications often applied in granulation and coating industries includes a drafttube insertion inside the bed,which results in improved performance by providing a restriction on lateral particleflow providing clear distinction for wet spout and dry annulus zones. Moreover, the insertion of the draft tubeleads to a stable spouting at lower flow rates, due to the reduced bypassing of the inlet gas (from spout toannulus).In this work, the hydrodynamic characteristics of a spout fluidized bed with draft plates was studied to identifythe flow characteristics by constructing a flow regimemap by image analysis and a fast Fourier transform of themeasured pressure signal. In addition, the captured images were used to determine the particle velocity via par-ticle image velocimetry (PIV). Furthermore, simulations were carried using a discrete particle model with a subgrid scale turbulence model for two regimes, namely the spouting-with-aeration and fluidized bed-spouting-with-aeration (dispersed spout), which are of most interest from an industrial view point. The obtained resultswere compared with previously obtained experimental data i.e. PIV. This study highlights various flow patternobserved during operation of spout fluidized bed with a draft plate over a wider operating conditions, which isuseful to select proper operating conditions; whereas the experimental data can be used for computationalfluid dynamic (CFD) model validation, which serve as a building block for design and scale-up at higher opera-tional scales. Besides this, the quantitative information such as particle velocity, residence time distribution,solid mixing and circulation can be obtained after suitable post processing hence useful in optimizing the bedperformance.
© 2013 Elsevier B.V. All rights reserved.
1. Introduction
Spout fluidized beds are often applied for gas-solid contacting oper-ations involving physical and chemical transformations such as drying,coating, granulation, combustion and gasification. This is becausethese beds combine features from both spouted and fluidized beds.Moreover, intense gas–solid contact leads to efficient heat andmass ex-change. Additionally, spout fluidized beds can be operated for coarseparticles with wide size distributions. Since the development of thespout fluidized bed [1], a number of modifications were suggested toimprove its performance. These modifications involved different geo-metrical configurations such as rectangular [2], conical bottom [3,4],slotted rectangular, multiple and elevated spout fluidized beds [5,6].One of the significantmodifications includes insertion of a draft tube in-side the bed, which results in improved performance by restricting the
ghts reserved.
particle cross flow. Moreover, a draft insertion tube results in stablespouting at lower flow rates, due to the reduced bypassing of the inletgas (from spout to annulus). This is evident from the experimentalstudy on spouted beds with and without draft tube by [7]. They ob-served a lower minimum spout velocity for a bed with a draft tube,which leads to lower energy consumption to achieve the same spoutingcharacteristics as in a system without a draft tube. Claflin and Fane [8]imply that in conventional spouted beds, particles enter the spout chan-nel from the annulus at various heights, leading to random particle be-havior. Furthermore, additional flexibility in the maximum spoutableheight without disturbing the stable spouting can be successfullyachieved. Additionally, the insertion of a draft tube in a spout fluidizedbed provides flexibility to control the particle velocity, bed porosityand gas phase residence time by adjusting operating parameters andgeometrical configurations such as the entrainment height and thedraft tube dimension.
A detailed understanding of the bed dynamicswith flow transition isof primary importance for design and scale-up. This can be either
x
z
y
65 65
455
x
y
D = 20
W = 140
H = 1000
h
320Background Spout
Draft plate
Background
Background gas supply
Background gas supply
Spout gas supply
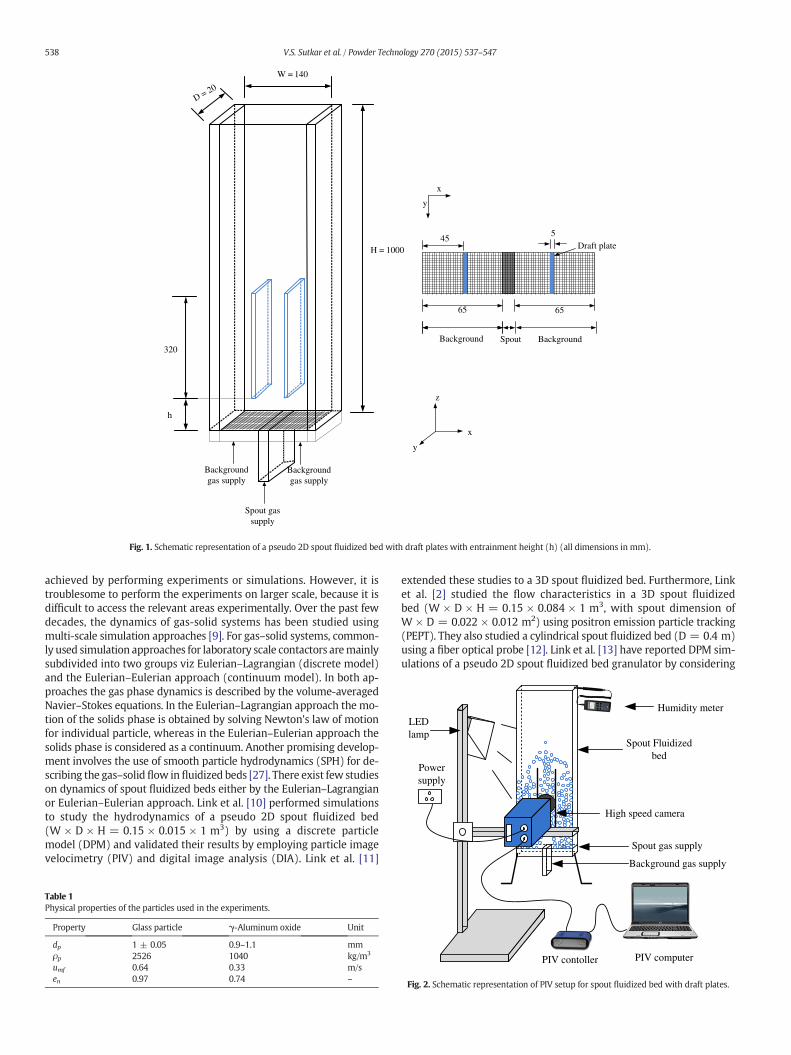
Fig. 1. Schematic representation of a pseudo 2D spout fluidized bed with draft plates with entrainment height (h) (all dimensions in mm).
Power supply
LED lamp
High speed camera
Humidity meter
Spout Fluidized bed
Spout gas supply
Background gas supply
538 V.S. Sutkar et al. / Powder Technology 270 (2015) 537–547
achieved by performing experiments or simulations. However, it istroublesome to perform the experiments on larger scale, because it isdifficult to access the relevant areas experimentally. Over the past fewdecades, the dynamics of gas-solid systems has been studied usingmulti-scale simulation approaches [9]. For gas–solid systems, common-ly used simulation approaches for laboratory scale contactors aremainlysubdivided into two groups viz Eulerian–Lagrangian (discrete model)and the Eulerian–Eulerian approach (continuum model). In both ap-proaches the gas phase dynamics is described by the volume-averagedNavier–Stokes equations. In the Eulerian–Lagrangian approach the mo-tion of the solids phase is obtained by solving Newton's law of motionfor individual particle, whereas in the Eulerian–Eulerian approach thesolids phase is considered as a continuum. Another promising develop-ment involves the use of smooth particle hydrodynamics (SPH) for de-scribing the gas–solidflow in fluidized beds [27]. There exist few studieson dynamics of spout fluidized beds either by the Eulerian–Lagrangianor Eulerian–Eulerian approach. Link et al. [10] performed simulationsto study the hydrodynamics of a pseudo 2D spout fluidized bed(W × D × H = 0.15 × 0.015 × 1 m3) by using a discrete particlemodel (DPM) and validated their results by employing particle imagevelocimetry (PIV) and digital image analysis (DIA). Link et al. [11]
Table 1Physical properties of the particles used in the experiments.
Property Glass particle γ-Aluminum oxide Unit
dp 1 ± 0.05 0.9–1.1 mmρp 2526 1040 kg/m3
umf 0.64 0.33 m/sen 0.97 0.74 –
extended these studies to a 3D spout fluidized bed. Furthermore, Linket al. [2] studied the flow characteristics in a 3D spout fluidizedbed (W × D × H = 0.15 × 0.084 × 1 m3, with spout dimension ofW × D = 0.022 × 0.012 m2) using positron emission particle tracking(PEPT). They also studied a cylindrical spout fluidized bed (D = 0.4 m)using a fiber optical probe [12]. Link et al. [13] have reported DPM sim-ulations of a pseudo 2D spout fluidized bed granulator by considering
PIV computerPIV contoller
Fig. 2. Schematic representation of PIV setup for spout fluidized bed with draft plates.

539V.S. Sutkar et al. / Powder Technology 270 (2015) 537–547
the effect of additional liquid injection. Deng et al. [14] have developed amodel to study the coal gasification in a pressurized 3D spout fluidizedbed. Zhong et al. [3] numerically studied the hydrodynamics in a rectan-gular spout fluidized bed using an Eulerian–Lagrangian approach.Zhong et al. [15] have determined the flow patterns in a large scalespout fluidized bed (D × H = 1 × 6 m2) at high pressure and temper-ature using an Eulerian–Eulerian approach including a turbulencemodel. Zhang et al. [16] studied the mixing behavior of the particles ina flat bottom spout fluidized bed using an Eulerian–Lagrangianapproach, where the turbulence in the gas phase was modeled with ak-ε model. Van Buijtenen et al. [17] studied the effect of the inter-particle interactions on the spout fluidized bed dynamics, by consider-ing different values of the restitution coefficient. This study revealedthat a decrease in the restitution coefficient results in the formation ofbubbles causes more pronounced heterogeneity (instability) in theoverall flow structure of the bed, which significantly depend on thespout and background velocities. In addition, they have performedsimulations by extending the DPM to study the effect of inter-particleinteraction with a variable restitution coefficient under wet conditions(with additional liquid injection, see [17]). Also, van Buijtenen et al.[18] performed experimental investigations to analyze the effect of var-iation in the collision properties using three particle types namely glass,γ-aluminum oxide and zeolite 4A on dynamics of a spout fluidized bed.
Even though simulations offer a platform that can be used to obtainbetter insight, it is necessary to validate themodel prediction before themodel can be confidently applied for the design and scale-up. The effica-cy of the developed model to predict the dynamics of the real systemcanbe achievedby comparingmodel resultswith experimental data ob-tained with non-intrusive techniques. The experimental studies report-ed in the literature [6,25] generally include the determination of theparticle velocity by PIV, PEPT and solid volume fraction by DIA and elec-trical capacitance tomography (ECT).
The current study aims at constructing aflow regimemap for a pseu-do 2D spout fluidized bed with a draft tube (from now on we will referto this as draft plates) with the aid of high speed image analysis andmeasuring the bed pressure drop. The time-dependent pressure signalswere converted into the frequency domain using a Fast Fourier transfor-mation (FFT). Depending on the magnitude of the mean driving fre-quency and events, identical particulate flow patterns were groupedto form a particular regime, which is designated using the same termi-nology as reported in [19]. The flow regime map can be used to selectproper operating conditions; whereas the experimental data can beused for computational fluid dynamic (CFD) model validation, whichserve as a building block for design and scale-up at higher operationalscales. Besides this, the quantitative information such as particle veloc-ity, residence time distribution, solid mixing and circulation can be ob-tained after suitable post processing hence useful in optimizing thebed performance. Moreover, numerical investigations were performedto determine the dynamics of a pseudo 2D spout fluidized bed withdraft plates, by considering two regimes, viz. the spouting-with-aeration and fluidized bed-spouting-with-aeration (dispersed spout)using a discrete particle model. The obtained results are comparedwith experimental PIV data.
2. Experimental investigations
The dynamics of a spout fluidized bed with draft plates was deter-mined by capturing high speed images, which are utilized for identify-ing the flow patterns and measuring the particle velocity. In thissection, we introduce the experimental setup including brief explana-tions of the pressure measurement technique and PIV.
2.1. Experimental set up
Experiments were conducted in a pseudo 2D spout fluidized bed ofdimension W × D × H = 0.14 × 0.02 × 1 m3, as shown in Fig. 1 with
a spout dimension of Wsp × Dsp = 0.01 × 0.02 m2. The front wall ofthe bed consists of a glass plate to enable visual observation and theback wall was made of anodized aluminum. Moreover, two draft plateseach of dimension Wdt × Ddt × Hdt = 0.005 × 0.02 × 0.32 m3 werelocated in the bed at a distance of 0.045 m from the side wall whereasthe entrainment height (h) could be varied in the range of 0.03 to0.05 m from the distributor plate. Pressurized air was fed to the bedvia three sections at flow rates up to 150 m3/h. Electrostatic forces be-tween particles were minimized by maintaining the relative humidityof the inlet air approximately equal to 90%. Digital images were record-ed using a high speed camera (LaVision Imager pro HS). Reflectionsoccurring during the recording were minimized using LED lamps, illu-minating the bed at an angle of 45°. Pressure fluctuations were mea-sured using two pressure sensors located in the spout and annulus.Experiments were performed using two types of particles namelyglass and γ-aluminum oxide. The physical properties are given inTable 1.
2.2. Pressure measurements
In this study, pressure measurements were done using sensors lo-cated at the backside of the bed, whichwere connected through a signalconvertor to a computer. The signals were recorded for 4 min, with50 Hz data acquisition rate. For each inlet flow condition, the imageswere recorded and measured pressure signals were transformed intoan amplitude–frequency domain. The change in the dominant frequen-cy was used as a basis to quantify the flow regime. The obtained resultsfor the pressure fluctuations and FFT distributions are summarized inTable 7.
2.3. Particle image velocimetry (PIV)
Particle image velocimetry (PIV) is a non-intrusive measurementtechnique, which provides information about the average particle dis-placement. This technique can beused to determine the average particledisplacement in pseudo 2D beds. The bed depth is kept sufficiently largeto prevent particle bridging from wall.
In PIV, two subsequent images with a small time interval(Δt) werecaptured and subdivided into interrogation areas depending on theavailable resolution and cross-correlation was applied to determinethe volume average particle displacement (sp). The particle velocity ineach interrogation area is determined by:
vp x; tð Þ ¼ spMΔt
ð1Þ
where M is the image magnification factor and Δt is the time interval,which is maintained sufficiently small. During recording, Δt = 1 mswas used and image pairs were recorded at 10 Hz frequency. The expo-sure time was adjusted depending on the light intensity and the dis-tance between the camera and the bed. A schematic representation ofthe PIV setup is shown in Fig. 2. Post-processing was done in DaVis8.0.3, by setting the interrogation area of 64 × 64 pixels with 50% over-lap and by applying a geometricmask at the draft plate location. Outlierswere removed by using a median filter. For the calculation of the time-averaged particle velocity fields we used 4000 image pairs.
3. Numerical investigations
3.1. Model equations
The model equations (Eqs. (2)–(9)) used in this work are summa-rized in Table 2. For the gas phase we solve the volume-averagedNavier–Stokes equations (Eqs. (2) and (3)), whereas for each of the par-ticles we solve the equations of motion (Eqs. (6)–(8)).

Table 2Model equations used for numerical investigations of spout fluidized bed.
Gas phaseContinuity equation: ∂
∂t εgρg
� �þ∇ � εgρgug
� �¼ 0 Eq.(2)
Momentum balance equation:∂∂t εgρgug
� �þ∇ � εgρgugug
� �¼ −εg∇pg−∇ � εgτg
� �−Sp þ εgρgg
Eq.(3)
Source term: Sp ¼ 1Vcell
∫∑Npart
i¼1
βVp
1−εgug−vp� �
δ r−rp� � Eq.(4)
Equation of the state: pg ¼ ρgRTMavg
Eq.(5)
Solid phaseTranslation momentum equation:
mpdvp
dt ¼ ∑contact list
Fab;n þ Fab;t� �
|fflfflfflfflfflfflfflfflfflfflfflfflfflfflfflfflfflfflfflffl{zfflfflfflfflfflfflfflfflfflfflfflfflfflfflfflfflfflfflfflffl}contact forces
þFgravitational;a þ Fdrag;a|fflfflfflfflfflfflfflfflfflfflfflfflfflfflfflfflfflffl{zfflfflfflfflfflfflfflfflfflfflfflfflfflfflfflfflfflffl}external forces
Eq.(6)
Rotational momentum equation: Ipdωp
dt ¼ Tp Eq.(7)
Torque on particle Tp ¼ ∑contact list
Ranab×Fab;t� �
Eq.(8)
Inter-phase momentum transfer coefficient (β)Beetstra et al. [20]
βBeetstra ¼ Aμg
dp2
1−εgð Þ2εg
þ Bμg
dp2 1−εg� �
Rep
A ¼ 180þ 18 ε4g1−εg
1þ 1:5ffiffiffiffiffiffiffiffiffiffiffiffi1−εg
p� �B ¼ 0:31 ε−1
g þ3 1−εgð Þεgþ8:4 Re−0:343pð Þ
1þ103 1−εgð ÞRe 2εg−2:5ð Þp
Eq.(9)
540 V.S. Sutkar et al. / Powder Technology 270 (2015) 537–547
The turbulence generated by the high velocity spout was modeledusing the sub-grid scale (SGS) turbulence model proposed in [21]. Thismodel can handle both transitional and turbulent flow, in the vicinity
Particle Flow cell Wall ce
Regular mapping cube
Regular mapping cube
Fig. 3. Representation of the mapping window at
of walls. Also, this model does not involve explicit filtering, averagingor other clipping procedures. The shear induced turbulent viscosity inthis model is given by:
μ tur ¼ cρg
ffiffiffiffiffiffiffiffiffiffiffiBβ
αijαij
s¼ 2:5C2
sρg
ffiffiffiffiffiffiffiffiffiffiffiBβ
αijαij
sð10Þ
Bβ ¼ β11β22−β212 þ β11β33−β2
13 þ β22β33−β223
βij ¼ Δ2mαmiαmj
αij ¼ ∂iu j ¼∂uj
∂xi
ð11Þ
here Δm is the local filter width. The model constant c is related to theSmagorinsky constant Cs ([22]) by: c ≈ 2.5 Cs
2. The symbol α standsfor the (3 × 3) matrix of the derivatives of the filtered velocity ug.
3.2. Inter-phase coupling and internal wall treatment
A proper selection of the Eulerian grid size and the associated func-tion to map parameters between the Eulerian grid and the Lagrangianparticle positions is of key importance in DPM simulations. Transferof properties between the Eulerian and Lagrangian positions canbe achieved by mapping functions as described in more detail in[23–25].
In this study, the simulations were carried by considering an ap-proach proposed in [25]. In this approach, each particle is representedby a porous cube,with a size equal to, where ‘a’ is the ratio of cube diam-eter to particle diameter. During this study, simulationswere carried for
ll Weighing factor
2x
2x4x
2x
Folded mapping cube
Folded mapping cube
1x 2x 4x
the boundaries of the computational domain.

Particle Flow cell Wall cell Weighing factor
Regular mapping cube Folded mapping cube
1x 2x 4x
1x2x
4x 2x
2x
Fig. 4. Representation of the mapping window near the corner of an internal wall.
Ny
Ny+1 57
3
3
3
3
3
3
3
3
3
3
3
3
3
3
5 5 5 5 5 5 5 5 5 5 5
8
8
8
8
8
8
8
8
8
8
8
8
8
8
8
8
8
8
8
8
7
541V.S. Sutkar et al. / Powder Technology 270 (2015) 537–547
mapping window of size equal to 5 times the particle diameter. Theporosity of the cube can be calculated from:
εcube ¼Vp
Vcube¼ π
6a3: ð12Þ
In general, variables from the Eulerian grid (ϕE) are mapped to theLagrangian positions (ϕL) and vice versa using:
ϕE ¼ Vcell
X∀ i ∈cell
f icellϕL
Við13Þ
ϕL ¼1
Vcube
X∀ j ∈cube
f cubej V j ϕE ð14Þ
fjcube is the volume fraction of cell j occupied by the cube and fcell
i isthe volume fraction of cell i occupied by the cube. For particlesclose to a wall the mapping function is folded back into the simula-tion domain, as illustrated in Fig. 3. For the simulation of a spout flu-idized bed with draft plates, a similar approach as proposed by [25]has been applied for the internal walls. However, cells in the vicinityof corners of internal walls are folded around both walls, as illustrat-ed in Fig. 4.
Internal walls inside the bed are defined using a flagmatrix concept,which offers the flexibility to define different boundary conditions byassigning a specific value to the cell flag. These cell flagswere associatedwith relevant information about the boundary condition.More informa-tion about the flag matrix concept can be found in [23].
In this simulation, no-slip boundary conditions were defined for in-ternal walls by setting the tangential velocity inside the wall equal tothat outside the wall, however with an opposite sign. Furthermore,
Table 3Cell flag values for the boundary conditions.
Fl (i, j, k) Type of cell
1 Interior cell, no boundary conditions to be specified2 Symmetry boundary condition, free slip boundaries3 Impermeable wall, no-slip boundaries4 Fluid phase influx cell, velocities have to be specified5 Prescribed pressure cell, free slip boundaries6 Continuous outflow cell, free slip boundaries7 Corner cell, no boundary conditions have to be specified8 Internal wall, no slip boundaries
collisions between the particles and an internal wall were treated inthe same manner as those with external walls. Collisions of particleson a corner of an internal wall were treated on the basis of the particlecenter of mass. A particle with its center of mass below the diagonalline will collide with the side surface of the wall, whereas a particlewith its center of mass above the diagonal line will collide with thetop surface.
An overview of various boundary conditions used in DPM simula-tions can be found in Table 3. In this study the simulations were per-formed by applying the no-slip conditions at the side walls, whereasthe bottom wall was set as an inflow boundary. The draft plates weremodeled as internal walls with no-slip conditions. Fig. 5 illustrates theboundary conditions used in our simulations.
3.3. Test cases
Simulations were performed for a pseudo 2D spout fluidized bedshown in Fig. 1. We varied the spout and background velocities and
0 1 2 Nx+1Nx
0
1
2
7 7
3
3
3
3
3
3
3
3
3
3
4 4 4 4 4 4 4 4 4 4 4
8
8
8
8
8
8
8
8
8
8
8
8
4
Fig. 5. Boundary condition implemented using flag matrix concept.
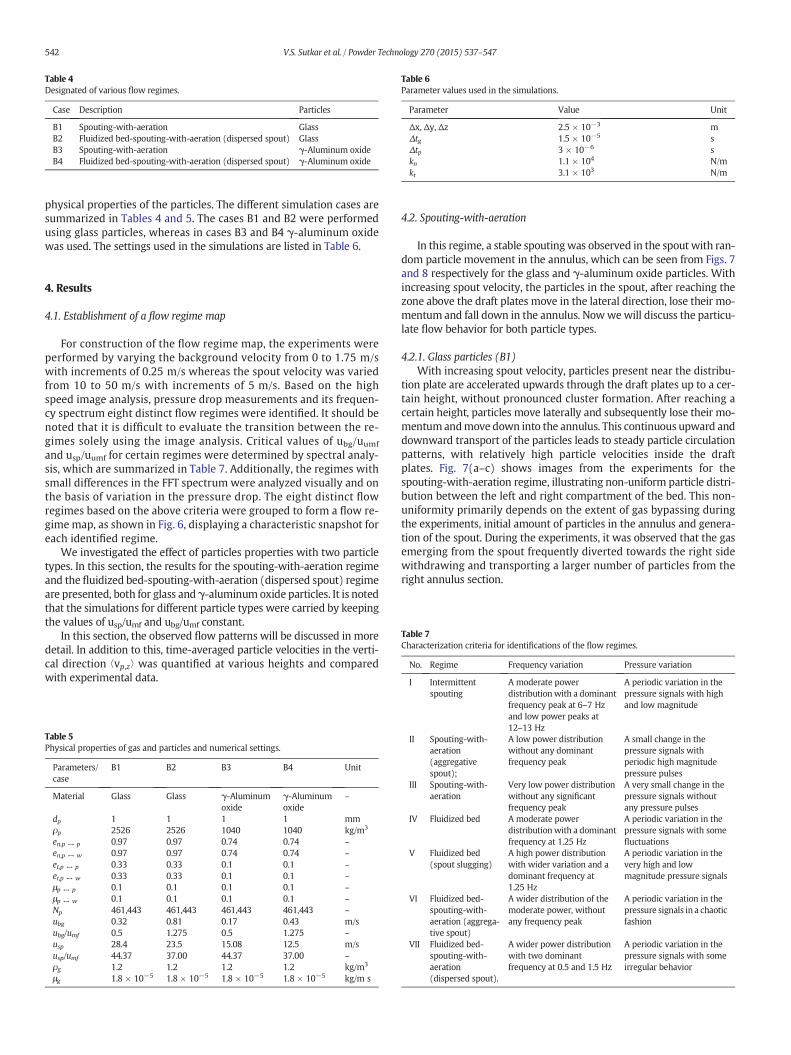
Table 4Designated of various flow regimes.
Case Description Particles
B1 Spouting-with-aeration GlassB2 Fluidized bed-spouting-with-aeration (dispersed spout) GlassB3 Spouting-with-aeration γ-Aluminum oxideB4 Fluidized bed-spouting-with-aeration (dispersed spout) γ-Aluminum oxide
Table 6Parameter values used in the simulations.
Parameter Value Unit
Δx, Δy, Δz 2.5 × 10⁻³ mΔtg 1.5 × 10⁻⁵ sΔtp 3 × 10⁻⁶ skn 1.1 × 10⁴ N/mkt 3.1 × 10³ N/m
542 V.S. Sutkar et al. / Powder Technology 270 (2015) 537–547
physical properties of the particles. The different simulation cases aresummarized in Tables 4 and 5. The cases B1 and B2 were performedusing glass particles, whereas in cases B3 and B4 γ-aluminum oxidewas used. The settings used in the simulations are listed in Table 6.
Table 7Characterization criteria for identifications of the flow regimes.
No. Regime Frequency variation Pressure variation
I Intermittent A moderate power A periodic variation in the
4. Results
4.1. Establishment of a flow regime map
For construction of the flow regime map, the experiments wereperformed by varying the background velocity from 0 to 1.75 m/swith increments of 0.25 m/s whereas the spout velocity was variedfrom 10 to 50 m/s with increments of 5 m/s. Based on the highspeed image analysis, pressure drop measurements and its frequen-cy spectrum eight distinct flow regimes were identified. It should benoted that it is difficult to evaluate the transition between the re-gimes solely using the image analysis. Critical values of ubg/uumf
and usp/uumf for certain regimes were determined by spectral analy-sis, which are summarized in Table 7. Additionally, the regimes withsmall differences in the FFT spectrum were analyzed visually and onthe basis of variation in the pressure drop. The eight distinct flowregimes based on the above criteria were grouped to form a flow re-gime map, as shown in Fig. 6, displaying a characteristic snapshot foreach identified regime.
We investigated the effect of particles properties with two particletypes. In this section, the results for the spouting-with-aeration regimeand the fluidized bed-spouting-with-aeration (dispersed spout) regimeare presented, both for glass and γ-aluminum oxide particles. It is notedthat the simulations for different particle types were carried by keepingthe values of usp/umf and ubg/umf constant.
In this section, the observed flow patterns will be discussed in moredetail. In addition to this, time-averaged particle velocities in the verti-cal direction ⟨vp,z⟩ was quantified at various heights and comparedwith experimental data.
Table 5Physical properties of gas and particles and numerical settings.
Parameters/case
B1 B2 B3 B4 Unit
Material Glass Glass γ-Aluminumoxide
γ-Aluminumoxide
–
dp 1 1 1 1 mmρp 2526 2526 1040 1040 kg/m3
en,p ↔ p 0.97 0.97 0.74 0.74 –
en,p ↔ w 0.97 0.97 0.74 0.74 –
et,p ↔ p 0.33 0.33 0.1 0.1 –
et,p ↔ w 0.33 0.33 0.1 0.1 –
μp ↔ p 0.1 0.1 0.1 0.1 –
μp ↔ w 0.1 0.1 0.1 0.1 –
Np 461,443 461,443 461,443 461,443 –
ubg 0.32 0.81 0.17 0.43 m/subg/umf 0.5 1.275 0.5 1.275 –
usp 28.4 23.5 15.08 12.5 m/susp/umf 44.37 37.00 44.37 37.00 –
ρg 1.2 1.2 1.2 1.2 kg/m3
μg 1.8 × 10⁻⁵ 1.8 × 10⁻⁵ 1.8 × 10⁻⁵ 1.8 × 10⁻⁵ kg/m s
4.2. Spouting-with-aeration
In this regime, a stable spoutingwas observed in the spout with ran-dom particle movement in the annulus, which can be seen from Figs. 7and 8 respectively for the glass and γ-aluminum oxide particles. Withincreasing spout velocity, the particles in the spout, after reaching thezone above the draft plates move in the lateral direction, lose their mo-mentum and fall down in the annulus. Nowwewill discuss the particu-late flow behavior for both particle types.
4.2.1. Glass particles (B1)With increasing spout velocity, particles present near the distribu-
tion plate are accelerated upwards through the draft plates up to a cer-tain height, without pronounced cluster formation. After reaching acertain height, particles move laterally and subsequently lose their mo-mentumandmove down into the annulus. This continuous upward anddownward transport of the particles leads to steady particle circulationpatterns, with relatively high particle velocities inside the draftplates. Fig. 7(a–c) shows images from the experiments for thespouting-with-aeration regime, illustrating non-uniform particle distri-bution between the left and right compartment of the bed. This non-uniformity primarily depends on the extent of gas bypassing duringthe experiments, initial amount of particles in the annulus and genera-tion of the spout. During the experiments, it was observed that the gasemerging from the spout frequently diverted towards the right sidewithdrawing and transporting a larger number of particles from theright annulus section.
spouting distributionwith a dominantfrequency peak at 6–7 Hzand low power peaks at12–13 Hz
pressure signals with highand low magnitude
II Spouting-with-aeration(aggregativespout);
A low power distributionwithout any dominantfrequency peak
A small change in thepressure signals withperiodic high magnitudepressure pulses
III Spouting-with-aeration
Very low power distributionwithout any significantfrequency peak
A very small change in thepressure signals withoutany pressure pulses
IV Fluidized bed A moderate powerdistributionwith a dominantfrequency at 1.25 Hz
A periodic variation in thepressure signals with somefluctuations
V Fluidized bed(spout slugging)
A high power distributionwith wider variation and adominant frequency at1.25 Hz
A periodic variation in thevery high and lowmagnitude pressure signals
VI Fluidized bed-spouting-with-aeration (aggrega-tive spout)
A wider distribution of themoderate power, withoutany frequency peak
A periodic variation in thepressure signals in a chaoticfashion
VII Fluidized bed-spouting-with-aeration(dispersed spout).
A wider power distributionwith two dominantfrequency at 0.5 and 1.5 Hz
A periodic variation in thepressure signals with someirregular behavior

(Ubg/Umf = 0.5,Usp/Umf = 44 .37)
(Ubg/Umf = 1.26 ,Usp/Umf = 36 .71)
Intermittent spouting
II.
Fluidized bed (slugging spout)VI.
Fluidized bed- spouting-with- aeration (dispersed spout)
VIII.
Spouting with aeration (aggregative spout)
III.
Spouting with aeration
IV.
Fluidized bed-spouting-with- aeration (aggregative spout)
VII.
Fixed bedI. Fluidized bedV.
Fig. 6. Flow regime map for a glass particles in a spout fluidized bed with an entrainment height of h = 0.03 m, and a static bed aspect ratio of H0/W = 1.
543V.S. Sutkar et al. / Powder Technology 270 (2015) 537–547
Similar circulatory behavior was observed during simulations (seeFig. 7(d–g)). However, during the simulationsmore homogenous parti-cle distributionswere observed in the annulus as comparedwith the ex-perimental findings. This is because the particles near the distributionplate offers uniform static load on incoming gas, without any deviationin the spout. But, after reaching a quasi-steady condition (at simulationtime t = 7.5 s) non-uniformity in the particle distribution can be clear-ly seen from Fig. 7g.
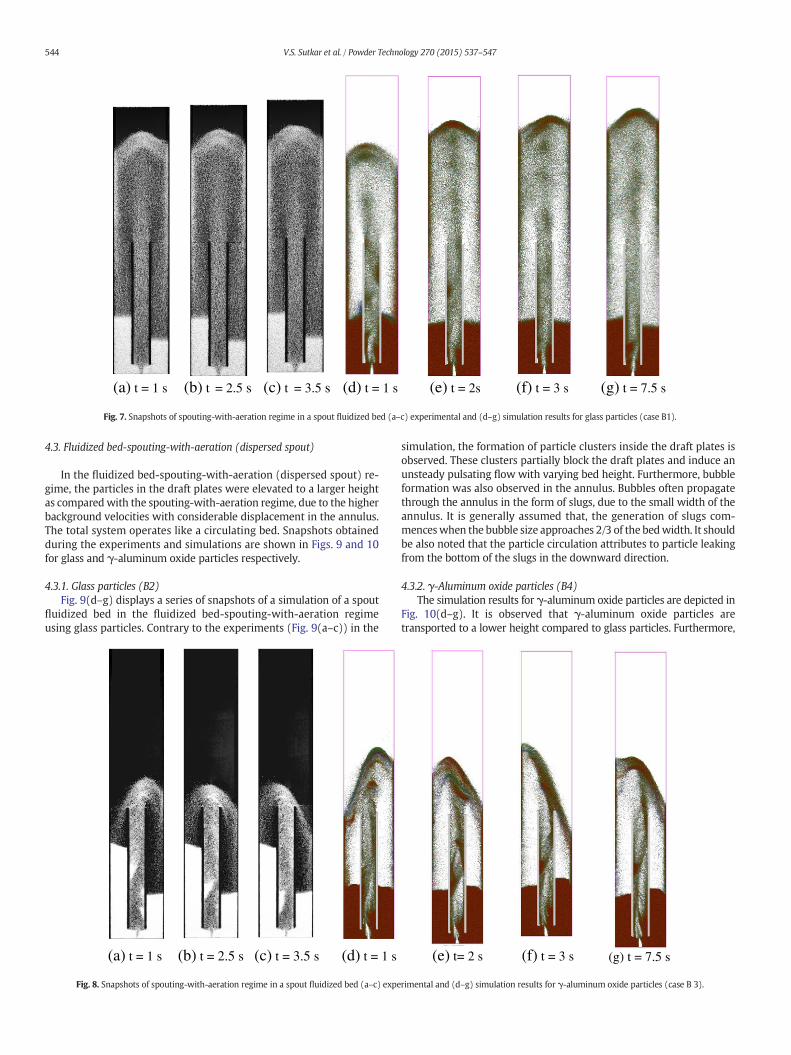
4.2.2. γ-Aluminum oxide particles (B3)For the γ-aluminum oxide particles, similar circulation patterns
were observed as for the glass particles. Fig. 8(a–c) and (d–g) showssnapshots obtained from the experiments and the simulation respec-tively. From these snapshots the formation of particle clusters insidethe draft plates can clearly be seen. In addition meandering of the
spout inside the draft plates is observed. Also, γ-aluminum oxide parti-cles were transported to a lower height compared to glass particles, de-spite of the same usp/umf and ubg/umf. This is due to the differences in thephysical properties of particles especially, the restitution coefficient. Theparticleswith a lower coefficient of restitution promote the dense regionsformation, mainly in the form of clusters with more pronounced energydissipation during particle–particle collisions. In this regime, the spout ve-locity was not sufficient to lift the formed particle clusters. Hence, the pe-riodic formation and collapse of the particle clusters was observed insidethe draft plates. This leads to a lower exchange rate of particles betweenthe zone inside the draft plates and the annulus. In addition, the formedclusters partially block the draft plates encouraging unsteady pulsatingparticulate flow patterns with reduced bed height. During the simula-tions, an equal particle distribution on both sides of the draft plates wasobserved, which is in contrast with the experimental observations.
(a) t = 1 s (b) t = 2.5 s (c) t = 3.5 s (d) t = 1 s (e) t = 2s (f) t = 3 s (g) t = 7.5 s
Fig. 7. Snapshots of spouting-with-aeration regime in a spout fluidized bed (a–c) experimental and (d–g) simulation results for glass particles (case B1).
544 V.S. Sutkar et al. / Powder Technology 270 (2015) 537–547
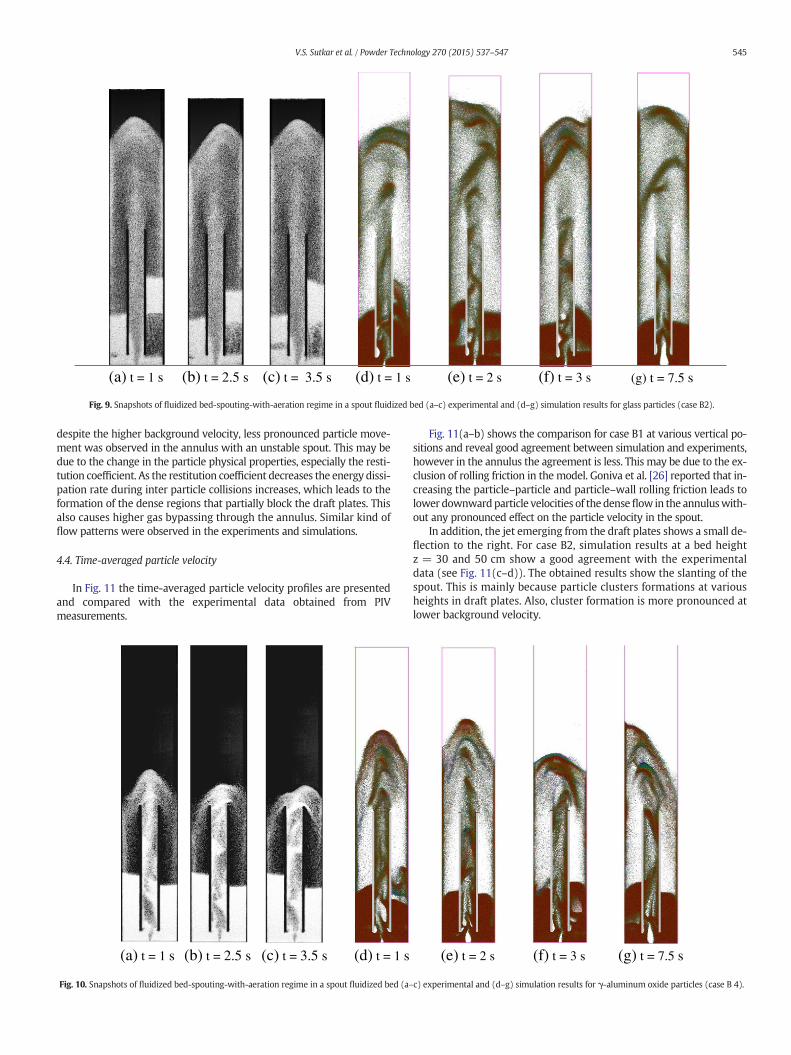
4.3. Fluidized bed-spouting-with-aeration (dispersed spout)
In the fluidized bed-spouting-with-aeration (dispersed spout) re-gime, the particles in the draft plates were elevated to a larger heightas compared with the spouting-with-aeration regime, due to the higherbackground velocities with considerable displacement in the annulus.The total system operates like a circulating bed. Snapshots obtainedduring the experiments and simulations are shown in Figs. 9 and 10for glass and γ-aluminum oxide particles respectively.
4.3.1. Glass particles (B2)Fig. 9(d–g) displays a series of snapshots of a simulation of a spout
fluidized bed in the fluidized bed-spouting-with-aeration regimeusing glass particles. Contrary to the experiments (Fig. 9(a–c)) in the
(a) t = 1 s (b) t = 2.5 s (c) t = 3.5 s (d) t = 1 s
Fig. 8. Snapshots of spouting-with-aeration regime in a spout fluidized bed (a–c) expe
simulation, the formation of particle clusters inside the draft plates isobserved. These clusters partially block the draft plates and induce anunsteady pulsating flow with varying bed height. Furthermore, bubbleformation was also observed in the annulus. Bubbles often propagatethrough the annulus in the form of slugs, due to the small width of theannulus. It is generally assumed that, the generation of slugs com-menceswhen the bubble size approaches 2/3 of the bedwidth. It shouldbe also noted that the particle circulation attributes to particle leakingfrom the bottom of the slugs in the downward direction.
4.3.2. γ-Aluminum oxide particles (B4)The simulation results for γ-aluminum oxide particles are depicted in
Fig. 10(d–g). It is observed that γ-aluminum oxide particles aretransported to a lower height compared to glass particles. Furthermore,
(e) t= 2 s (f) t = 3 s (g) t = 7.5 s
rimental and (d–g) simulation results for γ-aluminum oxide particles (case B 3).
(a) t = 1 s (b) t = 2.5 s (c) t = 3.5 s (d) t = 1 s (e) t = 2 s (f) t = 3 s (g) t = 7.5 s
Fig. 9. Snapshots of fluidized bed-spouting-with-aeration regime in a spout fluidized bed (a–c) experimental and (d–g) simulation results for glass particles (case B2).
545V.S. Sutkar et al. / Powder Technology 270 (2015) 537–547
despite the higher background velocity, less pronounced particle move-ment was observed in the annulus with an unstable spout. This may bedue to the change in the particle physical properties, especially the resti-tution coefficient. As the restitution coefficient decreases the energy dissi-pation rate during inter particle collisions increases, which leads to theformation of the dense regions that partially block the draft plates. Thisalso causes higher gas bypassing through the annulus. Similar kind offlow patterns were observed in the experiments and simulations.
4.4. Time-averaged particle velocity
In Fig. 11 the time-averaged particle velocity profiles are presentedand compared with the experimental data obtained from PIVmeasurements.
(a) t = 1 s (b) t = 2.5 s (c) t = 3.5 s (d) t = 1 s
Fig. 10. Snapshots of fluidized bed-spouting-with-aeration regime in a spout fluidized bed (a–
Fig. 11(a–b) shows the comparison for case B1 at various vertical po-sitions and reveal good agreement between simulation and experiments,however in the annulus the agreement is less. This may be due to the ex-clusion of rolling friction in the model. Goniva et al. [26] reported that in-creasing the particle–particle and particle–wall rolling friction leads tolower downwardparticle velocities of thedenseflow in the annuluswith-out any pronounced effect on the particle velocity in the spout.
In addition, the jet emerging from the draft plates shows a small de-flection to the right. For case B2, simulation results at a bed heightz = 30 and 50 cm show a good agreement with the experimentaldata (see Fig. 11(c–d)). The obtained results show the slanting of thespout. This is mainly because particle clusters formations at variousheights in draft plates. Also, cluster formation is more pronounced atlower background velocity.
(e) t = 2 s (f) t = 3 s (g) t = 7.5 s
c) experimental and (d–g) simulation results for γ-aluminum oxide particles (case B 4).

0.00 0.02 0.04 0.06 0.08 0.10 0.12 0.14-3
-2
-1
0
1
2
3
<v p
,z>
[m
/s]
<v p
,z>
[m
/s]
<v p
,z>
[m
/s]
<v p
,z>
[m
/s]
X [m]
Simulation (B1) Experiment
0.00 0.02 0.04 0.06 0.08 0.10 0.12 0.14-3
-2
-1
0
1
2
3
X [m]
Simulation (B1) Experiment
(a) z = 30 cm (b) z = 50 cm
0.00 0.02 0.04 0.06 0.08 0.10 0.12 0.14
-3
-2
-1
0
1
2
3
X [m]
Simulation (B2) Experiment
0.00 0.02 0.04 0.06 0.08 0.10 0.12 0.14-3
-2
-1
0
1
2
3
X [m]
Simulation (B2) Experiment
(c) z = 30 cm (d) z = 50 cm
Fig. 11. Time-averagedparticle velocity at various heights for glass particleswith h = 0.03 mand static bed aspect ratioH0/W = 1 for spouting-with-aeration andfluidized bed-spouting-with-aeration (dispersed spout) for various simulations cases such as (a–b) case B1 and (c–d) case B2.
546 V.S. Sutkar et al. / Powder Technology 270 (2015) 537–547
5. Conclusions
A flow regime map was constructed for a pseudo 2D spout fluidizedbedwith draft plates, by capturing the high-speed images and fast Fouriertransformation (FFT) of measured pressure signals. In this study, eightdistinct flow regimes were identified by changing the background veloc-ity from 0 to 1.75 m/swith increments of 0.25 m/s and the spout velocityfrom10 to 50 m/swith increments of 5 m/s.With increasing spout veloc-ity, particle circulation increases for the entire range of background veloc-ities. At low background velocities, less pronounced particle motion wasobserved in the annulus. However, increasing the background velocitiescauses higher particle circulation rates through the fluidized annulus.Moreover, increasing the background velocity has a stabilizing effect onthe particles in the annulus. In order to attain particle circulations at lowbackground velocity, the spout velocity should be sufficiently high.
Simulations of a spout fluidized bedwith draft plates were carried outby using a discrete particlemodel (DPM). In the DPM the dynamics of thegas phase is described by the volume averaged Navier–Stokes equations;whereas the motions of the individual particle were determined byNewton's laws of motion by considering a soft-sphere collision model.The draft plates in the spout fluidized bed were treated as internal walls.
Simulations were performed for two particulate systems, namelyglass and γ-aluminum oxide by selecting two regimes, viz. spouting-with-aeration and fluidized bed-spouting-with-aeration (dispersedspout). The obtained results in terms of flow patterns and time-averaged particle velocities for glass and γ-aluminum oxide particlesin both the regimes were compared with experimental results. Thesecomparisons show good agreement. Better agreement in the annulusmay be achieved by including a rolling friction model.
6. List of symbols
Property
UnitSymbol
a Ratio of cube diameter to particle diameter –c
V-SGS model constant –Cd
Drag coefficient –Cs
Smagorinsky constant –D
Depth of the bed [m] dcube Size of the cube [m] Dsp Depth of the spout [m] Ddt Depth of the draft plates [m] dp Diameter of the particle [m] en Normal restitution coefficient –et
Coefficient of tangential restitution –fjcube
Volume fraction of j cell occupied by the cube –g
Acceleration due to gravity [m/s2] h Entrainment height [m] H Height of the bed [m] Hdt Height of the draft plates [m] H0 Static height of the particle bed [m] M Image magnification –Mavg
Average molecular weight –Np
Number of particles –k
Scaling factor –kn
Normal spring stiffness [N/m] pg Gas pressure [Pa] R Universal gas constant [J/(mol·K)] Ra Radius of the particle a [m] Sp Source term –sp
Volume average particle displacement [m]
547V.S. Sutkar et al. / Powder Technology 270 (2015) 537–547
(continued)
Property
UnitT
Temperature of gas [K] Δt Time interval [s] Δtp Time step for particle [s] Tp Torque on the particle [Nm] Δtg Time step for gas [s] ubg Background velocity [m/s] umf Minimum fluidization velocity [m/s] usp Spout velocity [m/s] vp Volume average particle velocity [m/s] W Width of the bed [m] Wdt Width of the draft tube [m] Wsp Width of the spout [m]Greek letters
⟨vp,z⟩ Time-average particle velocity [m/s] Δx Grid size in x direction [m] Δy Grid size in y direction [m] Δz Grid size in z direction [m] εg Gas volume fraction –ρg
Density of the gas [kg/m3] ρs Density of the solid [kg/m3] εs Solid volume fraction –β
Momentum transfer coefficient [kg/m3s] δ Distribution function –ωp
Angular velocity [1/s] εcube Porosity of the cube –ϕE
Variable on Eulerian grid –ϕL
Variable on Lagrangian grid –μg
Dynamic viscosity of the gas [kg/ms] μtur Shear induced turbulent viscosity [kg/ms] Δ Filter width –|S|
Characteristic filtered strain –α
(3 × 3) matrix of the derivatives of the filtered velocity ug –νg
Kinematic viscosity of gas [m2/s]Acknowledgments
This research is supported by the Dutch Technology FoundationSTW, applied science division of NWO and the Technology Program ofthe Ministry of Economic Affairs in The Netherlands, as well as by theDFG (German Research Foundation) in Germany.
References
[1] A. Chatterjee, Spout-fluid bed technique, Ind Eng Chem Process Des Dev 9 (1970)340–341.
[2] J.M. Link, N.G. Deen, J.A.M. Kuipers, X. Fan, A. Ingram, D.J. Parker, et al., PEPT and dis-crete particle simulation study of spout-fluid bed regimes, AIChE J 54 (2008)1189–1202.
[3] W. Zhong, Y. Xiong, Z. Yuan, M. Zhang, DEM simulation of gas–solid flow behaviorsin spout-fluid bed, Chem Eng Sci 61 (2006) 1571–1584.
[4] B. Ren, W. Zhong, B. Jin, Z. Yuan, Y. Lu, Modelling of gas-particle turbulent flow inspout-fluid bed by computational fluid dynamics with discrete element method,Chem Eng Technol 34 (2011) 2059–2068.
[5] M.S. van Buijtenen, M.S. van Dijk, N.G. Deen, J.A.M. Kuipers, T. Leadbeater, D.J.Parker, Numerical and experimental study on multiple-spout fluidized beds, ChemEng Sci 66 (2011) 2368–2376.
[6] M.S. van Buijtenen, K. Buist, N.G. Deen, J.A.M. Kuipers, T. Leadbeater, D.J. Parker, Nu-merical and experimental study on spout elevation in spout-fluidized beds, AIChE J58 (2012) 2524–2535.
[7] T. Ishikura, H. Nagashima, M. Ide, Hydrodynamics of a spouted bed with a porousdraft tube containing a small amount of finer particles, Powder Technol 131(2003) 56–65.
[8] J.K. Claflin, A.G. Fane, Spouting with a porous draft-tube, Can J Chem Eng 61 (1983)356–363.
[9] M.A. van der Hoef, M. van Sint Annaland, A.T. Andrews, S. Sundaresan, J.A.M.Kuipers, Multiscale modelling of gas-fluidized beds, Adv Chem Eng 31 (2008)65–149.
[10] J. Link, C. Zeilstra, N. Deen, H. Kuipers, Validation of a discrete particle model in a 2Dspout-fluid bed using non-intrusive optical measuring techniques, Can J Chem Eng82 (2004) 30–36.
[11] J.M. Link, L.A. Cuypers, N.G. Deen, J.A.M. Kuipers, Flow regimes in a spout-fluid bed:a combined experimental and simulation study, Chem Eng Sci 60 (2005)3425–3442.
[12] J.M. Link, W. Godlieb, P. Tripp, N.G. Deen, S. Heinrich, J.A.M. Kuipers, et al., Com-parison of fibre optical measurements and discrete element simulations for thestudy of granulation in a spout fluidized bed, Powder Technol 189 (2009)202–217.
[13] J.M. Link, W. Godlieb, N.G. Deen, J.A.M. Kuipers, Discrete element study of granula-tion in a spout-fluidized bed, Chem Eng Sci 62 (2007) 195–207.
[14] Z. Deng, R. Xiao, B. Jin, H. Huang, L. Shen, Q. Song, et al., Computational fluid dynam-ics modelling of coal gasification in a pressurized spout-fluid bed, Energy Fuel 22(2008) 1560–1569.
[15] W. Zhong, M. Zhang, B. Jin, Z. Yuan, Flow behaviors of a large spout-fluid bed at highpressure and temperature by 3D simulation with kinetic theory of granular flow,Powder Technol 175 (2007) 90–103.
[16] Y. Zhang, B. Jin, W. Zhong, B. Ren, R. Xiao, DEM simulation of particle mixing inflat-bottom spout-fluid bed, Chem Eng Res Des 88 (2010) 757–771.
[17] M.S. van Buijtenen, N.G. Deen, S. Heinrich, S. Antonyuk, J.A.M. Kuipers, Dis-crete Particle simulation study on the influence of the restitution coeffi-cient on spout fluidized-bed dynamics, Chem Eng Technol 32 (2009 a)454–462.
[18] M.S. van Buijtenen, M. Börner, N.G. Deen, S. Heinrich, S. Antonyuk, J.A.M. Kuipers, Anexperimental study of the effect of collision properties on spout fluidized bed dy-namics, Powder Technol 206 (2011 b) 139–148.
[19] H. Nagashima, T. Ishikura, M. Ide, Flow regimes and vertical solids conveying in aspout-fluid bed with a draft tube, Can J Chem Eng 9999 (2011) 1–10.
[20] R. Beetstra, M.A. van der Hoef, J.A.M. Kuipers, Drag force of intermediate Reynoldsnumber flow past mono-and bidisperse arrays of spheres, AIChE J 53 (2007)489–501.
[21] A. Vreman, An eddy-viscosity subgrid-scalemodel for turbulent shear flow: algebra-ic theory and applications, Phys Fluids 16 (2004) 3670–3681.
[22] J. Smagorinsky, General circulation experiments with the primitive equations, MonWeather Rev 91 (1963) 99–164.
[23] B.P.B. Hoomans, J.A.M. Kuipers, W.J. Briels, W.P.M. van Swaaij, Discrete particle sim-ulation of bubble and slug formation in a two-dimensional gas-fluidised bed: ahard-sphere approach, Chem Eng Sci 51 (1996) 99–118.
[24] N.G. Deen, M. van Sint Annaland, J.A.M. Kuipers, Multi-scale modelling of dispersedgas–liquid two-phase flow, Chem Eng Sci 59 (2004) 1853–1861.
[25] J.M. Link, Development and Validation of a Discrete Particle Model ofa Spout-Fluid Bed Granulator, PhD thesis University of Twente, TheNetherlands, 2006.
[26] C. Goniva, C. Kloss, N.G. Deen, J.A.M. Kuipers, S. Pirker, Influence of rollingfriction on single spout fluidized bed simulation, Particuology 10 (2012)582–591.
[27] Q. Xiong, L. Deng, W. Wang, W. Ge, SPH method for two-fluid modeling ofparticle-fluid fluidization, Chem Eng Sci 66 (2011) 1859–1865.