
Experimental and numerical evaluation on debonding of ...
33
Experimental and numerical evaluation on debonding of fully grouted rockbolt under pull-out loading Shuisheng Yu Zhongyuan University of Technology https://orcid.org/0000-0001-9755-8454 Wancheng Zhu ( [email protected] ) Northeastern University https://orcid.org/0000-0001-9912-2152 Leilei Niu Northeastern University Research Keywords: Fully grouted rockbolt, Debonding, Pull-out load, Ultrasonic guided wave propagation Posted Date: September 21st, 2021 DOI: https://doi.org/10.21203/rs.3.rs-910522/v1 License: This work is licensed under a Creative Commons Attribution 4.0 International License. Read Full License
Transcript of Experimental and numerical evaluation on debonding of ...

Experimental and numerical evaluation ondebonding of fully grouted rockbolt under pull-outloadingShuisheng Yu
Zhongyuan University of Technology https://orcid.org/0000-0001-9755-8454Wancheng Zhu ( [email protected] )
Northeastern University https://orcid.org/0000-0001-9912-2152Leilei Niu
Northeastern University
Research
Keywords: Fully grouted rockbolt, Debonding, Pull-out load, Ultrasonic guided wave propagation
Posted Date: September 21st, 2021
DOI: https://doi.org/10.21203/rs.3.rs-910522/v1
License: This work is licensed under a Creative Commons Attribution 4.0 International License. Read Full License

1
Experimental and numerical evaluation on debonding of fully 1
grouted rockbolt under pull-out loading 2
Shuisheng Yu1,2, Wancheng Zhu1*, Leilei Niu1 3
4 1 Center for Rock Instability and Seismicity Research, Department of Mining Engineering, School of 5
Resource and Civil Engineering, Northeastern University, Shenyang, 110819, China 6
7 2 School of Architectural Engineering, Zhongyuan University of Technology, Zhengzhou, 450007, 8
China 9
*Corresponding author. E-mail address: [email protected] (W.C. Zhu) 10
11
12
Abstract:The axial loading in rockbolts changes due to stress redistribution and rheology in the 13
country rock mass. Such a change may lead to debonding at rockbolt to grout interface or rupture 14
of the rockbolt. In this study, based on laboratory experiments, ultrasonic guided wave 15
propagation in fully grouted rockbolt under different pull-out loads was investigated in order to 16
examine the resultant debonding of rockbolt. The signals obtained from the ultrasonic monitoring 17
during the pull-out test were processed using wavelet multi-scale analysis and frequency spectrum 18
analysis, the signal amplitude and the amplitude ratio (Q) of low frequency to high frequency were 19
defined to quantify the debonding of rockbolt. In addition to the laboratory test, numerical 20
simulation on the effect of the embedment lengths on ultrasonic guided wave propagation in 21
rockbolt was conducted by using a damage-based model, and the debonding between rockbolt and 22
cement mortar was numerically examined. It was confirmed that the ultrasonic guided wave 23
propagation in rockbolt was very sensitive to the debonding because of pull-out load, therefore, 24
the critical bond length could be calculated based on the propagation of guided wave in the 25
grouted rockbolt. In time domain, the signal amplitude in rockbolt increased with pull-out load 26
from 0 kN to 100 kN until the completely debonding, thus quantifying the debonding under the 27
different pull-out loads. In the frequency domain, as the Q value increased, the debonding length 28
of rockbolt decreased exponentially. The numerical results confirmed that the guided wave 29
propagation in the fully grouted rockbolt was effective in detecting and quantifying the debonding 30
of rockbolt under pull-out load. 31
Keywords: Fully grouted rockbolt; Debonding; Pull-out load; Ultrasonic guided wave 32
propagation 33

2
1. Introduction 34
As an important part of the support system, rockbolt is widely used for the reinforcement and 35
support of slopes and roadways (Wang et al. 2009). In geotechnical and mining engineering, it is 36
imperative to use effective and non-destructive scientific methods to test rockbolt bond quality, 37
because rockbolts cannot be observed directly, and deterioration of the surrounding environment 38
can increase the occurrence of rock burst and landslide. For the detection of rockbolt bond quality, 39
Beard and Lowe (2003) and Beard et al. (2003) used numerical simulation methods to determine 40
the wave attenuation at low and high frequencies in the rockbolts, and analyzed the influence on 41
wave attenuation of the elastic modulus, the thickness of the anchorage grout, and the quality of 42
the rockbolt/grout interface. Ivanović and Neilson (2013) studied potential damage in grouted 43
rockbolts and determined the effective bond length. The rockbolt bond integrity could be 44
evaluated using ultrasonic guided wave and hammer impact (Lee et al. 2012; Suits et al. 2008; Yu 45
et al. 2013, 2016). The energy transfer in rockbolt was studied by experimentally and numerically, 46
and the results showed that the length of rockbolts and the thickness of anchorage grout could be 47
determined according to the wave propagation signal received at the free end of the rockbolt 48
(Zima and Rucka 2017). Zima and Rucka (2018) studied the influence of the location of 49
debonding on the wave conversion and diffraction. Zou et al. (2010) analyzed the effects of grout 50
strength and air content in the grout on the rockbolt bond quality, and showed that the guided 51
wave rapidly attenuated with an increase in grout strength, and the group velocity increased with 52
the quantity of the air content. Cui and Zou (2012) studied the attenuation of ultrasonic guided 53
wave in grouted rockbolt using numerical simulation and experimentally confirmed the influence 54
of rockbolt defect and lack of mortar on grouted rockbolt. 55
Debonding of rockbolt can be detected by analyzing the ultrasonic guided wave propagation 56
in rockbolt, and the difficulty is that the reflected waves at various interfaces exist in a mixed and 57
complex form in the detected signal, the detection signal is observed in the time domain, and is 58
mainly expressed as low-frequency signal, and the high-frequency component is covered (Xiao et 59
al. 2006). Therefore, it is difficult to directly obtain the arrival time of the reflected wave from the 60
actual detection signal and signal processing is required to obtain a reasonable signal. Fourier and 61

3
wavelet transform processes have been used for this type of signal analysis (Lee et al.2012; 62
Bouden et al. 2012; Kwun et al. 1998; Chen and Wissawapaisal 2002; Rizzo 2006; Chen and 63
Wilcox 2007; Chaki and Bourse 2009a, 2009b;). Lee et al. (2012) used Fourier and wavelet 64
transform to evaluate rockbolt integrity and concluded that the magnitude of the spectral rate, the 65
energy velocity, and the phase velocity could be used as indicators of integrity. Kwun et al. (1998) 66
investigated the effect of tensile loading on the longitudinal mode elastic wave propagation in 67
seven-wire strands. The results indicated that a certain portion of the frequency components of the 68
wave was highly attenuated and absent in the frequency spectrum of the wave. Chen and 69
Wissawapaisal (2002) reported that the traveling time of the stress wave in the wire strand was 70
affected due to the elongation of the strand and the changes in wave velocities when the strand 71
was subjected to tensile force. Rizzo (2006) conducted experiments on ultrasonic wave 72
propagation in seven-wire strands loaded at different stress levels and reported that the ultrasonic 73
features were sensitive to the variation of applied load. Chen and Wilcox (2007) analyzed the 74
influence of load on guided wave propagation, and found that the guided wave phase velocity 75
increased and the group velocity decreased with increased applied load. The research results of 76
Chaki and Bourse (2009A, 2009B) illustrated the potential and suitability of the guided wave 77
method to evaluate the stress levels in seven-wire steel strands. 78
With regard to the numerical simulation on the wave propagation in rockbolt, many scholars 79
used idealized ultrasonic guided wave packets as the excitation signal in the numerical simulation 80
of rockbolt detection (Liu et al. 2017; Ni and Iwamoto 2002; Sun et al. 2006; Ren and Li 2009). 81
Liu et al. (2017) analyzed the influence of tensile stress on ultrasonic guided waves propagation in 82
steel cables based on the fast Fourier transform. The results showed increased ultrasonic guided 83
wave energy with increased tensile force. Ren et al. (2009) used wavelet multi-scale analysis to 84
obtain the reflection signal of the rockbolt bottom in the low-frequency component and detail 85
signals in the high-frequency component. 86
In the above studies, it could be seen that the majority of the past studies were on the 87
non-destructive testing of the bond quality of rockbolt in the absence of external loading using the 88
guided wave technique, this is inconsistent with the fact that the rockbolt is under stress in actual 89
engineering. The mining stress field in the rock mass usually varies due to the on-going mining 90

4
operations, leading to the variation of the axial loading in the rockbolt, therefor, it is necessary to 91
detect the debonding length of rockbolt under various pull-out loads to ensure the safety and avoid 92
the accident of grouted rockbolt systems. This study aimed to evaluate the debonding of rockbolt 93
under different pull-out load according to the analysis of ultrasonic guided wave propagation. In 94
this regards, the wavelet multi-scale analysis and frequency spectrum analysis were used for 95
processing the signal obtained from the guided wave propagation. Finally, grouted rockbolt system 96
with different bond lengths was analyzed by numerical simulation, and the debonding under 97
various levels of pull-out loadings was further examined. 98
2. Guided wave propagation and wavelet transform theory 99
2.1. Guided wave propagation theory 100
2.1.1 Guided wave propagation in free rockbolt 101
Determination of the frequency dependent dispersion curve in ultrasonic guided wave is 102
required for non-destructive testing (Hayashi et al. 2004). The dispersion curve represents the 103
fundamental information of the guided wave propagation: wavelength, phase velocity, and group 104
velocity, which can be expressed by the Pochhammer-Chree frequency dispersion equation of a 105
longitudinal guided wave (Hayashi et al. 2004): 106
2
2 2 2 2 2
1 1 0 1 1 0
24 0k J a J a k J a J a k J a J a
a
, (1) 107
where ()n
J is the n-order first Bessel function. a is the rockbolt diameter, and parameters and 108
can be defined as: 109
22 2
2
L
kc
, (2) 110
22 2
2
T
kc
, (3) 111
where k is the wave number, is the circular frequency, L
c is the longitudinal wave velocity, 112
and T
c is the transverse wave velocity. Namely, 113
1
1 1 2L
Ec
, (4) 114

5
2 1T
Ec
, (5) 115
where E is the elastic modulus, is the density, and is Poisson’s ratio. 116
During guided wave propagation, the guided wave group velocity ( gc ) in rockbolt is 117
g
dc
dk. (6) 118
According to the material parameters listed in Table 1, the Pochhammer-Chree frequency 119
dispersion equation can be solved to obtain the frequency dispersion curve of the guided wave 120
group velocity in free rockbolt. In the low frequency range, only the guided wave of L(0,1) mode 121
appeared, and the guided wave of other modes exhibited a cut-off frequency. Below the cut-off 122
frequency, the guided wave attenuated rapidly and could not propagate any longer, and above the 123
cut-off frequency, the guided wave began to propagate. Therefore, a frequency segment with a 124
single mode was selected to facilitate the signal analysis. As shown in Fig. 1(a), when the 125
frequency was 145 kHz, the guided wave of L(0,2) mode appeared, thus adding complexity to the 126
signal analysis. For the free rockbolt, there was only one mode of guided wave with the frequency 127
ranging from 0 to 145 kHz, and it is conducive to signal analysis. 128
[Table 1 goes here] 129
[Fig. 1 goes here] 130
2.1.2 Guided wave propagation in grouted rockbolt 131
The Pochhammer-Chree frequency dispersion equation with the parameters listed in Table 2 132
was used to get the frequency dispersion curve of the guided wave group velocity in grouted 133
rockbolt (Fig. 1(b)). Within the frequency range from 0 to 200 kHz, there were eight modes in 134
propagation process of the guided wave. Due to the rapid attenuation of the guided wave energy in 135
the grouted rockbolt, the guided wave frequency decreased. Thus, within the frequency ranging 136
from 0 to 22 kHz, only mode L(0,1) existed, and it was conducive to signal analysis. 137
2.2. Wavelet transform theory 138
The bond quality and debonding of rockbolt is detected by ultrasonic guided wave, and in its 139

6
detection signal, the reflected waves at various interfaces existed in mixed and complex forms. In 140
the time domain, the detection signal is mainly represented by low-frequency signal, while the 141
high-frequency component is covered. It is difficult to obtain the arrival time of reflection waves 142
from the detection signal. To address this issue, the wavelet multi-scale analysis was used to 143
analyze the discrete signal (Ren and Li 2009; Sun et al. 2014). The four scales of db6 wavelet 144
were used to analyze the signal, the rockbolt bottom reflection time could be found in the 145
low-frequency signal (Sun et al. 2014). The bottom reflection signal was obtained in the 146
low-frequency component and the detail signal was obtained in the high-frequency component. 147
Wavelet transform is a unique time-frequency analysis method that offers multi-resolution or 148
multi-scale analysis by decomposing the signal into different scale space to reflect the different 149
frequency components of the signal (Ren and Li 2009; Sun et al. 2014). By selecting the 150
appropriate scaling factor and moving factor, we can obtain a telescoping window and choose the 151
appropriate wavelet, so that the wavelet transform has the ability to characterize the local 152
characteristics of the signal in both the time and frequency domains. 153
The wavelet is generated by a function t through moving and telescoping and satisfies 154
the condition of 0t
. 155
1 2
, , , , 0a b
t bt a a b R a
a
(7) 156
where, t is the base wavelet or mother wavelet, a is the scaling factor, and b is the 157
moving factor. The function f t in 2L R is expanded under the wavelet basis, and this 158
expansion is called the wavelet transform of f t . Its expression is: 159
1 2,
t bWf a b a f t dt
a
. (8) 160
It can be seen from formula (8), the wavelet transform makes the inner product of the signal 161
to be analyzed and a group of wavelet function clusters, and transforms the time function into the 162
time-scale phase plane to extract some characteristics of the original signal in scale (frequency) 163
and position (time). 164
Of different methods of wavelet analysis, the Daubechies wavelet series offers good 165

7
compactly supported, smoothness, and approximate symmetry. It is widely used to analyze 166
non-stationary signal. Here, we selected db6 as the wavelet basis and performed 5-layer 167
decomposition to obtain the high-frequency and low-frequency components. 168
3. Test design 169
3.1. Specimen design 170
Ribbed rockbolts with 25 mm diameter and 2500 mm length were used and the rock mass 171
that would be reinforced was simulated with a hollow cylinder made of concrete. The diameter 172
and length of the hollow cylinder were 150 and 1500 mm, respectively. The embedment length of 173
rockbolt was 1500 mm. The details of the testing sample preparation were presented in Fig. 2. 174
[Fig. 2 goes here] 175
The specimen was a hollow cylinder made of C40 concrete, which consisted of: (1) Ordinary 176
Portland cement with a standard 28-day compressive strength of 42.5 MPa; (2) tap water; (3) 177
natural river sand fine aggregates of diameters from 0.3 to 1.18 mm; and (4) cobblestone coarse 178
aggregates of diameters from 5 to 20 mm mixed at a ratio of 1:0.47:1.3:3.02. 179
The grout was the cement based mixture which consisted of: (1) Ordinary Portland cement 180
with a standard 28-day compressive strength of 42.5 MPa; (2) tap water; and (3) natural river sand 181
fine aggregates of diameters from 0.3 to 0.6 mm. 182
Pre-investigation pullout test results showed that rockbolt may fail from the bolt shank when 183
high-strength cement mortar was used to grout rockbolt and hollow cylinder specimen. Therefore, 184
to ensure that debonding occurred before the bolt shank failed the cement mortar was prepared at a 185
mix proportion of cement: water: fine aggregate of 1:1:3.2. The mix proportions of the cement 186
mortar and concrete in the test are listed in Table 2. 187
[Table 2 goes here] 188
The procedures of the sample preparation for the pull-out test of the rockbolt were as follows 189
[27]. Firstly, the casting mould was made by placing the plain round bar with a diameter of 40 mm 190
in the center of the cylindrical steel tube. Then the concrete mixture was poured into the mould to 191
form the confining medium followed by be vibrated using a poker vibrator. After 48 h curing of 192
the concrete, the plain round bar and the cylindrical steel tubes were removed. Finally, the 193

8
rockbolts were grouted in the borehole, and 28 days later pull-out tests were conducted. 194
3.2. Test procedure 195
A Pull-out Testing Machine (PTM) was designed and manufactured to conduct the rockbolt 196
pull-out test with monitoring of the stress wave propagation in the rockbolt (Yu et al. 2019). The 197
pull-out load was applied to the rockbolt by a hollow jack with 300 kN loading capacity. The 198
schematic diagram of grouted rockbolt systems was shown in Fig. 2(b). Piezoelectric sensors 199
(TH-GP) and ultrasonic emission source (TH-F) were produced by Xiangtan Tianhong Testing 200
Technology Co., Ltd (China). The emission voltages of the ultrasonic emission source were 201
100-1000 V. The piezoelectric sensor was used as the receiving or excitation sensor which could 202
excite 10-cycles sine wave packets with the main frequency of 22 kHz. An ultrasonic excitation 203
sensor was contacted to the loading end (A-end in Fig. 2(b)) of the rockbolt through a coupling 204
agent (such as Vaseline) to generate the signal that was received at the free end (D-end in Fig. 2(b)) 205
of the rockbolt by the receiving sensor. 206
The testing procedure was as follows. First, the grouted rockbolt was maintained without 207
pull-out force. The ultrasonic excitation sensor was used to excite the ultrasonic guided wave at 208
the A-end and the wave was received by the receiving sensor at the D-end. Next, the pull-out load 209
was increased to 100 kN and the above steps were repeated. Finally, the rockbolt was pulled until 210
it was completely debonded from the concrete specimen and the ultrasonic guided wave was 211
tested according to above steps. 212
4. Experimental results and discussion 213
4.1. Wavelet multi-scale analysis 214
In the schematic diagram presented in Fig. 2(b), the B-end is the bond front-end and the 215
C-end is the bond back-end. The continuous wavelet transform was used to convert ultrasonic 216
TiAl and 40Cr diffusion bonding interface signals into time-scale domain to evaluate the bonding 217
quality (Luan et al. 2011). Therefore, the multi-scale decomposition of the wavelet transform was 218
used in the paper to evaluate the debonding length. In Fig. 3 the multi-scale decomposition of the 219
wave in the rockbolt under different pull-out loads is shown, where ‘s’ is the original signal, ‘a5’ is 220

9
the fifth layer approximated signal, and ‘d1-d5’ are decomposition signals. Fig. 3(a) shows the 221
wavelet multi-scale decomposition of guided wave signals in rockbolt free of pull-out load, the 222
time (0kNt ) required for the first wave front to arrive at the D-end was 0.604 ms . The wave velocity 223
(0c ) in the free rockbolt section was 5100 m s , thus the guided wave propagation time along the 1 224
m free length of the rock bolt was calculated according to 225
0 01 0.196 mst c . (9) 226
The wave velocity in the embedment section of the rockbolt was then calculated as 227
0kN 0kN 01.5 3676 m sc t t . (10) 228
The high-frequency signals reflected the details of the guided waves, but the d1 and d2 229
signals are more chaotic, so d3 signal was selected to pick up the wave arrival time. The time 230
(0kN-Bt ) to receive the echo signal from the B-end at the D-end was 1.457 ms . Therefore, the time 231
required to propagate from the D-end to the B-end and then reflect back to the D-end was equal to 232
0kN-B-D 0kN-B 0kN 0.853 mst t t . (11) 233
There was 0.3 m free segment at the D-end, so the bond length could be calculated as 234
0kN-B-D
0kN 0kN
0
0.31.35 m
2
tL c
c
, (12) 235
which was 10% different from the actual bond length of 1.5 m. 236
The time (0kN-At ) to receive the echo signal from the A-end at the D-end was 1.764 ms. The 237
time difference between the A-end and B-end echo signals received at the D-end was equal to 238
0kN-A-B 0kN-A 0kN-B 0.307 mst t t . (13) 239
Thus, the distance from the A-end to the B-end was calculated: 240
0kN-A-B
0kN-AB 0 0.78 m2
tL c , (14) 241
which was for 11.4% difference from the actual length of 0.7 m. 242
Fig. 3(b) presents the wavelet multi-scale decomposition of guided wave signals after 243
completely debonding of rockbolt, the time (debondingt ) for the first wave front to arrive at the D-end 244
was 0.572 ms , the wave velocity in the grouted system was calculated as 245

10
debonding debonding 01.5 3989 msc t t . (15) 246
The time (debonding-Bt ) to receive the echo signal from the B-end at the D-end was 1.402 ms. 247
Therefore, the time required for the eave to propagate from the D-end to the B-end and then to 248
reflect back to the D-end was equal to: 249
debonding-B-D debonding-B debonding 0.83 mst t t . (16) 250
Allowing for calculation of the bond length, it was: 251
debonding-B-D
debonding debonding
0
0.31.42 m
2
tL c
c
, (17) 252
which was for 5.3% difference with the actual bond length of 1.5 m. 253
The time ( debonding-At ) to receive the echo signal from the A-end at the D-end was 1.675 254
ms. Therefore, the time difference between the A-end and B-end echo signals received at the 255
D-end was: 256
debonding-A-B debonding-A debonding-B 0.273 mst t t . (18) 257
The distance from the A-end to the B-end was: 258
debonding-A-B
debonding-AB 0 0.696 m2
tL c , (19) 259
which was for 0.6% difference with the actual length of 0.7 m. 260
Fig. 3(c) shows the wavelet multi-scale decomposition of guided wave signals under 100 kN 261
of pull-out load, the time (100kNt ) of the first wave front to arrive at the D-end was 0.588 ms . The 262
time (100kN-Bt ) to receive the echo signal from the B-end at the D-end was 1.429 ms. Therefore, the 263
time required to propagate from the D-end to the B-end and then reflect back to the D-end was 264
equal to: 265
100kN-B-D 100kN-B 100kN 0.841 mst t t . (20) 266
The pull-out load causes a segment of rockbolt to debond from the concrete. The wave 267
velocity of the grouted rockbolt was 3676 m/s under unloading, and that when the rockbolt 268
completely debonded (as shown in Fig. 3(b)), was 3989 m/s due to the presence of friction 269
between rockbolt and concrete. The initial bond length of rockbolt was 1.5 m, so the debonding 270

11
length of the rockbolt from the loading end under 100 kN pull-out load was equal to: 271
debonding 100kN 0 0kN
debonding 0kN
1.50.752 m
c t t cL
c c
. (21) 272
But the remaining 0.748 m bond length was still in the bonded state. 273
The average wave velocity of rockbolt in the grouted system was calculated as 3826 m s . 274
The time (100kN-At ) to receive the echo signal from the A-end at the D-end was 1.706 ms. Therefore, 275
the time difference between the A-end and B-end echo signals received at the D-end was: 276
100kN-A-B 100kN-A 100kN-B 0.277 mst t t . (22) 277
The distance from the A-end to the B-end was calculated as 278
100kN-A 100kN-B
100kN-AB 0 0.706 m2
t tL c
, (23) 279
and the difference with the actual length of 0.7 m was 0.9%. 280
[Fig. 3 goes here] 281
The comparison between the actual bonding length of rockbolt and that determined by 282
ultrasonic wave is presented in Fig. 4. For the lengths from the A-end to the B-end determined by 283
the ultrasonic wave propagation data, they were 0.78 m, 0.706 m, and 0.696 m, respectively, under 284
0 kN pull-out load, 100 kN pull-out load, and completely debonding conditions, leading to the 285
relative differences to the actual 0.7 m length of 11.4%, 0.9%, and 0.6%, respectively. Under free 286
and completely debonding condition, the lengths from the B-end to the C-end determined by the 287
ultrasonic wave propagation data were 1.35 m and 1.42m, respectively, resulting in the relative 288
differences with the actual length of 1.5 m of 10% and 5.3%, respectively. However, under 100 kN 289
of pull-out load, the length from the B-end to the C-end could not be determined as it was 290
calculated by back analysis. 291
[Fig. 4 goes here] 292
4.2. Spectrum analysis 293
The frequency of the ultrasonic guided wave signal is significantly important for analyzing 294
the wave propagation in rockbolts. Fourier transform is used to analyze the frequency domain of 295
the received signals. Through the Fourier transform, the signals are decomposed into different 296

12
spectra. The Fourier transform is the integral of with respect to t ranging from - to +. 297
Namely, 298
i tF f t e dt
, (24) 299
where, is the Fourier transform of 300
,i is 1 ,and the frequency variable is the angular 301
frequency. 302
The time domain and frequency domain characteristics of wave propagation in free rockbolt 303
are shown in Fig. 5. In the time domain, due to the influence of various factors (such as the 304
coupling effect between rockbolt and transducer, wires and acquisition module) (Zhang et al. 305
2006), the guided wave energy in free rockbolt dissipated greatly and the amplitude attenuated 306
quickly. In the frequency domain, the main frequency of the guided wave in free rockbolt was 22 307
kHz. Therefore, in the following numerical simulation, an idealized 10-cycles sine wave packets 308
with the main frequency of 22 kHz is input as the excitation signal. 309
[Fig. 5 goes here] 310
[Fig. 6 goes here] 311
Time-frequency analysis has often used to analyze dispersive wave signals (Kishimoto et al. 312
1995; Neild et al. 2003). Fig. 6(a, b) shows the time and frequency domain characteristics of the 313
grouted rockbolt under different pull-out loads. In the time domain, the amplitude of the received 314
signal at the D-end of the rockbolt gradually increased with the pull-out load applied on the 315
rockbolt from 0 kN to 100 kN, until the completely debonding of rockbolt, which indicated 316
maximal energy dissipation because of the good bond condition. In contrast, the amplitude of the 317
received signal was highest when the rockbolt was completely debonded, because the interface 318
bonding between rockbolt and cement mortar was relatively loose, and the energy only was 319
transmitted by the friction, which means that the energy dissipation into the concrete was 320
minimum during wave propagation and thus the bond quality was the worst. 321
It can be seen from the waveform under 0 kN pull-out load, the first received signal in the 322
D-end was severely attenuated and the guided wave packet disappeared. As the pull-out load 323
increased to 100 kN, the debonding developed further and the guided wave packet gradually 324
13
appeared due to the weakening energy attenuation. 325
In the frequency domain, under 0 kN, 100 kN pull-out load, and under completely debonding 326
condition of rockbolt, there were two different frequency bands in the rockbolt, and there was 327
missing frequency band appeared between the these two bands. This was a kind of notch 328
frequency phenomenon, which was observed by Kwun et al. (1998) and Liu et al. (2017). As the 329
pull-out load on the rockbolt increased, the amplitude of the low-frequency part decreased and that 330
of the high-frequency part increased. Under 0 kN pull-out load, at the higher frequency, ultrasonic 331
waves experienced a greater number of interactions with the rockbolt and concrete, which implied 332
higher attenuation (Carrión et al. 2017) and denoted the better bond quality. Therefore, we defined 333
the amplitude ratio (Q) of low frequency (Flow) to high frequency (Fhigh), namely Q = Flow / Fhigh, 334
to quantify rockbolt. The Q values were 6.14, 1.31, and 0.97 under 0 kN, 100 kN pull-out load, 335
and under completely debonding condition, respectively. The relationship between the Q value 336
and the debonding length of rockbolt under various pull-out loads was shown in Fig. 7. As the Q 337
value increased, the debonding length of rockbolt decreased exponentially. This quantitative 338
relation between bonding length and Q value can be use evaluate the bonding length of rockbolts. 339
[Fig. 7 goes here] 340
5. Numerical analysis of guided wave propagation in grouted rockbolt 341
5.1. Numerical model of grouted rockbolt system 342
The finite element software Abaqus (2014) has often been applied for numerical simulation 343
of the debonding behaviors (Zima and Rucka 2017; Qiao and Chen 2008; Lu and Xu 2013; Chang 344
et al. 2017; Xu et al. 2018; Chen et al. 2011; Henriques et al. 2013, 2015; Yang et al. 2017) and 345
non-destructive testing (Zima and Rucka 2017, 2018) of grouted rockbolt system. In this section, 346
grouted rockbolt system were simulated by four-node bilinear axisymmetric quadrilateral elements 347
with reduced integration (CAX4R) (Fig. 8). The interface at the loaded end of the concrete is fixed 348
during the test for the boundary condition in the rockbolt-grouted system. On the basis of 349
extensive trials, a mesh size of 2 mm for the rockbolt and cement mortar and a mesh size of 5 mm 350
for the concrete are deemed adequate to obtain sufficiently accurate results. 351
[Fig. 8 goes here] 352

14
The bond behavior can be modeled by cohesive elements (Qiao and Chen 2008; Lu and Xu 353
2013; Chang et al. 2017; Xu et al. 2018; Park et al. 2015) or surface-based cohesive behavior 354
(Chen et al. 2011; Henriques et al. 2013, 2015; Yang et al. 2017) using traction-separation law in 355
Abaqus. Because the interface thickness is negligibly small, the interface bond behavior between 356
rockbolt (concrete) and cement mortar was modeled by the surface based cohesive behavior in 357
order to reduce the calculation time. 358
[Fig. 9 goes here] 359
The cohesive behavior in the shear directions (Fig. 9) were defined as follows: the linear 360
elastic shear stress-slip relations are defined by the elastic bond stiffness, and damage initiation 361
criteria is met when the maximum bond shear stress is attained, and the damage evolution law for 362
bond is assumed as exponential softening branch (Rezazadeh et al. 2017). 363
The uncoupled constitutive relationship of traction-separation behavior as expressed in 364
Abaqus is as follows (Rezazadeh et al. 2017): 365
0 0
0 0
0 0
n nn n
s ss s
t tt t
t k
T t k K
t k
, (25) 366
where n
t is the nominal stress in the normal direction; s
t and t
t are the nominal stresses in the 367
two local shear directions; nn
k , ss
k and tt
k are the corresponding stiffness coefficients; and
368
n ,
s and
t are the corresponding displacements. 369
nnk ,
ssk and
ttk are given by (Lu and Xu 2013): 370
0
ss tt m mk k , (26) 371
100 100nn ss tt
k k k , (27) 372
where m
is the maximum shear strength, and 0
m is the slip value at the maximum shear 373
strength, or the effective displacement at the initiation of damage. 374
The stress components of the traction-separation model are affected by damage. 375
1n n
t d t , 1s s
t d t , 1t t
t d t , (28) 376
where n
t , s
t and tt are the stress components predicted by the elastic traction-separation behavior 377
for the current strains without damage. d is the damage variable. For exponential softening, 378

15
max 0
00
max
1 exp
1 11 exp
m m
f
m mm
m
d
, (29) 379
where f
m is the effective displacement at complete failure. max
m is the maximum value of the 380
effective displacement attained during the loading history. is a non-dimensional material 381
parameter that defines the rate of damage evolution. 382
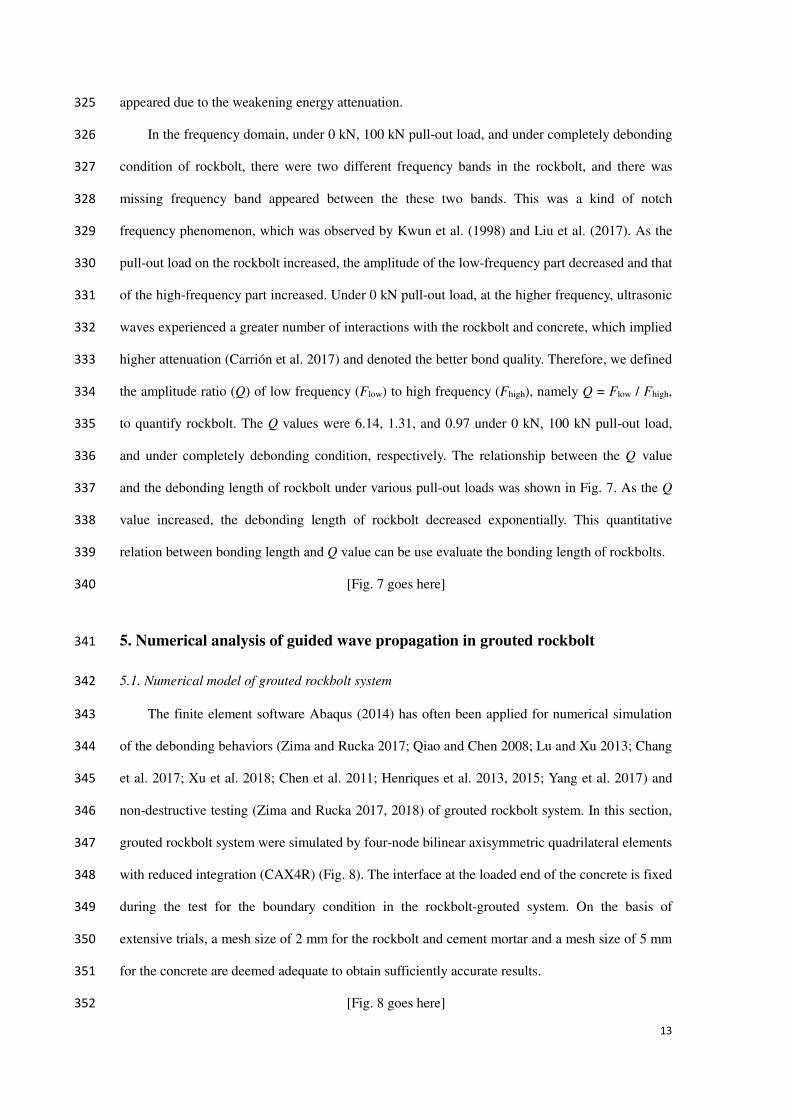
In the numerical simulation, the input waveform of the ultrasonic guided wave was 10-cycles 383
sine wave packets with the main frequency of 22 kHz obtained by Hanning window (Fig. 10). The 384
comparison between the numerical simulation and the experimental results of the free rockbolt 385
was shown in Fig. 11. The modeled signal received at the other end of rockbolt was in good 386
agreement with the test result, which indicated that the numerical model could reasonably simulate 387
guided wave propagation in rockbolt. 388
[Fig. 10 goes here] 389
[Fig. 11 goes here] 390
5.2. Guided wave propagation in grouted rockbolt with different bond lengths 391
Numerical simulation on guided wave propagation in grouted rockbolt with different bond 392
lengths (L) of 0.375 m, 0.75 m, 1.125 m, and 1.5 m were conducted, as shown in Fig. 8. Except for 393
the change of bond length, the model dimensions were the same as those for the laboratory test. 394
5.2.1 The effect of bond length on guided wave propagation in absence of pull-out load 395
Under 0 kN pull-out load, the guided wave propagation behaviors in grouted rockbolt with 396
different bond lengths was determined as shown in Fig. 12. The waveform was different with that 397
of experiments, because the bonding between the rockbolt and the cement mortar was assumed to 398
be perfect in the numerical simulations. The guided wave had many times of transmission and 399
reflection during propagation in the rockbolt, which resulted in the guided wave energy 400
attenuation and the change of waveforms (Yu et al. 2019). The time required to receive the B-end 401
echo signal at the A-end (positions A, B, C, and D in Fig. 8) became shorter under the increasing 402
bond length. That was, the closer the B-end was to the A-end, the less time required for guided 403

16
wave propagated in rockbolt. The guided wave diffracted when it arrived at the B-end. Part of the 404
wave energy reflected from the B-end, part diffracted to the cement mortar and concrete, and the 405
remainder propagated along the rockbolt. For the D-end echo, due to the increased bond length, 406
the distance from the B-end to the A-end became shorter, the guided wave diffracted earlier, 407
because the guided wave energy dissipation increased, the attenuation became faster, the wave 408
velocity decreased, and the time of received echoes was delayed accordingly. When receiving the 409
guided wave signal at the D-end, the guide wave velocity decreased as the bond length increased. 410
The B-end was farther away from the D-end, so the time required to receive the B-end echo signal 411
at the D-end was delayed, as did the time required to receive the A-end echo. The rockbolt bond 412
length could be determined by guided wave propagation time along the rockbolt and the wave 413
velocity. 414
[Fig. 12 goes here] 415
5.2.2 The effect of pull-out load on guided wave propagation 416
The guided wave signals of grouted rockbolt system with bond lengths of 0.375 m, 0.75 m, 417
1.125 m, and 1.5 m were calculated and are shown in Fig. 13, where the pull-out load was 25 kN. 418
The guided wave propagation is affected by pull-out load. According to the wave propagation 419
theory, the B-end and D-end echo signals could be detected as shown in Fig. 13. The time required 420
to receive the B-end echo at the A-end became shorter as the bond length increased, and the signal 421
fluctuation was more complicated, it indicated that guided wave propagation in the bond rockbolt 422
was sensitive to the pull-out load. The time required to receive the D-end echo prolonged as the 423
bond length increased, because the wave velocity of the guided wave in the bond segment was 424
slower than that in the free rockbolt. Therefore, the longer the bond length is, the slower the guide 425
wave propagating is in the bond segment. 426
[Fig. 13 goes here] 427
[Fig. 14 goes here] 428
Fig. 14 presents the guided wave propagation in the grouted rockbolt system with bond 429
length of 1.5 m under different pull-out loads. When the bond length was the same, the time 430
required to receive the B-end echo signal at the A-end was the same, but the time required to 431

17
receive the D-end echo signal at the A-end became shorter as the axial load increased, because the 432
bond state of the rockbolt changed under pull-out load. In this regard, part of rockbolt was 433
debonded or the interface between the rockbolt and the cement mortar was in softening stage (as 434
shown in Fig. 15). The length of debonding or softening around rockbolt increased and the bond 435
quality of rockbolt became worse as the pull-out load increased. The guided wave propagation in 436
the rockbolt was in disorder, because the loading end of the rockbolt was subjected to a large 437
concentrated force, resulting in a strong reflection of the guided wave, which made the received 438
reflection signal extremely complex. The rockbolt was partially debonded from the cement mortar, 439
resulting in a discontinuous interface between the rockbolt and cement mortar that interfered with 440
the guided wave propagation. 441
[Fig. 15 goes here] 442
Under the pull-out load of 25 kN, the 0.24 m bond length was in the softening stage (Fig. 15). 443
Axial stress distribution along the rockbolt under 25 kN was determined and shown in Fig. 16: the 444
farther the distance from the B-end, the lower the axial stress. The guided wave had little 445
diffraction when arriving at the B-end, so little energy propagated to the cement mortar and 446
concrete, this was mainly due to the increase of the wave impedance mismatch (the low wave 447
impedance between rockbolt and cement mortar and the high wave impedance betwee rockbolt 448
and air) (Song and Cho 2010). 449
When the pull-out load was 50 kN, the bond length subjected to 50 kN was 0.46 m (Fig. 15), 450
in which 0.3 m was debonded and 0.16 m was softened. As the pull-out load increased to 100 kN, 451
the debonding length was 0.78 m which was for 3.7% difference with the debonding length of 452
0.752 m based on the calculated result of wave propagation and 0.176 m was in the softening 453
(Fig.15). At the debonding area, there was a gap between the rockbolt and the cement mortar, the 454
guided wave propagated in the rockbolt and was reflected many times at the debonding area. The 455
propagation velocity of the guided wave in the rockbolt was higher than that in the cement mortar 456
and concrete, guided wave partially dispersed in all directions in the cement mortar and the 457
concrete, so that the attenuation was serious. 458
[Fig. 16 goes here] 459

18
6. Conclusions 460
In this study, the guided wave propagation in the fully grouted rockbolt under various 461
pull-out loads were experimented and numerically simulated to evaluate the debonding of rockbolt. 462
The following conclusions were obtained: 463
(1) Based on wavelet multi-scale analysis of guided wave signal, the debonding length of 464
rockbolt under 100 kN load was 0.752 m. In the time domain, the signal amplitude increased with 465
load from 0 kN to 100 kN and until completely debonding of rockbolt, indicating maximum 466
ultrasonic guided wave energy dissipation and best rockbolt bond quality when the rockbolt is free 467
from loading. The energy dissipation was minimum when the rockbolt debonded completely, 468
suggesting the worst bond quality and the largest debonding length. 469
(2) In the frequency domain, two different frequency bands were found in rockbolt, the 470
amplitude of the high-frequency part increased and that of the low-frequency part decreased as the 471
pull-out load on the rockbolt increased. The amplitude ratio (Q) were 6.14, 1.31, and 0.97 under 0 472
kN, 100 kN, and completely debonding condition, respectively. As the Q value increased, the 473
debonding length of rockbolt decreased exponentially, and vice versa. 474
(3) The guided wave propagation in rockbolt was very sensitive to pull-out loads. For the 475
same bond length, under increasing pull-out load, numerical results denoted that the debonding 476
developed gradually before the completely debonding, so did the softening of the interface 477
between rockbolt and cement mortar. The wave impedance mismatch (the low wave impedance 478
between rockbolt and cement mortar and the high wave impedance between rockbolt and air) 479
increased, suggesting the longer debonding of the rockbolt. 480
The guided wave propagation in the rockbolt systems is very complex because the wave 481
propagation and reflection at various interfaces exist in a mixed and complex form. This study 482
provided basic understanding of quantifying the debonding length based on analysis of the guided 483
wave propagation in the rockbolt system under pull-out load. In the long run, the analysis on the 484
complex waveform should be conducted, in order to effectively non-destructively quantify the 485
bond quality of rockbolt. 486

19
Acknowledgment 487
This work is funded by the National Science Foundation of China (Grant Nos. U1906208, 488
52104157, and 51874069), and the Fundamental Research Funds for the Central Universities of 489
China (Grant Nos. N180115009 and N180101028). These supports are gratefully acknowledged. 490
The authors thank Mr. Penghui Kang and Mr. Shichang Zhou for their assistance during the 491
laboratory test. 492
Conflict of Interest 493
We declare that there is not conflict of Interest. 494
References 495
Beard MD, Lowe MJS (2003) Non-destructive testing of rock bolts using guided ultrasonic waves, 496
Int. J. Rock Mech. Min. Sci. 40(4), 527-536. 497
Beard MD, Lowe MJS, Cawley P (2003) Ultrasonic Guided Waves for Inspection of Grouted 498
Tendons and Bolts, J. Mater. Civ. Eng. 15(3), 212-218. 499
Bouden T, Nibouche M, Djerfi F et al (2012) Improving Wavelet Transform for the Impact-Echo 500
Method of Non Destructive Testing, Lect. Not. Elect. Eng. 141, 241-247. 501
Carrión A, Genovés V, Gosálbez J et al (2017) Ultrasonic signal modality: A novel approach for 502
concrete damage evaluation, Cem. Concr. Res. 101, 25-32. 503
Chaki S, Bourse G (2009a) Guided ultrasonic waves for non-destructive monitoring of the stress 504
levels in prestressed steel strands, Ultrason. 49(2), 162-171. 505
Chaki S, Bourse G (2009b) Stress Level Measurement in Prestressed Steel Strands Using 506
Acoustoelastic Effect, Exp. Mech. 49(5), 673. 507
Chang X, Wang G, Liang Z et al (2017) Study on grout cracking and interface debonding of 508
rockbolt grouted system, Constr. Build. Mater. 135, 665-673. 509
Chen F, Wilcox PD (2007) The effect of load on guided wave propagation, Ultrason. 47(1), 510
111-122. 511
Chen GM, Teng JG, Chen JF (2011) Finite Element Modeling of Intermediate Crack Debonding in 512
FRP-Plated RC Beams, J. Compos. Constr. 15(3), 339-353. 513

20
Chen HL, Wissawapaisal K (2002) Application of Wigner-Ville Transform to Evaluate Tensile 514
Forces in Seven-Wire Prestressing Strands, J. Exp. Mech. 128(11), 1206-1214. 515
Cui Y, Zou DH (2012) Assessing the effects of insufficient rebar and missing grout in grouted rock 516
bolts using guided ultrasonic waves, J. Appl. Geophys. 79, 64-70. 517
Dassault Systemes Simulia (2014) ABAQUS theory manual and users manuals version 6.11. 518
USA. 519
Hayashi T, Song WJ, Rose JL (2004) Guided wave dispersion curves for a bar with an arbitrary 520
cross-section, a rod and rail example, Ultrason. 41(3), 175-183. 521
Henriques J, Gentili F, Silva LSD et al (2015) Component based design model for composite beam 522
to reinforced concrete wall moment-resistant joints, Eng. Struct. 87, 86-104. 523
Henriques J, Silva LSD, Valente IB (2013) Numerical modeling of composite beam to reinforced 524
concrete wall joints : Part I: Calibration of joint components, Eng. Struct. 52(9) , 747-761. 525
Ivanović A, Neilson RD (2013) Non-destructive testing of rock bolts for estimating total bolt 526
length, Int. J. Rock Mech. Min. Sci. 64(12), 36-43. 527
Kishimoto K, Inoue H, Hamada M et al (1995) Time Frequency Analysis of Dispersive Waves by 528
Means of Wavelet Transform, Trans. J. Appl. Mech. 62(4), 841-846. 529
Kwun H, Bartels KA, Hanley JJ (1998) Effects of tensile loading on the properties of elastic-wave 530
propagation in a strand, J. Acoust. Soc. Am. 103(6), 3370-3375. 531
Lee IM, Han SI, Kim HJ et al (2012) Evaluation of rock bolt integrity using Fourier and wavelet 532
transforms, Tunn. Undergr. Space Technol. 28(28), 304-314. 533
Liu X, Wu B, Qin F et al (2017) Observation of ultrasonic guided wave propagation behaviours in 534
pre-stressed multi-wire structures, Ultrason. 73, 196-205. 535
Lu Z, Xu Q (2013) Cohesive zone modeling for viscoplastic behavior at finite deformations, 536
Compos. Sci. Technol. 74(4), 173-178. 537
Luan YL, Sun T, Feng JC et al (2011) Ultrasonic evaluation of TiAl and 40Cr diffusion bonding 538
quality based on time-scale characteristics extraction, NDT & E Int. 44(8), 789-796. 539
Neild SA, Mcfadden PD, Williams MS (2003) A review of time-frequency methods for structural 540
vibration analysis, Eng. Struct. 25(6), 713-728. 541
Ni QQ, Iwamoto M (2002) Wavelet transform of acoustic emission signals in failure of model 542

21
composites, Eng. Fract. Mech. 69(6), 717-728. 543
Park K, Ha K, Choi H et al (2015) Prediction of interfacial fracture between concrete and fiber 544
reinforced polymer (FRP) by using cohesive zone modeling, Cem. Concr. Compos. 63, 545
122-131. 546
Qiao PZ, Chen Y (2008) Cohesive fracture simulation and failure modes of FRP–concrete bonded 547
interfaces, Theor. Appl. Fract. Mech. 49(2), 213-225. 548
Ren ZM, Li Y (2009) Analysis of detection signal and realization on evaluation system of bolt 549
anchoring quality based on sound wave testing, J. Chin. Coal Soc. 36(Supp.1), 191-196. (in 550
Chinese) 551
Rezazadeh M, Carvelli V, Veljkovic A (2017) Modelling bond of GFRP rebar and concrete, Constr. 552
Build. Mater. 153, 102-116. 553
Rizzo P (2006) Ultrasonic Wave Propagation in Progressively Loaded Multi-Wire Strands, Exp. 554
Mech. 46(3), 297-306. 555
Song KI, Cho GC (2010) Numerical study on the evaluation of tunnel shotcrete using the 556
impact-echo method coupled with Fourier transform and short-time Fourier transform, Int. J. 557
Rock Mech. Min. Sci. 47, 1274-1288. 558
Suits LD, Sheahan TC, Han SI et al (2008) Evaluation of Rock Bolt Integrity using Guided 559
Ultrasonic Waves, Geotech. Test. J. 32(1), 31-38. 560
Sun B, Zheng XT, Zeng S et al (2014) Multi-scale analysis on anchoring defects diagnosis under 561
multiple measuring points, J. Chin. Coal Soc. 39(7),1385-1390. (in Chinese) 562
Sun KH, Hong JC, Kim YY (2006) Dispersion-based continuous wavelet transform for the 563
analysis of elastic waves, J. Mech. Sci. Technol. 20(12), 2147-2158. 564
Wang C, He W, Ning J (2009) Propagation properties of guided wave in the anchorage structure of 565
rock bolts, J. Appl. Geophys. 69(3), 131-139. 566
Xiao GQ, Liu TY, Zhou LM et al (2006) Application of Multi-resolution analysis in detection of 567
rock anchor bar quality using elastic wave non-detructive method, J. Yangtze River Sci. Res. 568
Ins. 23(4), 67-70. (in chinese) 569
Xu C, Li Z, Wang S et al (2018) Pullout Performances of Grouted Rockbolt Systems with Bond 570
Defects, Rock Mech. Rock Eng. 51(3), 861-871. 571

22
Yang WR, He XJ, Dai L (2017) Damage behaviour of concrete beams reinforced with GFRP bars, 572
Compos. Struct. 161, 173-186. 573
Yu JD, Bae MH, Lee I.M et al (2013) Nongrouted Ratio Evaluation of Rock Bolts by Reflection of 574
Guided Ultrasonic Waves, J. Geotech. Geoenviron. Eng. 139, 298-307. 575
Yu JD, Hong YH, Byun YH et al (2016) Non-destructive evaluation of the grouted ratio of a pipe 576
roof support system in tunneling, Tunn. Undergr. Space Technol. 56 (2016) 1-11. 577
Yu SS, Zhu WC, Niu LL et al (2019) Experimental and numerical analysis of fully-grouted long 578
rockbolt load-transfer behavior, Tunn. Undergr. Space Technol. 85, 56-66. 579
Yu T, Chaix JF, Audibert L et al (2019) Simulations of ultrasonic wave propagation in concrete 580
based on a two-dimensional numerical model validated analytically and experimentally, 581
Ultrason. 92, 21-34. 582
Zhang C, Zou DH, Madenga V (2006) Numerical simulation of wave propagation in grouted rock bolts 583
and the effects of mesh density and wave frequency, Int. J. Rock Mech. Min. Sci. 43, 634-639. 584
Zima B, Rucka M (2017) Non-destructive inspection of ground anchors using guided wave 585
propagation, Int. J. Rock Mech. Min. Sci. 94, 90-102. 586
Zima B, Rucka M (2018) Guided ultrasonic waves for detection of debonding in bars partially 587
embedded in grout, Constr. Build. Mater. 168, 124-142. 588
Zou DHS, Cheng J, Yue R (2010) Grout quality and its impact on guided ultrasonic waves in 589
grouted rock bolts, J. Appl. Geophys. 72(2), 102-106. 590
591
List of table 592
Table 1 Material properties of the rockbolt, concrete and cement mortar 593
Table 2 Mix proportions of concrete and cement mortar in test594

23
595
Table.1 Material properties of the rockbolt, concrete and cement mortar 596
Ingredient Density(kg/m3) Elastic modulus(GPa) Poisson’s ratio
Rockbolt 7850 210 0.3
Cement mortar 2100 20 0.19
Concrete 2300 33 0.23
597
598
Table. 2 Mix proportions of concrete and cement mortar in test 599
Ingredient Water Cement Sand Stone
Concrete 0.47 1 1.3 3.02
Cement mortar 1 1 3.2 0
600

Figures
Figure 1
Frequency dispersion curves of group velocity of guided wave in rockbolt

Figure 2
The schematic diagram for detection of guided wave propagation in grouted rockbolt system (unit: mm)

Figure 3
Wavelet multi-scale decomposition of guided wave signals in rockbolt under different pull-out loads

Figure 4
The comparison between actual bond length and the length obtained based on wave propagationanalysis
Figure 5
Time domain and frequency domain characteristics in free rockbolt

Figure 6
Time domain and frequency domain characteristics in grouted rockbolt under different pull-out loads
Figure 7
The relationship between the Q value and the debonding length of rockbolt under different pull-out loads

Figure 8
Model setup for the grouted rockbolt systems
Figure 9
Damage law for the cohesive behavior (Rezazadeh et al. 2017)
Figure 10
Excitation signal input for the numerical simulation
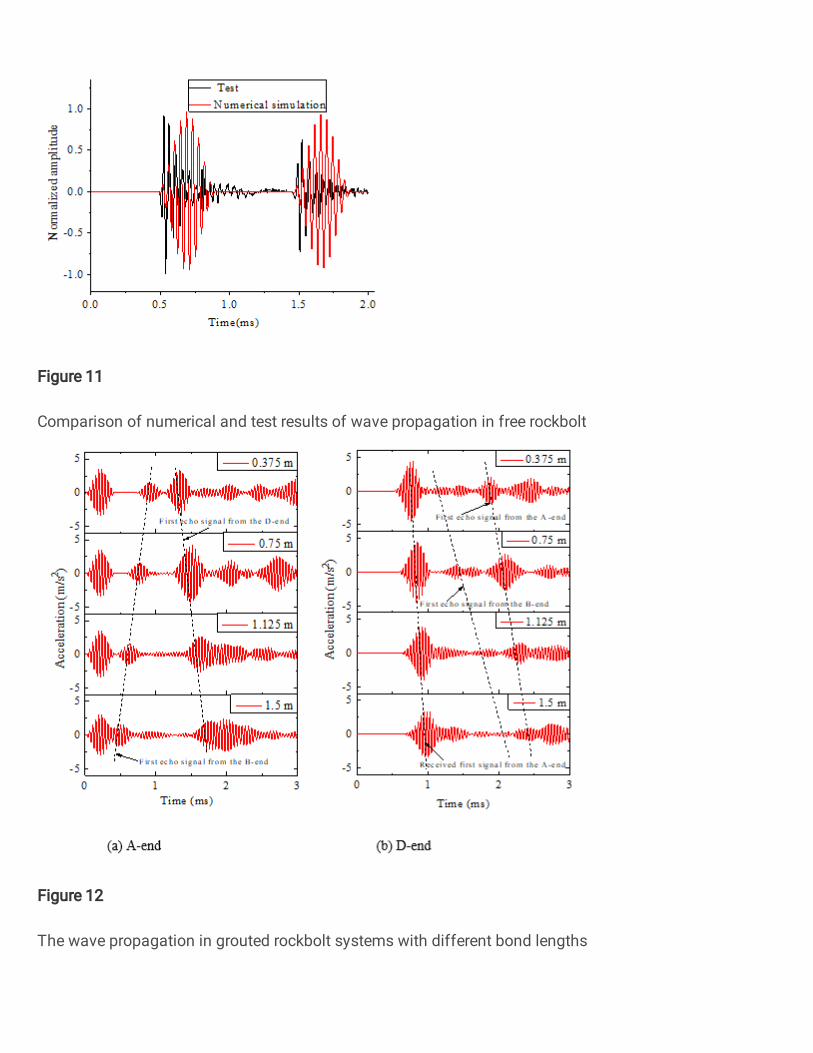
Figure 11
Comparison of numerical and test results of wave propagation in free rockbolt
Figure 12
The wave propagation in grouted rockbolt systems with different bond lengths

Figure 13
The wave propagation signals with different bond lengths under 25 kN pull-out load

Figure 14
The wave propagation signal with different bond length under different pull-out loads
Figure 15
Debonding and softening around rockbolt under different load level (SDEG, Scalar Stiffness Degradation)
Figure 16
Axial stress distribution along rockbolt under various pull-out loads (with 1.5 m bond length)


