EXPERIMENTAL AND ANALYTICAL STUDIES OF · 7.1 Summary ... Cold-formed steel roof trusses are...
94
EXPERIMENTAL AND ANALYTICAL STUDIES OF THE BEHAVIOR OF COLD-FORMED STEEL ROOF TRUSS ELEMENTS Nuthaporn Nuttayasakul Dissertation submitted to the Faculty of the Virginia Polytechnic Institute and State University in partial fulfillment for the requirements for the degree of DOCTOR OF PHILOSOPHY In Civil Engineering W. Samuel Easterling, Chairman Thomas M. Murray Finley A. Charney Carin L. Roberts-Wollmann Mehdi Setareh November 3, 2005 Blacksburg, Virginia Keywords: cold-formed steel, elemental test, full scale test, stub column test, flexural test, distortional buckling, local buckling Copyright 2005, Nuthaporn Nuttayasakul
Transcript of EXPERIMENTAL AND ANALYTICAL STUDIES OF · 7.1 Summary ... Cold-formed steel roof trusses are...

EXPERIMENTAL AND ANALYTICAL STUDIES OF THE BEHAVIOR OF COLD-FORMED STEEL
ROOF TRUSS ELEMENTS
Nuthaporn Nuttayasakul
Dissertation submitted to the Faculty of the
Virginia Polytechnic Institute and State University
in partial fulfillment for the requirements for the degree of
DOCTOR OF PHILOSOPHY
In
Civil Engineering
W. Samuel Easterling, Chairman
Thomas M. Murray
Finley A. Charney
Carin L. Roberts-Wollmann
Mehdi Setareh
November 3, 2005
Blacksburg, Virginia
Keywords: cold-formed steel, elemental test, full scale test, stub column test, flexural test, distortional buckling, local buckling
Copyright 2005, Nuthaporn Nuttayasakul

EXPERIMENTAL AND ANALYTICAL STUDIES OF THE BEHAVIOR OF COLD-FORMED STEEL
ROOF TRUSS ELEMENTS
Nuthaporn Nuttayasakul
ABSTRACT
Cold-formed steel roof truss systems that use complex stiffener patterns in
existing hat shape members for both top and bottom chord elements are a growing
trend in the North American steel framing industry. When designing cold-formed
steel sections, a structural engineer typically tries to improve the local buckling
behavior of the cold-formed steel elements. The complex hat shape has proved to
limit the negative influence of local buckling, however, distortional buckling can
be the controlling mode of failure in the design of chord members with
intermediate unbraced lengths. The chord member may be subjected to both
bending and compression because of the continuity of the top and bottom chords.
These members are not typically braced between panel points in a truss.
Current 2001 North American Specifications (NAS 2001) do not provide an
explicit check for distortional buckling. This dissertation focuses on the behavior
of complex hat shape members commonly used for both the top and bottom chord
elements of a cold-formed steel truss. The results of flexural tests of complex hat
shape members are described. In addition, stub column tests of nested C-sections
used as web members and full scale cold-formed steel roof truss tests are reported.
Numerical analyses using finite strip and finite element procedures were
developed for the complex hat shape chord member in bending to compare with

experimental results. Both elastic buckling and inelastic postbuckling finite
element analyses were performed. A parametric study was also conducted to
investigate the factors that affect the ultimate strength behavior of a particular
complex hat shape.
The experimental results and numerical analyses confirmed that modifications to
the 2001 North American Specification are necessary to better predict the flexural
strength of complex hat shape members, especially those members subjected to
distortional buckling. Either finite strip or finite element analysis can be used to
better predict the flexural strength of complex hat shape members. Better
understanding of the flexural behavior of these complex hat shapes is necessary to
obtain efficient, safe design of a truss system. The results of these analyses will
be presented in the dissertation.
iii

ACKNOWLEDGEMENTS I would like to express my gratitude to Dr. W. Samuel Easterling for his guidance
and patience. I would also like to thank you Dr. Thomas M. Murray, Dr. Carin
Roberts-Wollmann, Dr. Finley Charney, and Dr. Mehdi Setareh for serving on the
committee.
I would also like to thank Brett Farmer and Dennis Huffman for their contribution
to the fabrication and testing of the experimental part of this dissertation.
I would also like to extend my gratitude to Consolidated System Inc., which
sponsored the experimental portion of this research. I would like to thank Mr.
Harry Collins and Mr. Eric Jacobsen for their contribution and help with this
study.
iv

TABLE OF CONTENTS page ABSTRACT ………………………………………………..……. ii
ACKNOWLEDGEMENT …………………………………..……. iv
TABLE OF CONTENTS …………………………………………. v
LIST OF TABLES ……………………………………………….. ix
LIST OF FIGURES ………………………………………………. x
CHAPTER 1 INTRODUCTION …………………………………. 1
1.1 Background …………………………..……….… 1
1.2 Statement of Problem ………….………………… 2
1.3 Objective & Scope …………….………………… 4
1.4 Organization of this Dissertation ………………….. 5
CHAPTER 2 LITERATURE REVIEW …………………………… 6
2.1 Introduction …………………….………..…….…. 6
2.2 Cold-formed Steel Column ……….………………. 6
2.3 Cold-formed Steel Flexural Member ….…………… 9
2.4 Finite Strip Method …………………….………... 11
2.5 Direct Strength Method …………….……………... 12
2.5.1 Column Strength ………….……………... 12
2.5.1.1 Flexural, Torsional, or Flexural-Torsional
Buckling .………………….……... 13
2.5.1.2 Local Buckling .…………….……... 13
2.5.1.3 Distortional Buckling .……….……... 13
v
2.5.2 Flexural Strength ………….…………..…... 14
2.5.2.1 Lateral-Torsional Buckling ….…..…... 14
2.5.2.2 Local Buckling .…………….….…... 15
2.5.2.3 Distortional Buckling .……….….…... 15
2.6 Truss Design …………….…………....…………... 16
2.7 Computational Modeling …………….……………... 17
2.8 Application of Prior Research to the Current Project …... 19
CHAPTER 3 STUB COLUMNS TESTS FOR WEB MEMBERS …...... 21
3.1 Introduction …………………….………..…….…. 21
3.2 Test Specimens …………………….……..……..… 21
3.3 Material Properties …………………….…..……..... 23
3.4 Test Set-Up ………………...……….…..……..…. 23
3.5 Results ………………………………….…..…..… 24
3.6 Comparison of Test Strengths with Design Strengths ….. 26
3.7 Conclusions …………………………………..…... 27
CHAPTER 4 LATERALLY UNBRACED FLEXURAL TESTS OF
CHORD MEMBERS ……………………………...…. 28
4.1 Introduction ……………………………….…..….. 28
4.2 Background ……………………………………….. 28
4.3 Experimental Study ……………………..….………. 29
4.4 Results ………………………………..….…….…. 31
4.5 Discussion of Results …………………..…….…….. 33
4.6 Conclusions ……………………………..….……... 41
vi

CHAPTER 5 FULL SCALE TESTING OF COLD-FORMED STEEL TRUSSES WITH COMPLEX HAT SHAPE CHORD MEMBER ……………………………………..……. 42
5.1 Introduction ……………………………...……….. 42
5.2 Experimental Study ………………………..………. 42
5.3 Results ……………………………………………. 45
5.3.1 T1A Results ………….….……….……... 45
5.3.2 T1C Results …………..….…….………... 49
5.3.3 T1 Results ….…..…..….…….………... 51
5.4 Discussion of Results …….………………..……….. 52
5.5 Conclusion & Recommendations …………..……….. 56
CHAPTER 6 FINITE ELEMENT STUDY OF COMPLEX HAT SHAPES
USED AS TRUSS CHORD MEMBERS ……………. 57
6.1 Introduction ……………………………….…….. 57
6.2 Validation of Finite Element Model …………...…… 57
6.3 Finite Element Study Results …………...…………. 60
6.4 Parametric Study ………………………….……. 65
6.5 Conclusions …………………………….……….. 69
CHAPTER 7 SUMMARYS, CONCLUSIONS AND RECOMMENDATIONS ……………………………. 71
7.1 Summary ………………………….………….. 71
7.5 Conclusions ………………………….………….. 72
7.2 Recommendations …………………..…….….…. 73
References ………………………………………………….….…. 75
vii

Appendix A …………………..…………………………….….…. 78
RELIABILITY ANALYSIS EXAMPLE CALCULATIONS …… 78
Appendix B …………………..……….…………………….….…. 80
ABAQUS INPUT EXAMPLE ………………………….….…. 80
viii

LIST OF TABLES
Table 3.1 The Geometric Properties of the Tested Sections ……….. 22
Table 3.2 The Summary of the Tested Specimens Length …….… 23
Table 3.3 The Coupon Test Results from the Tested Specimens …... 23
Table 3.4 The Summary of the Test Results …………………….. 24
Table 3.5 Test to Predicted Ratio …………………….……..... 26
Table 4.1 Measured Geometric Properties of Tested Sections ……. 30
Table 4.2 Tensile Properties …………………………….……. 31
Table 4.3 Summary of the Test Results …………………….…… 33
Table 4.4a Performance Predictions for 30 inches Beams …….….. 36
Table 4.4b Performance Predictions for 60 inches Beams …………. 37
Table 4.4c Performance Predictions for 100 inches Beams ………. 38
Table 4.5a Overall Statistical Analysis ……………………….….. 38
Table 4.5b Statistical Analysis By Thickness (GA-14 and GA-22) ….. 39
Table 5.1 Details of Tested Truss ………..……………….……. 43
Table 6.1 Type of Second Mode Shape …….…………….……. 62
Table 6.2 FEA Elastic Buckling Results (P) …….….……………. 63
Table 6.3 Performance Predictions for 30 inches Beams ………….. 64
Table 6.4 Performance Predictions for 60 inches Beams ….…..…... 65
Table 6.5 FEA Predictions for First Mode Imperfection ……….…... 66
Table 6.6 FEA Predictions for Second Mode Imperfection …..….…. 67
ix

LIST OF FIGURES
Figure 1.1 Typical Complex Hat Shape as Chord Member …….……. 3
Figure 1.2 Built-Up Nested Channel Section ……………….……. 3
Figure 2.1 Three Basic Buckling Modes .……………………..…. 6
Figure 2.2 Winter and Hancock Curves .………………………..…. 8
Figure 2.3 Geometric Imperfection (Pekoz and Schafer, 1998) .……. 18
Figure 2.4 Residual Stresses in %fy (Pekoz and Schafer, 1998) ……. 18
Figure 3.1 Built-Up Nested Channel Section ……………………. 22
Figure 3.2 Test Set-Up ………………………………………….. 24
Figure 3.3 Typical Inelastic Local Buckling Mode of Failure ….…… 25
Figure 3.4 Failure of all specimens ……………………….……… 25
Figure 4.1 Typical Chord Member Geometry ……………………… 29
Figure 4.2 Schematic Drawing of Test Set-Up ……………………. 30
Figure 4.3 First and Second Mode of Distortional Buckling Failure … 32 Figure 4.4 Typical Elastic Buckling Curve of Tested Section GA-14
(3.0x5.0) ………………………………………...…. 34
Figure 4.5 Typical Elastic Buckling Curve of Tested Section GA-22
(3.0x5.0) ………………………………………...…. 35
Figure 4.6 Performance of the Test Results …………………….. 41
Figure 5.1 Test Set-Up ………………………..……………….. 44
Figure 5.2 Schematic Drawing of Test Set-Up ……………………. 44
Figure 5.3 Loading Configuration ……………………………….. 45
Figure 5.4 T1A Test 1 (First Run) Out-Of-Plane Buckling ………… 46
Figure 5.5 T1A Test 1 (Second Run) Turning Support ………….…. 46
Figure 5.6 T1A Test 2 (First Run) Cross Braces ………………..…. 47
x

Figure 5.7 T1A Test 2 (Second Run) Combined Compression and Bending
Failure ………………………………………………. 48
Figure 5.8 T1A Test 2 (Second Run) Combined Compression and Bending
Failure ………………………………………………. 48
Figure 5.9 T1C Test 1 Distortional Buckling Failure ……….………. 49
Figure 5.10 T1C Test 2 Local Buckling Failure ……………..………. 50
Figure 5.11 T1C Test 2 Fracture after Local Buckling Failure .….…..… 51
Figure 5.12 T1 Test Out-Of-Plane Buckling due to Initial Imperfection … 51
Figure 5.13 Ridge Connection Screws ……………….…….……..…. 52
Figure 5.14 Distortional Buckling of 5-in Top Chord Member .….…... 53
Figure 5.15 Result from One-Sided Screw Pattern at Panel Point .….…... 53
Figure 5.16 Performance of the T1A Trusses …………………..…. 54
Figure 5.17 Performance of the T1C Trusses …………….….……. 55
Figure 5.18 Performance of the T1 Truss …………….….……. 55
Figure 6.1 Schematic Drawing of FEA Boundary Conditions …….….. 59
Figure 6.2 Typical Stress-Strain Curve for FEA …………….…...…. 59
Figure 6.3 FEA and Tests Comparison ……….…………….…..…. 61
Figure 6.4 Force vs Displacement Plot of Chord 3x5 GA-22 @30 inch ... 68
Figure 6.5 Force vs Displacement Plot of Chord 3x5 GA-14 @30 inch ... 69
xi
CHAPTER 1
INTRODUCTION
1.1 BACKGROUND
Cold-formed steel roof trusses are economical solutions for roof framing in both
residential and commercial construction. The use of cold-formed steel roof truss
construction has commonly been in the residential market. Due to structural,
constructional and environmental advantages over timber and reinforced concrete,
cold-formed steel is an attractive alternative material for many roof framing
projects in both residential and commercial applications.
The use of cold-formed steel trusses has become popular during the last decade.
Because of environmental awareness in the United States, building construction
industries are forced to find alternatives for timber construction. Cold-formed
steel has advantages over timber in terms of moisture and insect resistance. From
a structural standpoint, cold-formed steel has a higher strength-to-weight ratio
than timber.
Cold-formed steel trusses are commonly assembled using C-sections and self-
drilling screws. Roof truss manufacturers in the United States have been trying to
improve truss design by designing and producing new shapes or using complex
stiffener patterns in existing shapes. Another possibility is to use nested C-
sections to form a box member to improve the overall member behavior. New
improvements allow the truss manufacturer to extend the application of cold-
formed steel roof trusses into commercial construction applications where longer
spans may be required.
1

1.2 STATEMENT OF PROBLEM
Cold-formed steel roof truss design relies on the strength evaluation of individual
members. The basis for these calculations is described in the 2001 North
American Specifications (NAS 2001). Previous researchers have reported that the
predictions of strength of single C-section web members in compression and
complex hat shape chord members in bending are unconservative in some cases
(Schafer 2002b). These C-sections and complex hat shape are typically used as
the web and chord members respectively. Therefore, design of the mentioned
members using the NAS 2001 could lead to unconservative cold-formed steel
truss design in some cases.
Schafer (2002b) suggested the Direct Strength Method (DSM) as a new approach
to member design. The DSM uses the finite strip method as the analytical tool to
calculate the elastic buckling stress, which in turn is used in the design equations
to predict the inelastic buckling capacity of the member. The DSM also considers
the distortional mode of buckling, which is not typically considered in the design
procedures (NAS 2001).
The DSM method has proved to be an effective tool to predict the compressive
and laterally braced flexural strength of typical cold-formed steel members
(Schafer 2002b). Studies of the effectiveness of the DSM to predict the strength
of laterally unbraced flexural members have been very limited. A complex hat
shape chord member in a cold-formed steel truss, as shown in Fig. 1.1, may
experience a bending moment and could be considered laterally unbraced between
panel points or at the overhang where the top chord member extends beyond the
end support. Therefore, further investigations on the laterally unbraced flexural
strength of these members are needed.
2

Figure 1.1 Typical Complex Hat Shape as Chord Member
The use of the nested C-sections, as shown in Fig. 1.2, to form a box member is a
new trend to improve the overall strength and efficiency of the web member in
truss design. There has been no report on either experimental or analytical studies
on the compressive strength of the nested C-sections. Stub column tests are
required by the NAS 2001 for strength determination. Numerical analyses can be
used to determine the strength at longer lengths. Analytical tools, such as the
finite element method, can be used to improve the design of the nested C-sections.
Figure 1.2 Built-Up Nested Channel Section
3

1.3 OBJECTIVE & SCOPE
The four main objectives of the research are as follows:
1. Experimentally evaluate the Consolidated Systems, Inc. cold-formed
steel roof truss system including the truss-to-truss connections, end anchorage
devices, chord and web members as well as the complete truss assembly.
2. Experimentally and analytically evaluate the behavior of built-up
compression members made of nested C-sections to form a box member.
3. Improve the flexural design for laterally un-braced cold-formed steel
beams using complex hat shapes.
4. Evaluate the overall truss behavior and design methodology through
complete truss tests and analysis.
The scope of the research is as follows:
1. Stub-column tests were performed and results were compared with
analytical calculations according to the NAS 2001.
2. Laterally unbraced flexural tests for the complex hat shape chord
members were performed and results were compared with analytical calculations
according to the NAS 2001 and the DSM. Finite strip analyses were used to
determine the appropriate lengths for the test specimens. Local, distortional, and
flexural torsional buckling behavior were investigated. Parametric studies using
finite element analyses were used to investigate the effects of the geometric
imperfection and material nonlinearity.
3. Tests of a complete cold-formed steel roof truss were performed.
Instrumentation on web members and chord members was used to monitor the
member forces. The trusses are intended for commercial buildings and the test
specimens had a span of 52 feet. Results from both the elemental tests and the
full-scale tests were analyzed to evaluate the design methodology for the cold-
formed steel truss.
4

1.4 ORGANIZATION OF THIS DISSERTATION
The Literature review of related research is reported in Chapter 2. Stub column
tests and analyses for web members are reported in Chapter 3. Laterally unbraced
flexural tests and finite strip analyses for chord members are reported in Chapter
4. The comparisons between the finite strip analyses and tests were used to
investigate the effectiveness of the finite strip method. The complete truss tests
were performed on 52 ft span cold-formed steel roof trusses and reported in
Chapter 5. The comparison between the complete truss experimental results and
the predicted values are reported. The Finite element analyses of the chord
members in bending are reported in Chapter 6. The finite element analyses were
performed for both elastic and inelastic models. The effects of material and
geometric nonlinearity were investigated and reported. Chapter 7 summarizes the
dissertation and provides conclusions and suggestions for future research.
5

CHAPTER 2
LITERATURE REVIEW
2.1 INTRODUCTION
Hancock et al. (2001) described three basic buckling modes for cold-formed steel
member as local, distortional, and overall buckling as shown in Fig. 2.1. The
local buckling mode involves only plate flexure within the line junctions between
adjacent plates, which remain straight. Distortional buckling is a buckling mode
in which the lip-stiffened elements of the section rotate about the flange-web
junction. The overall mode involves translation of cross sections of the member
without section distortion. The overall mode may consist of simple column
(Euler) buckling or flexural-torsional buckling.
Local Distortional Flexural-torsional
Figure 2.1 Three Basic Buckling Modes
2.2 COLD-FORMED STEEL COLUMNS
Kwon and Hancock (1992) reported that thin-walled channel sections and other
sections of a singly-symmetric profile, such as hat sections, may undergo
distortional buckling. Kwon and Hancock performed experimental tests and
6

analytical studies on channel columns undergoing local and distortional buckling.
The analyses were done using the BFINST program developed by Hancock to
perform a finite strip analysis. The authors argued that Winter’s (1968) formula
could also be used to predict the compressive strength of tested channel
undergoing distortional buckling. The Winter (1968) formula can be expressed as
follows.
−=
y
l
y
le
FFbb σσ
22.01 (2.1)
where be = the effective part of the plate width b
Fy = yield stress of the steel
lσ = the elastic local buckling stress
Winter’s equation is based on local buckling of single plate. If the elastic local
buckling stress ( lσ ) is replaced by the elastic distortional buckling stress ( deσ ),
then the modified Winter’s equation for distortional buckling can be expressed as
follows.
1=bbe λ ≤ 0.673 (2.2)
−=
y
de
y
dee
FFbb σσ
22.01 λ > 0.673 (2.3)
where deσ = elastic distortional buckling stress
λ = de
yFσ
7

Winter’s equation was found to be unconservative when compared with the
column test results of cold-formed channels conducted by Kwan and Hancock
(1992), therefore, they proposed the following equations that agrees better with
their test results.
1=bbe λ ≤ 0.561 (2.4)
−
=
6.06.0
25.01y
de
y
dee
FFbb σσ
λ > 0.561 (2.5)
Note that Eqs. 2.4 and 2.5 are referred to hereafter the Hancock equations.
Winter’s and Hancock’s equations are plotted as shown in Figure 2.2. Although
the test data is not shown on this plot, Kwon and Hancock (1992) showed that Eq.
2.5 agrees with test results better than Eq. 2.1.
0 1 2 3 4 50.0
0.1
0.2
0.3
0.4
0.5
0.6
0.7
0.8
0.9
1.0
1.1
Winter's Curve
Hancock's Curve
bbe
de
yFσ
λ =
Figure 2.2 Winter and Hancock Curves
8

Polyzois and Charnvarnichborikarn (1993) performed experiments on Z-sections
under compression. The findings showed that the distortional failure of the
flange/lip component may be the limit state of the section. The distortional mode
has very little postbuckling strength. Hancock et.al. (1994) reported that some
deck and rack sections may also undergo distortional buckling. The additional
finding from his previous work in 1992 was that there is no adverse interaction
between local and distortional buckling. Therefore, the distortional buckling
strength can be assessed independently of the local buckling strength even when
local buckling is occurring simultaneously.
Schafer (2002b) reported that the 1996 AISI design Specifications for cold-
formed steel columns ignore local buckling interaction with the flexural or
flexural torsional buckling and do not provide an explicit check for distortional
mode. Numerical analyses and experimental results indicate that postbuckling
capacity in the distortional mode is lower than in the local mode. This finding
implies that the member may fail in the distortional mode even when the stress
required at failure for the elastic distortional buckling mode is higher than the
elastic local buckling mode.
2.3 COLD-FORMED STEEL FLEXURAL MEMBERS
Schafer and Pekoz (1999) investigated laterally braced cold-formed steel flexural
members with edge stiffened flanges. The edge stiffened flange is described as a
flange that is stiffened by a lip at the end of flange. Their findings showed that
the moment capacity is affected by local or distortional buckling. The distortional
mode was considered to have heightened imperfection sensitivity and lower
postbuckling capacity than the local buckling mode. Their findings include the
gathering of experimental work from many researchers and analyzing the data
considering distortional buckling. They proposed design provisions that integrate
distortional buckling into the unified effective width approach currently used in
9

NAS (2001). All the test data gathered were from laterally braced flexural
members.
Experimental studies focusing on laterally unbraced cold-formed steel flexural
members have been very limited. A key piece of existing literature is a study by
Baur and LaBoube (2001) that documents the results of an experimental
evaluation of complex hat shapes from different truss manufacturers. In this
study, the authors conclude that, depending on the unbraced lengths, these shapes
experience distortional buckling. The 1996 AISI Specifications do not explicitly
address the general limit state of distorsional buckling, but do refer to it in the
commentary of section C3.1.2. The experimental studies by Baur and LaBoube
(2001) showed that ignoring the limit state of distortional buckling can be
unconservative.
Baur and LaBoube used the finite strip method described by Schafer (2002b) to
determine the critical buckling stress. This buckling stress is in turn used with
Eqs. 2.2-2.5 to predict the inelastic buckling stress. The Winter and Hancock
curves provide good correlation with the experimental results for beams with an
unbraced length of 2 to 4 ft.
The methods utilized by Baur and LaBoube can also be described in Eqs. 2.6-2.9
using moment terms instead of stress. The yield moment (My) is based on the full
section modulus. The elastic distortional buckling moment (Mcrd) is based on the
finite strip analysis. The expression represented by Eqs. 2.6 and 2.7 were
presented by Kwon and Hancock (1992) and are attributed to Winter (1968). The
inelastic distortional moment capacity (Mnd) is given by
For λd ≤ 0.673 Mnd = My (2.6)
For λd > 0.673 Mnd =0.5 0.5
crd crdy
y y
M M1 0.22 M
M M
−
(2.7)
10

where λd = y crdM M
Mcrd = Critical elastic distortional buckling moment
Kwon and Hancock (1992) proposed modified equations to better fit the
experimental data. These are expressed by:
For λd ≤ 0.561 Mnd = My (2.8)
For λd > 0.561 Mnd =0.6 0.6
crd crdy
y y
M M1 0.25 M
M M
−
(2.9)
Baur and LaBoube (2001) reported that the Kwon and Hancock equations have a
better correlation and are more conservative when compared with the
experimental results.
2.4 FINITE STRIP METHOD
The finite strip method was first developed by Cheung (1976). The finite strip
technique used in the cold-formed steel application is referred to as the spline
finite strip method. The spline finite strip method was initially developed for the
analysis of plate and shell structures. Cheung and Tham (1997) thoroughly
present the theory behind the finite strip method. Hancock modified the stiffness
matrices derived by Cheung (1976) and extended the technique for cold-formed
steel members. The use of the finite strip method as a design tool is described in
detail by Hancock, et al (2001).
The software utilizing the spline finite strip is readily available on different
platforms. Hancock (1978) developed BFINST for use in the finite strip method
calculations. The DOS based platform of the BFINST program makes it hard to
extend and further develop in research. Schafer (2002b) introduced the freeware
11

version based on the Matlab platform called CUFSM. This program is easier to
use and further develop in a research environment.
2.5 DIRECT STRENGTH METHOD
Schafer (2002b) collected and reported data from several studies on columns and
laterally braced beams. The data from these studies were used to calibrate the
Direct Strength Method (DSM) proposed by Schafer as a new approach for the
cold-formed steel design standard. The direct strength method employs elastic
buckling calculations using rational analysis. These elastic buckling calculations
are used to calibrate the equations used to predict the inelastic behavior of the
cold-formed steel members.
The axial strength of cold-formed steel columns, when the column is
concentrically loaded with pin-ended conditions, as well as the flexural strength
of cold-formed steel beams can be predicted using the DSM. The design
philosophy is based on the fact that cold-formed steel member may have three
competing mode of failures. The first mode of failure is the flexural, torsional or
flexural-torsional buckling. The second mode is local buckling and the third
mode is distortional buckling.
2.5.1 COLUMN STRENGTH
The calculations used to determine the axial compressive strength using the
DSM are given in the following sections.
12

2.5.1.1 FLEXURAL, TORSIONAL, OR FLEXURAL-TORSIONAL
BUCKLING
The nominal axial strength, Pne, for flexural, torsional, or flexural-torsional
buckling is
For λc ≤ 1.5 Pne = ( ) yPc2
658.0 λ (2.10)
For λc > 1.5 Pne = yc
P
2877.0
λ (2.11)
where λc = crey PP
Py = AgFy
Pcre = Minimum of the critical elastic column buckling load in flexural,
torsional, or flexural-torsional buckling (NAS 2001)
2.5.1.2 LOCAL BUCKLING
The nominal axial strength, Pnl, for local buckling is
for λd ≤ 0.776 Pnl= Pne (2.12)
for λd > 0.776 Pnl = nene
crl
ne
crl PPP
PP
4.04.0
15.01
− (2.13)
where λl= crlne PP
Pcrl = Critical elastic local column buckling load
(using finite strip analysis)
2.5.1.3 DISTORTIONAL BUCKLING
The nominal axial strength, Pnd, for distortional buckling is
13
for λd ≤ 0.561 Pnd= Py (2.14)
for λd > 0.561 Pnd = yy
crd
y
crd PPP
PP
6.06.0
25.01
− (2.15)
where λd= crdne PP
Pcrd = Critical elastic distortional column buckling load
(using finite strip analysis)
The strength of the column is the minimum of the calculations from the Pne, Pnl,
and Pnd. The DSM method provides acceptable reliability for predicting the axial
strengths of concentrically loaded, pin-ended cold-formed steel columns (Schafer
2002b).
2.5.2 FLEXURAL STRENGTH
Schafer (2002b) has also conducted extensive studies on the flexural behavior of
cold-formed steel sections. Most of the efforts to verify the local and distortional
buckling predictions were concentrated on laterally braced flexural members,
because these were traditionally deemed to be the most applicable bracing
configuration. The tests on laterally braced members such as Z-section purlins
were used to calibrate the DSM predictions of the local and distortional buckling
sections. The overall mode can be predicted by currently used predictions in the
NAS (2001). The flexural strength equations using the DSM for cold-formed
steel beams are summarized in the following sections.
2.5.2.1 LATERAL-TORSIONAL BUCKLING
The nominal flexural strength, Mne, for lateral-torsional buckling is
for Mcre < 0.56My Mne = Mcre (2.16)
14

for 2.78My ≥ Mcre ≥ 0.56My Mne =
−
cre
yy M
MM
3610
19
10 (2.17)
for Mcre > 2.78My Mne = My (2.18)
where
My = SgFy, where Sg is referenced to the extreme fiber in first yield
Mcre = Critical elastic lateral-torsional buckling moment (NAS 2001)
2.5.2.2 LOCAL BUCKLING
The nominal flexural strength, Mnl, for local buckling is
For λl ≤ 0.776 Mnl = Mne (2.19)
For λl > 0.776 Mnl = nene
crl
ne
crl MMM
MM
4.04.0
15.01
− (2.20)
Where λl = crlne MM
Mcrl = Critical elastic local buckling moment
(using finite strip analysis)
2.5.2.3 DISTORTIONAL BUCKLING
The nominal flexural strength, Mnd, for distortional buckling is
For λd ≤ 0.673 Mnd = My (2.21)
For λd > 0.673 Mnd = yy
crd
y
crd MMM
MM
5.05.0
22.01
−
(2.22)
Where λd = y crdM M
Mcrd = Critical elastic distortional buckling moment
(using finite strip analysis)
15

The strength of the beam is the minimum of the calculations from the Mne, Mnl,
and Mnd. The DSM method on predicting local and distortional buckling provides
acceptable reliability for predicting the flexural strengths of laterally braced
flexural members (Schafer 2002b). Additional data is needed to evaluate laterally
unbraced flexural members using the DSM before local and distortional buckling
predictions using the DSM can be applied effectively.
2.6 TRUSS DESIGN
LaBoube and Yu (1998) reported on recent research and development of cold-
formed steel framing at the University of Missouri-Rolla (UMR). The report
indicated that steel trusses in the residential construction market are commonly
assembled using C-shaped sections and self-drilling screw. Ibrahim (1998)
conducted experimental studies at UMR on cold-formed C-section residential
trusses. Based on UMR research findings, recommendations from research were
adopted into the standard for cold-formed steel framing- truss design
(AISI/COFS/TRUSS 2001). The important findings are as follows:
a. Top and bottom chord members should be modeled as continuous at
intermediate panel points and pin-ended at end panel points
b. Web member connections should be modeled as pin connections
c. C-section compression webs behave as beam-columns and exhibit only
a flexural buckling failure mode.
d. The use of 0.85 end moment coefficient (Cm) and an effective length
factor of 0.75 for the design of continuous top chords yield a good
comparison with the experimental results
The end moment coefficient and an effective length factor used in the standard for
cold-formed steel framing- truss design (AISI/COFS/TRUSS 2001) are based on
16

C-section trusses. However, the same values are recommended for hat-shape
chord members.
2.7 COMPUTATIONAL MODELING
Pekoz and Schafer (1998) have shown that modeling assumptions in the
computational models of cold-formed steel members are important. Pekoz and
Schafer (1998) reported preliminary guidelines for computational modeling of
cold-formed members, including the modeling of imperfections and residual
stresses. These fundamental quantities for characterizing the geometric
imperfections and residual stresses are necessary for accurate analyses and
parametric studies of cold-formed steel members.
The geometric imperfections are the deviations of a member from its original
idealized geometry. Pekoz and Schafer (1998) collected data on geometric
imperfections from previous research. These data can be categorized into the
maximum local imperfection in a stiffened element (type1) and the maximum
deviation from straightness for a lip stiffened or unstiffened flange (type2) as
shown in Fig. 2.3. The strength of cold-formed steel members is particularly
sensitive to imperfections in the shape of its eigenmodes, especially the lowest
eigenmode. Therefore, the maximum amplitude of imperfections used in the
lowest eigenmodes is a conservative approach to describe the governing
imperfections. As a rule of thumb, the type 1 imperfections can be approximated
as
d1 ≈ 0.006w where w = width (2.23)
17

For type 2 imperfections, the maximum deviation can be approximated as
d2 ≈ t where t = thickness (2.24)
In modeling the residual stresses, the average value in percentage of the yield
stress can be used to include the effect in the analyses. The average values
recommended by Pekoz and Schafer (1998) are shown in Fig. 2.4 for both roll-
formed and press-braked cold-formed steel. These quantities include both
membrane and flexural residual stress effects.
1 2
Figure 2.3 Geometric Imperfection (Pekoz and Schafer, 1998)
39%
23%27% 8%
17%
33%
(a) Roll-Formed (b) Press-Braked
Figure 2.4 Residual Stresses in %fy (Pekoz and Schafer, 1998)
Shanmugam and Dhanalakshmi (2000) investigated perforated cold-formed steel
angles used as compression members. A comparison of the test results and the
18

finite element model showed that the finite element model is capable of predicting
the strength and the failure modes with reasonable accuracy. The analyses were
performed using the ABAQUS finite element package. The authors used element
type S8R5, which is an 8-noded, double curved thin shell with reduced integration
and five degrees of freedom per node. The results showed that the prediction of
the ultimate load by FEA is within 10%, but generally higher, than the
experimental results. The authors explained that the difference may be due to the
approximation of the material and geometric nonlinearity used in the plate
elements without openings.
Young and Yan (2002) investigated cold-formed steel channel columns
undergoing local, distortional, and overall buckling. The authors concluded that
the finite element model closely predicted the experimental ultimate loads and the
behavior of the cold-formed channel columns. The FEA model includes the
effect of geometric imperfections by using a linear perturbation analysis. Linear
analysis can be used to establish the probable buckling modes of the column. The
buckling mode or eigenmode was scaled by a factor to obtain a perturbed mesh of
the column for the nonlinear analysis. The displacement control loading method
was used with the S4R5 element in ABAQUS, which as previously noted, is an 8-
noded, double curved thin shell with reduced integration and five degrees of
freedom per node. The parametric study also showed that the AISI Specification
is unconservative in some cases. This is not the case for the Australian Standard
(AS/NZS 1996) because it includes a separate check for distortional buckling of
singly symmetric sections.
2.8 APPLICATION OF PRIOR RESEARCH TO THE CURRENT
PROJECT
Previous analytical research on cold-formed steel roof trusses has been very
limited. The published research concentrated on C-shaped sections used in
residential construction market (LaBoube and Yu 1998). The introduction of
19

complex hat shapes for chord members and nested C-shaped sections for web
members has raised a question as to whether the previous findings can be applied
to this new development. The stub column tests for nested C-shaped section web
members and flexural tests for complex hat shape chord members are necessary to
provide test data for comparison with predictions discussed in the literature
review. The complete truss test, with complex hat shape chord members and
nested C-shaped web members, can add additional information on truss design
and development to the currently limited database. Finally, recommendations
from previous research on finite element analyses of cold-formed steel members
can be used to create finite element models of complex hat shape chord members
in bending. The finite element analyses can be used to further evaluate the test
results and investigate the flexural behavior of complex hat shape chord members.
20

CHAPTER 3
STUB COLUMN TESTS OF WEB MEMBERS
3.1 INTRODUCTION
This chapter presents the results of 23 fixed-ended stub column tests performed
on built-up cold-formed members consisting of nested C-sections and single C-
sections. The objective of this portion of the study is to confirm the stub column
test data and the comparison between the test results and predicted values using
the NAS (2001). For built-up members consisting of nested C-sections, the
available data is very limited. According to Schafer (2002a), the single channel
used as a compression member is subjected to at least three competing buckling
modes: local, distortional, and flexural buckling. The web members of a built-up
roof truss consisting of nested channels can improve the behavior of the section
under compression load because of improved rigidity. When proper restraint,
such as adequate screw spacing, is provided to prevent the separation of each
member, the failure mode can be limited to the inelastic local buckling.
3.2 TEST SPECIMENS
Both built-up sections, consisting of nested channels as shown in Fig. 3.1, and
single C-sections were tested. Two channels are nested together to form a hollow
box section. The individual channels were simple lipped sections with a lip
stiffener size, d, of 0.375 in. and typical inside bend radius, R, of 0.12 in. The
section depths, D, ranged from 2.5 in. to 6.0 in. and the width, B, ranged from 1.5
in. to 2.0 in. The test specimen cross sections are summarized in Table 3.1. The
BW sections and C sections stands for built-up web and single C-shaped web
respectively. The specimen lengths were chosen using the recommendation of
21

Galambos (1998), that is, the length should be more than three times the largest
dimension but less than twenty times the radius of gyration, ry, of the tested
section. Based on those criteria, the specimen lengths were determined as shown
in Table 3.2. The specimens were milled at both ends to achieve the required
flatness. A wooden block was inserted into the built-up member to prevent
damage of the specimen’s ends during the milling process.
Figure 3.1 Built-Up Nested Channel Section
Table 3.1 The Geometric Properties of the Tested Sections
Inside Bend Lip Thickness Depth Width Inside WidthDesignation Gage Radius, R (in.) d (in.) t (in.) D (in.) B (in.) b (in.) BW250x150 18 0.045 2.5 1.5 1.40 BW250x200 18 0.045 2.5 2.0 1.90 BW400x150 18 0.120 0.375 0.045 4.0 1.5 1.40 BW400x200 18 0.045 4.0 2.0 1.90 BW600x150 20 0.035 6.0 1.5 1.40 BW600x200 20 0.035 6.0 2.0 1.90 C250x150 20 0.035 2.5 1.5 N/A C250x200 22 0.028 2.5 2.0 N/A
Note: BW = Built-up web member C = Single C-shaped web member
22

Table 3.2 The Summary of the Tested Specimens Length
Largest Smallest Radius of Length Designation Dimension, D (in.) Gyration, ry(in.) D*L 20*ry Tested (in.)BW250x150 2.5 0.576 7.5 11.52 10 BW250x200 2.5 0.751 7.5 15.02 10 BW400x150 4 0.604 12 12.08 12 BW400x200 4 0.792 12 15.85 12 BW600x150 6 0.636 18 12.71 18 BW600x200 6 0.835 18 16.70 18 C250x150 2.5 0.556 7.5 11.12 8 C250x200 2.5 0.734 7.5 14.68 8
3.3 MATERIAL PROPERTIES
The sections were formed from a steel conforming to ASTM A653 Grade 50 with
a specified minimum yield strength, Fy, of 50 ksi and ultimate strength, Fu, of 65
ksi. Tensile coupon test specimens were taken from the flat width of the tested
specimens. Table 3.3 summarizes the average yield strength, Fya, and average
ultimate strength, Fua, of the specimens from three coupon tests of each thickness.
Table 3.3 The Coupon Test Results from the Tested Specimens
Gage Average Measured
Thickness (in.) Average Yield Strength (ksi)
Average Ultimate Strength (ksi)
18 0.045 58.2 76.3 20 0.035 62.7 82.4
3.4 TEST SET-UP
The tests were conducted using a 30 kip capacity Instron Universal Testing
machine. The built-up member was compressed between fixed-end flat steel
plates as shown in Fig. 3.2. Four strain gages, one on each side of a built-up web
member, were used to monitor and ensure the uniformity of loading on all sides of
23

the specimen. The loading rate was 0.004 in./min. Load increments of 10% of
the expected failure load were used.
Figure 3.2 Test Set-Up
3.5 RESULTS
The ultimate loads, Pu, are summarized in Table 3.4. The ultimate loads were
taken when the specimen failed to carry additional compressive load.
Table 3.4 The Summary of the Test Results
Ultimate Load (kips) % of Ultimate Load when Section Test 1 Test 2 Test 3 Average Sign of Local Buckling StartsBW250x150 25.64 25.26 25.81 25.57 95% BW250x200 27.52 28.08 28.31 27.97 95% BW400x150 25.54 23.83 24.12 24.50 65% BW400x200 27.19 27.68 27.01 27.29 55% BW600x150 15.33 14.98 N/A 15.16 55% BW600x200 18.77 17.17 17.39 17.78 45% C250x150 8.05 8.15 7.76 7.99 N/A C250x200 5.41 5.45 5.46 5.44 N/A
The specimens designated as BW250 had a lower flat width to thickness ratio
than specimens designated as BW400 and BW600. The specimen designated as
BW250 did not show signs of local buckling until the load was approximately
24
95% of the ultimate load. The specimens designated as BW400 and BW600
demonstrated local buckling on the panel, which has the largest dimension, at
approximately 45% to 65% of its ultimate strength as shown in Table 3.4. These
specimens demonstrated high post buckling strengths after their first elastic
buckling occurred. At the ultimate loads, all specimens failed in the inelastic
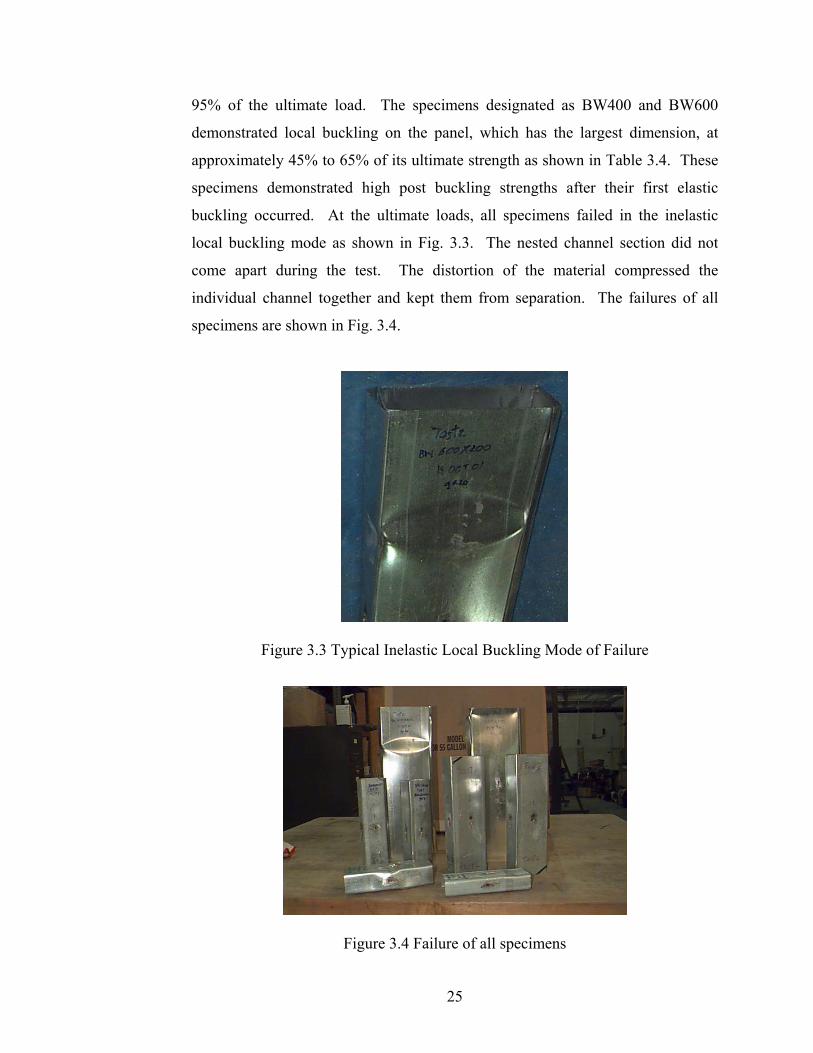
local buckling mode as shown in Fig. 3.3. The nested channel section did not
come apart during the test. The distortion of the material compressed the
individual channel together and kept them from separation. The failures of all
specimens are shown in Fig. 3.4.
Figure 3.3 Typical Inelastic Local Buckling Mode of Failure
Figure 3.4 Failure of all specimens
25

3.6 COMPARISON OF TEST STRENGTHS WITH DESIGN
STRENGTHS
Based on the results obtained from the experimental study, the tested load, Pu, was
used to calculate the effective area, Ae(test), and compared to the nominal effective
area, Ae(nom), which is defined by the NAS (2001) section C4. The Ae(test) values
were calculated using the average ultimate loads, Pu, shown in Table 3.4 and the
average yield strength, Fya from the tensile coupon tests shown in Table 3.3. The
Ae(nom) values were calculated using the CFS Cold-Formed Steel Design Software
version 4.14 (CFS 2004). The yield stress used in the calculation of the Ae(nom)
was taken to be the average yield strength, Fya from the tensile coupon tests. The
ratios between the effective areas calculated from the experimental results and the
effective area calculated using the NAS (2001) are summarized in Table 3.5.
Table 3.5 Test to Predicted Ratio
Section Name Total Area Ae(test)= Pu / Fya Ae(nom) Ae(test)
(in2) (in2) (in2) Ae(nom) BW250x150 0.516 0.439 0.394 1.12 BW250x200 0.607 0.481 0.416 1.16 BW400x150 0.652 0.421 0.408 1.03 BW400x200 0.742 0.469 0.429 1.09 BW600x150 0.643 0.252 0.273 0.92 BW600x200 0.713 0.291 0.280 1.04 C250x150 0.203 0.127 0.133 0.96 C250x200 0.195 0.087 0.100 0.86
As expected, the BW600 sections, with the highest width to thickness ratios, have
the effective area approximately 40% of the total area. The BW400 sections and
BW250 sections have lower width-to-thickness ratios and have the effective area
approximately 65% and 80% of the total area respectively. The test results are
conservative compared to the NAS (2001) except for the single C-section and the
BW600x150. The single C-sections, especially the 0.045 in. specimens, show
unconservative comparison. Previous research confirmed that the local and
distortional buckling may have an influence on single C-sections in compression.
26

A method to determine the strength of single C-section in compression is
proposed by Schafer (2002b).
3.7 CONCLUSIONS
Based on the stub column test results alone, the built-up channel sections satisfy
the predicted design values using the NAS (2001). By using the nested channel
sections, the inelastic local buckling failure mode can be achieved because of the
improved torsional rigidity. The inelastic local buckling mode of failure is harder
to achieve using a single channel section, which is subject to other modes of
failure. Further experimental and analytical studies are needed for nested C-
sections of longer lengths. The nested channel sections may separate and act as a
single channel if there is not adequate restraint of members using self-drilling
screws. The single C-section column strength can be better predicted using the
DSM proposed by Schafer (2002b).
27

CHAPTER 4
LATERALLY UNBRACED FLEXURAL TESTS OF CHORD MEMBERS
4.1 INTRODUCTION
When designing cold-formed steel sections, an engineer typically tries to improve
the local buckling behavior of the cold-formed steel elements. The complex hat
shape has proved to limit the negative influence of local buckling, however,
distortional buckling can be the controlling mode of failure in the design for
flexural members with intermediate unbraced lengths. When designing a cold-
formed steel truss, the chord member may induce bending moment because of the
continuity of the top and bottom chord members. These members are not
typically braced between each panel point in a truss. A better understanding of
the flexural behavior of these complex hat shapes is necessary for improved
design of a truss system.
4.2 BACKGROUND
Researchers have conducted extensive studies on the flexural behavior of cold-
formed steel sections. Most of the efforts have been concentrated on laterally
braced flexural members. Because cold-formed steel flexural member have
traditionally been utilized in roof or floor systems, the sections have been tested
primarily as fully braced flexural members. Schafer (2002b) collected data from
an extensive number of tests performed on laterally braced beams. This data was
used to calibrate the Direct Strength Method (DSM). The DSM method proves to
provide acceptable reliability for predicting the flexural strength of laterally
28

braced flexural members. Laterally unbraced members, such as chords in a roof
truss, are not currently address by the DSM.
4.3 EXPERIMENTAL STUDY
The objective of this part of the study is to verify and compare the flexural
behavior of the cold-formed steel chord members with the NAS (2001) and the
DSM. The complex hat shape, as shown in Fig. 4.1, was tested with two different
thicknesses and four different geometries. Table 4.1 summarizes the measured
geometric properties of the tested specimens. Based on the preliminary finite strip
analyses, three different unbraced lengths were chosen at 30, 60, and 100 inches.
The test set-up was a four-point bending test as shown in Fig. 4.2. The lateral
braces were provided at each load point (P) by flat plates. The hydraulic rams
were placed at both ends under the pinned end supports. Load cells were placed
at both ends of the unbraced length (b). The end length (a) of 20 in. was chosen
and used throughout all tests. The unbraced length (b) was set up at 30, 60, and
100 in. Hollow structural sections (HSS) were used to simulate the web member
of the truss at the end of unbraced length (b). The HSS sections were screwed to
the center of the chord member using number 10 self-drilling screws. Each
specimen was loaded to failure defined as the loss of load carrying capacity.
Figure 4.1 Typical Chord Member Geometry
29

Complex Hat Shape
Section A-A
HSSSelf Drilling Screws
Lateral Support At Load Points
Ram P
b
P
a
P P
HSSRoller
Load Cell
A
A
P Load Cell
a
Figure 4.2 Schematic Drawing of Test Set-Up
Table 4.1 Measured Geometric Properties of Tested Sections
Designation Thickness Nominal Dimension (in.) Section (in.) A B C D E Modulus (in3)
3.0x5.0-GA14 0.071 3.00 5.00 0.75 0.25 0.50 1.051 3.0x5.0-GA22 0.028 3.00 5.00 0.75 0.25 0.50 0.446 2.5x5.0-GA14 0.071 2.50 5.00 0.75 0.25 0.50 0.831 2.5x5.0-GA22 0.028 2.50 5.00 0.75 0.25 0.50 0.434 3.0x3.5-GA14 0.071 3.00 3.50 0.75 0.25 0.50 0.587 3.0x3.5-GA22 0.028 3.00 3.50 0.75 0.25 0.50 0.253 2.5x3.5-GA14 0.071 2.50 3.50 0.75 0.25 0.50 0.570 2.5x3.5-GA22 0.028 2.50 3.50 0.75 0.25 0.50 0.246
Note: All Inside Bend Radii are 0.125 in.
30

4.4 RESULTS
The experimental results are summarized in Table 4.2 and Table 4.3. Based on
the ASTM A370 criteria, Table 4.2 shows the average values of the yield stress,
ultimate stress, and percent elongation from the tensile coupon tests. Because all
the sections were rolled from the same steel sheet, average values of the tensile
coupon tests will be used. Table 4.3 shows the tested ultimate loads (P).
Because all the distances between the hydraulic ram and the end of the unbraced
length (a) are constant at 20 in., the calculation of the moment is the
multiplication of P and a.
The typical failure mode of the 30-in. and 60-in. unbraced length tests was in the
first distortional buckling mode shape as shown in Fig. 4.3. Two specimens, as
indicated in Table 4.3, failed in the second distortional buckling mode shape.
These second mode failures could be caused by the initial imperfection of the
tested specimen. The plots of the first and second mode shapes of failure are from
the results of finite strip analyses and shown in Fig. 4.3. The failure mode of the
60-in. unbraced length was mixed between the distortional and lateral-torsional
modes. The 100-in. unbraced length tests failed in the lateral-torsional mode.
Table 4.2 Tensile Properties
Actual Thickness Average Yield Average Ultimate % (in.) Strength (psi) Strength (psi) Elongation
GA14 0.071 58442 77283 27 GA22 0.028 54351 61756 38
31

First Mode Second Mode
Figure 4.3 First and Second Mode of Distortional Buckling Failure
32

Table 4.3 Summary of the Test Results
Thickness Length Ultimate Load, P (lbs) Specimen GA (in.) (in.) Test 1 Test 2 Test 3 Test 4 Average3.0x5.0 14 0.071 30 1620 1780 1550* 1810 1737
60 1430 1390 1370 1270 1365 100 1160 1170 1000 N/A 1110 22 0.028 30 460 500* 410 475 448 60 330 310 310 290 310 100 210 260 230 210 228
2.5x5.0 14 0.071 30 1950 1830 1910 1910 1900 60 1260 1160 1220 N/A 1213 22 0.028 30 340 330 350 370 348 60 320 320 300 N/A 313
3.0x3.5 14 0.071 30 1610 1560 1570 1540 1570 60 1310 1320 1230 N/A 1287 22 0.028 30 460 400 370 380 403 60 310 300 360 280 313
2.5x3.5 14 0.071 30 1580 1680 1690 1440 1598 60 1220 1150 1170 1120 1165 22 0.028 30 390 460 420 360 408 60 280 250 270 N/A 267
* These specimens failed in the second mode of distortional buckling
4.5 DISCUSSION OF RESULTS
The CFS software (2003) was used to calculate the moment capacity, Mn, AISI,
according to the NAS (2001). All calculations were based on the yield stress
from the tensile coupon tests. The prediction of the inelastic distortional buckling
moment capacity, Mnd, using both Winter’s and Hancock’s equations were also
calculated. The CUFSM software (Schafer, 2002b) was used to generate the
elastic buckling curve to determine the elastic distortional moment, Mcrd, as input
to Eqs. 2.6 through Eqs. 2.9.
In determining Mcrd, the critical elastic buckling stress for the distortional
buckling mode is needed. The geometry of the tested complex hat shape yields
33

the elastic buckling curve shown in Fig. 4.4-4.5 for GA-14 and GA-22 members
respectively. The elastic buckling curve of the first mode does not explicitly
show the second minima usually identified as the distortional buckling stress. In
deciding the critical elastic distortional buckling stress, consideration of the
second mode elastic buckling curve is necessary.
half-wavelength (in.)1 10 100 1000
Crit
ical
Ela
stic
Buc
klin
g St
ress
(ksi
)
0
20
40
60
80
100
120
Second Mode
First Mode
30
Figure 4.4 Typical Elastic Buckling Curve of Tested Section GA-14 (3.0x5.0)
The elastic buckling curve of the second mode can be plotted to help in deciding
the value of the distortional buckling stress. When the elastic buckling stress for a
higher mode is close to the first mode stress, such as stresses at unbraced length of
30 in., then the buckling stress of the higher mode must be considered. For the
GA-14 section, as shown Fig. 4.4, the minima of the second mode stress occurs at
the half-wavelength of 30 in. and has a higher value than the stress at the half-
wavelength of 30-in. for the first mode. The lower value of the first mode is taken
as the critical elastic buckling stress to calculate the Mcrd. For the GA-22 section,
as shown in Fig. 4.5, the minima of the second mode stress occurs at the half-
34

wavelength of 50 in. and has a lower value than the critical buckling stress of the
first mode at the half-wavelength of 30 in. Therefore, the lower critical
distortional buckling stress at the half-wavelength of 50 in. is used to calculate the
Mcrd for the GA-22 specimen with the laterally unbraced length of 30 in. This
conservative procedure of choosing the Mcrd improves the prediction for both
Winter’s and Hancock’s equations.
half-wavelength (in.)1 10 100 1000
Crit
ical
Ela
stic
Buc
klin
g St
ress
(ksi
)
0
10
20
30
40
50
Second Mode
First Mode
30
Figure 4.5 Typical Elastic Buckling Curve of Tested Section GA-22 (3.0x5.0)
Three predictions, the NAS (2001), Winter’s equation, and Hancock’s equations,
were compared with the experimental results as shown in Table 4.4a, b, and c.
The results in Table 4.4a, b, and c show the ratio between the test moment and
predicted moment for 30-in., 60-in., and 100-in. unbraced lengths, respectively.
The ratios of the test results to the strength predicted by the NAS (2001) for the
GA-22 specimens are found to be as low as 0.438 and 0.555 for the 30-in. and 60-
in. unbraced length tests, respectively. This result shows that the NAS (2001) is
35

unconservative in predicting the flexural behavior at this intermediate length. For
the 100-in. beam tests, the NAS (2001) predictions show the best correlation with
the test results as shown in Table 4.4c. This agreement is expected because the
mode of failure is predominantly lateral or lateral-torsional buckling.
Table 4.4a Performance Predictions for 30 inches Beams
Thickness Load Mt Mt Mt Mt Specimen GA (in.) P, (lb) (in-kip) Mn
NAS (2001) MnWinter Mn
Hancock
3.0x5.0 14 0.071 1620 32.4 0.633 0.987 1.092 1780 35.6 0.695 1.084 1.200 1550 31.0 0.605 0.944 1.045 1810 36.2 0.707 1.103 1.220
3.0x5.0 22 0.028 460 9.2 0.573 0.923 1.076 500 10.0 0.623 1.003 1.170 410 8.2 0.511 0.823 0.959 475 9.5 0.592 0.953 1.111
2.5x5.0 14 0.071 1950 39.0 1.040 1.535 1.705 1830 36.6 0.976 1.440 1.600 1910 38.2 1.018 1.503 1.670 1910 38.2 1.018 1.503 1.670
2.5x5.0 22 0.028 340 6.8 0.451 0.688 0.799 330 6.6 0.438 0.668 0.776 350 7.0 0.464 0.708 0.823 370 7.4 0.491 0.749 0.870
3.0x3.5 14 0.071 1610 32.2 1.112 1.343 1.417 1560 31.2 1.077 1.301 1.373 1570 31.4 1.084 1.309 1.382 1540 30.8 1.063 1.284 1.355
3.0x3.5 22 0.028 460 9.2 0.797 1.214 1.335 400 8.0 0.693 1.055 1.161 370 7.4 0.641 0.976 1.074 380 7.6 0.659 1.002 1.103
2.5x3.5 14 0.071 1580 31.6 1.228 1.388 1.470 1680 33.6 1.306 1.476 1.563 1690 33.8 1.314 1.484 1.572 1440 28.8 1.120 1.265 1.340
2.5x3.5 22 0.028 390 7.8 0.767 1.038 1.139 460 9.2 0.905 1.225 1.343 420 8.4 0.826 1.118 1.226 360 7.2 0.708 0.959 1.051
36

Table 4.4b Performance Predictions for 60 inches Beams
Thickness Load Mt Mt Mt Mt Specimen GA (in.) P, (lb) (in-kip) Mn
NAS (2001) MnWinter Mn
Hancock
3.0x5.0 14 0.071 1430 28.6 0.923 0.928 1.040 1390 27.8 0.898 0.902 1.011 1370 27.4 0.885 0.889 0.996 1270 25.4 0.820 0.824 0.923
3.0x5.0 22 0.028 330 6.6 0.632 0.748 0.895 310 6.2 0.593 0.703 0.840 310 6.2 0.593 0.703 0.840 290 5.8 0.555 0.658 0.786
2.5x5.0 14 0.071 1260 25.2 1.564 1.155 1.323 1160 23.2 1.440 1.064 1.218 1220 24.4 1.514 1.119 1.281
2.5x5.0 22 0.028 320 6.4 0.823 0.774 0.933 320 6.4 0.823 0.774 0.933 300 6.0 0.772 0.726 0.875
3.0x3.5 14 0.071 1310 26.2 1.360 1.294 1.405 1320 26.4 1.371 1.304 1.416 1230 24.6 1.277 1.215 1.319
3.0x3.5 22 0.028 310 6.2 0.850 0.951 1.077 300 6.0 0.823 0.920 1.042 360 7.2 0.987 1.104 1.251 280 5.6 0.768 0.859 0.973
2.5x3.5 14 0.071 1220 24.4 1.841 1.400 1.555 1150 23.0 1.735 1.319 1.466 1170 23.4 1.765 1.342 1.491 1120 22.4 1.690 1.285 1.427
2.5x3.5 22 0.028 280 5.6 1.055 0.944 1.084 250 5.0 0.942 0.843 0.968 270 5.4 1.017 0.911 1.046
The statistical analyses of these comparisons can be used to better analyze the test
results. The mean, standard deviation, coefficient of variation, and resistance
factor (Φ) of the comparison ratios in Table 4.4 are tabulated in Table 4.5a and b.
The resistance factors were calculated based on the reliability index (β) of 2.5
according the NAS (2001) procedure, which is shown in Appendix A. Table 4.4a
shows the overall performance of each method and Table 4.5b shows the
comparison of the results between GA-22 and GA-14 specimens.
37
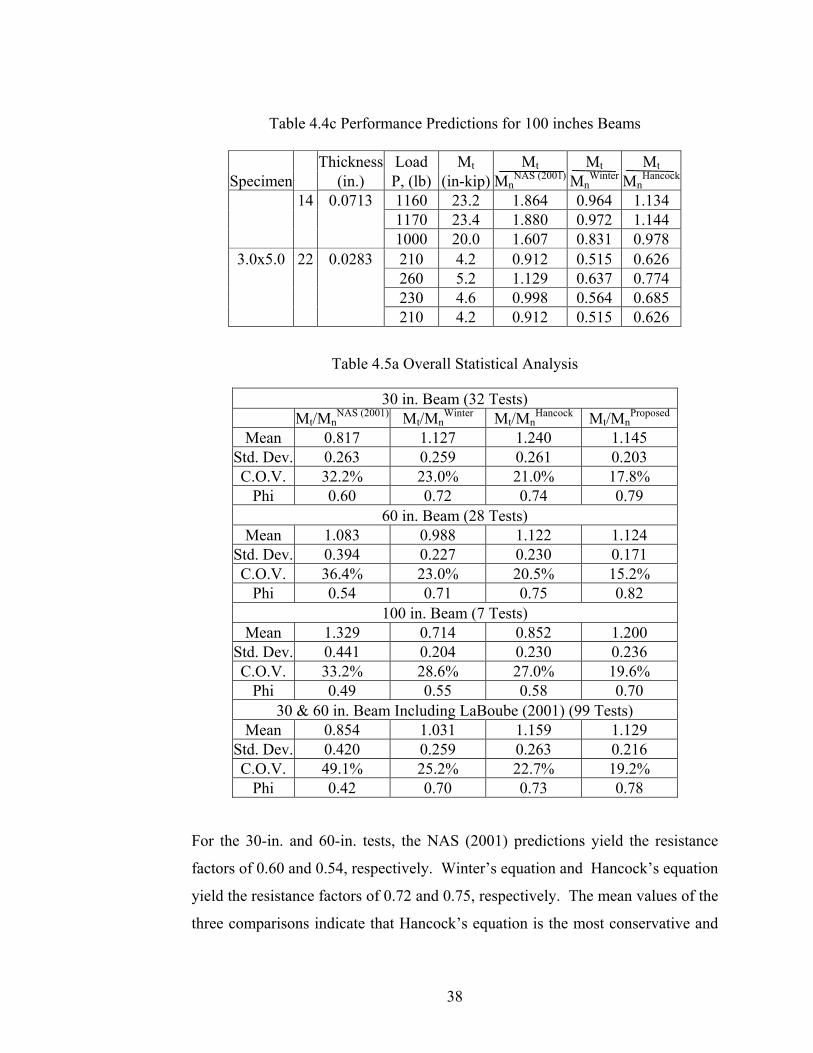
Table 4.4c Performance Predictions for 100 inches Beams
Thickness Load Mt Mt Mt Mt
Specimen GA (in.) P, (lb) (in-kip) MnNAS (2001) Mn
Winter MnHancock
3.0x5.0 14 0.0713 1160 23.2 1.864 0.964 1.134 1170 23.4 1.880 0.972 1.144 1000 20.0 1.607 0.831 0.978
3.0x5.0 22 0.0283 210 4.2 0.912 0.515 0.626 260 5.2 1.129 0.637 0.774 230 4.6 0.998 0.564 0.685 210 4.2 0.912 0.515 0.626
Table 4.5a Overall Statistical Analysis
30 in. Beam (32 Tests) Mt/Mn
NAS (2001) Mt/MnWinter Mt/Mn
Hancock Mt/MnProposed
Mean 0.817 1.127 1.240 1.145 Std. Dev. 0.263 0.259 0.261 0.203 C.O.V. 32.2% 23.0% 21.0% 17.8%
Phi 0.60 0.72 0.74 0.79 60 in. Beam (28 Tests)
Mean 1.083 0.988 1.122 1.124 Std. Dev. 0.394 0.227 0.230 0.171 C.O.V. 36.4% 23.0% 20.5% 15.2%
Phi 0.54 0.71 0.75 0.82 100 in. Beam (7 Tests)
Mean 1.329 0.714 0.852 1.200 Std. Dev. 0.441 0.204 0.230 0.236 C.O.V. 33.2% 28.6% 27.0% 19.6%
Phi 0.49 0.55 0.58 0.70 30 & 60 in. Beam Including LaBoube (2001) (99 Tests)
Mean 0.854 1.031 1.159 1.129 Std. Dev. 0.420 0.259 0.263 0.216 C.O.V. 49.1% 25.2% 22.7% 19.2%
Phi 0.42 0.70 0.73 0.78
For the 30-in. and 60-in. tests, the NAS (2001) predictions yield the resistance
factors of 0.60 and 0.54, respectively. Winter’s equation and Hancock’s equation
yield the resistance factors of 0.72 and 0.75, respectively. The mean values of the
three comparisons indicate that Hancock’s equation is the most conservative and
38

the most reliable of the three predictions. The experimental results by Baur and
LaBoube (2001) on 24-in. and 48-in. unbraced lengths are included with the 30-
in. and 60-in. unbraced length results in this experimental program for the overall
statistical analyses shown in Table 4.5a. The Hancock equation is the most
conservative and reliable with the mean of 1.16 and the resistance factor of 0.73.
The statistical analyses by thickness, as shown in Table 4.5b, indicate that all
three predictions show good agreement, with the mean value higher than 1.0.
Because the GA-14 (0.071 in.) specimen has width to thickness ratio 2.5 times
higher than the GA-22 (0.028) specimen, the GA-14 specimen will likely be
influenced less by the effect of distortional buckling. Hancock’s equation still
yields the most conservative and reliable of the three predictions, with a resistance
factor as high as 0.80.
Table 4.5b Statistical Analysis By Thickness (GA-14 and GA-22)
30 in. Beam (16 Tests Each)
Mt/MnNAS (2001) Mt/Mn
Winter Mt/MnHancock Mt/Mn
Proposed 14-GA 22-GA 14-GA 22-GA 14-GA 22-GA 14-GA 22-GA
Thickness (in.) 0.071 0.028 0.071 0.028 0.071 0.028 0.071 0.028 Mean 1.000 0.634 1.309 0.944 1.417 1.063 1.246 1.044
Std. Dev. 0.225 0.143 0.19 0.175 0.206 0.177 0.21 0.14 C.O.V. 23% 23% 15% 19% 15% 17% 17% 13%
Phi 0.71 0.71 0.82 0.76 0.82 0.79 0.78 0.83 60 in. Beam (14 Tests Each)
Mean 1.363 0.802 1.146 0.83 1.276 0.967 1.216 1.031 Std. Dev. 0.356 0.163 0.194 0.125 0.207 0.124 0.187 0.088 C.O.V. 26% 20% 17% 15% 16% 13% 15% 9%
Phi 0.65 0.73 0.78 0.81 0.79 0.83 0.8 0.88 100 in. Beam (3 Tests for 14-GA, 4 Tests for 22-GA)
Mean 0.988 0.922 0.558 1.085 0.678 0.950 1.387 Std. Dev. 0.153 0.103 0.079 0.058 0.093 0.070 0.040 0.037 C.O.V. 9% 10% 9% 10% 9% 10% 4% 3%
Phi 0.76 0.77 0.76 0.77 0.76 0.77 0.88 0.91
1.784
39
Based on the test data in this experimental program and those reported by Baur
and LaBoube (2001), the statistical analyses can be used to find the better
equation to predict the test data by using the same parameters. The parameters
used in the equation are the yield moment, My, and the moment ratio, λd =
crdy MM . In attempting to use the same inverse polynomial equations, none
of the coefficients gives a significantly better fit to the available data than the
others. Therefore, the proposed equation used to fit the data available for the
laterally unbraced flexural member is expressed in decay-log term as
For λd ≤ 1.0 Mnd = My (4.1)
For λd > 1.0 Mnd = yMe d
+ 5.2
0.15
0135.0 λ (4.2)
This proposed equation is plotted against the test data as shown in Fig. 4.6. The
proposed equation increases the transition point of the moment ratio to 1.0 where
the distortional moment is equal to the yield moment. If the elastic distortional
moment is more than the yield moment, the yield moment is used for the
distortional buckling moment. The statistical analyses, shown in Table 4.5,
indicate that the proposed equation is the most reliable. Resistance factors of 0.85
and 0.80 are determined for the GA-22 and GA-14 specimens, respectively.
40

0 1 2 3 4 50.0
0.1
0.2
0.3
0.4
0.5
0.6
0.7
0.8
0.9
1.0
1.1
Winter's Curve
Hancock's Curve
30 in.
24 in. (LaBoube 2001)
60 in.
48 in. (LaBoube 2001)
Proposed Curve
y
t
MM
cr
y
MM
=λ
Figure 4.6 Performance of the Test Results
4.6 CONCLUSIONS
Experimental studies on the flexural behavior of a complex hat shape was
performed and reported. The analyses using the elastic buckling curve reveal
complications regarding the selection of the minima for the critical elastic
buckling stress in the distortional buckling mode. The consideration of all modes
in deciding the value of the minima for the distortional buckling is important in
improving the prediction of Winter’s and Hancock’s equations. The comparisons
of the experimental results with the predictions from the NAS (2001) yield
unconservative and less reliable values compared to the predictions by the Winter
and Hancock equations, especially for the GA-22 specimens. Hancock’s equation
is the most conservative and reliable of the three predictions with the overall
resistance factor being 0.73. The proposed equation can improve the overall
reliability and yields the overall resistance factor of 0.78.
41

CHAPTER 5
FULL SCALE TESTING OF COLD-FORMED STEEL TRUSSES WITH
COMPLEX HAT SHAPE CHORD MEMBER
5.1 INTRODUCTION
Full scale truss testing has been limited to trusses with C-section members, as
reported by LaBoube et al. (1998). The previous studies focused on the use of
cold-formed steel trusses in the residential construction market. The tested
trusses were assembled using C-shaped sections and self-drilling screws.
Recently, new technology in rolling cold-formed steel allows the manufacturers to
roll a complex hat shape to use as top and bottom chord members. The complex
hat shape allows the manufacturers to extend the cold-formed steel roof truss
applications into commercial buildings where longer spans are typically used.
Full scale testing is necessary for further improvement in safety and efficiency of
the newly developed trusses using complex hat shape.
5.2 EXPERIMENTAL STUDY
The objectives of this portion of the study are to experimentally verify the
strength and stiffness of a cold-formed steel truss system, as well as, evaluate the
behavior and strength of the connections. The results will be compared to
calculations made according to the NAS (2001) using the TRUSS D&E (2002)
software, which uses a first order stiffness analysis along with the fully effective
properties of the cold-formed truss members. The cold-formed steel trusses, as
shown in Fig. 5.1, were tested in pairs. The configurations and geometry of the
trusses were chosen to represent the typical truss fabricated by the manufacturer.
Table 5.1 summarizes the geometric properties of the tested trusses. The test set-
up used 19 load application points as shown in the schematic drawing in Fig. 5.2.
42

Table 5.1 Details of Tested Truss
T1A T1C T1 Description Depth (in.) Description Depth (in.) Description Depth (in.)Top Chord SC350-68 3.5 SC500-68 5.0 SC500-68 5.0 Bottom Chord SC350-54 3.5 SC350-54 3.5 SC350-54 3.5 Web # 1 BW400-54 4.0 NONE N/A BW400-54 4.0 Web # 2 C250-27 2.5 C250-27 2.5 C250-27 2.5 Web # 3 C250-27 2.5 C250-45 2.5 C250-27 2.5 Web # 4 C250-27 2.5 C250-27 2.5 C250-27 2.5 Web # 5 BW250-27 2.5 BW250-27 2.5 BW250-27 2.5 Web # 6 C250-27 2.5 C250-34 2.5 C250-27 2.5 Web # 7 BW250-27 2.5 BW250-27 2.5 BW250-27 2.5 Web # 8 C250-54 2.5 C250-54 2.5 C250-54 2.5 Web # 9 BW400-34 4.0 BW400-34 4.0 BW400-34 4.0 Web # 10 BW250-45 2.5 BW250-45 2.5 BW250-45 2.5 Web # 11 BW250-54 2.5 BW600-68 6.0 BW250-54 2.5
Description Depth Thickness Area Ix Iy
(in.) (in.) (in^2) (in^4) (in^4) SC350-68 3.5 0.071 0.79 1.16 0.94 SC500-68 5.0 0.071 1.01 2.92 1.17 SC300-54 3.0 0.057 0.64 0.96 0.76 C250-27 5.0 0.028 0.20 0.22 0.11 C250-54 2.5 0.057 0.38 0.42 0.20 BW200-27 2.5 0.028 0.39 0.43 0.23 BW400-34 4.0 0.035 0.57 1.50 0.37 BW250-45 2.5 0.045 0.61 0.67 0.34 BW250-54 2.5 0.057 0.75 0.82 0.42 BW400-54 4.0 0.057 0.92 2.38 0.57 BW600-68 6.0 0.071 1.43 7.54 0.93
43
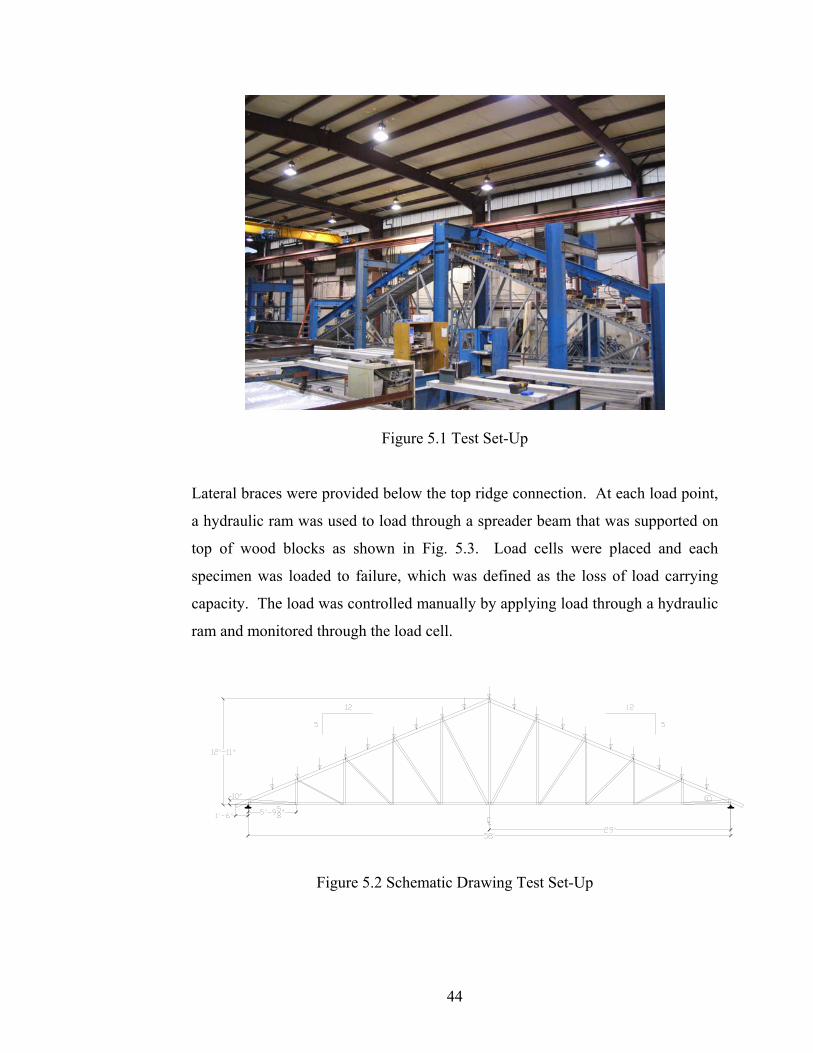
Figure 5.1 Test Set-Up
Lateral braces were provided below the top ridge connection. At each load point,
a hydraulic ram was used to load through a spreader beam that was supported on
top of wood blocks as shown in Fig. 5.3. Load cells were placed and each
specimen was loaded to failure, which was defined as the loss of load carrying
capacity. The load was controlled manually by applying load through a hydraulic
ram and monitored through the load cell.
Figure 5.2 Schematic Drawing Test Set-Up
44

Three different trusses were tested and designated at T1A, T1C and T1 as
described in Table 5.1. Two different tests were performed on both T1A and T1C
and one test was performed on truss T1. The major objective of testing the T1C
truss was to determine the strength and stiffness of the truss when the first
diagonal web (web # 1) located next to the support was not included in the design.
Both T1 and T1A trusses had the same configuration, except the T1 truss had a 5
in. top chord, instead of a 3.5 in. top chord.
Figure 5.3 Loading Configuration
5.3 RESULTS
5.3.1 T1A RESULTS
T1A-TEST 1 The failure mode of the first test was out-of-plane buckling in diagonal web
number 7 as shown in Fig. 5.4. The failure was not expected from the web
because the webs are braced out-of-plane when the truss is installed in a building.
Thus bracing was omitted in T1A-Test 1. The failed members were replaced on
the same truss and cross braces were installed to prevent premature failure of the
web. The load was reapplied until failure occurred at the support. The support
45

rolled out of plane because of the configuration of the load cell as shown in Fig.
5.5. This failure mode was also not expected and a second test of the T1A truss
was necessary.
Figure 5.4 T1A Test 1 (First Run) Out-Of-Plane Buckling
Figure 5.5 T1A Test 1 (Second Run) Turning Support
46

T1A-TEST 2
On the second test, the cross braces were installed on web number 7 and 9 as
shown in Fig. 5.6. The braces were installed to prevent the premature failure that
occurred in the first test. However, the failure mode of the second test was still
out-of-plane buckling of the same web member. The failed members were
replaced with new web members on the same truss. The additional cross braces
were added to make sure the web would not buckle out-of-plane. The load was
reapplied and the failure mode of the second run was the combined bending and
compression on the top chord member as shown in Fig. 5.7 and 5.8.
Figure 5.6 T1A Test 2 (First Run) Cross Braces
47

Figure 5.7 T1A Test 2 (Second Run) Combined Compression and Bending Failure
Figure 5.8 T1A Test 2 (Second Run) Combined Compression and Bending Failure
48
5.3.2 T1C RESULTS
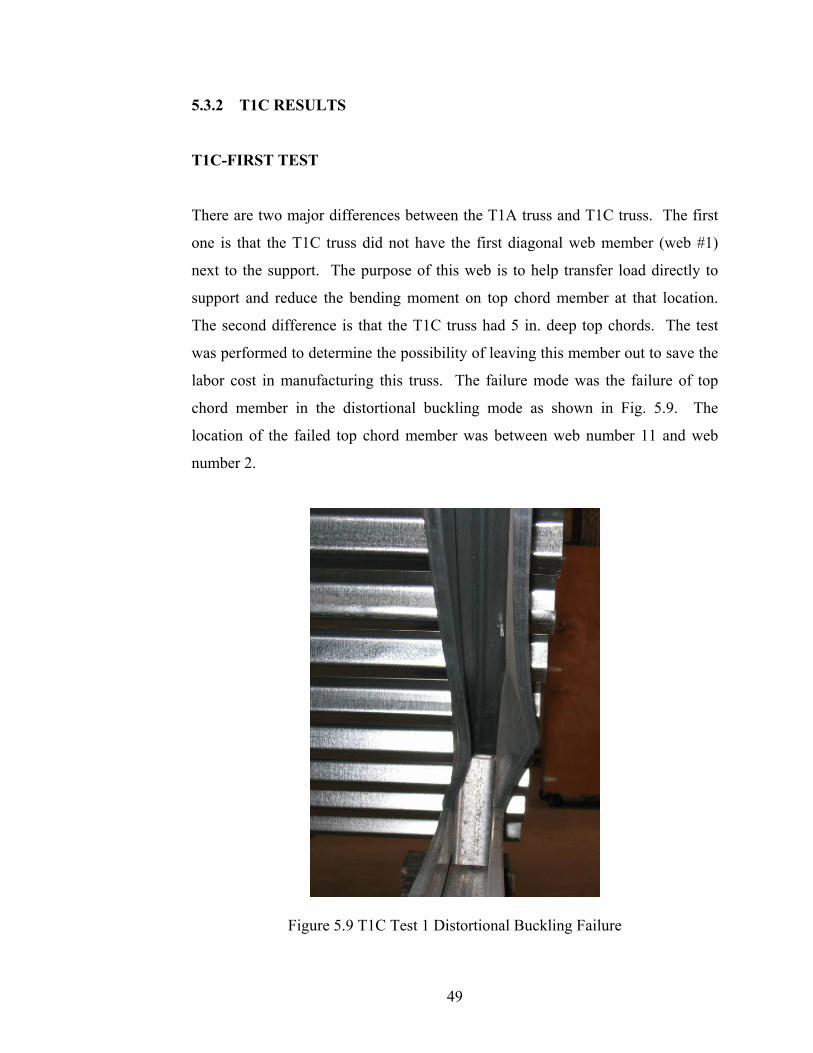
T1C-FIRST TEST
There are two major differences between the T1A truss and T1C truss. The first
one is that the T1C truss did not have the first diagonal web member (web #1)
next to the support. The purpose of this web is to help transfer load directly to
support and reduce the bending moment on top chord member at that location.
The second difference is that the T1C truss had 5 in. deep top chords. The test
was performed to determine the possibility of leaving this member out to save the
labor cost in manufacturing this truss. The failure mode was the failure of top
chord member in the distortional buckling mode as shown in Fig. 5.9. The
location of the failed top chord member was between web number 11 and web
number 2.
Figure 5.9 T1C Test 1 Distortional Buckling Failure
49

T1C-SECOND TEST
Due to the top chord failure from the first test, T1C, the second test was modified
to include a reinforced top chord near the support. The inserted member, which
was a double channel box shape, was screwed to the top chord with #10 screws at
12 in. on center. The modification was made to improve the top chord strength
and to prevent the failure in a distortional buckling mode. The failure mode of the
second test changed from distortional buckling to a local buckling failure of the
same top chord member as shown in Fig. 5.10. Once the local buckling failure
occurred, the load was applied further and caused the bottom chord member to
start a fracture as shown in Fig. 5.11.
Figure 5.10 T1C Test 2 Local Buckling Failure
50

Figure 5.11 T1C Test 2 Fracture after Local Buckling Failure
5.3.3 T1 RESULTS
The difference between the T1 and T1A trusses was that the T1 trusses had 5 in.
top chords. Due to the initial imperfection in the rolling of the box web member,
the mode of failure was out-of-plane buckling of web number 7 as shown in Fig.
5.12. The rolled webs did not perfectly nest together and therefore did not act
together as a box member.
Figure 5.12 T1 Test Out-Of-Plane Buckling due to Initial Imperfection
51

5.4 DISCUSSION OF RESULTS
GENERAL OBSERVATIONS
From the full scale test, the results reveal important findings that can be used to
improve the understanding of the cold-formed steel truss. The first finding that
should be mentioned is that the GA-22 web members have shown to be
vulnerable to damage during shipping and caused the premature failure especially
to out-of-plane buckling. Another observation is that the screw pattern at the top
ridge connection as shown in Fig. 5.13 should be required to be placed at the edge
of the chord. The edge screws can prevent the end from opening up when
sustaining load and caused screws to pull out.
Figure 5.13 Ridge Connection Screws
The 5-in. top chord member distorted elastically more than the 3.5-in. top chord
as shown in Fig. 5.14. Because the T1 test failed prematurely at the web, there is
no conclusive evidence to show that the truss with a 3.5-in top chord performs
better than one with a 5-in. top chord.
52
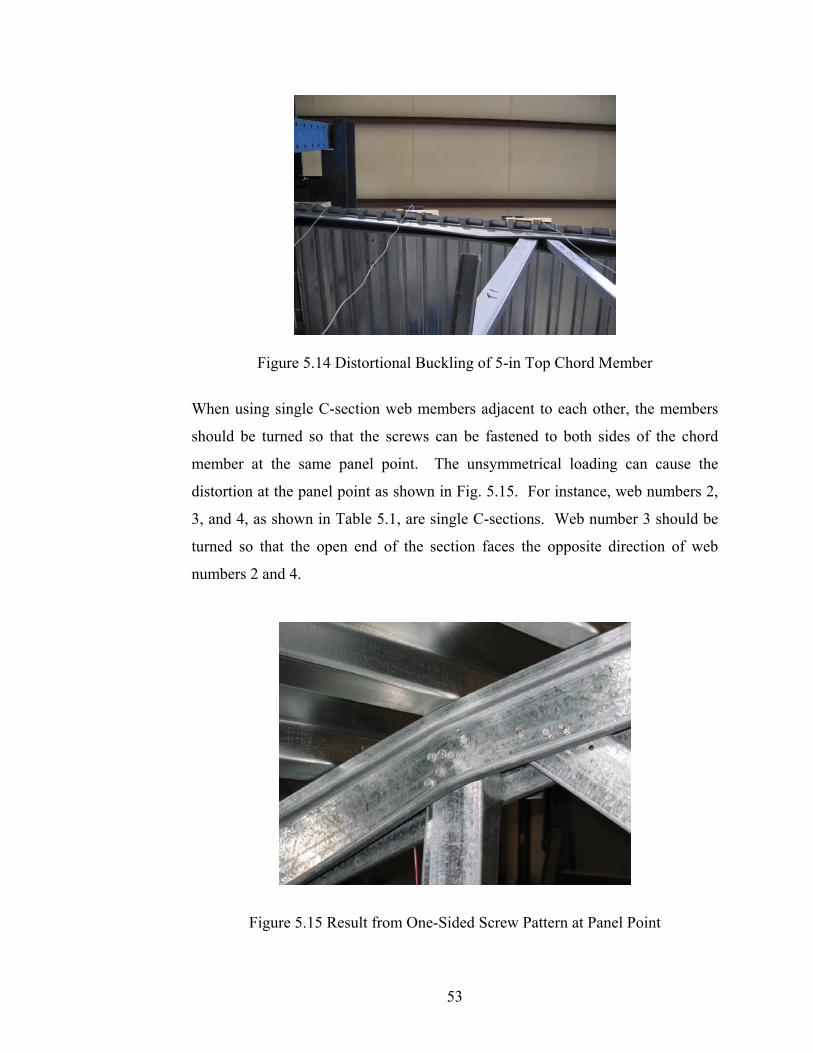
Figure 5.14 Distortional Buckling of 5-in Top Chord Member
When using single C-section web members adjacent to each other, the members
should be turned so that the screws can be fastened to both sides of the chord
member at the same panel point. The unsymmetrical loading can cause the
distortion at the panel point as shown in Fig. 5.15. For instance, web numbers 2,
3, and 4, as shown in Table 5.1, are single C-sections. Web number 3 should be
turned so that the open end of the section faces the opposite direction of web
numbers 2 and 4.
Figure 5.15 Result from One-Sided Screw Pattern at Panel Point
53

PERFORMANCE OF TRUSSES
The performance of trusses T1A, T1C, and T1 can be summarized in load and
deflection plots as shown in Fig. 5.16, 5.17, and 5.18. The T1A and T1
experimental data agrees with the analysis conducted with the commercial
software program Truss D&E (2002). The truss models are based on offset nodes
at the panel points. The Truss D&E program does not allow the modeling of the
T1C truss because of the absence of web # 1. The test result showed that the
absence of web # 1 induced significant bending moment at the top chord member
near the support and failed the top chord member in distortional buckling mode.
All the trusses that were tested exceeded the typical design service load of the
roof truss of 40 psf. After the premature failure of the web was prevented, the
failure load of the T1A truss was at 2.12 times the service load.
Load vs Max. Deflection
0
10
20
30
40
50
60
70
80
90
100
0 0.5 1 1.5 2 2.5 3
Deflection (in.)
Load
(psf
)
Test 1#1 Web Buckle
Test 1#2 Rolled Support
Test 2#1 Web Buckle
Test 2#2 Top Chord Failure
Truss D&E Analysis
Figure 5.16 Performance of the T1A Trusses
54
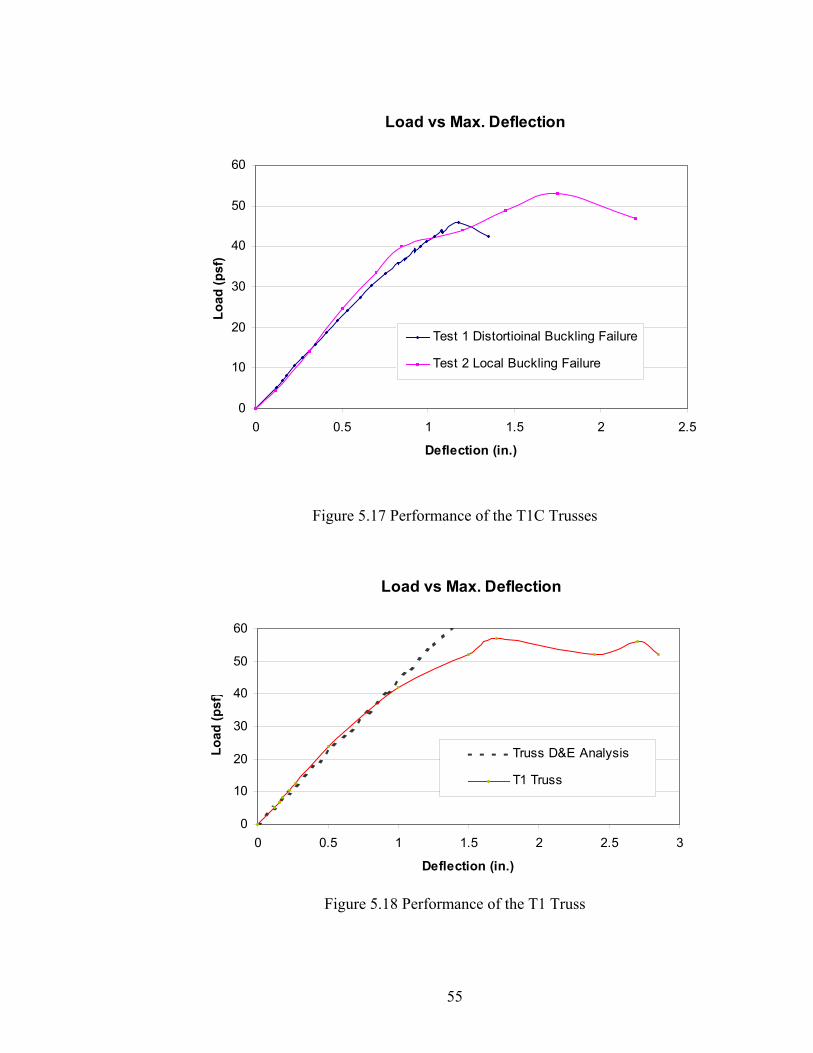
Load vs Max. Deflection
0
10
20
30
40
50
60
0 0.5 1 1.5 2 2.5
Deflection (in.)
Load
(psf
)
Test 1 Distortioinal Buckling Failure
Test 2 Local Buckling Failure
Figure 5.17 Performance of the T1C Trusses
Load vs Max. Deflection
0
10
20
30
40
50
60
0 0.5 1 1.5 2 2.5 3
Deflection (in.)
Load
(psf
)
Truss D&E Analysis
T1 Truss
Figure 5.18 Performance of the T1 Truss
55

5.5 CONCLUSION & RECOMMENDATIONS
The test results showed that the truss performances agreed well with the analyses
using Truss D&E when the premature failure of the web is prevented. The
attempt to leave out the web number 1 proved to have a significant negative effect
on the performance of the truss. The mentioned general observations from the
testing can be used to improve the performance of the truss in the future design.
The GA-22 web members have shown to be vulnerable to damage during
shipping and caused the premature failure especially to out-of-plane buckling.
Finally, the performance of 3.5-in. chord member was comparable to that of 5-in.
chord members because of the negative effect of the distortional buckling
behavior observed in the deeper members.
56

CHAPTER 6
FINITE ELEMENT STUDY OF COMPLEX HAT SHAPES USED AS
TRUSS CHORD MEMBERS
6.1 INTRODUCTION
Finite element modeling can be used to further evaluate the test results and
investigate the top chord behavior by considering additional parameters that were
not included in the test program. Finite element models of the cold-formed steel
complex hat shape members were developed and validated. The finite element
model was developed using the commercial finite element software ABAQUS
(Hibbitt et al., 1998). The cold-formed steel member was discretized using
element S4R from the ABAQUS finite element library. Element S4R is a four-
node, general-purpose shell element with finite strain capability (Hibbitt et al.,
1998).
6.2 VALIDATION OF FINITE ELEMENT MODEL
A three-dimensional finite element model of the full-scale specimen was created
to simulate the test set-up shown in Fig. 4.2. The classical eigenvalue buckling
analysis and inelastic postbuckling analysis can be performed for this type of
problem. In a classical eigenvalue buckling problem, the analysis will estimate
the critical buckling loads as well as useful estimates of collapse mode shapes.
The collapse mode shapes can be used to introduce an initial geometric
imperfection in the postbuckling analysis (Hibbitt et al., 1998).
In the postbuckling analysis, ABAQUS employs the modified Riks method to
perform a load-displacement analysis where other important nonlinear effects,
57

such as material inelasticity or degree of imperfection, can be included. The
modified Riks algorithm is the method suitable for obtaining nonlinear static
equilibrium solutions for unstable problems (Hibbitt et al., 1998). The essence of
the method is that the solution is viewed as the discovery of a single equilibrium
path. The basic algorithm assumes that there is a path-dependent response. For
these reasons, it is essential to limit the increment size. In the modified Riks
algorithm, the increment size in each iteration is limited by moving a given
distance along the tangent line to the current solution point and then searching for
equilibrium in the plane that passes through the point. The trigger loads should
perturb the structure in the expected buckling modes. Typically, these loads are
applied prior to the Riks step. The example of input command and comments on
the procedures for ABAQUS analyses is shown in Appendix B.
The end boundary conditions of the model are a pin and roller as shown in Fig
6.1. All nodes in plane A and D are restrained in the directions shown. The
lateral brace boundary conditions were applied to the model at both ends (plane A
and D) and the end of unbraced length (plane B and C). In the experiment, the
lateral braces were provided at each load point by flat plates, but lateral restraint
in the FEA applied to nodes in plane B and C, except the nodes in bottom flange.
The point loads (P) were also applied symmetrically through nodes in plane B and
C. For material nonlinearity, the stress-strain data from coupon tests of the
specimens, as shown in Fig 6.2, were converted to the true stress and logarithmic
plastic strain and used as an input (Hibbitt et al., 1998).
58

Figure 6.1 Schematic Drawing of FEA Boundary Conditions
0
10
20
30
40
50
60
70
80
0 5 10 15 20 25 30
Strain %
Stre
ss (
ksi)
ga14
ga22
Figure 6.2 Typical Stress-Strain Curve for FEA
59

The mesh density of finite element models was refined using the ABAQUS built-
in options to investigate the adequacy of the number of elements. More refined
meshing than the one used in the elastic buckling FEA model did not yield
significantly different buckling loads. The visual examination of stress and strain
contour plots also showed reasonably smooth plots, therefore, the meshing used
throughout the analyses was adequate.
6.3 FINITE ELEMENT STUDY RESULTS
The typical failure mode of the 30-in. and 60-in. unbraced length tests was the
first distortional buckling mode shape as shown in Fig. 6.3. From the FEA
analyses, the shape of the first mode failure agrees with the tests and is the same
for all the analyses. The shapes of the second mode failure are different
depending on the thickness and the unbraced length as shown in Table 6.1 and
Figure 6.3. Type I of the second mode shape, shown in Fig. 6.3, agreed with each
of the 3x5 GA-14 and GA-22 at 30 in. unbraced length tests. The failure in the
second mode occurred in some members because of the initial imperfection of the
tested specimen.
The results of the elastic FEA are summarized in Table 6.2. The results from the
analyses show good comparison with the average from the test results. The
elastic buckling loads (P), from both the first and second modes, are calculated
because there were second mode failures as mentioned earlier. The elastic FEA
results are conservative when compared to the average value of the tests.
60

1ST Mode 2ND Mode Type I 2ND Mode Type II
2ND Mode Type I Inverse
Figure 6.3 FEA and Tests Comparison
61

Table 6.1 Type of Second Mode Shape
Length Second Mode
Specimen GA (in.) Shape (Type)
3.0x5.0 14 30 I
60 II
22 30 I
60 I
2.5x5.0 14 30 I
60 II
22 30 I
60 I
3.0x3.5 14 30 I inverse
60 II
22 30 I inverse
60 II
2.5x3.5 14 30 I inverse
60 II
22 30 I inverse
60 II
Five predictions (the 2001 North American Specification, the Winter equation, the
Hancock equation, classical eigenvalue buckling FEA, and inelastic postbuckling
FEA) were compared with the experimental results as shown in Table 6.3 and 6.4.
The results in Table 6.3 and 6.4 show the ratio between the test moment and
predicted moment for 30-in. and 60-in. un-braced length, respectively.
The statistical analyses of these comparisons can be used to better analyze the test
results. The mean, standard deviation, coefficient of variation, and resistance
factor (Φ) of the comparison ratios are also tabulated in Table 6.3 and 6.4. The
resistance factors were calculated based on a reliability index (β) of 2.5 according
62

the 2001 North American Specification. The determination of Φ is prescribed in
the 2001 NAS and is given in App. A. Both elastic FEA and postbuckling FEA
analyses yield more reliable values when compared with other methods. The
mean values of postbuckling FEA comparison with the tests are 1.10 and 1.26 and
the resistance factors (Φ) are the highest at 0.84 and 0.87 for the 30-in. and 60-in.
unbraced length tests, respectively.
Table 6.2 FEA Elastic Buckling Results (P)
Thickness Length Test FEA Elastic BucklingSpecimen GA (in.) (in.) Average Mode I Mode II
(lb) (lb) (lb) 3.0x5.0 14 0.071 30 1737 1693 1923
60 1365 1286 1424 22 0.028 30 448 446 461 60 310 250 310
2.5x5.0 14 0.071 30 1900 1593 1926 60 1213 1099 1357 22 0.028 30 348 427 452 60 313 231 314
3.0x3.5 14 0.071 30 1570 1584 2038 60 1287 1234 1413 22 0.028 30 403 359 386 60 313 233 292
2.5x3.5 14 0.071 30 1598 1438 2094 60 1165 946 1240 22 0.028 30 408 337 381 60 267 204 273
63
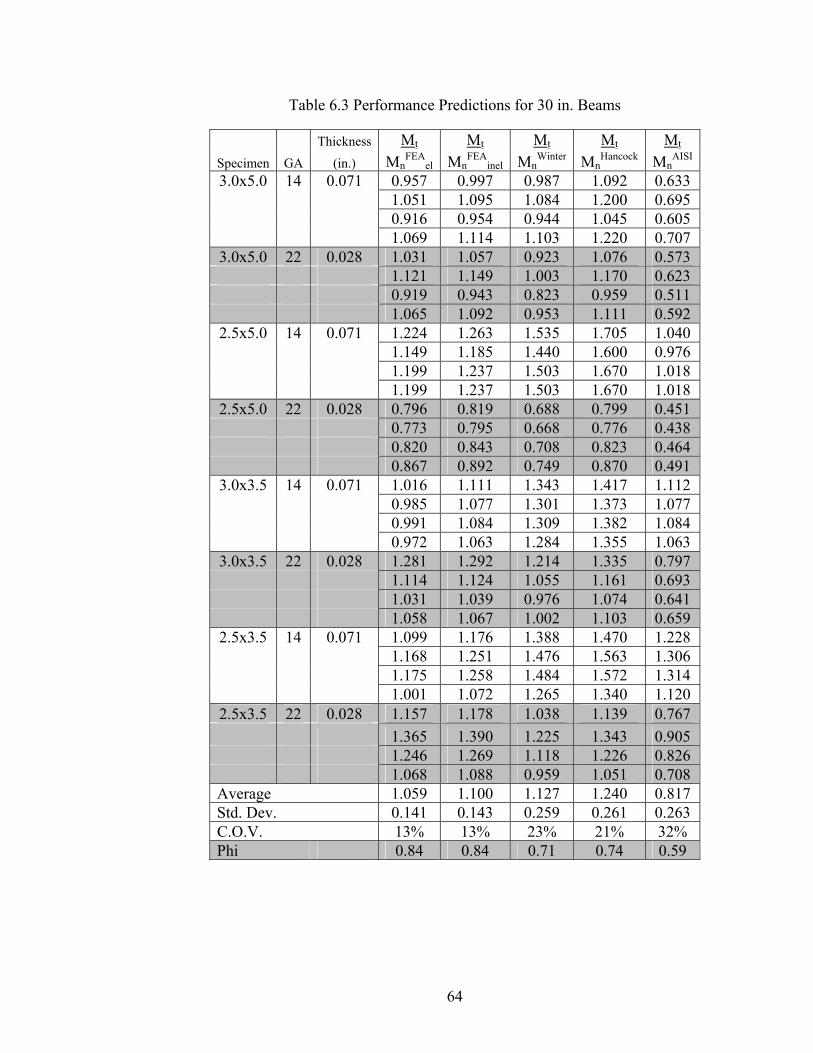
Table 6.3 Performance Predictions for 30 in. Beams
Thickness Mt Mt Mt Mt Mt Specimen GA (in.) Mn
FEAel Mn
FEAinel Mn
Winter MnHancock Mn
AISI
3.0x5.0 14 0.071 0.957 0.997 0.987 1.092 0.633 1.051 1.095 1.084 1.200 0.695 0.916 0.954 0.944 1.045 0.605 1.069 1.114 1.103 1.220 0.707
3.0x5.0 22 0.028 1.031 1.057 0.923 1.076 0.573 1.121 1.149 1.003 1.170 0.623 0.919 0.943 0.823 0.959 0.511 1.065 1.092 0.953 1.111 0.592
2.5x5.0 14 0.071 1.224 1.263 1.535 1.705 1.040 1.149 1.185 1.440 1.600 0.976 1.199 1.237 1.503 1.670 1.018 1.199 1.237 1.503 1.670 1.018
2.5x5.0 22 0.028 0.796 0.819 0.688 0.799 0.451 0.773 0.795 0.668 0.776 0.438 0.820 0.843 0.708 0.823 0.464 0.867 0.892 0.749 0.870 0.491
3.0x3.5 14 0.071 1.016 1.111 1.343 1.417 1.112 0.985 1.077 1.301 1.373 1.077 0.991 1.084 1.309 1.382 1.084 0.972 1.063 1.284 1.355 1.063
3.0x3.5 22 0.028 1.281 1.292 1.214 1.335 0.797 1.114 1.124 1.055 1.161 0.693 1.031 1.039 0.976 1.074 0.641 1.058 1.067 1.002 1.103 0.659
2.5x3.5 14 0.071 1.099 1.176 1.388 1.470 1.228 1.168 1.251 1.476 1.563 1.306 1.175 1.258 1.484 1.572 1.314 1.001 1.072 1.265 1.340 1.120
2.5x3.5 22 0.028 1.157 1.178 1.038 1.139 0.767 1.365 1.390 1.225 1.343 0.905 1.246 1.269 1.118 1.226 0.826 1.068 1.088 0.959 1.051 0.708
Average 1.059 1.100 1.127 1.240 0.817 Std. Dev. 0.141 0.143 0.259 0.261 0.263 C.O.V. 13% 13% 23% 21% 32% Phi 0.84 0.84 0.71 0.74 0.59
64

Table 6.4 Performance Predictions for 60 in. Beams
Thickness Mt Mt Mt Mt Mt Specimen GA (in.) Mn
FEAel Mn
FEAinel Mn
Winter MnHancock Mn
AISI
3.0x5.0 14 0.071 1.112 1.181 0.928 1.040 0.923 1.081 1.148 0.902 1.011 0.898 1.065 1.131 0.889 0.996 0.885 0.988 1.049 0.824 0.923 0.820
3.0x5.0 22 0.028 1.320 1.369 0.748 0.895 0.632 1.240 1.286 0.703 0.840 0.593 1.240 1.286 0.703 0.840 0.593 1.160 1.203 0.658 0.786 0.555
2.5x5.0 14 0.071 1.146 1.208 1.155 1.323 1.564 1.056 1.112 1.064 1.218 1.440 1.110 1.170 1.119 1.281 1.514
2.5x5.0 22 0.028 1.385 1.441 0.774 0.933 0.823 1.385 1.441 0.774 0.933 0.823 1.299 1.351 0.726 0.875 0.772
3.0x3.5 14 0.071 1.062 1.143 1.294 1.405 1.360 1.070 1.152 1.304 1.416 1.371 0.997 1.073 1.215 1.319 1.277
3.0x3.5 22 0.028 1.330 1.354 0.951 1.077 0.850 1.288 1.310 0.920 1.042 0.823 1.545 1.572 1.104 1.251 0.987 1.202 1.223 0.859 0.973 0.768
2.5x3.5 14 0.071 1.290 1.348 1.400 1.555 1.841 1.216 1.271 1.319 1.466 1.735 1.237 1.293 1.342 1.491 1.765 1.184 1.238 1.285 1.427 1.690
2.5x3.5 22 0.028 1.373 1.421 0.944 1.084 1.055 1.225 1.269 0.843 0.968 0.942 1.324 1.371 0.911 1.046 1.017
Average 1.212 1.265 0.988 1.122 1.083 Std. Dev. 0.134 0.125 0.227 0.23 0.394 C.O.V. 11% 10% 23% 21% 36% Phi 0.86 0.87 0.71 0.75 0.54
6.4 PARAMETRIC STUDY
The differences in geometric imperfection are used as a parameter to determine
the effect on the strength of the specimens. Schafer and Pekoz (1998)
recommended the use of a maximum deviation that is approximately equal to the
65

plate thickness as a simple rule of thumb. In this study, the maximum deviations
of the perturbed initial imperfection from the perfect geometry are at 10%, 100%
and 150% of the plate thickness. The buckling shapes of Mode I and Mode II are
used in the postbuckling analyses to determine the load-displacement curve and
the maximum loads are reported in Table 6.5 and 6.6.
Table 6.5 FEA Predictions for First Mode Imperfection
Thickness Length FEA Post Buckling Specimen GA (in.) (in.) Mode I (lb)
10%t t 150%t 3.0x5.0 14 0.071 30 1625 1393 1343
60 1211 1105 1081 22 0.028 30 435 389 377 60 241 239 238
2.5x5.0 14 0.071 30 1544 1335 1282 60 1043 973 953 22 0.028 30 415 375 363 60 222 222 221
3.0x3.5 14 0.071 30 1449 1242 1201 60 1146 1050 1017 22 0.028 30 356 327 314 60 229 229 227
2.5x3.5 14 0.071 30 1343 1152 1102 60 905 826 797 22 0.028 30 331 306 294 60 197 194 191
From the results, typical plots of the geometric imperfection study are shown in
Fig. 6.4 and 6.5. Depending on the initial geometric imperfection, mode II
failures can be approximately the same as those of mode I with larger initial
geometric imperfections. For example, specimen 3.0x5.0 GA-22, with an initial
imperfection of 0.1t in Mode I, has a predicted failure load of 435 lb compared to
405 lb of Mode II as shown in Table 6.5 and 6.6. The comparison helps explain
why there were second mode failures in the experiments of the 3x5 specimens.
66
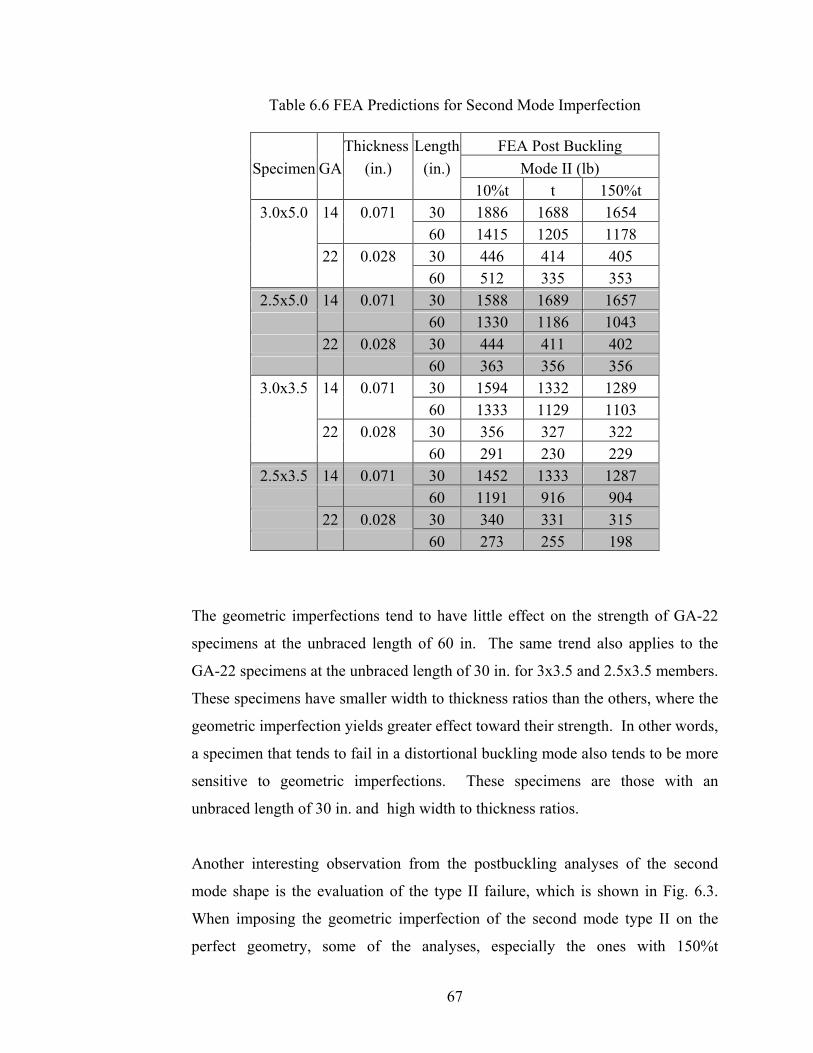
Table 6.6 FEA Predictions for Second Mode Imperfection
Thickness Length FEA Post Buckling Specimen GA (in.) (in.) Mode II (lb)
10%t t 150%t 3.0x5.0 14 0.071 30 1886 1688 1654
60 1415 1205 1178 22 0.028 30 446 414 405 60 512 335 353
2.5x5.0 14 0.071 30 1588 1689 1657 60 1330 1186 1043 22 0.028 30 444 411 402 60 363 356 356
3.0x3.5 14 0.071 30 1594 1332 1289 60 1333 1129 1103 22 0.028 30 356 327 322 60 291 230 229
2.5x3.5 14 0.071 30 1452 1333 1287 60 1191 916 904 22 0.028 30 340 331 315 60 273 255 198
The geometric imperfections tend to have little effect on the strength of GA-22
specimens at the unbraced length of 60 in. The same trend also applies to the
GA-22 specimens at the unbraced length of 30 in. for 3x3.5 and 2.5x3.5 members.
These specimens have smaller width to thickness ratios than the others, where the
geometric imperfection yields greater effect toward their strength. In other words,
a specimen that tends to fail in a distortional buckling mode also tends to be more
sensitive to geometric imperfections. These specimens are those with an
unbraced length of 30 in. and high width to thickness ratios.
Another interesting observation from the postbuckling analyses of the second
mode shape is the evaluation of the type II failure, which is shown in Fig. 6.3.
When imposing the geometric imperfection of the second mode type II on the
perfect geometry, some of the analyses, especially the ones with 150%t
67

imperfection, ultimately failed in the first mode. The final failure of the
postbuckling analyses turned out to be a first mode failure even when the initial
geometric imperfection was imposed as the second mode type II.
0.00
0.10
0.20
0.30
0.40
0.50
0.60
0.70
0.80
0.90
1.00
0.00 0.20 0.40 0.60 0.80 1.00
Displacement (in.)
Forc
e (P
/Pcr
)
imperfection = t
imperfection = 0.5t
imperfection = 0.1t
imperfection = 1.5t
Mode II imperfection = t
Mode II imperfection = 0.2t
Mode II imperfection = 1.5t
Test
Figure 6.4 Force vs Displacement Plot of Chord 3x5 GA-22 @30 inch
68

0.0
0.1
0.2
0.3
0.4
0.5
0.6
0.7
0.8
0.9
1.0
1.1
1.2
0.0 0.3 0.5 0.8 1.0 1.3 1.5 1.8 2.0
Displacement (in.)
Forc
e (P
/Pcr
)
imperfection = 1.5t
imperfection = t
imperfection = 0.1t
Mode II imperfection = 1.5t
Mode II imperfection = t
Mode II imperfection = 0.1t
Test
Figure 6.5 Force vs Displacement Plot of Chord
3x5 GA-14 @30 inch
6.5 CONCLUSIONS
The comparisons of the experimental results with the predictions from the 2001
North American Specification yield unconservative values and less reliable
compared to the predictions by Winter’s equation, Hancock’s equation, and FEA
especially with the GA-22 specimens. Both elastic FEA and postbuckling FEA
analyses yield more reliable results when compared with other methods. The
resistance factors (Φ) from the post buckling FEA are the highest at 0.84 and 0.87
69
for the 30-in. and 60-in. unbraced length tests, respectively. The parametric study
on the geometric imperfection also shows that the geometric imperfection has
significant effect on the strength and the failure mode shapes in certain
specimens.
70

CHAPTER 7
SUMMARY, CONCLUSIONS AND RECOMMENDATIONS
7.1 SUMMARY
The purpose of this research project was to experimentally and analytically
evaluate the behavior of a cold-formed steel roof truss system including the chord,
web members as well as the full scale truss. Stub column tests were performed on
the web members. The results satisfy the predicted values using the NAS (2001).
By using the nested channel sections, the inelastic local buckling failure mode
occurred. In longer columns, further experimental and analytical studies are
needed for nested C-sections. The complete truss tests were performed and the
results compared well with the predicted values calculated according the NAS
(2001). Recommendations from the testing observations are made in Chapter 5.
The majority of effort was concentrated on the bending behavior of the laterally
unbraced complex hat shaped members used as a truss chord member. The
experimental data was based on the results of 67 bending tests performed at
Virginia Tech. Additional data from bending tests at the University of Missouri at
Rolla were also included in the statistical analyses. Based on the test data in this
experimental program and those reported by Baur and LaBoube (2001), statistical
analyses were performed to find a better equation to predict the test data, while
using the same parameters. The parameters used in the equation are the yield
moment, My, and the moment ratio, λd = crdy MM . The proposed equation
used to fit the data available for the laterally un-braced flexural member is
expressed in decay-log form as shown in Eqs. 4.1-4.2. The proposed equation
yields the highest resistance factors of 0.85 and 0.80 for 22ga and 14ga
71

specimens, respectively. The Winter and Hancock equations can also be used to
predict the flexural strength more accurately than the NAS (2001).
Finite element analysis of the chord members in bending was performed. The
comparisons between the finite element and the test data showed that the finite
element method is the most reliable among the comparisons with the 2001 AISI
Specifications and Finite Strip Method. Parametric Studies including material
nonlinearity and geometric imperfections are investigated. The affect of the
geometric imperfections were reported to have significant effect toward the
flexural strength of complex hat shape in certain configurations and thicknesses
especially the members with larger width-to-thickness ratio.
7.2 CONCLUSIONS
Conclusions on this research on the cold-formed steel roof truss can be listed
as follows:
• The analyses using the elastic buckling curve revealed complications
regarding the selection of the minima for the critical elastic buckling
stress for the distortional buckling mode. The consideration of all
modes in deciding the value of the minima for the distortional
buckling is important in improving the prediction of Winter’s and
Hancock’s equations.
• Comparisons of the experimental results with the predictions from the
2001 North American Specification indicate that the AISI
Specification is unconservative and less reliable compared to the
predictions by the Winter and Hancock equations, especially for the
GA-22 specimen.
• Hancock’s equation is the most conservative and reliable of the three
predictions with the overall resistance factor of 0.73.
72
• A proposed equation can improve the overall reliability and yields the
overall resistance factor of 0.78.
• Both elastic FEA and postbuckling FEA analyses yield more reliable
values when compared with other methods. The resistance factors (Φ)
from the post buckling FEM are the highest at 0.84 and 0.87 for the
30-in. and 60-in. unbraced length tests, respectively.
• The parametric study on the geometric imperfection also shows that
the geometric imperfections have significant effect on the strength and
the failure mode shapes in certain specimens.
7.3 RECOMMENDATIONS
Based on conclusions from the research, the following recommendations are
made:
• The AISI Specifications should provide a separate check for flexural
strength against distortional buckling failure for laterally unbraced
complex hat shape members.
• The Direct Strength Method (DSM) can be used to improve the current
AISI Specifications in determining the flexural strength of laterally
unbraced complex hat shape members. Therefore, one should consider all
modes in determining the elastic buckling minima for calculating the
distortional buckling stress for use in the DSM.
• The parametric study on the geometric imperfection shows that the
geometric imperfection has significant effect toward the strength and the
failure mode shapes in some specimens. Therefore, the design procedure
should include the procedure that accounts for the effect of geometric
imperfection.
73

Suggestions for future research on the cold-formed steel roof trusses can be listed
as follows:
• Conduct long column tests of the nested C-section to determine the
required screw spacing to keep the member from separating caused by
distortion and perform as a single box member.
• Conduct finite element analyses to include the behavior of combined
compression and bending of the chord member. Different chord
configurations have been introduced to the roof truss industry. The
modeling should also include these configurations and investigate the
optimal shapes for these types of chord member for the cold-formed steel
roof trusses.
74

REFERENCES
AISI/COFS/TRUSS (2001): Standards for Cold-Formed Steel Framing- Truss Design. American Iron and Steel Institute. AS/NZS (1996). AS/NZS 4600: 1996 Cold-Formed Steel Structures. Standards Australia and the Australian Institue of Steel Construction. Baur, S.W. and LaBoube, R.A. (2001), “Behavior of Complex Hat Shape Cold-Formed Steel Members”, Proceedings of Structural Stability Research Council, 403-417. CFS Cold-formed Steel Design Software, (2003), Version 4.14, RGS Software, Inc. 2803 NW Chipman Road Lee’s Summit, MO. Cheung, Y.K. (1976). Finite Strip Method in Structural Analysis, Pergamon Press, New York. Cheung, Y.K. and Tham, L.G.(1997). Finite Strip Method, CRC Press, Florida. Galambos, T. V., (1998). Guide to Stability Design Criteria for Metal Structures. 5th Edition, Wiley Inc., New York. Hancock, G.J. (1978), “Local Distortional and Lateral Buckling of I-beams”, ASCE Journal of Structural Engineering, 104(11), 1787-1798. Hancock, G. J., Murray, T.M. and Ellifritt, D.S.(2001). Cold-Formed Steel Structures to the AISI Specification. Marcell-Dekker, New York, New York. Hancock, G. J., Kwon, Y.B. and Bernard, E.S.(1994),“Strength Design Curve for Thin-Walled Sections Undergoing Distortional Buckling” Journal of Const. Steel Res., Elsevier, 31, 169-186. Hibbitt, Karlsson and Sorensen, Inc. (1998), ABAQUS/ Standard User’s Manual, Versioin 6.3. Ibrahim M. T. (1998) “Behavior of Cold-Formed C-Section Truss Member” Ph.D. Thesis, Alexandria University, Alexandria, Egypt. Kwon, Y.B. and Hancock, G.J. (1992), “Strength Tests of Cold-Formed Channel Sections Undergoing Local and Distortional Buckling”, ASCE Journal of Structural Engineering, 118(7).
75

LaBoube, R.A. and Yu, W.W. (1998), “Recent Research and Developments in Cold-Formed Steel Framing”, Thin-Walled Structures, 32,19-39. North American Specification for the Design of Cold-Formed Steel Structural Members NAS (2001), American Iron and Steel Institute, Washington, D.C. Pekoz T. and Schafer, B.W. (1998), “Computational Modeling of Cold-Formed Steel: Characterizing Geometric Imperfections and Residual Stresses” Journal of Const. Steel Res., Elsevier, 47, 193-210. Polyzois D. and Charnvarnichborikarn P. (1993), “Web-Flange Interaction in Cold-Formed Steel Z-Section Columns” ASCE Journal of Structural Engineering, 119(9), 2607-2628. Schafer, B.W. and Pekoz T. (1999), “Laterally Braced Cold-Formed Steel Flexural Members with Edge Stiffened Flanges” ASCE Journal of Structural Engineering, 125(2), 118-127 Schafer, B.W. (2001). “Thin-Walled Column Design Considering Local, Distortional, and Eluer Buckling”, Proc. 2001 Structural Stability Research Council., Ft. Lauderdale, Florida. Schafer, B.W. (2002a), “Local, Distortional, and Euler Buckling of Thin-Walled Columns”, ASCE Journal of Structural Engineering, 128(3), 289-299. Schafer, B.W. (2002b), “Progress on the Direct Strength Method”, Proceeding 16th Int’l Spec. Conf. on Cold-Formed Steel Structures, Orlando, Florida, 647-662. Shanmugam N.E. and Dhanalakshmi M. (2000). “Stub Column Tests on Cold-Formed Steel Angle Sections” Proc. 15th Int. Specialty Conf. on Cold-Formed Steel Struct., St. Louis, Mo, USA, 239-253. Specification for the Design of Cold-Formed Steel Structural Members (1996), American Iron and Steel Institute, Washington, D.C. Truss D&E Cold-Formed Steel Truss Design Software, (2002), Version 14, John F. Butts & Associates, Inc. 2480 Vantage Drive, Colorado Springs, CO. Winter, G. (1968), “Thin-walled structures-Theoretical solutions and test results” Preliminary Publication of the 8th Congress, IABSE, Zurich, Switzerland, 101-112. Young, B. and Rasmussen, K.J.R., (1998). “Test of Cold-Formed Channel Columns”, Proc. 14th Int. Specialty Conf. on Cold-Formed Steel Struct., St. Louis, Mo, USA, 239-264.
76

Young, B. and Yan J. (2002), “Channel Columns Undergoing Local, Distortional, and Overall Buckling” ASCE Journal of Structural Engineering, 128(6), 728-736.
77
APPENDIX A : RELIABILITY ANALYSIS EXAMPLE CALCULATIONS
The procedure in determining the resistance factor was performed according to
the section F1 of the NAS 2001. The reliability calculations were performed as
follows:
φ = Resistance factor
QPPFMO VVCVVMMM ePFMC
2222**)**(* +++−= βφφ (B-1)
Where = Calibration Coefficient φC
= 1.52 for the United States φC
Mm = Mean value of material factor listed in Table F1 for type of
component involved
Mm = 1.10 for bending strength
Fm = Mean value of fabrication factor listed in Table F1 for type of
component involved
Fm = 1.00 for bending strength
Pm = Mean value of professional for tested component
Pm = 1.00
Oβ = Target reliability index
Oβ = 2.5 for structural members for United States
VM = Coefficient of variation of material factor listed in Table F1 for type
of component involved
VM = 0.10 for bending strength
VF = Coefficient of variation of fabrication factor listed in Table F1 for
type of component involved
VF = 0.05 for bending strength
VP = Coefficient of variation of test results, but not less than 6.5%
78

VQ = Coefficient of variation of load effect
VQ = 0.21
m = Degree of freedom
m = n-1
n = number of tests
CP = Correction factor
CP = 2
*)111(
−
+
m
mn for n ≥ 4, and 5.7 for n=3
For Example:
For 60 in. beam test, there are a total of 28 tests with the coefficient of variation
of the ratio between the test moment over the predicted value by NAS 2001 of
36.4%. The calculations are as follows:
CP = 1.119
VP = 0.364 > 0.065 2222 21.0364.0*119.105.01.0*5.2*)0.1*0.1*1.1(*52.1 +++−= eφ
φ = 0.54
79

APPENDIX B : ABAQUS INPUT EXAMPLE
** MATERIALS ** *Material, name=steel (Define Material Properties) *Elastic 29500., 0.3 *Plastic (Define Material Nonlinearlity) 54.447, 0. 53.701, 0.031369 65.785, 0.100346 75.051, 0.189585 80.659, 0.283746 ** ---------------------------------------------------------------- ** ** STEP: Step-1 (Start Elastic Buckling Analysis) ** *Step, name=Step-1, perturbation Buckle (Command Buckle used for Elastic Buckling) *Buckle, eigensolver=lanczos 2, , , ** ** BOUNDARY CONDITIONS (Define Boundary Conditions) ** ** Name: Load braced Type: Displacement/Rotation *Boundary, op=NEW, load case=1 _PickedSet37, 1, 1 *Boundary, op=NEW, load case=2 _PickedSet37, 1, 1 ** Name: Right roll Type: Displacement/Rotation *Boundary, op=NEW, load case=1 _PickedSet38, 1, 1 _PickedSet38, 2, 2 *Boundary, op=NEW, load case=2 _PickedSet38, 1, 1 _PickedSet38, 2, 2 ** Name: left roll Type: Displacement/Rotation *Boundary, op=NEW, load case=1 _PickedSet39, 1, 1 _PickedSet39, 2, 2 *Boundary, op=NEW, load case=2 _PickedSet39, 1, 1 _PickedSet39, 2, 2 ** Name: right fix Type: Displacement/Rotation *Boundary, op=NEW, load case=1 _PickedSet40, 3, 3
80

*Boundary, op=NEW, load case=2 _PickedSet40, 3, 3 ** ** LOADS (Define Load to Node Groups) ** ** Name: Load-L Type: Concentrated force *Cload _PickedSet35, 2, -0.083 ** Name: Load-R Type: Concentrated force *Cload _PickedSet36, 2, -0.083 ** ** OUTPUT REQUESTS ** *Restart, write, frequency=1 ** ** FIELD OUTPUT: F-Output-1 ** *Output, field *Node Output U, *Element Output (Define Output) S, TSHR, MAXSS, ALPHA, SS *El Print, freq=999999 *Node Print, freq=999999 *node file, global=yes (Needed for Postbuckling Analysis) u, *End Step ** ---------------------------------------------------------------- ** ** STEP: Step-2 (Start Postbuckling Analysis) ** *imperfection, file=job.fil (Introduce Initial Imperfection) (job.fil is the Result From Step 1) ** BOUNDARY CONDITIONS ** ** Name: Load braced Type: Displacement/Rotation *Boundary, op=NEW, load case=1 _PickedSet37, 1, 1 *Boundary, op=NEW, load case=2 _PickedSet37, 1, 1 ** Name: Right roll Type: Displacement/Rotation *Boundary, op=NEW, load case=1 _PickedSet38, 1, 1 _PickedSet38, 2, 2 *Boundary, op=NEW, load case=2
81

_PickedSet38, 1, 1 _PickedSet38, 2, 2 ** Name: left roll Type: Displacement/Rotation *Boundary, op=NEW, load case=1 _PickedSet39, 1, 1 _PickedSet39, 2, 2 *Boundary, op=NEW, load case=2 _PickedSet39, 1, 1 _PickedSet39, 2, 2 ** Name: right fix Type: Displacement/Rotation *Boundary, op=NEW, load case=1 _PickedSet40, 3, 3 *Boundary, op=NEW, load case=2 _PickedSet40, 3, 3 ** ** LOADS ** ** Name: Load-L Type: Concentrated force *Cload _PickedSet35, 2, -0.083 ** Name: Load-R Type: Concentrated force *Cload _PickedSet36, 2, -0.083 ** *Step, name=Step-2, nlgeom (Start Modified Riks Analysis) *Static, riks 1., 1., 1e-05, 1., 2., ** ** OUTPUT REQUESTS ** *Restart, write, frequency=1 ** ** FIELD OUTPUT: F-Output-2 ** *Output, field *Node Output U, RF, CF *Element Output S, ** ** HISTORY OUTPUT: H-Output-1 ** *Output, history, variable=PRESELECT *End Step
82

VITA Nuthaporn Nuttayasakul was born in Bangkok, Thailand in 1975. The son of
General Chayanth and Major General Kajornporn Nuttayasakul. He grew up in
Bangkok Thailand and joined the Royal Thai Army when he was 16 years old and
received the scholarships to study in the United States after completed the Armed
Forced Academy Preparatory School.
Nuthaporn enrolled at Virginia Military Institute in the fall 1994 and graduated
with the bachelor degree in Civil Engineering in May 1998. He then attended
Stanford University and received master degree in Civil Engineering in 2000. He
started to pursue the doctoral degree at Virginia Polytechnic Institute and State
University in the Fall of 2000. He will work in the Royal Thai army and take the
position as a faculty at the Chulachomklao Royal Military Academy in Thailand
after graduation.