EXPERIMENT - myresource.phoenix.edumyresource.phoenix.edu/secure/resource/CHM151r2/CHM151r2... ·...
14
Determinaon of K a for a Weak Acid Hands-On Labs, Inc. Version 42-0151-00-02 Review the safety materials and wear goggles when working with chemicals. Read the enre exercise before you begin. Take me to organize the materials you will need and set aside a safe work space in which to complete the exercise. Experiment Summary: You will learn about pH traon curves and the interacons that occur between a weak acid and a strong base. You will also learn the equaons that allow the K a to be determined from a traon curve and will then perform a pH traon curve to find the K a for an unknown weak acid. You will idenfy the weak acid by comparing the experimental K a to a variety of known weak acid K a values. EXPERIMENT © Hands-On Labs, Inc. www.HOLscience.com 1
Transcript of EXPERIMENT - myresource.phoenix.edumyresource.phoenix.edu/secure/resource/CHM151r2/CHM151r2... ·...

Determination of Ka for a Weak AcidHands-On Labs, Inc. Version 42-0151-00-02
Review the safety materials and wear goggles when working with chemicals. Read the entire exercise before you begin. Take time to organize the materials you will need and set aside a safe work space in which to complete the exercise.
Experiment Summary:
You will learn about pH titration curves and the interactions that occur between a weak acid and a strong base. You will also learn the equations that allow the Ka to be determined from a titration curve and will then perform a pH titration curve to find the Ka for an unknown weak acid. You will identify the weak acid by comparing the experimental Ka to a variety of known weak acid Ka values.
EXPERIMENT
© Hands-On Labs, Inc. www.HOLscience.com 1

Learning ObjectivesUpon completion of this laboratory, you will be able to:
● Identify the defining characteristics of acids and bases.
● Define acidity, and explain how the pH scale relates to the acidity of a substance.
● Distinguish between strong and weak acids in relationship to the acid ionization constant (Ka).
● Discuss the purpose of a pH titration curve, and define the half-equivalence point and equivalence point.
● Perform pH analysis utilizing pH indicator strips.
● Perform a titration of a weak acid against a strong base.
● Construct an accurate titration curve using experimental results.
● Determine Ka for an unknown weak acid utilizing the data collected during the experiment.
Time Allocation: 2.5 hours
www.HOLscience.com 2 ©Hands-On Labs, Inc.
Experiment Determination of Ka for a Weak Acid

MaterialsStudent Supplied Materials
Quantity Item Description1 Bottle of distilled water1 Dish soap1 Drinking glass or cup1 Pair of scissors1 Roll of paper towels1 Sheet of white paper1 Source of tap water
HOL Supplied Materials
Quantity Item Description1 Glass beaker, 100 mL1 Graduated cylinder, 10 mL1 Pair of gloves1 Pair of safety goggles1 pH test strips, wide range1 Experiment Bag: Determination of Ka for a Weak Acid
1 - Phenolphthalein solution, 1% - 0.5 mL in pipet 1 - Pipet, empty short stem 1 - Sodium hydroxide, 1 M - 30 mL in dropper bottle 1 - Unknown #108 - 25 mL in dropper bottle
Note: To fully and accurately complete all lab exercises, you will need access to:
1. A computer to upload digital camera images.
2. Basic photo editing software, such as Microsoft Word® or PowerPoint®, to add labels, leader lines, or text to digital photos.
3. Subject-specific textbook or appropriate reference resources from lecture content or other suggested resources.
Note: The packaging and/or materials in this LabPaq kit may differ slightly from that which is listed above. For an exact listing of materials, refer to the Contents List included in your LabPaq kit.
www.HOLscience.com 3 ©Hands-On Labs, Inc.
Experiment Determination of Ka for a Weak Acid
BackgroundAcids and Bases
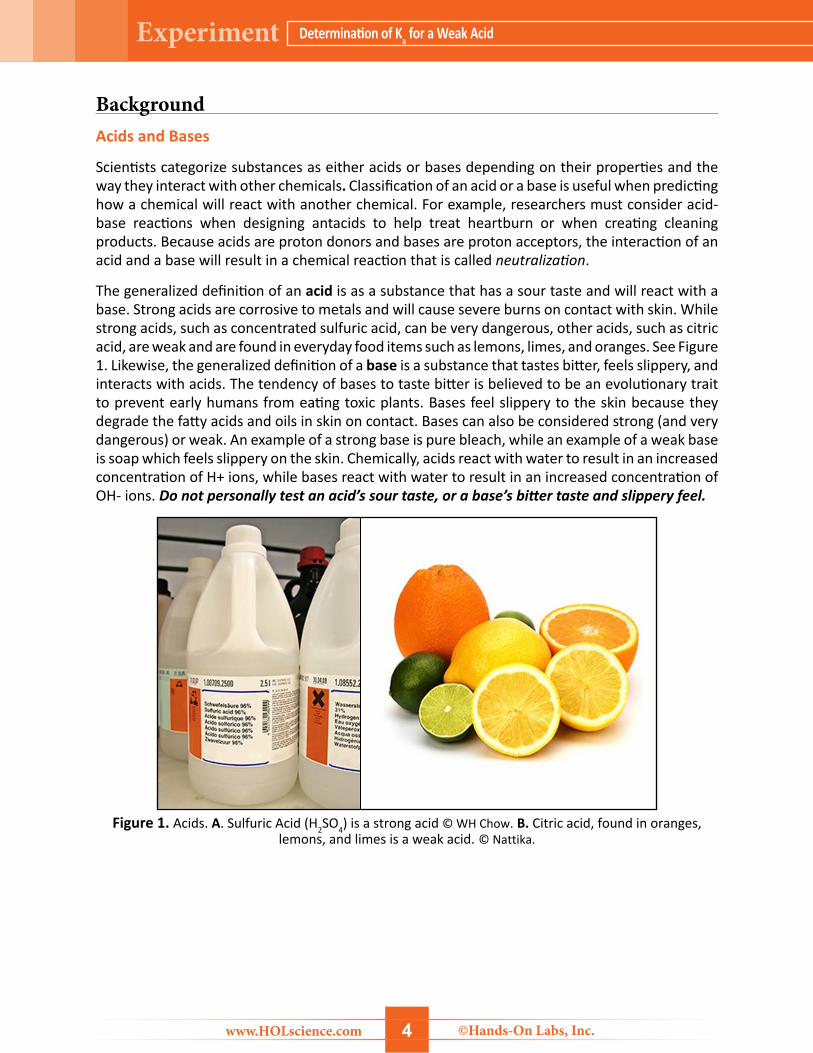
Scientists categorize substances as either acids or bases depending on their properties and the way they interact with other chemicals. Classification of an acid or a base is useful when predicting how a chemical will react with another chemical. For example, researchers must consider acid-base reactions when designing antacids to help treat heartburn or when creating cleaning products. Because acids are proton donors and bases are proton acceptors, the interaction of an acid and a base will result in a chemical reaction that is called neutralization.
The generalized definition of an acid is as a substance that has a sour taste and will react with a base. Strong acids are corrosive to metals and will cause severe burns on contact with skin. While strong acids, such as concentrated sulfuric acid, can be very dangerous, other acids, such as citric acid, are weak and are found in everyday food items such as lemons, limes, and oranges. See Figure 1. Likewise, the generalized definition of a base is a substance that tastes bitter, feels slippery, and interacts with acids. The tendency of bases to taste bitter is believed to be an evolutionary trait to prevent early humans from eating toxic plants. Bases feel slippery to the skin because they degrade the fatty acids and oils in skin on contact. Bases can also be considered strong (and very dangerous) or weak. An example of a strong base is pure bleach, while an example of a weak base is soap which feels slippery on the skin. Chemically, acids react with water to result in an increased concentration of H+ ions, while bases react with water to result in an increased concentration of OH- ions. Do not personally test an acid’s sour taste, or a base’s bitter taste and slippery feel.
Figure 1. Acids. A. Sulfuric Acid (H2SO4) is a strong acid © WH Chow. B. Citric acid, found in oranges, lemons, and limes is a weak acid. © Nattika.
www.HOLscience.com 4 ©Hands-On Labs, Inc.
Experiment Determination of Ka for a Weak Acid

The bubbling volcano that one typically sees at a student science
fair is the result of a chemical reaction between an acid and a
base. The acid in a volcano is vinegar (acetic acid) and the base in the reaction is baking soda (sodium
bicarbonate).
pH Scale
Scientists use the pH scale as a convenient way to measure the acidity of a solution. See Figure 2. Acidity is a measure of the amount of dissolved hydrogen ions, H+, in a solution. The greater the number of hydrogen ions present in a solution, the more acidic the solution. For example, a solution with a pH of 1 has more hydrogen ions and is more acidic than a solution with a pH of 6. The pH scale is a logarithmic system and is calculated using the following formula:
A reading of 0 to less than 7 is acidic, over 7 to 14 is basic, and 7 is neutral. A neutral substance is a substance that is neither an acid nor a base. Because the pH scale is logarithmic, each number on scale has a 10-fold difference in acidity compared to the next number. For instance, a pH of 6 is 10 times more acidic than a pH of 7.
Figure 2. pH scale
Bases can be measured by the presence of an ion called a hydroxide ion (abbreviated as OH–). The pH value of a base increases as the amount of hydroxide ions in the solution increases.
A pH indicator changes color at a specific pH, allowing scientists to qualitatively measure the pH of a substance. Each indicator changes color within well-defined pH ranges, allowing researchers to select a specific indicator for a specific pH range. As the pH of the solution changes within the specific range, so does the color of the indicator. For example, below a pH of 8.2, the indicator phenolphthalein is colorless. At a pH of 8.2, the phenolphthalein indicator turns pink and will darken to a dark fuchsia as the pH reaches 10.
www.HOLscience.com 5 ©Hands-On Labs, Inc.
Experiment Determination of Ka for a Weak Acid

Ionization Constants
In addition to the strength (or weakness) of an acid or base being described by pH, the strength (or weakness) of acids and bases is further quantitatively defined by their acid or base dissociation (ionization) constant. An acid ionization constant (Ka) is the equilibrium constant, describing the interaction between water and an acid to form a hydronium ion (H3O
+) and a conjugate base. A base ionization constant (Kb) is the equilibrium constant, describing the interactions between water and a base, which form a conjugate acid and a hydroxide ion (OH-). See Figure 3. The larger the value of Ka, the stronger the acid, and the smaller the value of Ka, the weaker the acid. See Table 1.
Table 1. Relationship between Ka and acid strength.
Acid Ka ValueHSO4
- 1.2 x 10⁻² Stronger AcidityHC2H2ClO2 1.35 x 10⁻³
HF 7.2 x 10⁻⁴
HC2H3O2 1.8 x 10⁻⁵
HOCl 3.5 x 10⁻⁸
NH4+ 5.6 x 10⁻¹⁰ Weaker Acidity
A strong acid completely dissociates in water, forming a conjugate base that is a weaker base than water, while a weak acid only partially dissociates in water, forming a conjugate base that is a stronger base than water. While the acid ionization constant (Ka) of an acid can be calculated using the concentrations of the acid, base, hydronium ion (conjugate acid), and conjugate base, as shown in Figure 3, the Ka can also be calculated from a pH titration curve.
Figure 3. Acid and Base Dissociation Constants. An example reaction for Ka is shown in red and an example reaction for Kb is shown in blue.
www.HOLscience.com 6 ©Hands-On Labs, Inc.
Experiment Determination of Ka for a Weak Acid
Equivalence Point
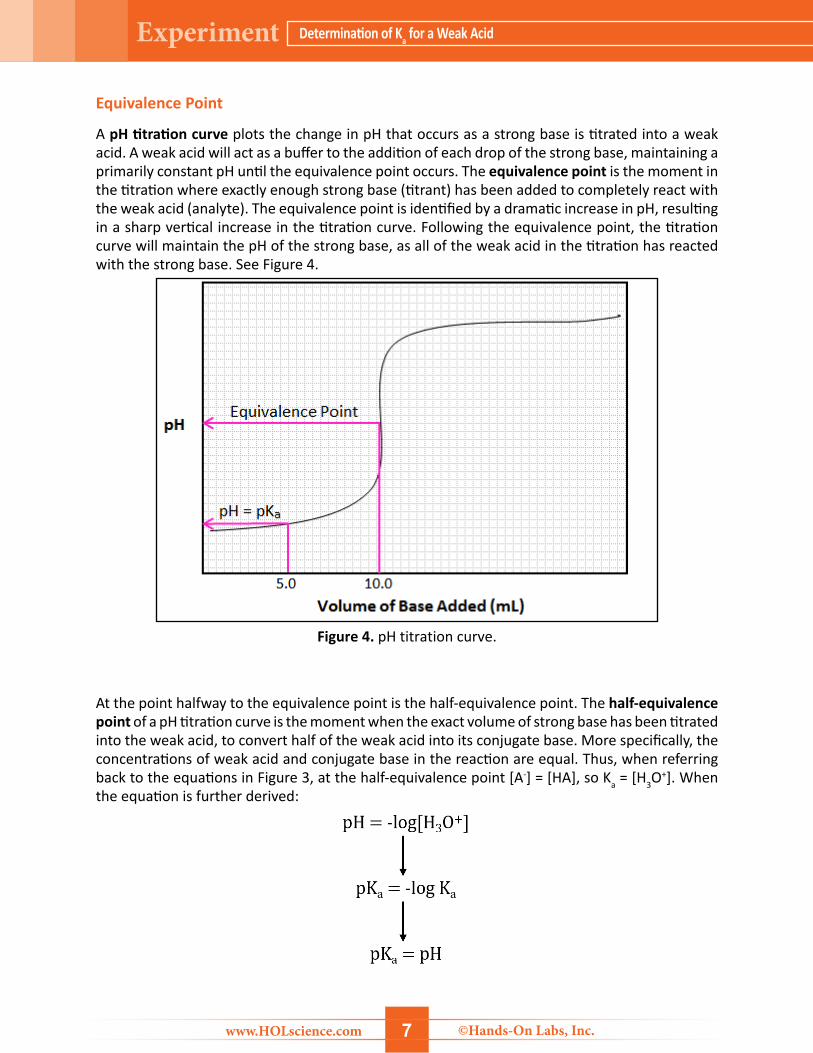
A pH titration curve plots the change in pH that occurs as a strong base is titrated into a weak acid. A weak acid will act as a buffer to the addition of each drop of the strong base, maintaining a primarily constant pH until the equivalence point occurs. The equivalence point is the moment in the titration where exactly enough strong base (titrant) has been added to completely react with the weak acid (analyte). The equivalence point is identified by a dramatic increase in pH, resulting in a sharp vertical increase in the titration curve. Following the equivalence point, the titration curve will maintain the pH of the strong base, as all of the weak acid in the titration has reacted with the strong base. See Figure 4.
Figure 4. pH titration curve.
At the point halfway to the equivalence point is the half-equivalence point. The half-equivalence point of a pH titration curve is the moment when the exact volume of strong base has been titrated into the weak acid, to convert half of the weak acid into its conjugate base. More specifically, the concentrations of weak acid and conjugate base in the reaction are equal. Thus, when referring back to the equations in Figure 3, at the half-equivalence point [A-] = [HA], so Ka = [H3O
+]. When the equation is further derived:
www.HOLscience.com 7 ©Hands-On Labs, Inc.
Experiment Determination of Ka for a Weak Acid

To determine the half-equivalence point of a pH titration curve, one would use a pH meter to measure and record the change in pH that occurs as each drop of strong base is titrated into the weak acid. A typical pH meter is able to monitor the precise pH of a solution to the nearest tenth, hundredth, or thousandth value. See Figure 5.
Figure 5. pH Meter. A typical laboratory pH meter is shown. © Yenyu Shih
As a pH meter is priced above a reasonable cost for one-time student use, it is not feasible to use for this experiment. In the first portion of this exercise, the Ka of an unknown weak acid will be determined through the use of a pH indicator. You will identify the equivalence point of a titration between the weak acid and the strong base NaOH. Then you will use the pH indicator strips to determine the pH at intervals throughout the titration, including the equivalence point and the half-equivalence point. You will use this data to create a pH titration curve and to determine the Ka of the unknown weak acid. Finally, you will use the Ka value to identify the weak acid from a list of known Ka values.
www.HOLscience.com 8 ©Hands-On Labs, Inc.
Experiment Determination of Ka for a Weak Acid

Exercise 1: Determination of KaIn this experiment you will determine the volume of strong base (NaOH) required to reach the equivalent point in a titration with an unknown weak acid.
Procedure
Completely read all instructions and assemble all equipment and supplies before beginning work on this experiment.
Note: It is extremely important to deliver drops from your pipet accurately. Thus, you MUST hold the pipet vertically and squeeze the pipet bulb consistently to make sure you deliver the same size drop each time.
Part 1: Determination of Equivalence Point
1. Gather the empty short-stem pipet, glass or cup, and distilled water.
2. Pour some distilled water into the glass or cup.
3. Fill the short-stem pipet with water by placing the tip of the pipet in the water, pressing down on the bulb, and then releasing.
4. Practice releasing single drops of water from the pipet until you are able to consistently release evenly-sized drops of water.
5. When you are able to fill the pipet and also release even-sized drops of water, empty the pipet of all water, filling and releasing air from the pipet to ensure all water is released.
6. Put on the safety glasses and a pair of safety gloves.
7. Measure 4 mL of the unknown weak acid from the dropper bottle into the graduated cylinder. It is important to measure exactly 4 mL of the acid.
8. Carefully pour the 4 mL of unknown weak acid from the graduated cylinder into a clean, dry, 100-mL glass beaker.
9. Place the beaker onto a clean sheet of white paper.
10. Use scissors to carefully cut the tip of the phenolphthalein pipet and add exactly 2 drops of phenolphthalein solution to the unknown weak acid in the beaker.
11. Carefully swirl the beaker to completely mix the unknown weak acid and phenolphthalein solution. The solution will be colorless and clear.
12. Gather the bottle of Sodium Hydroxide (NaOH) from the kit.
a. Carefully remove the cap from the bottle and remove the dropper insert from the top of the bottle.
b. Gently bend the dropper tip to the side and move back and forth to separate the tip from the bottle.
www.HOLscience.com 9 ©Hands-On Labs, Inc.
Experiment Determination of Ka for a Weak Acid

c. Place the tip to side of the bottle, leaving the bottle of NaOH open at the top. See Figure 6.
Figure 6. Sodium hydroxide with dropper tip removed from bottle.
13. Place the tip of the empty short stem pipet into the Sodium Hydroxide bottle and fill the pipet with the NaOH.
Note: You will need to count the total number of drops of NaOH added to the beaker. Read all steps before moving on.
14. Add NaOH from the pipet into the beaker containing the 4 mL of unknown weak acid 1 drop at a time, swirling and observing the solution in the beaker after each drop until the color changes to a pale-pink color for at least 5 seconds. Count each drop of NaOH added to the beaker, so that you will know exactly how many drops of NaOH were required to cause the solution to change from clear and colorless to pale-pink in color.
Note: It is important to stop adding NaOH at a pale-pink color and before a dark-pink color forms.
15. Record the number of NaOH drops added to the beaker in Data Table 1 of your Lab Report Assistant.
Note: The data in Data Table 1 will be used to help you set up the titration in Part 2.
16. Carefully pour the solution down the sink drain and use the dish soap, tap water, and paper towels to wash and dry the beaker.
17. Repeat steps 7 through 16 an additional time to collect data for Trial 2.
18. Average the total number of drops required to reach the equivalence point from Trial 1 and Trial 2 and record it in Data Table 1.
www.HOLscience.com 10 ©Hands-On Labs, Inc.
Experiment Determination of Ka for a Weak Acid

Part 2: Construction of pH Titration Curve
19. Measure 4 mL of the unknown weak acid from the dropper bottle into the graduated cylinder. It is important to measure exactly 4 mL of the acid.
20. Carefully pour the 4 mL of unknown weak acid from the graduated cylinder into a clean, dry, 100-mL glass beaker.
21. Gather a pH indicator strip from the kit and place it into the unknown weak acid in the beaker so that all 4 indicator squares come into contact with the weak acid. See Figure 7.
Figure 7. pH indicator strip in beaker. Notice that in either direction, all 4 indicator squares are immersed in the solution. A. Strip facing down. B. Strip facing up.
22. As soon as all 4 squares are in contact with the solution, remove the strip from the beaker. Place the strip next to the provided pH scale. Determine the pH of the solution, to the closest 0.5 pH, and record it in Data Table 2 in your Lab Report Assistant next to “NaOH Drops Added – 0” in the “Trial 1” column. See Figure 8.
23. To accurately read the pH indicator strip, place the strip between the two closest pH indicator color matches and determine if the strip is closest in color to a whole number value or in between two color matches, providing a 0.5 value. See Figure 8.
Figure 8. pH scale reading. A. pH value for this indicator strip would be 4.5. Note that the bottom indicator square is closer in color to a pH of 5.0, while the indicator square 2nd from the bottom is closer in color to a pH of 4.0. B. pH value for this indicator strip would be 4.0.
When the strip is between the pH 3.0 and pH 4.0, the colors of the indicator strip align almost perfectly with the indicator colors of pH 4.0.
www.HOLscience.com 11 ©Hands-On Labs, Inc.
Experiment Determination of Ka for a Weak Acid

24. From Data Table 1, copy the average number of drops required to reach the equivalent point and record it in Data Table 2 in the space provided next to “Equivalent Point = ( Drops).”
25. Divide the number of drops required to reach the equivalent point by 2 and record the value in Data Table 2 in the space provided next to “Half-Equivalent Point = ( Drops).” If this value ends in 0.5, record down to the closest value. (Example: 41.5 drops would round to 41.0 drops.)
26. As done in Part 1, place the tip of the empty short-stem pipet into the sodium hydroxide bottle and fill the pipet with the NaOH.
Note: You will need to count the total number of drops of NaOH added to the beaker. Read all steps before moving on.
27. Add exactly 10 drops of NaOH from the pipet into the beaker containing the 4 mL of unknown.
28. Swirl the beaker to fully mix the NaOH with the unknown weak acid. After swirling, wait 10 seconds before moving on to the next step.
29. Gather a pH indicator strip from the kit and place it into the solution in the beaker so that all 4 indicator squares come into contact with the weak acid. See Figure 7.
30. As soon as all 4 squares are in contact with the solution, remove the strip from the beaker. Place the strip next to the provided pH scale. Determine the pH of the solution, to the closest 0.5 pH, and record it in Data Table 2 next to “NaOH Drops Added – 10.” See Figure 8.
31. To accurately read the pH indicator strip, place the strip between the 2 closest pH indicator color matches and determine if the strip is closest in color to a whole number value, or in between 2 color matches, providing a 0.5 value. See Figure 8.
32. Repeat steps 26 through 31 for the remaining 13 titration steps in Data Table 2. It is important to collect the pH at exactly the number of drops required to reach the half-equivalence point and the equivalence point.
Note: To gather and record the values for Data Table 2, while not missing a collection point, consider the following example: If the half-equivalence point was 43.0 drops, you would collect the pH value at 40 drops. Add 3 additional drops of NaOH, swirl the beaker, wait 10 seconds, and collect the pH value at 43 drops. Add 7 additional drops of NaOH, swirl the beaker, wait 10 seconds, and collect the pH value at 50 drops.
33. When all pH values (up to 120 drops of NaOH) have been determined and recorded in Data Table 2, carefully pour the solution down the sink drain and use the dish soap, tap water, and paper towels to wash and dry the beaker.
34. Repeat steps 19 through 33 for Trial 2. Record all values in Data Table 2 in the “Trial 2” column.
35. Average the pH values in Data Table 2 for Trials 1 and 2 and record in pH value (Average) in Data Table 2.
www.HOLscience.com 12 ©Hands-On Labs, Inc.
Experiment Determination of Ka for a Weak Acid

36. The average pH at half-equivalence point is equal to the pKa of the unknown weak acid. Record this value in Data Table 3 in your Lab Report Assistant next to pKa.
37. Determine the Ka of the unknown weak acid using the following series of equations:
38. Record the Ka of the unknown weak acid in Data Table 3.
39. Use the values for Ka and pKa for a variety of acid in Table 2 to determine the identity of the unknown weak acid. Record the identity of the unknown weak acid in Data Table 3.
Table 2. Ka and pKa Values of Acids
Acid Name Acid Formula Ka Value pKa ValueChlorous acid HClO2 1.2 x 10⁻² 2.92
Monochloroacetic acid HC2H2ClO2 1.35 x 10⁻³ 3.87Hydrofluoric acid HF 7.2 x10⁻⁴ 4.14
Acetic acid HC2H3O2 1.8 x 10⁻⁵ 4.75Carbonic acid H2CO3 4.3 x 10⁻⁷ 6.37
Hypochlorous acid HOCl 3.5 x 10⁻⁸ 7.46Hydrocyanic acid HCN 6.2 x 10⁻¹⁰ 9.21
40. Calculate the percent error of the Ka between the experiment value of Ka (determined in the experiment) and the known value of Ka (provided in Table 2) and record in Data Table 3. Use the equation below to calculate percent error:
41. Calculate the percent error of the pKa between the experiment value of pKa (determined in the experiment) and the known value of pKa (provided in Table 2) and record it in Data Table 3.
42. When you are finished uploading photos and data into your Lab Report Assistant, save and zip your file to send to your instructor. Refer to the appendix entitled “Saving Correctly,” and the appendix entitled “Zipping Files,” for guidance with saving the Lab Report Assistant in the correct format.
www.HOLscience.com 13 ©Hands-On Labs, Inc.
Experiment Determination of Ka for a Weak Acid

Cleanup:
43. Properly dispose of used chemical and pipets.
44. Clean all items with soap and water, and return to the lab kit for future use.
QuestionsA. Using the data collected in Data Table 2, create a graph of “Drops of NaOH added” vs “pH”
where “drops of NaOH added” is on the x-axis and “pH” is on the y-axis.
B. pH indicator strips work by changing color in the presence of solutions with varied pH values. Thinking about your procedure steps and results in Part 1, why do you think the pH of the unknown weak acid was not determined with pH indicator strips until Part 2?
C. Discuss possible causes of error in the experimental procedure. Why do you think there was a percent of error in the pKa and Ka values of the unknown weak acid, in comparison to the values presented in Table 2?
D. Do you think using a pH meter instead of pH indicator strips would have created a larger or smaller percent error? Explain your answer.
E. Why was phenolphthalein a good indicator to use for determining the equivalence point between the unknown weak acid and strong base?
www.HOLscience.com 14 ©Hands-On Labs, Inc.
Experiment Determination of Ka for a Weak Acid