
Experiment 1 Check-in, Safety, Identification of Lab Equipment, and ...
141
Experiment 1 Check-in, Safety, Identification of Lab Equipment, and an Introduction to Graphing Name_________________________ Date____________________ LEARNING OBJECTIVES To understand lab safety rules and learn how to work safely in the lab To be able to identify common laboratory equipment and understand their uses To be able to light a Bunsen burner and adjust the flame appropriately To understand how to graph experimental data APPARATUS 250 mL Beaker (1 for demonstration) 250 mL Erlenmeyer Flask (1 for demonstration) Crucible and Lid (1 for demonstration) Evaporating Dish (1 for demonstration) Stirring Rod (1 for demonstration) Crucible Tongs (1 for demonstration) 10 mL Graduated cylinder (1 for demonstration) 100 mL Graduated cylinder (1 for demonstration) Ring Stand fitted with Iron Ring (1 for demonstration) Clay Triangle (placed near ring stand fitted with iron ring) (1 for demonstration) Wire Gauze (placed near ring stand fitted with iron ring) (1 for demonstration) 5 mL Pipet, 10 mL Pipet, and Pipet bulb (1 for demonstration) Ring Stand fitted eth Buret Clamp and 50 mL buret (1 for demonstration) Funnel (placed near ring stand and buret) (1 for demonstration) 50 mL or 100 mL Volumetric Flask with Cap (1 for demonstration) Funnel (placed near buret) (1 for demonstration) Test Tube and Test Tube Holder (1 for demonstration) Thermometer (1 for demonstration) Split rubber stopper (placed near thermometer) (1 for demonstration) MATERIALS None Page 1
Transcript of Experiment 1 Check-in, Safety, Identification of Lab Equipment, and ...
Experiment 1Check-in, Safety, Identification of Lab
Equipment, and an Introduction to Graphing
Name_________________________ Date____________________
LEARNING OBJECTIVES
To understand lab safety rules and learn how to work safely in the lab To be able to identify common laboratory equipment and understand their uses To be able to light a Bunsen burner and adjust the flame appropriately To understand how to graph experimental data
APPARATUS
250 mL Beaker (1 for demonstration)250 mL Erlenmeyer Flask (1 for demonstration)Crucible and Lid (1 for demonstration)Evaporating Dish (1 for demonstration)Stirring Rod (1 for demonstration)Crucible Tongs (1 for demonstration)10 mL Graduated cylinder (1 for demonstration)100 mL Graduated cylinder (1 for demonstration)Ring Stand fitted with Iron Ring (1 for demonstration)Clay Triangle (placed near ring stand fitted with iron ring) (1 for demonstration)Wire Gauze (placed near ring stand fitted with iron ring) (1 for demonstration)5 mL Pipet, 10 mL Pipet, and Pipet bulb (1 for demonstration)Ring Stand fitted eth Buret Clamp and 50 mL buret (1 for demonstration)Funnel (placed near ring stand and buret) (1 for demonstration)50 mL or 100 mL Volumetric Flask with Cap (1 for demonstration)Funnel (placed near buret) (1 for demonstration)Test Tube and Test Tube Holder (1 for demonstration)Thermometer (1 for demonstration)Split rubber stopper (placed near thermometer) (1 for demonstration)
MATERIALS
None
Page 1
INTRODUCTION
There are two major purposes for the chemistry laboratory experience. One of these is to reinforce those concepts being taught in the classroom. The other is to obtain practical experience in the utilization of chemical laboratory equipment. The laboratory component of this course is vital to fully mastering the competencies for this course. As we proceed through the semester, hopefully the labs will fulfill these purposes.
Although each lab is designed with the above criteria in mind, the first goal is SAFETY. Lab safety is always a primary concern in designing any experiment. Careful thought has been given in the design of each of the labs that you will perform. But chemistry labs involve using glassware, heating compounds, reacting dangerous chemicals, and other hazards. Therefore, during this lab, we will spend a significant amount of time discussing safety.
Once we have discussed lab safety, you will be introduced to some considerations when dealing with chemicals and some of the equipment that you will be using this semester. Being able to properly work with chemicals and identify glassware and other equipment is essential for conducting labs.
Another skill that will be needed throughout the semester is the ability to graph data We will discuss proper graphing techniques during this lab. I have included an exercise sheet entitled “Graphing Exercises” in this lab.
Page 2

LAB SAFETY
There is NO substitute for being safe in the laboratory. Therefore, each of us must follow the safety rules listed below.
1 If you are nursing, pregnant or become pregnant during the semester, inform your instructor.
2 Goggles (or other approved eye protection) must be worn at all times when chemicals are being used in the lab. Your lab instructor will determine if eye protection is needed in the lab. If you wear glasses, you must wear goggles over them unless they are safety approved for use in the lab. Contact lenses are allowed in the lab.
3 Close-toed shoes must be worn in the lab. Flip flops or open-toed shoes are not allowed. The reason for this is that containers of chemicals may be dropped to the floor or if glassware is broken, cuts can easily occur if the feet are not properly covered.
4 Food or drinks are not allowed in the lab. Also, you should not place candy, gum, etc. in your mouth while in the lab.
5 Many of the chemicals used in the labs are poisonous. Poisons can easily enter the body via three routes: inhalation, ingestion, or absorption.
Inhalation - breathing in vapors. When it is necessary to smell a chemical or the gas produced in a reaction, use your can to gently waft the chemical to your nose
and breathe in slightly. DO NOT inhale deeply as the odor may be very intense.
Ingestion - taking in by the mouth. This is the major reason why food and drinks are not allowed in the lab. After working in the lab, it is mandatory that you wash your
hands thoroughly. Also, many students find that they need to wash their forearms since chemicals may have splashed onto them.
Absorption - passing through the skin. If you spill chemicals on your skin, wash immediately with soap and water. Also, if you are wearing rings or a watch, be certain to wash underneath them. As an added note, your hands are rough and callused and you may not notice if they have chemicals on them. Therefore, you need to wash your hands prior to using the restroom and ALWAYS wash your hands prior to placing them near your eyes or mouth.
Page 3
LAB SAFETY (CONTINUED)
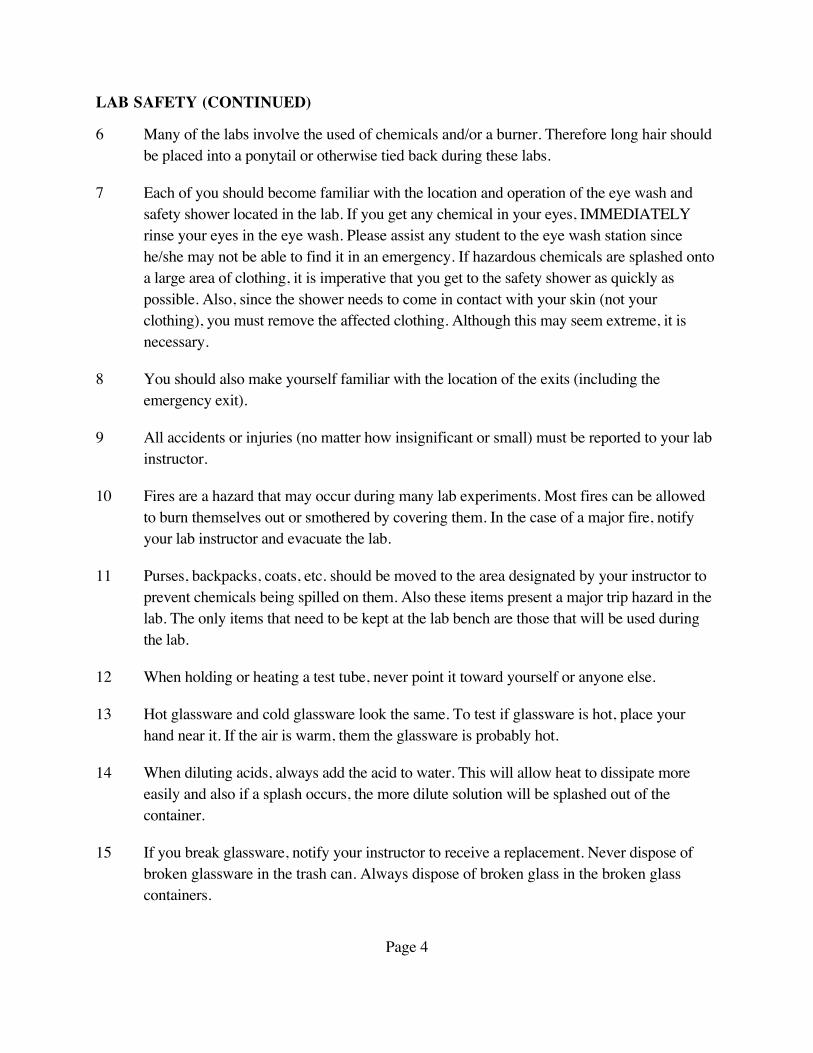
6 Many of the labs involve the used of chemicals and/or a burner. Therefore long hair should be placed into a ponytail or otherwise tied back during these labs.
7 Each of you should become familiar with the location and operation of the eye wash and safety shower located in the lab. If you get any chemical in your eyes, IMMEDIATELY rinse your eyes in the eye wash. Please assist any student to the eye wash station since he/she may not be able to find it in an emergency. If hazardous chemicals are splashed onto a large area of clothing, it is imperative that you get to the safety shower as quickly as possible. Also, since the shower needs to come in contact with your skin (not your clothing), you must remove the affected clothing. Although this may seem extreme, it is necessary.
8 You should also make yourself familiar with the location of the exits (including the emergency exit).
9 All accidents or injuries (no matter how insignificant or small) must be reported to your lab instructor.
10 Fires are a hazard that may occur during many lab experiments. Most fires can be allowed to burn themselves out or smothered by covering them. In the case of a major fire, notify your lab instructor and evacuate the lab.
11 Purses, backpacks, coats, etc. should be moved to the area designated by your instructor to prevent chemicals being spilled on them. Also these items present a major trip hazard in the lab. The only items that need to be kept at the lab bench are those that will be used during the lab.
12 When holding or heating a test tube, never point it toward yourself or anyone else.
13 Hot glassware and cold glassware look the same. To test if glassware is hot, place your hand near it. If the air is warm, them the glassware is probably hot.
14 When diluting acids, always add the acid to water. This will allow heat to dissipate more easily and also if a splash occurs, the more dilute solution will be splashed out of the container.
15 If you break glassware, notify your instructor to receive a replacement. Never dispose of broken glassware in the trash can. Always dispose of broken glass in the broken glass containers.
Page 4
LAB SAFETY (CONTINUED)
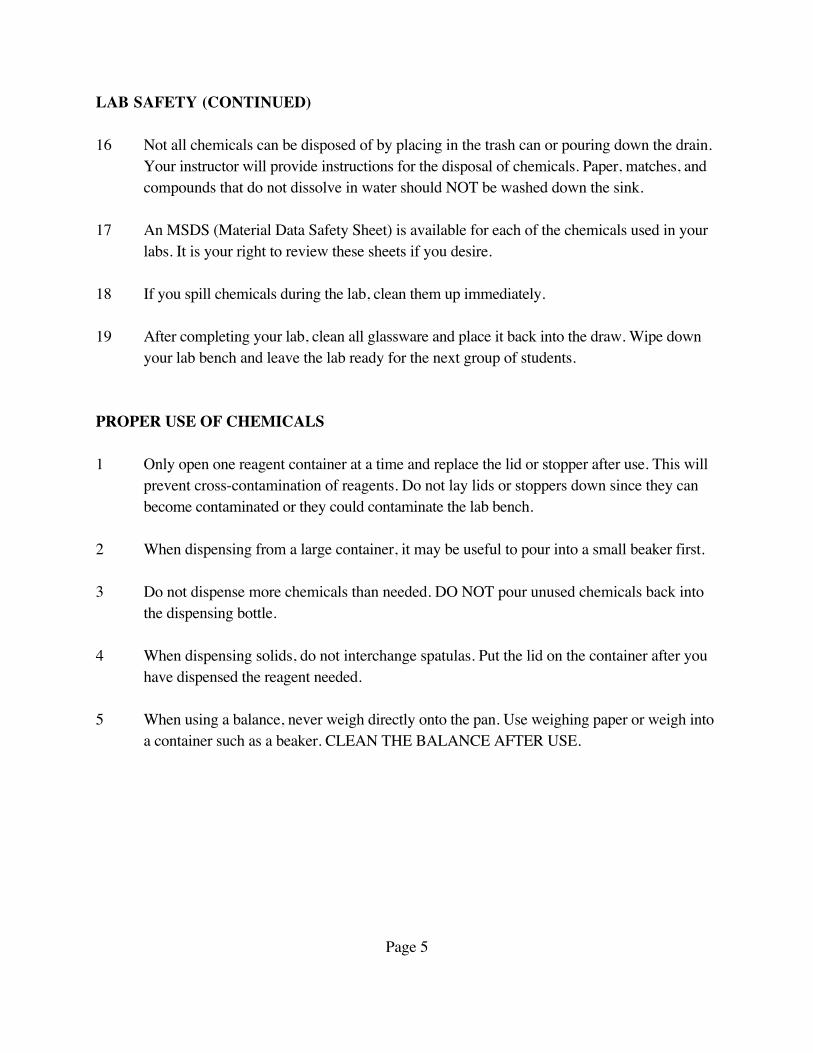
16 Not all chemicals can be disposed of by placing in the trash can or pouring down the drain. Your instructor will provide instructions for the disposal of chemicals. Paper, matches, and compounds that do not dissolve in water should NOT be washed down the sink.
17 An MSDS (Material Data Safety Sheet) is available for each of the chemicals used in your labs. It is your right to review these sheets if you desire.
18 If you spill chemicals during the lab, clean them up immediately.
19 After completing your lab, clean all glassware and place it back into the draw. Wipe down your lab bench and leave the lab ready for the next group of students.
PROPER USE OF CHEMICALS
1 Only open one reagent container at a time and replace the lid or stopper after use. This will prevent cross-contamination of reagents. Do not lay lids or stoppers down since they can become contaminated or they could contaminate the lab bench.
2 When dispensing from a large container, it may be useful to pour into a small beaker first.
3 Do not dispense more chemicals than needed. DO NOT pour unused chemicals back into the dispensing bottle.
4 When dispensing solids, do not interchange spatulas. Put the lid on the container after you have dispensed the reagent needed.
5 When using a balance, never weigh directly onto the pan. Use weighing paper or weigh into a container such as a beaker. CLEAN THE BALANCE AFTER USE.
Page 5

DISCUSSION QUESTIONS FOR LAB SAFETY AND PROPER USE OF CHEMICALS
1. What equipment is needed for eye protection?
2. Where is the location of the eye wash stations? Explain how to use the eye wash.
3. What are the three methods that poison easily enters the body?
4. When is it necessary to report an accident or injury in the lab?
5. Where should all unnecessary clothing, backpacks, purses, etc. be placed while conducting labs?
6. How should broken glass be disposed?
7. Where should trash, paper, and other non-hazardous solids be disposed?
8. What is an MSDS and do you have access to it?
9. Whose responsibility is it to maintain a clean lab and clean the glassware in the lab drawers?
10. Have the safety rules for the chemistry labs at Roane State Community been thoroughly explained to you?
Page 6
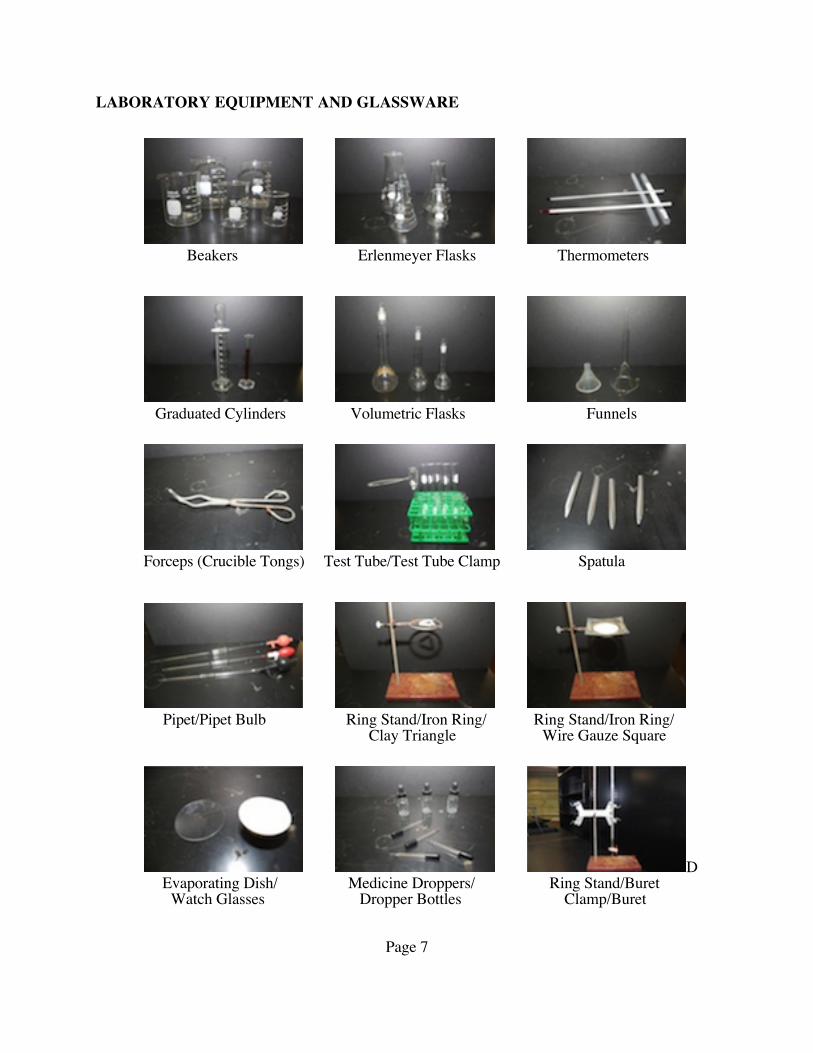
LABORATORY EQUIPMENT AND GLASSWARE
Beakers Erlenmeyer Flasks Thermometers
Graduated Cylinders Volumetric Flasks Funnels
Forceps (Crucible Tongs) Test Tube/Test Tube Clamp Spatula
Pipet/Pipet Bulb Ring Stand/Iron Ring/ Ring Stand/Iron Ring/ Clay Triangle Wire Gauze Square
D Evaporating Dish/ Medicine Droppers/ Ring Stand/Buret Watch Glasses Dropper Bottles Clamp/Buret
Page 7
DISCUSSION QUESTIONS FOR LABORATORY EQUIPMENT AND GLASSWARE
1. Compare and contrast beakers and Erlenmeyer flasks discussing transfer of liquids, boiling, mixing, and storage.
2. Compare and contrast beakers, graduated cylinders, volumetric flasks, pipets discussing precision and limitations.
3. Compare and contrast graduated cylinders and burets discussing how they are used and how they are read.
Page 8
GRAPHING PRINCIPLES
In many experiments, collected data must be graphed in order to determine information or to show relationships. Therefore, we will learn how to construct and interpret graphs. Here are some guidelines used when constructing a graph.
Creating the Graph1 A graph must be neatly drawn. It must contain a descriptive title. The axes must be labeled
and a legend must be included (if necessary). Graphs can be prepared in the portrait mode (long side along the y-axis) or in the landscape mode (long side along the x-axis).
2 All data must be recorded and all data manipulations must be performed prior to creating the graph.
3 Decide on the maximum and minimum values for the graph. This is also called the limits of the graphs. The lower left corner of the graph does not have to be set to zero on either axis.
4 The divisions on the axes should be easy to read. Most graph paper is divided into blocks of five or ten lines per block. Therefore one square could be set to equal 1, 2, 5, 10, 20, 50, or 100 but try to avoid hard to interpret numbers such as 5.7.
5 For greatest accuracy, select a scale that utilizes the majority of the page. The x-axis scale and the y-axis scale do not have to be the same.
Many students have difficulty determining the scale to use. This is easily done by determining the difference between the largest and smallest points on the graph. Divide that number by the number of lines on the axis. Then round up to the number that will be an easy multiple as discussed in step 4.
For example, if your lowest data point is 2.2 and your highest data point is 15.6 and you have 60 lines.
15.6 - 2.2 = 13.4 13.4/60 = 0.223 Round up to 0.25
Therefore you would start your data at 2.2 and let each line increase in increments of 0.25.
Page 9
Creating the Graph (continued)
6 Grid lines should be shown on the graph. All graphs are to be drawn on graph paper with at least 10 squares per inch (this will be included in this lab or will be emailed to you by your instructor.
7 Mark the data points with a small dot initially using a pencil. Once you are confident that your data is accurate, you can use a pen to darken the points. A smooth curve should be drawn through the points. The curve should pass as close as possible to each of the points but should not be connected point-to-point. For those graphs which are linear (a straight line), try to draw a best fit line where the line equally splits the data points with an equal number above and below the line. Use a straight edge (a clear ruler works well for this or you can use the edge of your folder or binder) to draw the line.
8 If the graph is a straight line, the slope can be determined. This is often valuable information that is useful in the analysis. The slope is determined by finding two points that fall on the
line and using the following formula:
y2 - y1 m = ----------
x2 - x1
You can use any two points on the line to determine the slope. I normally try to pick a point from either end of the data and I try to pick to points that fall at intersections on the graph paper.
Page 10
GRAPHING EXERCISES
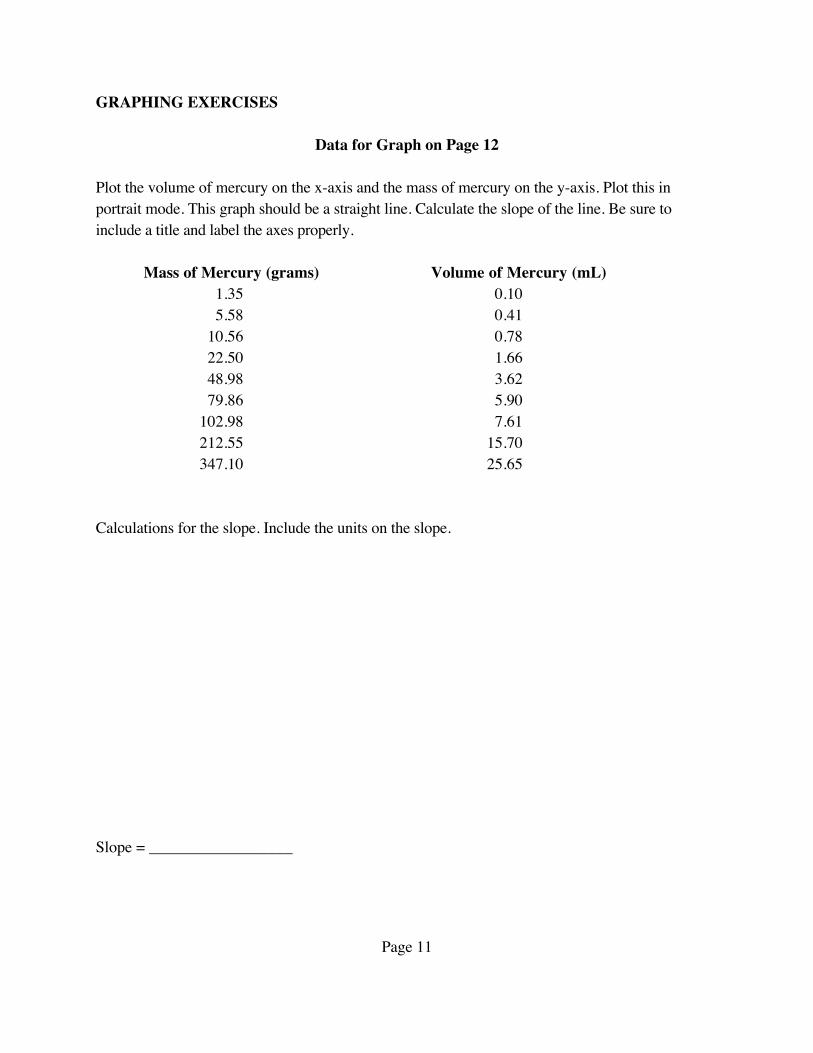
Data for Graph on Page 12
Plot the volume of mercury on the x-axis and the mass of mercury on the y-axis. Plot this in portrait mode. This graph should be a straight line. Calculate the slope of the line. Be sure to include a title and label the axes properly.
Mass of Mercury (grams) Volume of Mercury (mL) 1.35 0.10 5.58 0.41 10.56 0.78 22.50 1.66 48.98 3.62 79.86 5.90 102.98 7.61 212.55 15.70 347.10 25.65
Calculations for the slope. Include the units on the slope.
Slope = __________________
Page 11

Page 12

Data for Graph on Page 14
Plot the volume on the x-axis and the pressure on the y-axis. Plot this in landscape mode. This graph should NOT be a straight line. Draw a smooth curve connecting the data points. Be sure to include a title and label the axes properly.
Volume (Liters) Pressure (Atmospheres) 1.56 4.49 4.56 1.54 8.34 0.84 13.45 0.52 19.50 0.36 26.78 0.26 45.89 0.15 85.89 0.08111.11 0.06
Page 13

Page 14
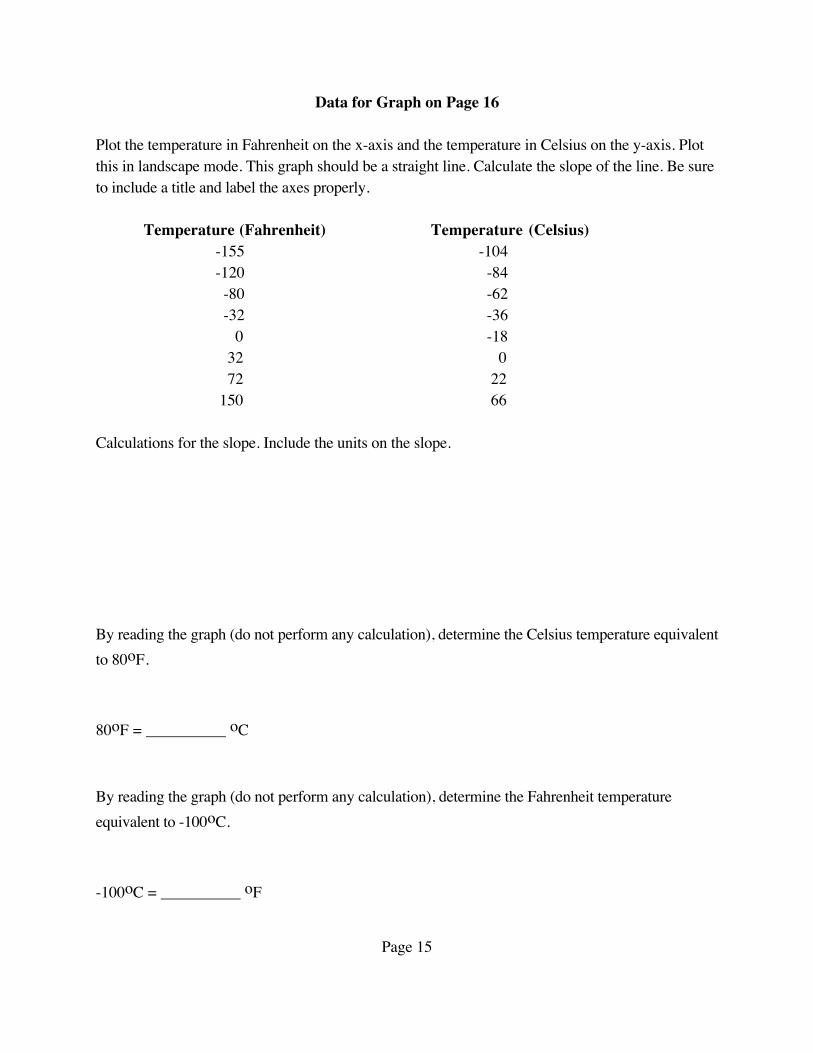
Data for Graph on Page 16
Plot the temperature in Fahrenheit on the x-axis and the temperature in Celsius on the y-axis. Plot this in landscape mode. This graph should be a straight line. Calculate the slope of the line. Be sure to include a title and label the axes properly.
Temperature (Fahrenheit) Temperature (Celsius) -155 -104 -120 -84 -80 -62 -32 -36 0 -18
32 0 72 22 150 66
Calculations for the slope. Include the units on the slope.
By reading the graph (do not perform any calculation), determine the Celsius temperature equivalent to 80oF.
80oF = __________ oC
By reading the graph (do not perform any calculation), determine the Fahrenheit temperature equivalent to -100oC.
-100oC = __________ oF
Page 15

Page 16

Experiment 1Check-in, Safety, Identification of Lab
Equipment and an Introduction to Graphing
Report Sheet
Name_________________________ Date____________________
Unknown Data Set ____________________
Calculations for the slope of the line for the graph on Page 18 (if the graph is a straight line). Include the units on the slope.
Slope = __________________
Page 17

Page 18
Experiment 1Check-in, Safety, Identification of Lab
Equipment and an Introduction to Graphing
Report Sheet
Name_________________________ Date____________________
Unknown Data Set ____________________
Calculations for the slope of the line for the graph on Page 20 (if the graph is a straight line). Include the units on the slope.
Slope = __________________
Page 19

Page 20

Experiment 1Check-in, Safety, Identification of Lab
Equipment and an Introduction to Graphing
Report Sheet
Name_________________________ Date____________________
Unknown Data Set ____________________
Calculations for the slope of the line for the graph on Page 22 (if the graph is a straight line). Include the units on the slope.
Slope = __________________
Page 21

Page 22

Experiment 2Significant Figures, the Metric System,
Measurement, and Conversion Between Units
Name_________________________ Date____________________
LEARNING OBJECTIVES
To learn the method for determining the mass, length and volume using the appropriate laboratory equipment
To learn the correct use of a laboratory balance, a meter stick, a graduated cylinder, a pipet,and a buret
To emphasize the use of significant figures in calculations
To work problems dealing with the conversion between units
APPARATUS
Ruler (inches and cm) (1 per student)Balance10 mL Graduated cylinder (1 per student)100 mL Graduated cylinder (1 per student)50 mL Beaker (3 per student)100 mL Beaker (2 per student)10 mL pipet (1 per student)Pipet bulb (1 per student)50 mL buret (1 per student)Ring stand (1 per student)Buret clamp (1 per student)Funnel (for buret) (1 per student)Eye dropper (1 per student)Thermometer (1 available for student inspection in room
temperature water)
MATERIALS
Various rectangular solids (used for unknowns) (1 per student)Paper (various rectangular sizes) (1 per student)Room temperature water (200 mL per student)
Page 23

PRELAB DISCUSSION
Being able to accurately use laboratory glassware and instrumentation is vital to student performance in the lab. Another vital task is for students to be able to use data to explain the concept being taught. Hopefully this lab will give you practice at both of these tasks.
In this lab, you are going to determine the length of paper using various units. You will also determine the mass of different volumes of water using various measuring devices. Based upon this last series of measurements, you should be able to compare the measuring devices.
Page 24

PRELAB QUESTIONS
1 Which lab instrument is used to measure each of the following? Include the units of the measurement.
Mass
Volume (list at least four devices)
Length
Temperature
2 You wish to measure approximately 9 mL of water using the following measuring devices. How many significant figures will be in each measurement? If the measuring device is unsuitable for such a measurement, state why.
10 mL graduated cylinder 100 mL graduated cylinder 50 mL beaker 10 mL pipet100 mL volumetric flask 50 mL buret
3 You wish to measure approximately 40 mL of water using the following measuring devices. How many significant figures will be in each measurement? If the measuring device is
unsuitable for such a measurement, state why.
10 mL graduated cylinder 100 mL graduated cylinder 50 mL beaker 10 mL pipet100 mL volumetric flask 50 mL buret
4 When you place a beaker containing water on an balance (one that records to 3 or 4 decimal places), you notice that the mass decreases as it sits on the balance. Explain.
Page 25

PRELAB PROBLEMS
1 While dispensing a liquid using a buret, the initial reading on the buret was 1.56 mL. The reading after the liquid was dispensed was 28.46 mL. What was the volume of the liquid dispensed. Show your calculation and report the answer to the correct number of significant
digits.
2 When determining the mass of a sodium chloride sample, a weighing paper was placed on the balance. The weighing paper had a mass of 0.5034 grams and the mass of the weighing paper plus the sodium chloride was 1.3044 grams. Determine the mass of the sodium chloride. Show your calculation and report the answer to the correct number of significant digits.
3 You have a piece of carpet that is 4.56 meters by 3.55 meters. What is the area of the carpet in square meters? What is the area in square inches? Don’t forget to record your answer to the correct number of significant figures. Show your calculations CLEARLY. 1 in = 2.54 cm
Page 26
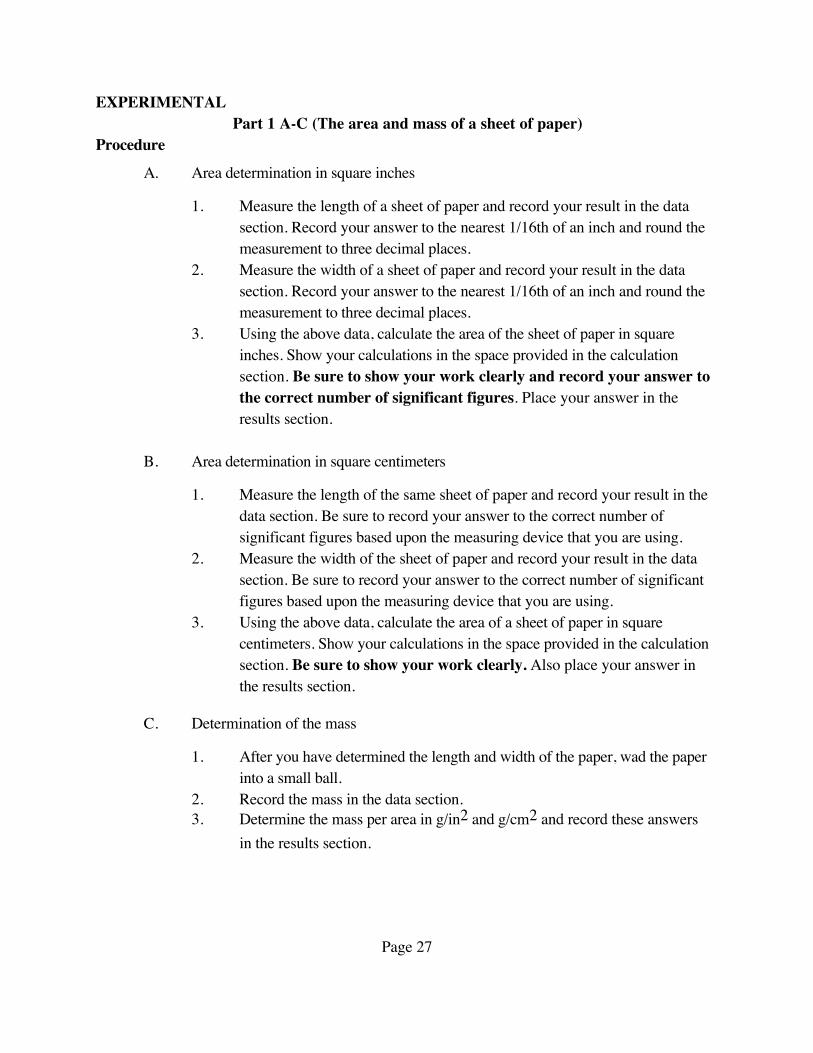
EXPERIMENTALPart 1 A-C (The area and mass of a sheet of paper)
Procedure
A. Area determination in square inches
1. Measure the length of a sheet of paper and record your result in the data section. Record your answer to the nearest 1/16th of an inch and round the measurement to three decimal places.
2. Measure the width of a sheet of paper and record your result in the data section. Record your answer to the nearest 1/16th of an inch and round the measurement to three decimal places.
3. Using the above data, calculate the area of the sheet of paper in square inches. Show your calculations in the space provided in the calculation section. Be sure to show your work clearly and record your answer to the correct number of significant figures. Place your answer in the results section.
B. Area determination in square centimeters
1. Measure the length of the same sheet of paper and record your result in the data section. Be sure to record your answer to the correct number of significant figures based upon the measuring device that you are using.
2. Measure the width of the sheet of paper and record your result in the data section. Be sure to record your answer to the correct number of significant figures based upon the measuring device that you are using.
3. Using the above data, calculate the area of a sheet of paper in square centimeters. Show your calculations in the space provided in the calculation section. Be sure to show your work clearly. Also place your answer in the results section.
C. Determination of the mass
1. After you have determined the length and width of the paper, wad the paper into a small ball.
2. Record the mass in the data section. 3. Determine the mass per area in g/in2 and g/cm2 and record these answers
in the results section.
Page 27
Data
A. Length of paper _________________ in
Width of paper _________________ in
B. Length of paper _________________ cm
Width of paper _________________ cm
C Mass of paper _________________ g
Calculations
A. Area determination in square inches
B. Area determination in square centimeters
C. Determination of mass per area
C1. Determine the mass per square inch
C2. Determine the mass per square centimeter
Results
A. Area in square inches _________________ in2
B. Area in square centimeters _________________ cm2
C1. Mass/area in g/in2 _________________ g/in2
C2. Mass/area in g/cm2 _________________ g/cm2
Page 28
Part 1 D (The mass per area of a sheet of paper)
Procedure
D. You have now determined the area of a piece of paper in square inches and in square centimeters. Using the two values obtained from A and B above for the area of the paper, write the conversion factor between square inches and square centimeters in the data section below. Using this conversion factor, you should now be able to set up a problem to determine the number of square inches equivalent to 1 square centimeter. Show your calculations in the space provided in the calculations section. Also place your answer in the results section.
Data
D. __________ in2 = __________cm2
Calculations
D. Conversion factor between square inches and square centimeters
Results
D. Conversion factor 1 cm2 = ___________________ in2
Page 29

Discussion
1. Using the conversion factor, 1 in = 2.54 cm, calculate the actual number of square inches that are equivalent to 1 square centimeter. Notice that I want the conversion factor relating the number of square inches equal to 1 square centimeter.
Explain any discrepancies between your conversion factor and the actual conversion factor.
Page 30

Part 2 (Mass of water)
Procedure
Determine the mass of water using various measuring devices. When recording each of the masses and volumes in this experiment, be certain to record all values to the correct number
of significant figures.
1. Weigh five dry beakers and label them 1 - 5. These can be either 50 mL or 100 mL beakers. Record the masses in the data section.
2. To Beaker 1, add ten milliliters of water using a 10 mL graduated cylinder. Reweigh the beaker and record the mass in the data table.
3. To Beaker 2, add ten milliliters of water using a 100 mL graduated cylinder. Reweigh the beaker and record the mass in the data table.
4. To Beaker 3, add ten milliliters of water using a 10 mL pipet. Reweigh the beaker and record the mass in the data table.
5. To Beaker 4, add ten milliliters of water using a 50 mL buret. Reweigh the beaker and record the mass in the data table.
6. To Beaker 5, add ten milliliters of water using the markings on the beaker. This should be a 50 mL beaker. Reweigh the beaker and record the mass in the data table.
7. Dry your beakers thoroughly and repeat Steps 2-6 twice more. You can use the same mass of the empty beakers from the initial weighings.
8. Using the above data, calculate the mass of ten milliliters of water. Place your answer in the results section. Remember to carry each calculation to the correct number of significant figures.
9. Determine the room temperature by reading the thermometer that your instructor has placed in the lab and record your measurement in the data section.
Page 31

Data Trial 1 Trial 2 Trial 3
10 mL graduated cylinderMass of Beaker 1 empty __________ g __________ g __________ g
Mass of Beaker 1 + ten mL water __________ g __________ g __________ g
100 mL graduated cylinderMass of Beaker 2 empty __________ g __________ g __________ g
Mass of Beaker 2 + ten mL water __________ g __________ g __________ g
10 mL pipetMass of Beaker 3 empty __________ g __________ g __________ g
Mass of Beaker 3 + ten mL water __________ g __________ g __________ g
50 mL buretMass of Beaker 4 empty __________ g __________ g __________ g
Mass of Beaker 4 + ten mL water __________ g __________ g __________ g
50 mL beakerMass of Beaker 5 empty __________ g __________ g __________ g
Mass of Beaker 5 + ten mL water __________ g __________ g __________ g
Temperature of water _________ oC
CalculationsNONE
ResultsTrial 1 Trial 2 Trial 3 Average
10 mL graduated cylinderMass of water in Beaker 1 _________ g _________ g _________ g _________ g
100 mL graduated cylinderMass of water in Beaker 2 _________ g _________ g _________ g _________ g
10 mL pipetMass of water in Beaker 3 _________ g _________ g _________ g _________ g
50 mL buretMass of water in Beaker 4 _________ g _________ g _________ g _________ g
Page 32

Discussion
1. The actual mass of 10 mL of water can be determined using the following table. Write the mass of 10 mL of water in the blank below based upon the temperature in the room.
Mass of Ten mL of Water at Various TemperaturesTemperature (oC) Mass (grams)
15 9.99103 16 9.98946 17 9.98778 18 9.98599 19 9.98408 20 9.98207 21 9.97996 22 9.9777423 9.9754224 9.9730025 9.9704826 9.9678727 9.9651628 9.96237
Actual mass ____________________
In this experiment, you determined the mass of 10 mL of water using a 10 mL graduated cylinder, a 100 mL graduated cylinder, a 10 mL pipet, a 50 mL buret., and a 50 mL beaker. Rank these measuring devices from the most accurate (gives the correct result) to the least accurate. Give a reason for your order. Also rank these devices from the most precise (most reproducible) to the least precise and give a reason for your order.
Page 33
Part 3 (The area and mass of an unknown rectangular solid)
Procedure
A. Area determination in square centimeters
1. Measure the length of your unknown and record your result in the data section. Be sure to record your answer to the correct number of significant figures based upon the measuring device that you are using.
2. Measure the width of your unknown and record your result in the data section. Be sure to record your answer to the correct number of significant figures based upon the measuring device that you are using.
3. Using the above data, calculate the area of your unknown in square centimeters. Show your calculations in the space provided in the calculation section. Be sure to show your work clearly. Also place your answer in the results section. Be sure to record your answer to the correct number of significant figures.
B. Determination of the mass and the mass per area
1. After you have determined the length and width of the unknown, place the unknown onto the balance and determine its mass.
2. Record the mass in the data section.
3. Determine the mass per area in g/cm2 and record these answers in the results section and on the Report Sheet.
Data
A. Length of unknown _________________ cm
Width of unknown _________________ cm
B Mass of unknown _________________ g
Page 34

Calculations
Area determination in square centimeters
Determine the mass per square centimeter
ResultsArea in cm2 _________________ cm2
Mass/area in g/cm2 _________________ g/cm2
Page 35

Part 4 (Mass of 10 mL of Unknown Liquid)
Procedure
Determine the mass of 10 mL of an unknown liquid using one of the measuring devices used in Part 2. You need only perform the determination one time. Record the mass of the unknown liquid on the Report Sheet. When recording each of the masses and volumes in this experiment, be certain to record all values to the correct number of significant figures.
1. Weigh a dry beaker. This can be either 50 mL or 100 mL beaker. Record the mass in the data section.
2. Add ten milliliters of your unknown liquid to the beaker using the device of your choosing. Reweigh the beaker and record the mass in the data table.
3. Using the above data, calculate the mass of ten milliliters of the unknown liquid. Place your answer in the results section and on the Report Sheet. Remember to carry the calculation to the correct number of significant figures.
Data
Mass of Beaker empty __________ g
Mass of Beaker + 10 mL Unknown Liquid __________ g
Calculations
ResultsMass of 10 mL of Unknown Liquid __________ g
Page 36
Experiment 2Significant Figures, the Metric System,
Measurement, and Conversion Between Units Lab
Report Sheet
Name_________________________ Date____________________
Unknown Number for Solid Rectangular Solid ____________________
Area in cm2 _________________ cm2
Mass/area in g/cm2 _________________ g/cm2
Unknown Number for Liquid ____________________
Mass of 10 mL of Unknown Liquid _________________ grams
Page 37

Intentional left blank
Page 38
Experiment 3Determination of the Density ofSolids, Liquids, and Solutions
Name_________________________ Date____________________
LEARNING OBJECTIVES
To learn the method for determining the density of liquids, solids, and solutions
To learn the correct use of a laboratory balance, a graduated cylinder, a pipet and a buret
To emphasize the use of significant figures in calculations
To practice graphing data and interpreting the graph to obtain information
APPARATUS
Ruler (inches and cm) (1 per student)BalanceSpatula (for salt) (1 per balance)10 mL Graduated cylinder (1 per student)100 mL Graduated cylinder (1 per student)50 mL Beaker (1 per student)100 mL Beaker (1 per student)250 mL Beaker (1 per student)10 mL pipet (1 per student)Pipet bulb (1 per student)50 mL buret (1 per student)Ring stand (1 per student)Buret clamp (1 per student)Funnel (for buret) (1 per student)Eye dropper (1 per student)
MATERIALS
Aluminum cylinder (1 cylinder per student)Salt (20 grams per student)WaterSaturated NaCl solution (100 mL per student)Unknown rectangular solid unknowns (1 per student)
Page 39

PRELAB DISCUSSION
Density is defined as the mass per unit volume of a substance. For solids and liquids, the density is usually reported in g/mL or g/cm3. These units are the same since a mL and a cm3 arethe same. The density of gases is often reported in g/L.
In this lab, you are going to determine the density of various substances. First you will determine the density of an aluminum cylinder. You will determine the density by two methods. The first of these involves using an algebraic formula to determine the volume of the cylinder. The second method uses liquid displacement as the method for determining the volume of the cylinder. In this experiment we use water as the liquid. You can only use liquid displacement if the material being added to the liquid is more dense than the liquid. If it is less dense, it won’t sink. Also, it must not react with or dissolve in the liquid to which it is added. Next, you will determine the density of solid sodium chloride. This is slightly different from the first experiment since the sodium chloride that you will be using is a granular solid. Next, you will determine the density of a saturated NaCl (sodium chloride) solution. When a solution is saturated with sodium chloride, it contains the maximum amount of sodium chloride allowed. If more sodium chloride is added to the solution, it just precipitates (settles to the bottom of the container). Finally, you will determine the density of an unknown rectangular solid using two methods. In making these density determinations, you will also become familiar with the use of various lab glassware and equipment.
Page 40
PRELAB QUESTIONS
1 In one experiment, you are to determine the density of an aluminum cylinder by water displacement. Could you determine the density of a piece of cork using this method? Explain.
2 Could you determine the density of salt by water displacement? Explain.
3 Which of the following are NOT units of density? Remember that density is defined as the mass per unit volume.
pounds/in2 g/mL tons/m3 ounces/L3 kg/ft
Page 41
PRELAB PROBLEMS
1 The mass of 10.5 mL of a certain solution was 8.323 grams. Calculate the density of the solution.
2 A graduated cylinder contained 50.3 mL of water. When an unknown solid having a mass of 7.456 grams was added to the cylinder, the volume increased to 54.9 mL. Calculate the density of the unknown solid.
3 An empty graduated cylinder had a mass of 74.6 grams. When 4.56 mL of an unknown liquid was added to the cylinder, the mass increased to 78.7 grams. Calculate the density of the unknown liquid.
4 Calculate the mass (in grams) of 57.8 mL of a liquid if the density is 3.47 g/mL.
Page 42
PRELAB PROBLEMS (CONTINUED)
5 The density of an unknown liquid is 1.7985 g/mL. An empty 250 mL beaker had a mass of 145.34 grams. When an unknown volume of the liquid was added to the beaker, the mass increased to 264.34 grams. Calculate the volume of the liquid which was added.
6 An empty graduated cylinder weighed 49.3453 grams. If 10.43 mL of a liquid was added to the graduated cylinder, determine the final mass of the graduated cylinder after the liquid was added. The density of the liquid is 1.732 g/mL.
7 A graduated cylinder containing an 20.5 mL of liquid weighed 110.4567 grams. If the density of the unknown liquid is 0.9856 g/mL, what is the weight of the graduated cylinder when it is empty?
Page 43
EXPERIMENTALPart 1 (The density of aluminum)
Procedure
A. Density determination using a formula1. Determine the mass of an aluminum cylinder and record your result in the
data section.2. Measure the length of the cylinder (in cm) and record your result in the data
section.3. Measure the distance from opposite corners (in cm) of the cylinder and
record your result in the data section. 4. Using the above data, calculate the density of the cylinder. Show your
calculations in the space provided in the calculation section. Also place your answer in the results section.
B. Density determination using water displacement1. Record your mass (determined in Step A1 above) in the data section. 2. Fill a 100 mL graduated cylinder approximately half full with water and
record the initial volume of the graduated cylinder in the data section.3. Place the aluminum cylinder gently into the graduated cylinder. It may
help to tilt the graduated cylinder slightly. Read the final volume of the graduated cylinder and record the volume in the data section.
4. Using the above data, calculate the density of the cylinder. Show your calculations in the space provided in the calculation section. Also place your answer in the results section.
Data
A. Mass of cylinder _________________ g
Length of cylinder _________________ cm
Distance between opposite corners _________________ cm
B. Mass of cylinder _________________ g
Initial volume of graduated cylinder _________________ mL
Final volume of graduated cylinder _________________ mL
Page 44
Calculations
A. Density determination using a formulaThe following formula for the volume of a right hexagonal cylinder may be helpful.
V = 0.06495 d2l (d is the distance between opposite corners) (l is the length of the cylinder)
B. Density determination using water displacement
Results
A. Density of cylinder _________________ g/cm3
B. Density of cylinder _________________ g/mL
Page 45
Discussion
1. The actually density of the aluminum cylinder will be given to you by your instructor. Write it in the blank below.
Actual density ____________________
2. Using Method A, we obtained the results in g/cm3 while we obtained the units in g/mL when using method B. Is there a problem? Why or why not?
3. Calculate the percent error found in the density determinations in this experiment. Use the following formula.
| actual value - experimental value |Percent error = ------------------------------------------ x 100 %
actual value
The experimental value is the answer you determined while the calculated value is the answer provided by your instructor. Show your calculations clearly and BE CAREFUL WITH SIGNIFICANT FIGURES.
Method A (Algebraic formula
Method B (Water displacement)
Page 46

Part 2 (The density of salt)
Procedure
Using a graduated cylinder to determine the density of salt1. Weigh approximately 10 grams of salt onto a piece of weighing paper.
You do not need to weigh exactly 10 grams, but you do need to know how much you weighed. Record the mass in the data section.
2. Now add the salt to a dry 10 mL graduated cylinder and record the volume of salt in the graduated cylinder in the data section.
3. Using the above data, calculate the density of the salt. Show your calculations in the space provided in the calculation section. Also place your answer in the results section.
Data
Mass of salt _________________ g
Volume of salt _________________ mL
Calculations
Results
Density of salt _________________ g/mL
Discussion
1. Using the results from your experiment, determine the mass (in pounds) of a 5.00 gallon container of salt. 946 mL = 1 quart 454 g = 1 pound
2. Using the results from your experiment, determine the volume (in gallons) of 50.0 pounds of salt. 946 mL = 1 quart 454 g = 1 pound
Page 47

Discussion (Continued)
3. Write the density found by four other students in the lab. Pick students at random.
Density found by student 1 ____________________
Density found by student 2 ____________________
Density found by student 3 ____________________
Density found by student 4 ____________________
More than likely, the densities are not very close to one another. Explain why the densities have such a variance.
Page 48

Part 3 (The density of a saturated NaCl solution)
Procedure
You will need to get approximately 100 mL of the saturated NaCl solution in your 250 mL beaker to use in this part of the experiment.
A. Density determination using a graduated cylinder
1. Determine the mass of an empty 10 mL graduated cylinder and record it in the data section.
2. Add approximately 9 mL of saturated NaCl solution (to the correct significant figures) to the graduated cylinder. You do NOT need to try to get on the 9 mL mark. You just need to record (to the correct number of significant figures) the volume contained in the graduated cylinder.
3. Determine the mass of the 10 mL graduated cylinder which now contains the saturated NaCl solution and record it in the data section.
4. Using the above data, calculate the density of the saturated NaCl solution. Show your calculations in the space provided in the calculation section. Also place your answer in the results section.
B. Density determination using a pipet
1. Determine the mass of an empty 50 mL beaker and record it in the data section.
2. Add 10 mL of saturated NaCl solution (to the correct significant figures) using a 10 mL pipet to the beaker. Your instructor will review the use of a pipet. Also your instructor will help you in the significant figure usage when using a pipet.
3. Determine the mass of the 50 mL beaker which now contains the saturated NaCl solution and record it in the data section.
4. Using the above data, calculate the density of the saturated NaCl solution. Show your calculations in the space provided in the calculation section. Also place your answer in the results section.
Page 49
Procedure (Continued)
C. Density determination using a buret
1. Determine the mass of an empty 100 mL beaker and record it in the data section.
2. Fill your buret to a mark somewhere between 5 mL and 10 mL. Record the initial buret reading in the data section. Add approximately 35 mL of saturated NaCl solution (to the correct significant figures) to the beaker. Record the final buret reading in the data section. Your instructor will review the use of a buret.
3. Determine the mass of the 100 mL beaker which now contains the saturated NaCl solution and record it in the data section.
4. Using the above data, calculate the density of the saturated NaCl solution. Show your calculations in the space provided in the calculation section. Also place your answer in the results section.
Data
A. Mass of empty graduated cylinder _________________ g
Volume of saturated NaCl solution _________________ mL
Mass of graduated cylinder and solution _________________ g
B. Mass of empty beaker _________________ g
Volume of saturated NaCl solution _________________ mL
Mass of beaker and solution _________________ g
C. Mass of empty beaker _________________ g
Initial buret reading _________________ mL
Final buret reading _________________ mL
Mass of beaker and solution _________________ gPage 50

Calculations
A. Density determination using a graduated cylinder
B. Density determination using a pipet
C. Density determination using a buret
Results
A. Density of saturated NaCl solution _________________ g/mL
B. Density of saturated NaCl solution _________________ g/mL
C. Density of saturated NaCl solution _________________ g/mL
Discussion
1. The actually density of the sodium chloride will be given to you by your instructor. Write it in the blank below.
Actual density ____________________
Based upon this information, which method do you feel was the better method for determining the density of the saturated NaCl solution? Justify your answer.
Page 51

Discussion (Continued)
2. Calculate the percent error found in the density determinations in this experiment. Use the following formula.
| actual value - experimental value |Percent error = ------------------------------------------ x 100 %
actual value
The experimental value is the answer you determined while the calculated value is the answer provided by your instructor. Show your calculations clearly and BE CAREFUL WITH SIGNIFICANT FIGURES.
Method A (Using a graduated cylinder)
Method B (Using a pipet)
Method C (Using a buret)
Page 52
Part 4 (The density of an unknown rectangular solid)
ProcedureDensity determination using a formula
1. Determine the mass of your unknown and record in the data section.
2. Measure the length, width and height of your unknown (in cm) and record in the data section.
3. Measure the distance from opposite corners (in cm) of the cylinder and record your result in the data section.
4. Using the above data, calculate the density of your unknown. Show your calculations in the space provided in the calculation section. Also place your
answer in the results section and on the Report Sheet.
DataMass of unknown _________________ g
Length of unknown _________________ cm
Width of unknown _________________ cm
Height of unknown _________________ cm
Calculations
Density determination using a formula The following formulas for the volume and density of your unknown may be helpful.
V = L x W x H D = m/V
ResultsDensity of unknown _________________ g/cm3
Page 53
Part 5 (The density of an unknown liquid)Procedure
You will need to get approximately 20 mL of the unknown liquid in your 50 mL beaker to use in this part of the experiment.
Density determination using a pipet
1. Determine the mass of an empty 50 mL beaker and record it in the data section.
2. Add 10 mL of the unknown liquid (to the correct significant figures) using a 10 mL pipet to the beaker.
3. Determine the mass of the 50 mL beaker which now contains the unknown liquid and record it in the data section.
4. Using the above data, calculate the density of the unknown liquid. Show your calculations in the space provided in the calculation section. Also place your answer in the results section and on the Report Sheet.
DataMass of empty beaker _________________ g
Volume of unknown liquid _________________ mL
Mass of beaker and and unknown liquid _________________ g
Calculations
Density determination using a pipet
Results
Density of unknown liquid _________________ g/mL
Page 54
Experiment 3Determine the Density of Solids,
Liquids, and Solutions Lab
Report Sheet
Name_________________________ Date____________________
Unknown Number for Solid Rectangular Solid ____________________
Density of unknown _________________ g/cm3
Unknown Number for Liquid ____________________
Density of unknown liquid _________________ g/mL
Page 55

Intentional left blank
Page 56

Experiment 4Lewis Structures and VSEPR
Name_________________________ Date____________________
LEARNING OBJECTIVES
To understand the concept of organic functional gruops
To understand how multiple structures can have the same formulas
To understand the concept of valence and how to utilize it when determining structures
To learn how to correctly draw Lewis structures
To learn how to correctly draw VSEPR structures
To learn how to use molecular models to conclude the shape of molecules
APPARATUS
None
MATERIALS
Model Set (1 per pair of students)
Page 57
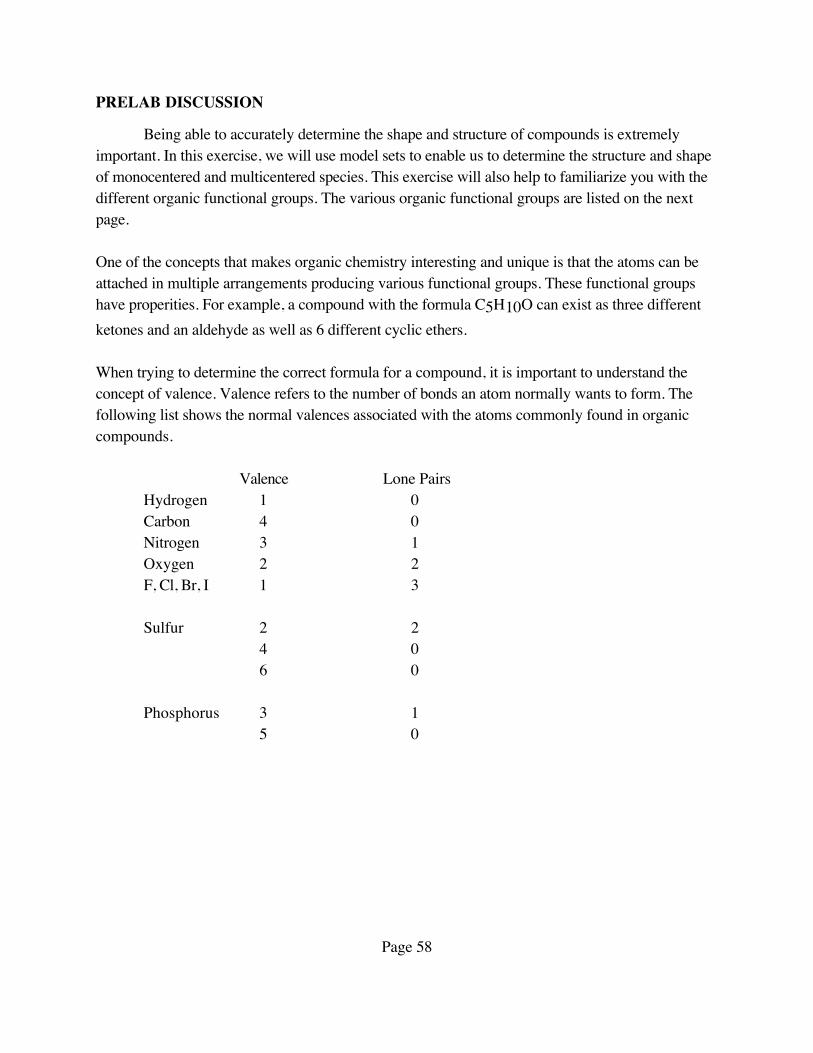
PRELAB DISCUSSION
Being able to accurately determine the shape and structure of compounds is extremely important. In this exercise, we will use model sets to enable us to determine the structure and shape of monocentered and multicentered species. This exercise will also help to familiarize you with the different organic functional groups. The various organic functional groups are listed on the next page.
One of the concepts that makes organic chemistry interesting and unique is that the atoms can be attached in multiple arrangements producing various functional groups. These functional groups have properities. For example, a compound with the formula C5H10O can exist as three different ketones and an aldehyde as well as 6 different cyclic ethers.
When trying to determine the correct formula for a compound, it is important to understand the concept of valence. Valence refers to the number of bonds an atom normally wants to form. The following list shows the normal valences associated with the atoms commonly found in organic compounds.
Valence Lone PairsHydrogen 1 0Carbon 4 0Nitrogen 3 1Oxygen 2 2F, Cl, Br, I 1 3
Sulfur 2 2 4 0 6 0
Phosphorus 3 1 5 0
Page 58

When using the model sets, follow the following color scheme for the indicated atoms.Carbon BlackHydrogen WhiteNitrogen Blue (4 hole)Oxygen RedSulfur Yellow (4 hole)Chlorine GreenBromine Gray (small)
Page 59
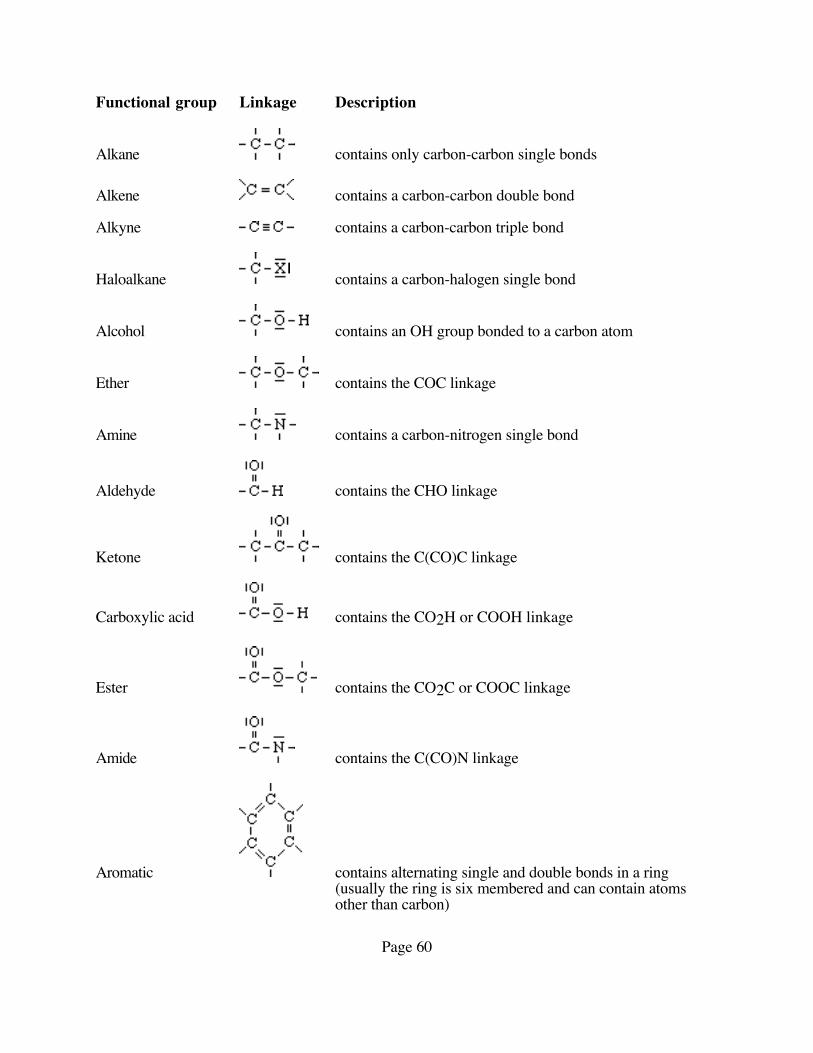
Functional group Linkage Description
Alkane contains only carbon-carbon single bonds
Alkene contains a carbon-carbon double bond
Alkyne contains a carbon-carbon triple bond
Haloalkane contains a carbon-halogen single bond
Alcohol contains an OH group bonded to a carbon atom
Ether contains the COC linkage
Amine contains a carbon-nitrogen single bond
Aldehyde contains the CHO linkage
Ketone contains the C(CO)C linkage
Carboxylic acid contains the CO2H or COOH linkage
Ester contains the CO2C or COOC linkage
Amide contains the C(CO)N linkage
Aromatic contains alternating single and double bonds in a ring(usually the ring is six membered and can contain atoms other than carbon)
Page 60

EXPERIMENTALPart 1 (Monocentered species)
Procedure
For each of the following molecules, draw the Lewis structure. If more than one resonance structure can be written, draw each resonance structure. Make the model, draw the VSEPR structure for the molecule (use your model as a guide) and answer the questions.
Results
CH4Lewis structure VSEPR structure
What is the bond angle about the central atom? __________
Is this molecule polar (does it have a dipole moment)? __________
CH2Cl2Lewis structure VSEPR structure
What is the bond angle about the central atom? __________
Is this molecule polar (does it have a dipole moment)? __________
Page 61
Procedure
For each of the following molecules, draw the Lewis structure. If more than one resonance structure can be written, draw each resonance structure. Make the model, draw the VSEPR structure for the molecule (use your model as a guide) and answer the questions.
Results
CO2Lewis structure VSEPR structure
What is the bond angle about the central atom? __________
Is this molecule polar (does it have a dipole moment)? __________
What type of bonding is found in this molecule (ionic, polar covalent or nonpolar covalent)?
H2COLewis structure VSEPR structure
What is the bond angle about the central atom? __________
Is this molecule polar (does it have a dipole moment)? __________
Which functional group is present for this organic compound? __________________
Page 62
Part 2 (Multicentered species)
Procedure
For each of the following molecules, draw the Lewis structure. If more than one resonance structure can be written, draw each resonance structure. Make the model, draw the VSEPR structure for the molecule (use your model as a guide) and answer the questions.
Results
CH3CH3Lewis structure VSEPR structure
What is the bond angle about the central carbon atoms? __________
Is there free rotation about the carbon-carbon bond? __________
CH2CH2Lewis structure VSEPR structure
What is the bond angle about the central carbon atoms? __________
Is there free rotation about the carbon-carbon bond? __________
Page 63

Procedure
For each of the following molecules, draw the Lewis structure. If more than one resonance structure can be written, draw each resonance structure. Make the model, draw the VSEPR structure for the molecule (use your model as a guide) and answer the questions.
Results
C2H2Cl2 (the chlorine atoms are on different carbon atoms)First Lewis structure VSEPR structure
Second Lewis structure VSEPR structure
What is the bond angle about the central atom? __________
Is there free rotation about the carbon-carbon bond? __________
Are these two structures the same (why or why not)?
Are all of the atoms in the same plane?
Page 64
Procedure
For each of the following molecules, draw the Lewis structure. If more than one resonance structure can be written, draw each resonance structure. Make the model, draw the VSEPR structure for the molecule (use your model as a guide) and answer the questions.
Results
C2H2Lewis structure VSEPR structure
What is the bond angle about the central carbon atoms? __________
What is the hybridization of the central carbon atoms? __________
What is the shape of this molecule? __________
CH3OHLewis structure VSEPR structure
What is the bond angle about the carbon atom? __________
What is the hybridization of the carbon atom? __________
Page 65

Procedure
For each of the following molecules, draw the Lewis structure. If more than one resonance structure can be written, draw each resonance structure. Make the model, draw the VSEPR structure for the molecule (use your model as a guide) and answer the questions.
Results
C4H8O (draw the ketone only)Lewis structure VSEPR structure
What is the bond angle about the C atom bonded to the O atom? __________
Page 66
Procedure
For each of the following molecules, draw the Lewis structure. If more than one resonance structure can be written, draw each resonance structure. Make the model, draw the VSEPR structure for the molecule (use your model as a guide) and answer the questions.
Results
C2H6O (two structures)First Lewis structure VSEPR structure
What is the bond angle about the oxygen atom? __________
What is the functional group in this compound? __________
Second Lewis structure VSEPR structure
What is the bond angle about the oxygen atom? __________
What is the functional group in this compound? __________
Page 67
ProcedureFor each of the following molecules or ions, draw the Lewis structure. If more than one
resonance structure can be written, draw each resonance structure. Make the model, draw the VSEPR structure for the molecule or ion (use your model as a guide) and answer the questions.
Results
C2H7N (two structures)First Lewis structure VSEPR structure
How many carbon atoms are attached to the nitrogen atom? __________
What is the functional group in this compound? __________
Second Lewis structure VSEPR structure
How many carbon atoms are attached to the nitrogen atom? __________
What is the functional group in this compound? __________
Page 68
Procedure
For each of the following molecules or ions, draw the Lewis structure. If more than one resonance structure can be written, draw each resonance structure. Make the model, draw the VSEPR structure for the molecule or ion (use your model as a guide) and answer the questions.
Results
C3H4O2 (draw the carboxylic acid)Lewis structure VSEPR structure
What is the bond angle about the C atom bonded to the O atoms? __________
C3H4O2 (draw the ester)Lewis structure VSEPR structure
What is the bond angle about the C atom bonded to the O atoms? __________
Page 69
Procedure
For each of the following molecules or ions, draw the Lewis structure. If more than one resonance structure can be written, draw each resonance structure. Make the model, draw the VSEPR structure for the molecule or ion (use your model as a guide) and answer the questions.
Results
C3H6O (draw the ketone)Lewis structure VSEPR structure
What is the bond angle about the C atom bonded to the O atom? __________
C3H6O (draw the aldehyde)Lewis structure VSEPR structure
What is the bond angle about the C atom bonded to the O atom? __________
Page 70
Procedure
For each of the following molecules or ions, draw the Lewis structure. If more than one resonance structure can be written, draw each resonance structure. Make the model, draw the VSEPR structure for the molecule or ion (use your model as a guide) and answer the questions.
Results
C6H7N (Draw only the species which is aromatic)Lewis structure VSEPR structure
What is the bond angle about the ring carbon atoms? __________
Page 71
Experiment 4Lewis Structures and VSEPR Lab
Report Sheet
Name_________________________ Date____________________
Unknown number for compound list ____________________
ProcedureFor each of the compounds on your compound list, draw the Lewis structure. If more than
one resonance structure can be written, draw each resonance structure. Make the model, draw the VSEPR structure for the molecule or ion (use your model as a guide).
Compound 1
Lewis structure VSEPR structure
Compound 2
Lewis structure VSEPR structure
Page 72

Experiment 4Lewis Structures and VSEPR Lab
Report Sheet (Page 2)
Name_________________________ Date____________________
Unknown number for compound list ____________________
ProcedureFor each of the compounds on your compound list, draw the Lewis structure. If more than
one resonance structure can be written, draw each resonance structure. Make the model, draw the VSEPR structure for the molecule or ion (use your model as a guide).
Compound 3
Lewis structure VSEPR structure
Page 73
Intentional left blank
Page 74
Experiment 5Determination of the Percent of
NaCl in a Mixture by Filtration Lab
Name_________________________ Date____________________
LEARNING OBJECTIVES
To learn the method for separation of a mixture using filtration To learn the correct use of a funnel and filter paper To learn how to perform calculations concerning percent composition
APPARATUS
Balance Spatula for salt (1 per balance)Spatula for sand (1 per balance)Evaporating dish (2 per student)Watch glass (2 per student)100 mL Beaker (1 per student)Filter paper (5 sheets per student)Stirring rod (1 per student)Funnel (1 per student)Utility clamp (to hold funnel) (1 per student)Tongs (1 per student)
Hot plate (1 per two students)OR
Ring stand (1 per student)Iron ring (1 per student)Wire gauze (1 per student)Bunsen burner (1 per student)
MATERIALS
Water Salt (10 grams per student)Sand (10 grams per student)Individual unknowns in labeled test tubes or vials for each student
Page 75
PRELAB DISCUSSION
Before we begin discussing this lab, we need to define some terms.
Solvent - the liquid in which the solid will be dissolved
Solute - the solid that will be dissolved in the solvent
Solution - the mixture of solute and solvent
Soluble - a substance is soluble if will dissolve in the solvent
Insoluble - a substance is insoluble if it will NOT dissolve in the solvent
Filtrate - the liquid portion that passes through the filter paper
Filtration is a useful method for separating two solids. In order for filtration to be used, one solid should be soluble in a solvent while the other is insoluble in the solvent. The solvent containing the dissolved solute is poured through a filter. As the solution is passed through the filter paper, the soluble solute will be collected in a container while the insoluble material will be collected on the filter paper.
In this lab we will be separating a mixture of salt and sand. Since salt is soluble in water and sand is insoluble, filtration is a good method for performing this separation.
After the separation is complete, an analysis of the filtrate will allow you to determine the percent composition of the sand/salt mixture. Once you perform this analysis on a known sand/salt mixture, you will repeat the analysis on an unknown mixture.
Page 76
PRELAB PROBLEMS
1 When 3.1236 grams of an unknown mixture of salt and sand was filtered, 1.5671 grams of salt was collected. Determine the percent sand in the mixture.
2 Determine the mass of salt that should be mixed with 1.3697 grams of sand to create a mixture that is 18.52 % salt.
3 A mixture of salt and sand was prepared. The following masses were recorded on the balance:
Empty beaker 23.3423 gramsBeaker plus salt 24.6789 gramsBeaker plus salt and sand 26.1265 gramsEmpty evaporating dish and watch glass 34.5645 gramsEvaporating dish, watch glass and salt 35.1235 grams
After reading the lab experiment, use the above information to determine the percent salt and percent sand in the mixture.
Page 77
EXPERIMENTAL
Part 1 - Analysis of a Known Mixture of Salt and Sand
1. Heat an empty evaporating dish and watch glass for five minutes on a hot plate or over a Bunsen burner flame. Remove the evaporating dish and watch glass from the hot plate (use tongs) or turn off the burner flame and allow the evaporating dish and watch glass to cool. While you are waiting for the evaporating dish and watch glass to cool, you can continue with Steps 2 - 7.
2. Weigh an empty 100 mL beaker and record the mass in the data section. 3. Add between 1 and 2 grams of salt to the beaker. Record the mass of the beaker
plus salt in the data table. 4. Add between 1 and 2 grams of sand to the beaker. Record the mass of the beaker
plus salt and sand in the data table. You can now determine the mass of salt andsand in the mixture.
5. You can now determine the theoretical percent of salt in the mixture. Perform thiscalculation in the space provided in the calculation section and record the result inthe results section.
6. Add approximately 15 mL of water to the salt/sand mixture in the beaker and stir.The salt will dissolve, but the sand will not.
7. Allow the sand to settle to the bottom of the beaker. 8. Weigh the evaporating dish and watch glass (which was set aside in Step 1) and
record your mass in the data section. 9. Pour the solution in the beaker (which contains dissolved salt) through a funnel
which has been fitted with filter paper. Collect the filtrate (the liquid portion) in theevaporating dish.
10. Add another 15 ml of water to the beaker and stir to dissolve any remaining salt.Pour this solution through the filter paper into the evaporating dish.
11. After the solution has completely drained from the filter paper, use a wash bottle torinse the filter paper with an additional 10 mL of water.
12. Heat the evaporating dish (covered with a watch glass) on a hot plate or over aBunsen burner flame. Heat slowly at first to avoid boil over or splattering. Oncethe solution has boiled dry, heat intensely to remove ALL of the water.
13. Allow the evaporating dish and watch glass combination (which now contains thesalt from the mixture) to cool to room temperature. Record the mass in the datasection.
14. You can now determine the theoretical percent of salt and the experimental percentof salt. Show these calculations in the spaces provided in the calculation section.
15. Calculate the percent error in your results using the formula provided. 16. Record your theoretical percent of salt, your experimental percent of salt and your
percent error in the results section.Page 78
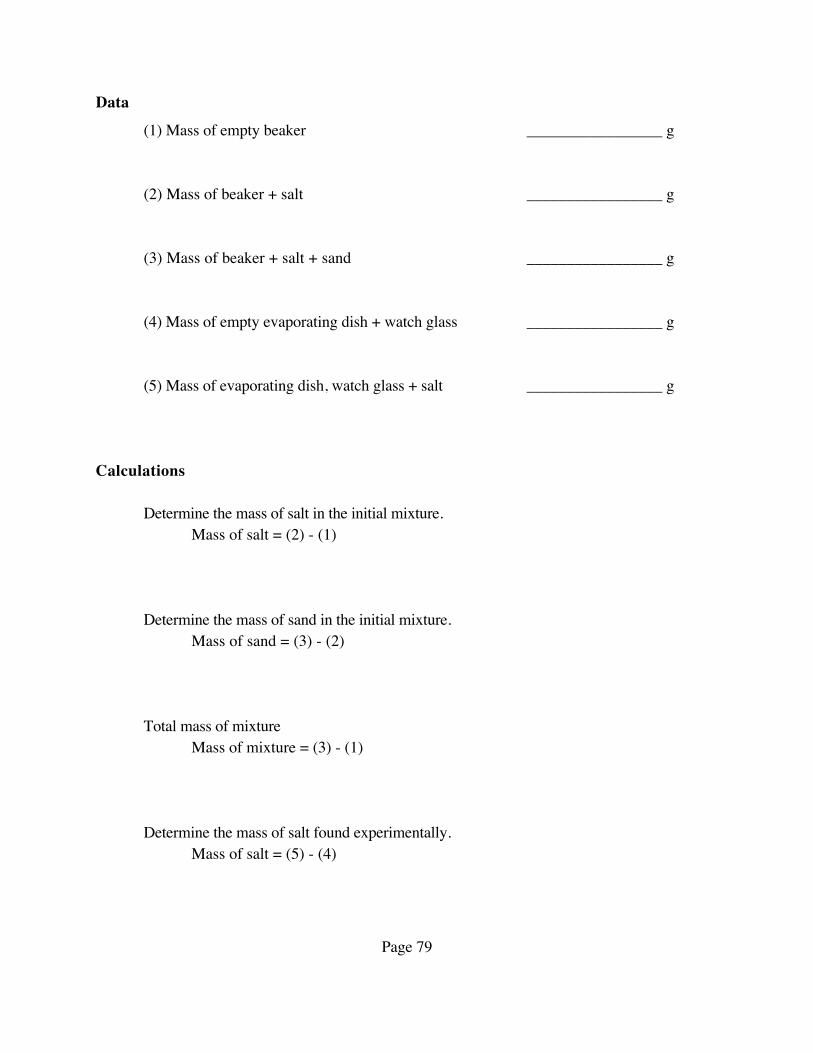
Data
(1) Mass of empty beaker _________________ g
(2) Mass of beaker + salt _________________ g
(3) Mass of beaker + salt + sand _________________ g
(4) Mass of empty evaporating dish + watch glass _________________ g
(5) Mass of evaporating dish, watch glass + salt _________________ g
Calculations
Determine the mass of salt in the initial mixture. Mass of salt = (2) - (1)
Determine the mass of sand in the initial mixture. Mass of sand = (3) - (2)
Total mass of mixture Mass of mixture = (3) - (1)
Determine the mass of salt found experimentally. Mass of salt = (5) - (4)
Page 79

Calculations (Continued)
Theoretical percent of salt The following formula for the percent of salt may be helpful.
grams salt (in the initial mixture) Percent salt = ----------------------------------------- x 100 %
mass of the initial mixture
Experimental percent of salt The following formula for the percent of salt may be helpful.
grams salt (found experimentally) Percent salt = ----------------------------------------- x 100 %
mass of the initial mixture
Experimental error in the determination of the percent of salt The following formula for the percent error may be helpful.
⏐theoretical percent of salt - experimental percent of salt⏐
Percent error = ------------------------------------------------------------------- x 100 % theoretical percent of salt
Page 80

Results
Theoretical percent of salt _________________ % salt
Experimental percent of salt _________________ % salt
Experimental error _________________ %
Page 81

Part 2 - Analysis of a Unknown Mixture of Salt and Sand
1. Heat an empty evaporating dish and watch glass for five minutes on a hot plate or over a Bunsen burner flame. Remove the evaporating dish and watch glass from the hot plate (use tongs) or turn off the burner flame and allow the evaporating dish and watch glass to cool. While you are waiting for the evaporating dish and watch glass to cool, you can continue with Steps 2 - 7.
2. Weigh an empty 100 mL beaker and record the mass in the data section.
3. Add your entire unknown mixture containing salt and sand to the beaker. Record the mass of the beaker plus the unknown in the data table.
4. Add approximately 15 mL of water to the salt/sand mixture in the beaker and stir.The salt will dissolve, but the sand will not.
5. Allow the sand to settle to the bottom of the beaker.
6. Weigh the evaporating dish and watch glass (which was set aside in Step 1) andrecord your mass in the data section.
7. Pour the solution in the beaker (which contains dissolved salt) through a funnelwhich has been fitted with filter paper. Collect the filtrate (the liquid portion) in theevaporating dish.
8. Add another 15 ml of water to the beaker and stir to dissolve any remaining salt.Pour this solution through the filter paper into the evaporating dish.
9. After the solution has completely drained from the filter paper, use a wash bottle torinse the filter paper with an additional 10 mL of water.
10. Heat the evaporating dish (covered with a watch glass) on a hot plate or over aBunsen burner flame. Heat slowly at first to avoid boil over or splattering. Oncethe solution has boiled dry, heat intensely to remove ALL of the water.
11. Allow the evaporating dish and watch glass combination (which now contains thesalt from the mixture) to cool to room temperature. Record the mass in the datasection.
12. You can now determine the percent of salt. Show this calculation in the spaceprovided in the calculation section.
13. Record the percent salt in your unknown mixture in the results section and on theReport Sheet.
Page 82
Data
(1) Mass of empty beaker _________________ g
(2) Mass of beaker + unknown mixture _________________ g
(3) Mass of empty evaporating dish + watch glass _________________ g
(4) Mass of evaporating dish, watch glass + salt _________________ g
Calculations
Determine the mass of the unknown mixture. Mass of mixture = (2) - (1)
Determine the mass of salt in the unknown mixture. Mass of salt = (4) - (3)
Determine the percent of salt in the unknown mixture.
grams salt (in the unknown mixture) Percent salt = --------------------------------------------- x 100 %
mass of the unknown mixture
Results
Percent of salt _________________ % salt Page 82
Page 83
Experiment 5Determination of the Percent of
NaCl in a Mixture by Filtration Lab
Report Sheet
Name_________________________ Date____________________
Unknown number ____________________
Percent of Salt _______________________
Page 84
Experiment 6Identification of an Anion in a Salt Lab
Name_________________________ Date____________________
LEARNING OBJECTIVES
To apply concepts covered in lecture to understand the chemistry of common ionsTo reinforce the concepts of solubility, oxidation-reduction reactions, and double displacement reactionsTo identify an unknown anion by comparing tests performed on knowns
APPARATUS
7 Small tests tubes1 Test tube rackSpatulas for known salt containers10 mL Graduated cylinderTest tube clamp
MATERIALS
6 small vials containing either NaNO2 or KNO26 small vials containing either NaNO3 or KNO36 small vials containing either Na2CO3 or K2CO36 small vials containing either Na2SO3 or K2SO36 small vials containing either Na2SO4 or K2SO46 small vials containing either Na3PO4 or K3PO4
6 dropper bottles containing 5 M H2SO4 solution6 dropper bottles containing 0.1 M AgNO3 solution6 dropper bottles containing 3 M H2SO4/0.1 M KMnO4 solution6 dropper bottles containing 0.1 M BaCl2 solution
Individual unknowns in labeled test tubes or vials for each student
Distilled water
Page 85
INTRODUCTION
Salts are compounds composed of positively charged cations and negatively charged anions. In this lab we will investigate the chemistry of some of the more common anions. The anions to be studied are NO21-, NO31-, CO32-, SO32-, SO42-, and PO43-. These are provided as either potassium or sodium salts.
In order to determine the identity of the anion in an unknown salt, we will perform tests on known salts and compare the results to the unknown salt. We will look at three types of reactions in this experiment:
Reaction with a H2SO4 solution can result in an oxidation-reduction reaction or a gas evolution reaction.
Sulfuric acid is a good oxidizing agent and will easily oxidize many substances.
Sulfuric acid will also react with certain salts to produce a gas due to a double displacement reaction.
Oxidation-reduction reactions with acidic KMnO4 solution will also be used in this experiment to help identify the unknown anion.
A potassium permanganate solution is purple. When KMnO4 undergoes an oxidation reduction reaction, the KMnO4 is converted to the near colorless Mn2+ ion. Therefore the disappearance of the purple color indicates that an oxidation-reduction reaction has occurred. A reaction will only occur for those anions which are easily oxidized. Many polyatomic ions are easily oxidized if the atom bound to the oxygen is in an oxidation state lower than its maximum oxidation state. The maximum oxidation state is equal to the group number (using the older Group A/Group B system). For example, the maximum oxidation state for sulfur is +6.
The formation of a precipitate or the lack of precipitate formation will also be used to help determine the identity of the anion contained in the unknown. The reaction of a BaCl2 solution and a AgNO3 solution with a solution of the known salts and the unknown salt will be performed.
The solubility rules can also help us determine the identity of our unknown anion since precipitate formation is dictated by the solubility rules.
Page 86
Before we discuss the reactions utilized in this experiment, let’s look at the chemistry of some of the anions to be studied.
Oxidation-reduction Chemistry for Selected Ions
NO21- - the nitrite ion can be oxidized by some oxidizing agents to NO2. Remember that oxidation is an increase in oxidation number. Notice that the oxidation number of nitrogen increases from +3 to +4 when the NO21- ion is converted to NO2 gas. Nitrogen dioxide is an orange-brown gas with a distinct odor. Therefore when the reaction with an oxidizing agent results in the formation of this gas, the presence of the NO21- ion is indicated.
Acidic solutions of KMnO4 will oxidize the NO21- ion to the NO31- ion. Therefore the NO2 gas may not be produced. The oxidation-reduction reaction is indicated by the disappearance of the purple color.
SO32- - the sulfite ion can be oxidized by strong oxidizing agents to SO42-. Remember that oxidation is an increase in oxidation number. Notice that the oxidation number of sulfur increases from +4 to +6 when the SO32- ion is converted to the SO42- ion. The sulfate ion has no unique characteristic odor or color. Therefore a change must occur in the oxidizing agent if thisoxidation-reduction reaction is to be used to indicate the presence of the sulfite ion. Sulfuric acid will not oxidize the sulfite ion.
Reactions With Acids for Selected Ions
CO32- - the carbonate ion reacts with acids to produce CO2 gas. Carbon dioxide is a colorless, odorless gas. Therefore when the reaction with an acid results in the formation of a colorless, odorless gas, the presence of the CO32- ion is often indicated.
SO32- - the sulfite ion reacts with acids to produce SO2 gas. Sulfur dioxide is a gas that produces a burning sensation when inhaled. Therefore when the reaction with an acid results in the formation of this gas, the presence of the SO32- ion is indicated.
Page 87
Reactions With the Four Reagents Used in the Experiment
Reaction with 5 M H2SO4 solution
In this experiment, sulfuric acid will react with the known salts (and your unknown) in one of two ways.
If the anion in the salt is easily oxidized, an oxidation-reduction reaction will occur. The nitrite ion (NO21-) is easily oxidized to either nitrogen dioxide gas (NO2) or to the nitrate ion (NO31-). Although the sulfite ion (SO32-) can also be oxidized, it will not undergo an oxidation-reduction reaction with sulfuric acid.
The other reaction that will be studied is the evolution of a gas produced by the double displacement reaction followed by the decomposition of an unstable acid that is formed. When the carbonate ion (CO32-) reacts with an acid, carbonic acid (H2CO3) is produced. This acid is unstable and decomposes to produce carbon dioxide gas (CO2) and water.When the sulfite ion (SO32-) reacts with an acid, sulfurous acid (H2SO3) is produced. This acid is unstable and decomposes to produce sulfur dioxide gas (SO2) and water.
Reaction with Acidic KMnO4 solution
An acidic potassium permanganate solution is a very good oxidizing agent. Solutions of potassium permanganate are purple. When they oxidize other substances, the permanganate
ion (MnO41-) is converted to the manganese(II) ion (Mn2+). A positive test for an oxidation-reduction reaction is the disappearance of the purple color.
Reaction with BaCl2 and AgNO3 solutions
Since many silver salts and barium salts are insoluble, we can react solutions of silver nitrate (AgNO3) and barium chloride (BaCl2) with solutions of our known salts and our unknown salt. The solubility rules can be used to determine the identity of the precipitate formed.
These double displacement reactions are very useful since the formation of a precipitate is easily detected. When the solution turns cloudy, this is evidence of precipitate formation. If the solution is allowed to set undisturbed or is placed in a centrifuge, the precipitate will form and the resulting solution will be clear.
Page 88
EXPERIMENTAL PROCEDURE
Procedure A and Procedure B need not be performed in order. In order to wisely use your lab time, choose the procedure that is available.
Procedure A Reaction with 5 M H2SO4 solution
1. Label your test tubes and place them in a test tube rack. Take your test tube rack to the chemical dispensing area and place a pea-sized amount of each known salt in a separate test tube. Add your unknown to another test tube.
2. Take the dropper bottle containing the H2SO4 back to your desk. Using a test tube clamp, tilt each test tube to about a 45o angle. Slowly add 10 drops of 5 M H2SO4 solution by allowing it to run down the side of each test tube onto the salt.
3. If a gas is produced, gently smell the gas.
4. Record your observations in the table in the data section.
5. Return the dropper bottle. Empty you test tubes into the waste container designated by your instructor. Rinse your test tube with water to remove any remaining materials and then rinse with distilled water since the presence of ions may result in errors in the following steps.
Page 89
Procedure B Preparation of salt solutions and the reaction with a KMnO4 solution, a BaCl2 solution, and a AgNO3 solution.
Part 1 Preparation of solutions of the known and unknown salts and reaction with a KMnO4 solution
1. Label your test tubes and place them in a test tube rack. Take your test tube rack to the chemical dispensing area and place a pea-sized amount of each known salt and your unknown into separate test tubes. Be careful not to use too much of the salt.
2. Take the test tube rack back to your lab bench and add approximately 1.5 milliliters of water to each test tube. Since the presence of other ions may give false results, use distilled water to prepare these solutions.
3. You may need to swirl the test tubes or use a stirring rod to get the salts to dissolve completely.
4. Take the dropper bottle containing the KMnO4 back to your desk and add 10 drops of KMnO4 solution to each test tube.
5. Record your observations in the table in the data section.
6. Return the dropper bottle. Empty your test tubes into the waste container designated by your instructor. Rinse your test tubes with water to remove any remaining materials and then rinse with distilled water since the presence of ions may result in errors in the following steps.
Page 90
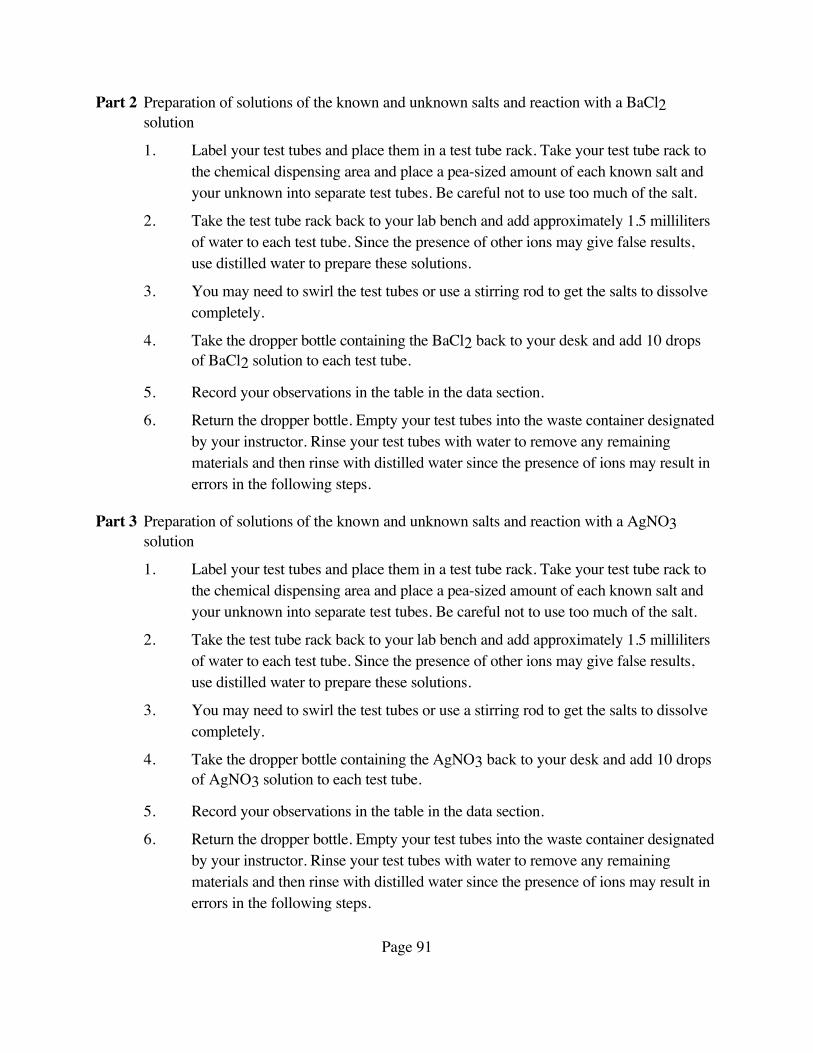
Part 2 Preparation of solutions of the known and unknown salts and reaction with a BaCl2 solution
1. Label your test tubes and place them in a test tube rack. Take your test tube rack to the chemical dispensing area and place a pea-sized amount of each known salt and your unknown into separate test tubes. Be careful not to use too much of the salt.
2. Take the test tube rack back to your lab bench and add approximately 1.5 milliliters of water to each test tube. Since the presence of other ions may give false results, use distilled water to prepare these solutions.
3. You may need to swirl the test tubes or use a stirring rod to get the salts to dissolve completely.
4. Take the dropper bottle containing the BaCl2 back to your desk and add 10 drops of BaCl2 solution to each test tube.
5. Record your observations in the table in the data section.
6. Return the dropper bottle. Empty your test tubes into the waste container designated by your instructor. Rinse your test tubes with water to remove any remaining materials and then rinse with distilled water since the presence of ions may result in errors in the following steps.
Part 3 Preparation of solutions of the known and unknown salts and reaction with a AgNO3 solution
1. Label your test tubes and place them in a test tube rack. Take your test tube rack to the chemical dispensing area and place a pea-sized amount of each known salt and your unknown into separate test tubes. Be careful not to use too much of the salt.
2. Take the test tube rack back to your lab bench and add approximately 1.5 milliliters of water to each test tube. Since the presence of other ions may give false results, use distilled water to prepare these solutions.
3. You may need to swirl the test tubes or use a stirring rod to get the salts to dissolve completely.
4. Take the dropper bottle containing the AgNO3 back to your desk and add 10 drops of AgNO3 solution to each test tube.
5. Record your observations in the table in the data section.
6. Return the dropper bottle. Empty your test tubes into the waste container designated by your instructor. Rinse your test tubes with water to remove any remaining materials and then rinse with distilled water since the presence of ions may result in errors in the following steps.
Page 91
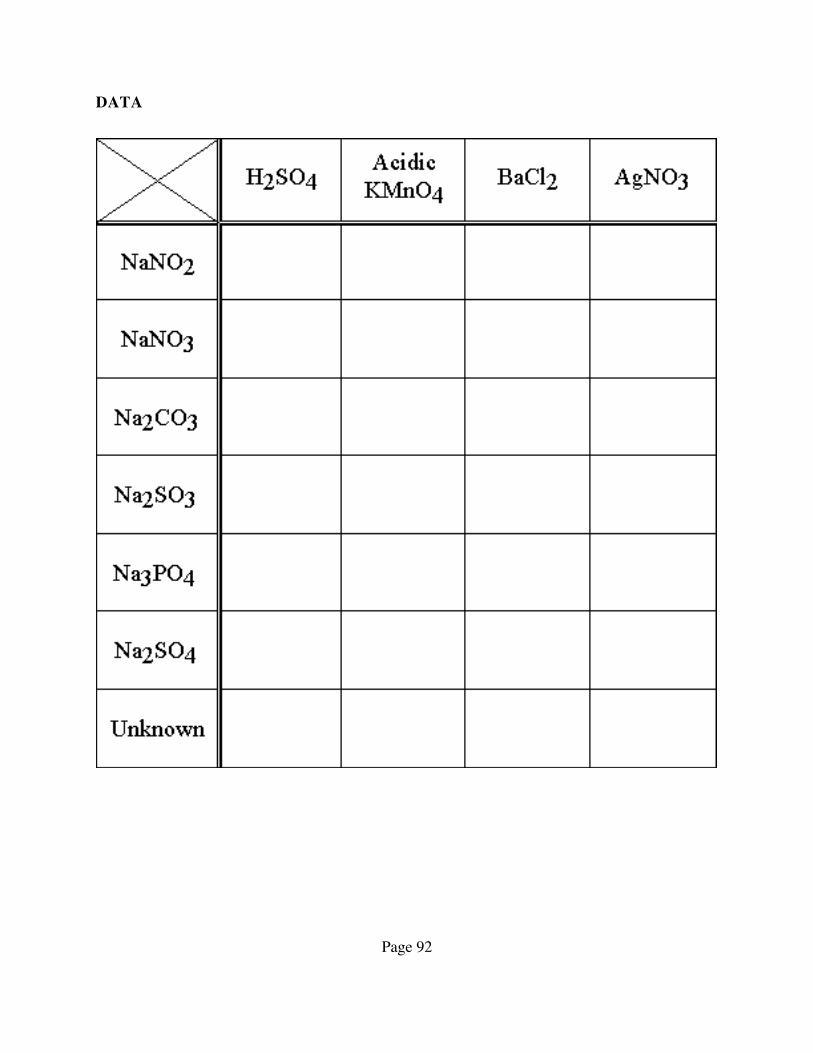
DATA
Page 92

RESULTS
Based upon the observations in the data table, identify the anion contained in your unknown.
Unknown number ____________________
Anion present ________________________
DISCUSSION
1. Write balanced equations for the two reactions of sulfuric acid with the salts that produced colorless gases. Circle the gases produced.
2. When the sulfuric acid solution was reacted with the salts, one of the reactions produced a brownish gas. Determine the oxidation number for each of the atoms in the salt.
3. When the potassium permanganate solution was reacted with the salts, two oxidation-reduction reactions occur as indicated by the disappearance of the purple color. Determine the oxidation number for each of the atoms in these salts.
Page 93
DISCUSSION (Continued)
4. Write balanced equations for the reactions of barium chloride with the salts that produced precipitates. Underline the precipitates produced.
5. Write balanced equations for the reactions of silver nitrate with the salts that produced precipitates. Underline the precipitates produced.
Page 94

Experiment 6Identification of an Anion in a Salt Lab
Report Sheet
Name_________________________ Date____________________
Unknown number ____________________
Anion present ________________________
Page 95

Intentional left blank
Page 96

Experiment 7Determination of the Percentof a Hydrate in a Mixture Lab
Name_________________________ Date____________________
LEARNING OBJECTIVES
To learn the method for determining the the number of attached water molecules in a hydrated moleculeTo learn the correct use of a laboratory balance, a Bunsen burner and the equipment needed to heat a sample using the burnerTo emphasize the use of significant figures in calculations To work problems dealing with percent composition
APPARATUS
Balance (1 per student)Crucible without lid (1 per student)Ring stand (1 per student)Iron ring (1 per student)Clay triangle (1 per student)Bunsen burner (1 per student)Crucibles (2 per student)
MATERIALS
MgSO4 . 7 H2O (5 grams per student)
Unknown mixture containing MgSO4 . 7 H2O and NaCl (1 vial per student)
Page 97

PRELAB DISCUSSION
In this experiment, you are to experimentally determine the percent of water and the number of attached water molecules in magnesium sulfate heptahydrate (MgSO4 . 7 H2O). This compoundis a hydrate. Hydrates are compounds which have water molecules attached in the crystal lattice. The water molecules are actually part of the formula. Upon heating or treating with a desiccating agent, these hydrates can lose their waters of hydration. MgSO4 . 7 H2O is a crystalline material. Upon heating, it is converted to the anhydrous (without water) form, MgSO4 according to the following equation.
MgSO4 . 7 H2O (s) MgSO4 (s) + 7 H2O (g)
MgSO4 is a white granular solid. The water is lost as steam. This change in appearance makes it easy to determine when the reaction has gone to completion. The experimental percent of water in the hydrate is calculated using the following formula.
mass of water in hydrate Experimental percent of water = ------------------------------- x 100 %
mass of hydrate
mass of hydrate - mass of anhydrous compound Experimental percent of water = ---------------------------------------------------------- x 100 %
mass of hydrate
Once you have experimentally determined the percent of water in the hydrate, you will determine the percent error in your results. Percent error is given by the following formula.
| calculated value - experimental value | Percent error = ------------------------------------------------ x 100 %
calculated value
Notice that this formula contains an absolute value sign. This is necessary since percent error is always reported as a positive value.
While determining the percent water in the compound, you will obtain a conversion factor relating the mass of water to the mass of the compound. You will utilize this conversion factor to allow you to determine the percent of magnesium sulfate heptahydrate in a mixture.
Page 98
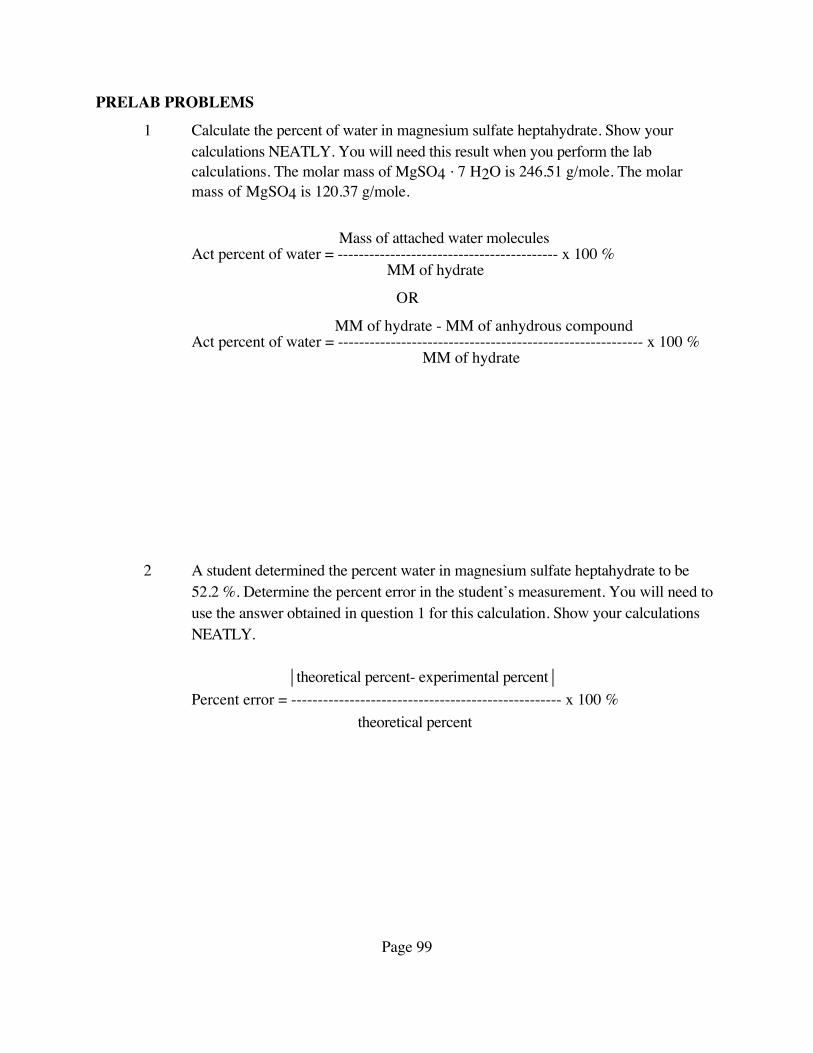
PRELAB PROBLEMS
1 Calculate the percent of water in magnesium sulfate heptahydrate. Show your calculations NEATLY. You will need this result when you perform the lab calculations. The molar mass of MgSO4 . 7 H2O is 246.51 g/mole. The molar mass of MgSO4 is 120.37 g/mole.
Mass of attached water molecules Act percent of water = ------------------------------------------ x 100 %
MM of hydrate
OR
MM of hydrate - MM of anhydrous compound Act percent of water = ---------------------------------------------------------- x 100 %
MM of hydrate
2 A student determined the percent water in magnesium sulfate heptahydrate to be 52.2 %. Determine the percent error in the student’s measurement. You will need to use the answer obtained in question 1 for this calculation. Show your calculations NEATLY.
⏐theoretical percent- experimental percent⏐
Percent error = --------------------------------------------------- x 100 % theoretical percent
Page 99
EXPERIMENTAL
Part A (Determining the percent waterin magnesium sulfate heptahydrate)
Procedure
Preheating of the crucible
1. Place a clean dry crucible on a clay triangle and heat over a flame for 5 minutes. The purpose of this heating is to remove any volatile material. This is imperative since the volatile material would be removed in a later step. REMEMBER: You must pretreat the crucible just as it will be treated in the experiment.
2. Remove the crucible and allow to return to room temperature. To determine if the crucible is cool, place your hand close to the crucible. DO NOT TOUCH!!! If the air around the crucible is warm, the crucible is not cool.Once you feel that the crucible is cool, touch it gently. If it is cool to the touch, proceed to step 3.
3. When the crucible is cool to room temperature, determine its mass and record the mass in the data section.
NOTE: Preheating the crucible can be done ahead of time if your labperiod is short. If so, store the crucibles in a desiccator until used.
Dehydrating the hydrate
1. Add approximately 3 grams of magnesium sulfate heptahydrate to your crucible and record the mass in the data section.
2. Heat the crucible and its contents over a low flame. Heat slowly at first. Slowly increase the intensity of the flame until the crucible is glowing red hot. Heat strongly for 10 additional minutes.
3. Allow the crucible to cool to room temperature and determine the mass of the crucible and the anhydrous magnesium sulfate it now contains. Record the mass in the data table.
4. Perform the calculations and complete the results section.
Page 100
Data
Mass of empty crucible _________________ g
Mass of crucible + hydrate (MgSO4 . 7 H2O) _________________ g
Mass of crucible + anhydrous compound (MgSO4) _________________ g
Calculations
Mass of MgSO4 . 7 H2O
Mass of H2O lost
Determine the experimental percent of water in MgSO4 . 7 H2O.
mass of water lost Exp percent of water = ------------------------ x 100 %
mass of hydrate
Determine the percent error in your experimental percent of water. Be careful with significant digits. You calculated the theoretical percent in the prelab problems.
⏐theoretical percent- experimental percent⏐ Percent error = --------------------------------------------------- x 100 %
theoretical percent
Page 101
Results
Percent water in MgSO4 . 7 H2O _________________ g
Percent error _________________ %
Conversion factor relating the mass of H2O lost and the mass of MgSO4 . 7 H2O
____________ g H2O lost = ____________ g MgSO4 . 7 H2O
Discussion
1. You need to add a certain amount of magnesium ions to a solution. If the preparation required 5 grams of the hydrated salt, would you need more or less of the anhydrous
salt? Explain.
2. If you were designing this experiment, what, if anything, would you have done differently? This includes both the actual experimental procedure and the lab handout. Be specific.
3. Propose one more prelab question.
Page 102

Part B (Determining the percent magnesiumsulfate heptahydrate in an unknown mixture)
Procedure
Preheating of the crucible
1. Place a clean dry crucible on a clay triangle and heat over a flame for 5 minutes. The purpose of this heating is to remove any volatile material. This is imperative since the volatile material would be removed in a later step. REMEMBER: You must pretreat the crucible just as it will be treated in the experiment.
2. Remove the crucible and allow to return to room temperature. To determine if the crucible is cool, place your hand close to the crucible. DO NOT TOUCH!!! If the air around the crucible is warm, the crucible is not cool. Once you feel that the crucible is cool, touch it gently. If it is cool to the touch, proceed to step 3.
3. When the crucible is cool to room temperature, determine its mass and record the mass in the data section.
NOTE: This section can be done ahead of time if your lab period is short. If so, store the crucibles in a desiccator until used.
Dehydrating the hydrate
1. Add your entire unknown mixture to your crucible and record the mass in the data section.
2. Heat the crucible and its contents over a low flame. Heat slowly at first. Slowly increase the intensity of the flame until the crucible is glowing red hot. Heat strongly for 10 additional minutes.
3. Allow the crucible to cool to room temperature and determine the mass of the crucible and the resulting mixture it now contains. Record the mass in the data table.
Page 103

Data
Mass of empty crucible _________________ g
Mass of crucible + unknown mixture _________________ g
Mass of crucible + mixture after heating _________________ g
Calculations
Mass of unknown mixture before heating _________________ g
Mass of mixture after heating _________________ g
Mass of water lost _________________ g
Since the only component of the mixture that will lose water when heated is the hydrated compound (MgSO4 . 7 H2O), you can use the mass of the water lost to calculate the massof MgSO4 . 7 H2O in the original mixture. Show this calculation here. You have already calculated a conversion factor that relates the mass of the water lost to the mass of the hydrate contained in the unknown mixture. Record the mass of MgSO4 . 7 H2O in the unknown mixture in the results section and on the Report Sheet.
Page 104
Calculations (continued)
You can now determine the percent of MgSO4 . 7 H2O in the unknown mixture using thefollowing formula. Determine the percent of MgSO4 . 7 H2O in the unknown mixture and record this value in the results section and on the Report Sheet.
mass MgSO4 . 7 H2OPercent of MgSO4 . 7 H2O = ------------------------------ x 100 %
mass unknown mixture
Results
Mass of MgSO4 . 7 H2O in the unknown mixture _____________ g
Percent of MgSO4 . 7 H2O in the unknown mixture _____________ %
Page 105
Experiment 7Determination of the Percent
of a Hydrate in a Mixture Lab
Report Sheet
Name_________________________ Date____________________
Unknown number ____________________
Mass of MgSO4 . 7 H2O in the unknown mixture _____________ g
Percent of MgSO4 . 7 H2O in the unknown mixture _____________ %
Page 106

Experiment 8Solution Preparation and the Determination of
the Molarity by Plotting a Standard Curve
Name_________________________ Date____________________
LEARNING OBJECTIVES
To apply concepts covered in lecture to understand the preparation of a solutionTo reinforce the concepts of solution preparation starting with pure solute and solvent and solution preparation by dilution (including serial dilution)To graphically plot the density of a solution versus its concentration
APPARATUS
Spatula for NaCl10 mL Graduated cylinder100 mL Graduated cylinder25 mL Volumetric flask (if available)Various beakers10 mL pipetPipet bulbEye dropper
MATERIALS
NaCl5.0 M HCl solutionpH Hydion paperDistilled water
Page 107
PRELAB QUESTIONS
1 Starting with pure NaCl and water, describe how you would prepare 25.00 mL of a NaCl solution? Assume you know how much NaCl you need to weigh on the balance.
2 Starting with a concentrated NaCl solution, describe how you would prepare 25.00 mL of a more dilute NaCl solution. Assume you know the volume of the more concentrated NaCl
needed.
3 Explain the principles behind a serial dilution and when is a serial dilution usually needed?
4 Determine the mass of NaCl needed to prepare 25.00 mL of a 1.585 M NaCl solution.
4 Determine the volume of a 1.585 M NaCl solution needed to prepare 25.00 mL of a 0.372 M solution.
Page 108
PRELAB PROBLEMS
1 Determine the mass of NaCl needed to prepare 25.00 mL of a 1.585 M NaCl solution.
2 Determine the volume of a 1.585 M NaCl solution needed to prepare 25.00 mL of a 0.372 M solution.
3 Determine the mass of NaCl needed to prepare 25.00 mL of a 16.62 wt/vol % NaCl solution.
4 Determine the volume of a 16.62 wt/vol % NaCl solution needed to prepare 25.00 mL of a 6.028 wt/vol % NaCl solution.
5 If the density of a 5.00 M NaCl solution is 1.0340 g/mL, determine the mass of NaCl needed to prepare 25.00 mL of this solution.
6 If the density of a 29.7175 wt/vol % NaCl solution is 1.1887 g/mL, determine the mass of NaCl needed to prepare 25.00 mL of this solution.
Page 109
INTRODUCTION
Solution preparation is a skill that is useful not only to chemists, but to anyone who works with chemicals. Often the ability to prepare a solution separates those who can work effectively in the lab and those who can’t. For these reasons, we will learn to prepare solutions by the three most common methods utilized in the lab.
There are three methods of solution preparation that will be covered in this lab: preparing a solution starting with pure solute and pure solvent, diluting a solution at one concentration to prepare a solution at another concentration, and performing a serial dilution to prepare solutions over a wide concentration range.
Starting With Pure Solute and Pure SolventSolutions can be prepared starting with pure solute and pure solvent. In this experiment, we will be preparing sodium chloride solutions starting with solid sodium chloride. The solvent in this preparation is water.
Diluting a SolutionA solution can also be made by diluting a solution and adding more solvent. In this experiment, we will be diluting the solution prepared starting with pure solute and pure solvent to prepare a new solution of a different concentration.
Serial DilutionA serial dilution is often used when solutions of a wide range of concentrations are needed. In this experiment, you will prepare solutions of hydrochloric acid starting with 5.0 M HCl and performing a serial dilution.
Page 110

EXPERIMENTAL PROCEDUREProcedure A and Procedure B need not be performed in order. In order to wisely use your lab time, choose the procedure that is available. For example, if all of the balances are being used, you may want to perform Procedure B first.
I will intentionally be vague with the instructions for preparing the following solutions and determining the densities. You may want to write your own procedures prior to coming to lab.
Procedure A
1. Preparation of NaCl solutions Your lab instructor will assign you a solution set to prepare from the list of solutions listed in the Data section.
2. Determine the density of water and record it in the Data and Calculations section under Procedure A2. You will need to know the mass of your empty volumetric cylinder and the mass of your volumetric cylinder after it has been filled with 25.00 mL of water.
3. Prepare 25.00 mL of the first solution give to you by your instructor starting with solid NaCl and water. You will first need to determine the mass of NaCl that must be used. Show your calculations in the Data and Calculations section under Procedure A3. Determine the density of the solution and record it in the Data and Calculations section under Procedure A3. Again, you will need to know the mass of your empty volumetric cylinder and the mass of your volumetric cylinder after it has been filled with 25.00 mL of solution.
4. Once you have determined the density of the first NaCl solution, you will use a portion of that solution to prepare 25.00 mL of the second NaCl solution listed in the solution set assigned to you. You will do this by dilution. You will first need to determine the volume of the first NaCl solution that must be used. Show your calculations in the Data and Calculations section under Procedure A4. Determine the density of the solution and record it in the Data and Calculations section under Procedure A4. Again, you will need to know the mass of your empty volumetric cylinder and the mass of your volumetric cylinder after it has been filled with 25.00 mL of solution.
5. Add your data to the table on the board and copy your data and the other student data into your data table so that you can plot to your graphs.
6. Plot a graph of density vs M and another graph of density vs wt/vol percent. These graphs should be plotted in landscape mode with density plotted on the y-axis.
Page 111
Procedure B
Serial dilution of an HCl solution
1. Add approximately 20 mL of the 5.0 M HCl solution to a small beaker. You will use this solution to prepare the solutions listed in the data section (0.5 M, 0.05 M, 0.005 M).
2. Using a 10 mL pipet in conjunction with a 100 mL graduated cylinder, prepare the solutions.
3. Using a stirring rod, transfer a small amount of each solution to a small piece of the pH indicator paper provided. Record the color that the paper turned for each solution in the Data section.
Procedure C
Determine the mass of your unknown NaCl sample
1. Using your entire sample (without weighing it), transfer it to a pre-weighed 25 mL volumetric flask. Prepare your solution as you have before.
2. Determine the density of this solution.
3. Using your graphs, determine the molarity and wt/vol % of your solution.
4. Perform the calculations to determine the mass of NaCl that was in your unknown based on these calculations. Show these calculations on the Unknown Report sheet.
5. Average the two values for the mass of NaCl and record on the Unknown Report sheet.
Page 112
DATA AND CALCULATIONS
Procedure A2 - Determining the density of water
This is where you record your data and show your calculations needed to determine the density of water.
Mass of Empty 25.00 mL Volumetric Flask _______________ g
Mass of 25.00 mL Volumetric Flask + water _______________ g
Mass of 25.00 mL of water _______________ g
D= m/V (Clearly show your calculations below)
Density of water _______________ g/mL
Page 113

DATA AND CALCULATIONS (Continued)
Procedure A3 - Preparation of the solution starting with pure solute and pure solvent
This is where you show the calculations needed to determine the mass of NaCl needed to prepare the first NaCl solution.
Procedure A3 - Determining the density of the solution
This is where you record your data and show your calculations needed to determine the density of the first solution.
Mass of Empty 25.00 mL Volumetric Flask _______________ g
Mass of 25.00 mL Volumetric Flask + solution _______________ g
Mass of 25.00 mL of solution _______________ g
D= m/V (Show your calculations clearly below)
Density of first NaCl solution _______________ g/mL
Page 114
DATA AND CALCULATIONS (Continued)
Procedure A4 - Dilution of the initial solution
This is where you show the calculations needed to determine the volume of the first NaCl solution needed to prepare the second NaCl solution.
Procedure A4 - Determining the density of the solution
This is where you record your data and show your calculations needed to determine the density of the second NaCl solution.
Mass of Empty 25.00 mL Volumetric Flask _______________ g
Mass of 25.00 mL Volumetric Flask + solution _______________ g
Mass of 25.00 mL of solution _______________ g
D= m/V (Show your calculations clearly below)
Density of second NaCl solution _______________ g/mL
Page 115
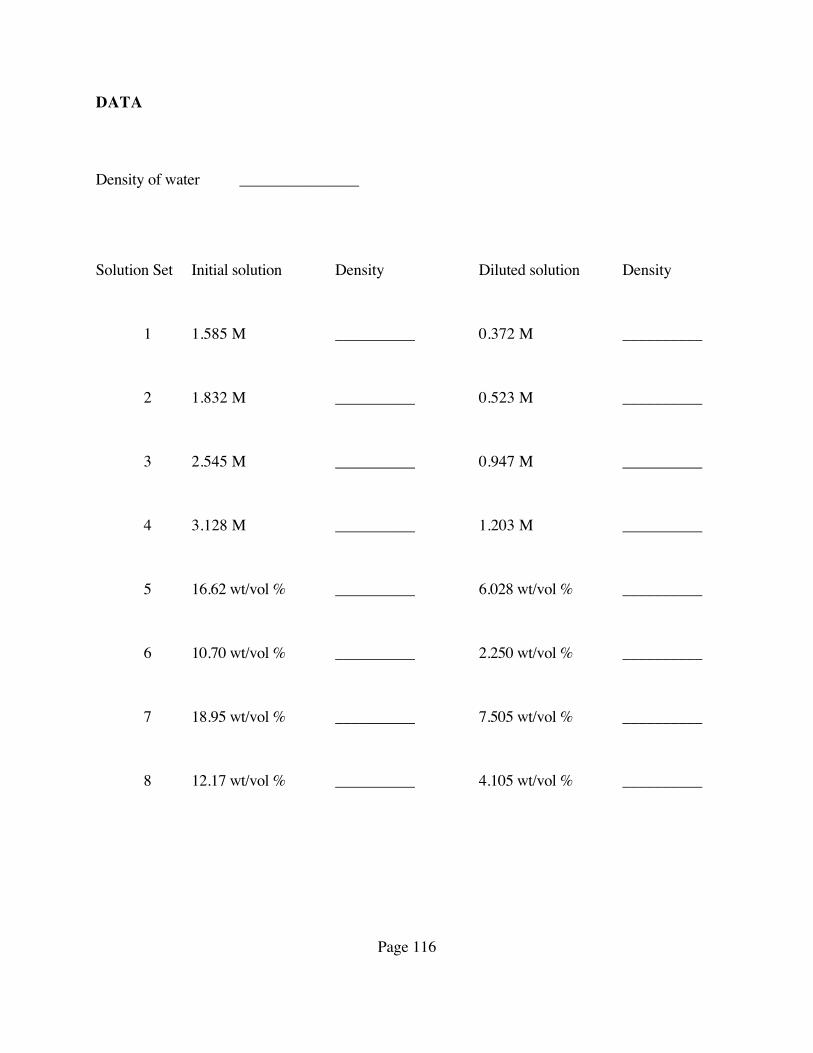
DATA
Density of water _______________
Solution Set Initial solution Density Diluted solution Density
1 1.585 M __________ 0.372 M __________
2 1.832 M __________ 0.523 M __________
3 2.545 M __________ 0.947 M __________
4 3.128 M __________ 1.203 M __________
5 16.62 wt/vol % __________ 6.028 wt/vol % __________
6 10.70 wt/vol % __________ 2.250 wt/vol % __________
7 18.95 wt/vol % __________ 7.505 wt/vol % __________
8 12.17 wt/vol % __________ 4.105 wt/vol % __________
Page 116
DATA (Continued)
Concentration of HCl Color of Indicator Paper
5.0 M ___________________
0.50 M ___________________
0.050 M ___________________
0.0050 M ___________________
Page 117
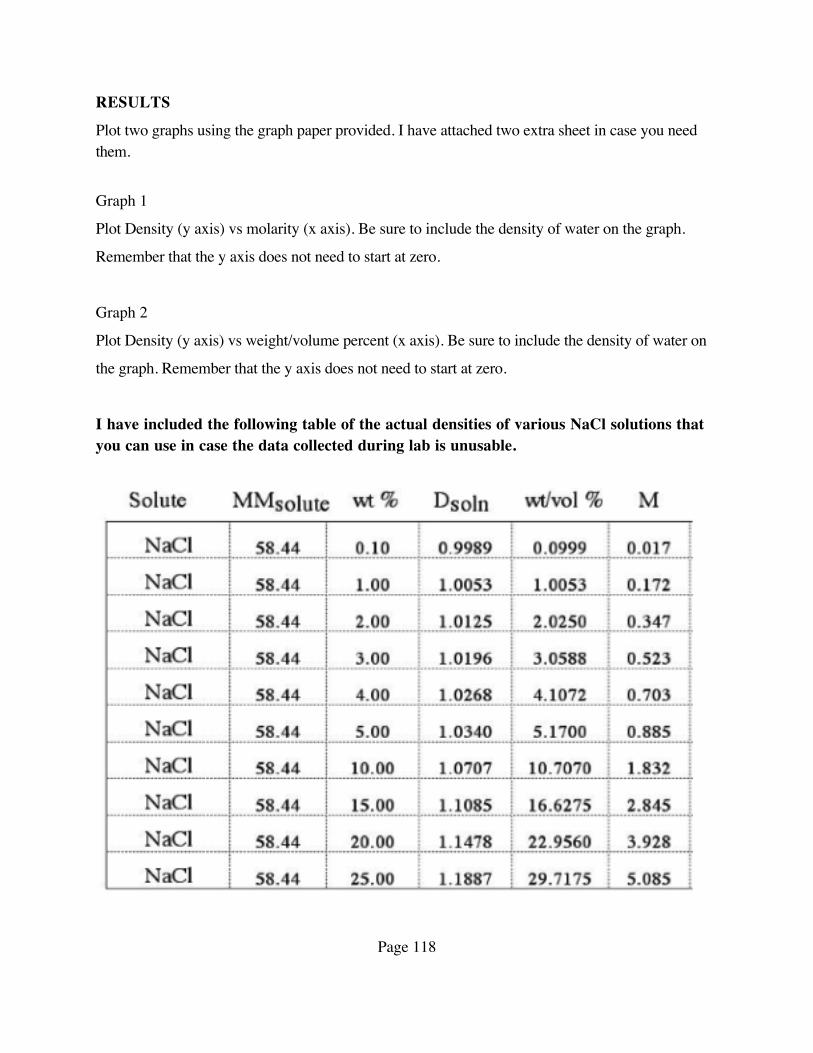
RESULTS
Plot two graphs using the graph paper provided. I have attached two extra sheet in case you need them.
Graph 1
Plot Density (y axis) vs molarity (x axis). Be sure to include the density of water on the graph.
Remember that the y axis does not need to start at zero.
Graph 2
Plot Density (y axis) vs weight/volume percent (x axis). Be sure to include the density of water on
the graph. Remember that the y axis does not need to start at zero.
I have included the following table of the actual densities of various NaCl solutions that you can use in case the data collected during lab is unusable.
Page 118

DISCUSSION
1. From the graphs, what can you say about the relationship between density and concentration?
2. Using the graphs, determine the density of a 7.00 weight/volume NaCl solution.
3. Using the graphs, determine the density of a 1.000 M NaCl solution.
Page 119

Page 120

Page 121

Page 122
Page 123

Experiment 8Solution Preparation and the Determination of the
Molarity by Plotting a Standard Curve Lab
Report SheetName_________________________ Date____________________
Unknown number ____________________
Mass of NaCl __________________ grams
Show the calculation used to determine the density of the solution prepared using your unknown.
Mass of Empty 25.00 mL Volumetric Flask _______________ g
Mass of 25.00 mL Volumetric Flask + solution _______________ g
Mass of 25.00 mL of solution _______________ g
D= m/V (Show your calculations clearly below)
Molarity of your unknown solution (determined from your graph). _______________ M
Show the calculation used to determine the mass of NaCl contained in 25.00 mL of the solution you prepared from your unknown amount of NaCl.
Wt/vol % of your unknown solution (determined from your graph). _______________ wt/vol %
Show the calculation used to determine the mass of NaCl contained in 25.00 mL of the solution you prepared from your unknown amount of NaCl.
Average mass of NaCl (average the two values obtained above) _______________ gPage 124
Experiment 9Determination of the Molarity of a
HC2H3O2 Solution by Titration Lab
Name_________________________ Date____________________
LEARNING OBJECTIVES
To understand the concepts of titration To be able to read and use a buret to perform titrations To understand the use of an indicator (phenolphthalein) To be able to perform solution stoichiometry calculations
APPARATUS
250 mL Erlenmeyer Flask (1 per student)5 mL Pipet (1 per student)25 mL Pipet (1 per student)Pipet bulb (1 per student)100 mL Graduated cylinder (1 per student)50 mL Buret (1 per student)Buret clamp (1 per student)Ring Stand (1 per student)
MATERIALS
0.1 M HCl solution (known to at least 3 decimal places) (75 ml per student) 0.1 M NaOH solution (known to 1 decimal place) (100 mL per student) Phenolphthalein solution (6 dropper bottles) Commercial vinegar solution (15 mL per student)
Page 125
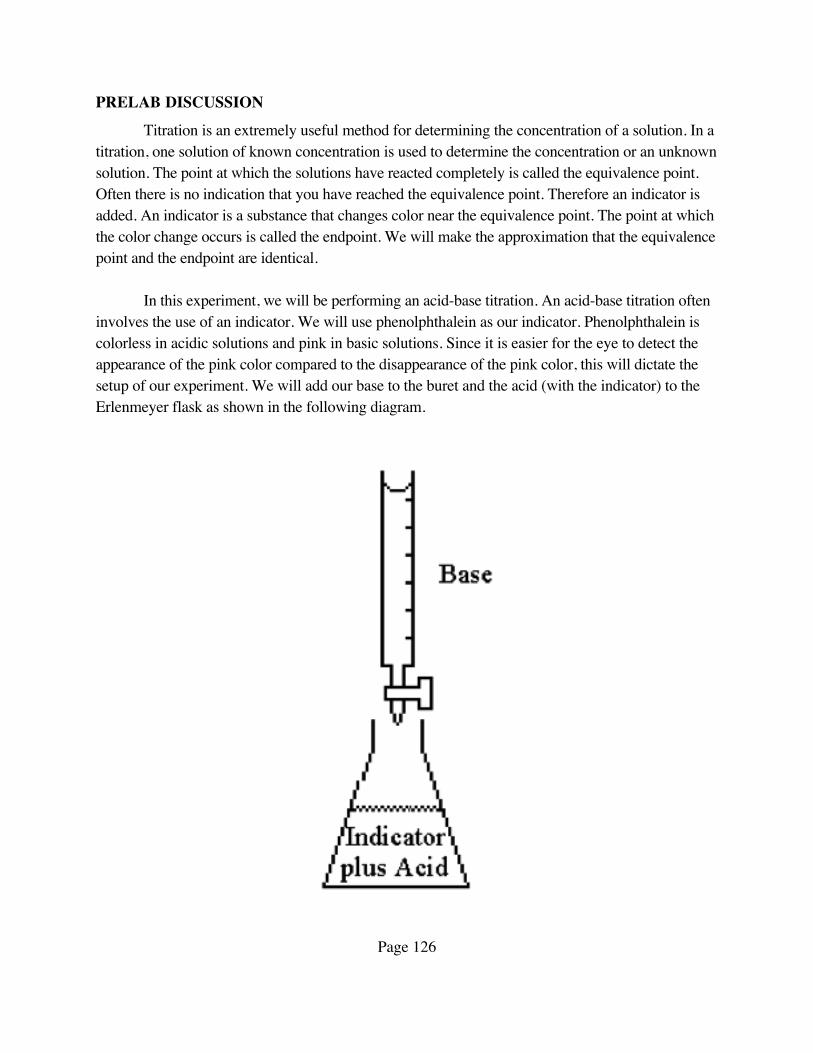
PRELAB DISCUSSION
Titration is an extremely useful method for determining the concentration of a solution. In a titration, one solution of known concentration is used to determine the concentration or an unknown solution. The point at which the solutions have reacted completely is called the equivalence point. Often there is no indication that you have reached the equivalence point. Therefore an indicator is added. An indicator is a substance that changes color near the equivalence point. The point at which the color change occurs is called the endpoint. We will make the approximation that the equivalence point and the endpoint are identical.
In this experiment, we will be performing an acid-base titration. An acid-base titration often involves the use of an indicator. We will use phenolphthalein as our indicator. Phenolphthalein is colorless in acidic solutions and pink in basic solutions. Since it is easier for the eye to detect the appearance of the pink color compared to the disappearance of the pink color, this will dictate the setup of our experiment. We will add our base to the buret and the acid (with the indicator) to the Erlenmeyer flask as shown in the following diagram.
Page 126
In this experiment, we will perform two different titrations. In the first titration, we will be titrating a known HCl solution in order to determine the concentration of a NaOH solution. The concentration of NaOH solutions change over time. Therefore the concentration of the NaOH must be determined prior to using it in other titrations.
Then, knowing the concentration of the NaOH solution, we will perform a second titration to determine the concentration of a commercial vinegar solution (HC2H3O2) solution by titratingthe vinegar solution with the NaOH solution.
After you have finished with the first two titrations you will then determine the concentration of an unknown HCl solution.
Page 127
PRELAB QUESTIONS
1 In this experiment, the NaOH solution is added to the buret. Prior to adding the NaOH to the buret, how should the buret be cleaned?
2 How would you determined the volume of NaOH solution dispensed in a titration reaction?
3 When a titration is performed, the acid and indicator are added to an Erlenmeyer flask? Could a beaker be used instead? What advantage does the Erlenmeyer flask have over a beaker?
Page 128
PRELAB PROBLEMS
1 The molarity of a NaOH solution was determined by titration. When 25.00 mL of 0.1567 M HCl solution was titrated, the titration required 14.54 mL of NaOH solution. Determine the molarity of the NaOH solution.
2 To determine the concentration of an unknown vinegar solution, 5.00 mL of the vinegar (HC2H3O2) solution required 26.78 mL of 0.0968 M NaOH solution to reach the endpoint. Determine the wt/vol percent of the vinegar solution.
Page 129

EXPERIMENTAL
Part 1 (Determination of the molarity of the NaOH solution)
Procedure1. Rinse your buret with the NaOH solution and fill the buret. You do not need to fill
the buret to the 0.00 mL mark, but many students find this useful. Record the initial buret reading in the data section.
2. Using a pipet, add 25.00 mL of the known HCl solution to a 250-mL Erlenmeyer flask. Record the molarity of the HCl solution in the data section.
3. Add approximately 25 mL of distilled water to the Erlenmeyer flask. Add 2-3 drops of the phenolphthalein indicator solution to the Erlenmeyer flask. Do not add more than three drops of the indicator solution.
4. Your lab instructor will demonstrate the proper titration technique.
5. Slowly add the NaOH solution until the solution in the Erlenmeyer flask remains pink for 30 seconds. You are looking for the first tinge of pink, not a bright red solution. Record the final buret reading in the data section.
6. Perform the calculations needed to determine the molarity of the NaOH solution.
7. Wash the Erlenmeyer flask thoroughly and rinse with distilled water.
8. Refill your buret and record the initial buret reading in the data section.
9. Using a pipet, add 25.00 mL of the known HCl solution to a 250-mL Erlenmeyer flask. Add approximately 25 mL of distilled water to the Erlenmeyer flask. Add 2-3 drops of the phenolphthalein indicator solution to the Erlenmeyer flask.
10. Repeat the titration and record the final buret reading in the data section.
11. Perform the calculations needed to determine the molarity of the NaOH solution.
12. If the molarities differ by more than 2 in the second decimal place, you will need to perform a third titration. After performing the titrations, average the molarities for the NaOH solution and record this in the results section.
Page 130
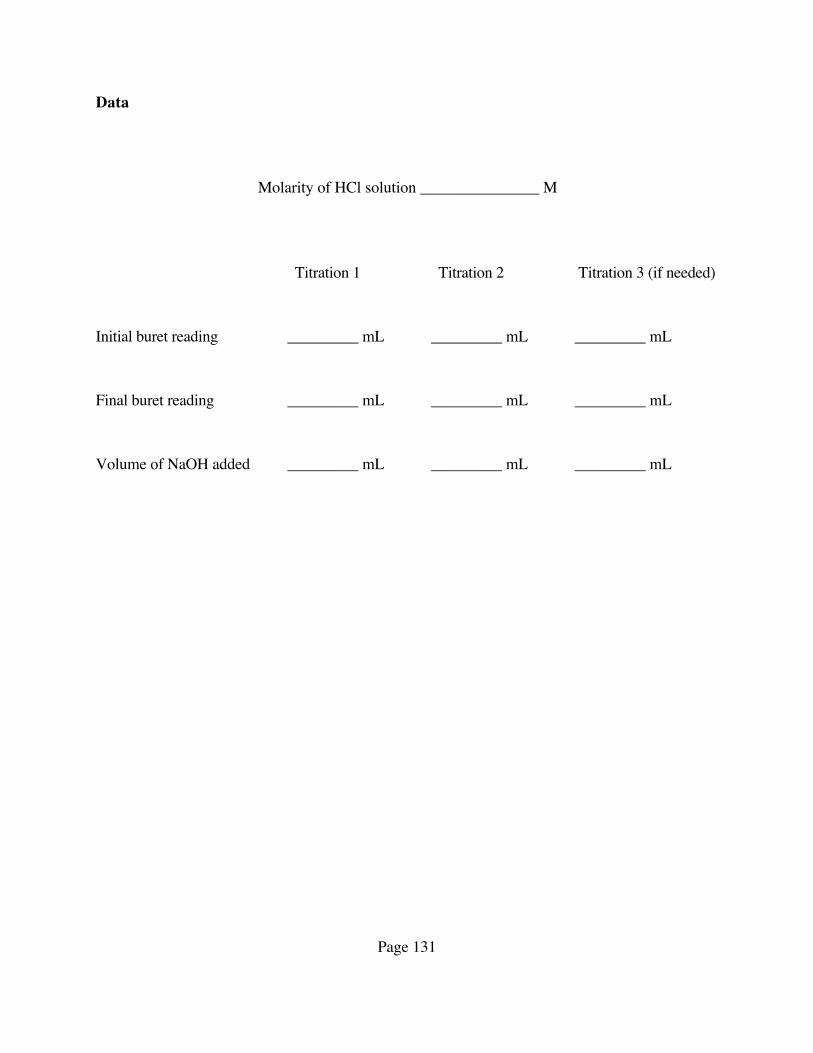
Data
Molarity of HCl solution _______________ M
Titration 1 Titration 2 Titration 3 (if needed)
Initial buret reading _________ mL _________ mL _________ mL
Final buret reading _________ mL _________ mL _________ mL
Volume of NaOH added _________ mL _________ mL _________ mL
Page 131
Calculations
Determination of the molarity of the NaOH solution (First titration)
Determination of the molarity of the NaOH solution (Second titration)
Determination of the molarity of the NaOH solution (Third titration)
Calculation for the average molarity of the NaOH solution
Results
Average molarity of NaOH solution _______________ M
Page 132
Part 2 (Determination of the wt/vol percent of the known vinegar solution)
Procedure
1. Refill the buret. You do not need to fill the buret to the 0.00 mL mark, but many students find this useful. Record the initial buret reading in the data section.
2. Using a pipet, add 5.00 mL of the known vinegar solution to a 250-mL Erlenmeyer flask.
3. Add approximately 25 mL of distilled water to the Erlenmeyer flask. Add 2-3 drops of the phenolphthalein indicator solution to the Erlenmeyer flask. Do not add more than three drops of the indicator solution.
4. Slowly add the NaOH solution until the solution in the Erlenmeyer flask remains pink for 30 seconds. You are looking for the first tinge of pink, not a bright red solution. Record the final buret reading in the data section.
5. Perform the calculations needed to determine the wt/vol percent of the vinegar solution.
6. Wash the Erlenmeyer flask thoroughly and rinse with distilled water.
7. Refill your buret and record the initial buret reading in the data section.
8. Using a pipet, add 5.00 mL of the known vinegar solution to a 250-mL Erlenmeyer flask. Add approximately 25 mL of distilled water to the Erlenmeyer flask. Add 2-3 drops of the phenolphthalein indicator solution to the Erlenmeyer flask.
9. Repeat the titration and record the final buret reading in the data section.
10. Perform the calculations needed to determine the wt/vol percent of the vinegar solution.
11. If the wt/vol percents differ by more than 2 in the first decimal place, you will need to perform a third titration. After performing the titrations, average the wt/vol percents for the vinegar solution and record this in the results section.
Page 133

Data
Titration 1 Titration 2 Titration 3 (if needed)
Initial buret reading _________ mL _________ mL _________ mL
Final buret reading _________ mL _________ mL _________ mL
Volume of NaOH added _________ mL _________ mL _________ mL
Page 134

Calculations
Determination of the wt/vol % of the vinegar (HC2H3O2) solution (First titration)
Determination of the wt/vol % of the vinegar (HC2H3O2) solution (Second titration)
Determination of the wt/vol % of the vinegar (HC2H3O2) solution (Third titration)
Calculation for the average wt/vol % of the vinegar (HC2H3O2) solution
Results
Average wt/vol % of the vinegar solution _______________ %
Page 135

Part 3 (Determination of the wt/vol percent of the unknown HC2H3O2 solution)
Procedure
1. Refill the buret. You do not need to fill the buret to the 0.00 mL mark, but many students find this useful. Record the initial buret reading in the data section.
2. Using a pipet, add 5.00 mL of the unknown HC2H3O2 solution to a 250-mL Erlenmeyer flask.
3. Add approximately 25 mL of distilled water to the Erlenmeyer flask. Add 2-3 drops of the phenolphthalein indicator solution to the Erlenmeyer flask. Do not add more than three drops of the indicator solution.
4. Slowly add the NaOH solution until the solution in the Erlenmeyer flask remains pink for 30 seconds. You are looking for the first tinge of pink, not a bright red solution. Record the final buret reading in the data section.
5. Perform the calculations needed to determine the wt/vol percent of the unknown HC2H3O2 solution.
6. Wash the Erlenmeyer flask thoroughly and rinse with distilled water.
7. Refill your buret and record the initial buret reading in the data section.
8. Using a pipet, add 5.00 mL of the unknown HC2H3O2 solution to a 250-mLErlenmeyer flask. Add approximately 25 mL of distilled water to the Erlenmeyer flask. Add 2-3 drops of the phenolphthalein indicator solution to the Erlenmeyer flask.
9. Repeat the titration and record the final buret reading in the data section.
10. Perform the calculations needed to determine the wt/vol percent of the unknown HC2H3O2 solution.
11. If the wt/vol percents differ by more than 2 in the first decimal place, you will need to perform a third titration. After performing the titrations, average the wt/vol percents for the unknown HC2H3O2 solution and record this in the results section.
12. Complete the Report Sheet.
Page 136
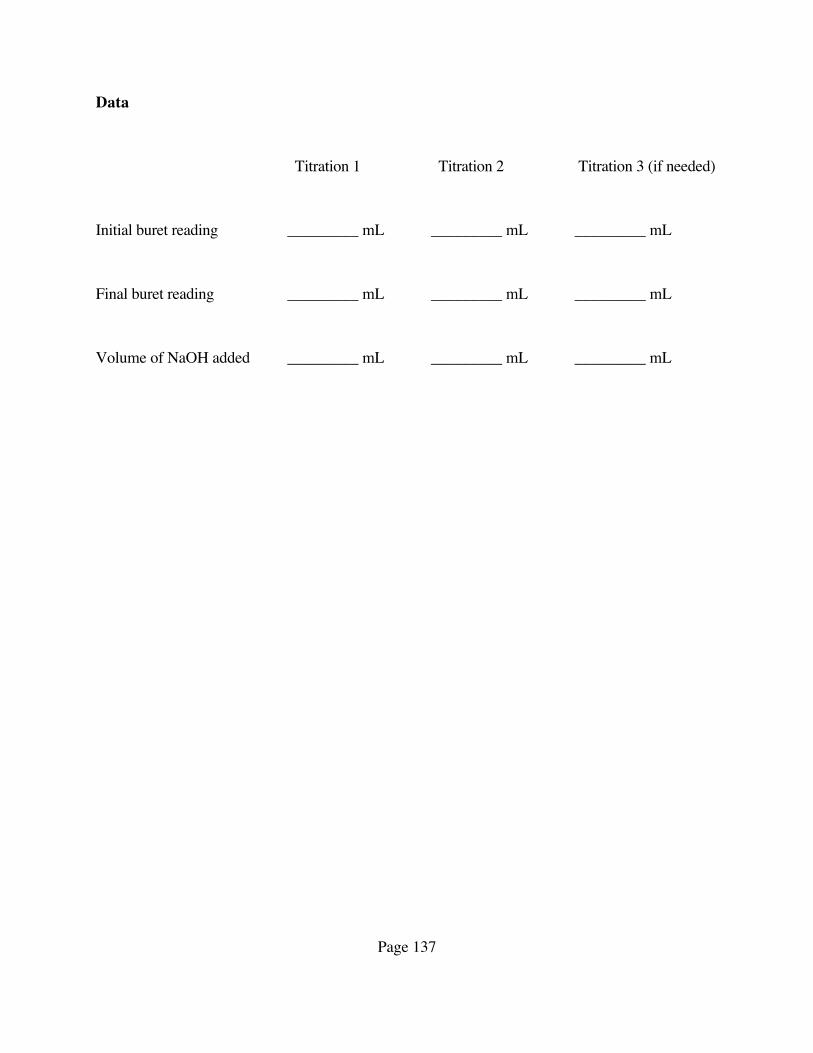
Data
Titration 1 Titration 2 Titration 3 (if needed)
Initial buret reading _________ mL _________ mL _________ mL
Final buret reading _________ mL _________ mL _________ mL
Volume of NaOH added _________ mL _________ mL _________ mL
Page 137
Calculations
Determination of the wt/vol % of the unknown HC2H3O2 solution (First titration)
Determination of the wt/vol % of the unknown HC2H3O2 solution (Second titration)
Determination of the wt/vol % of the unknown HC2H3O2 solution (Third titration)
Calculation for the average wt/vol % of the unknown HC2H3O2 solution
Results
Average wt/vol % of the unknown HC2H3O2 solution _______________ %
Page 138
Experiment 9Determination of the Molarity of a
HC2H3O2 Solution by Titration Lab
Report Sheet
Name_________________________ Date____________________
Unknown Number for Unknown HC2H3O2 Solution ____________________
First Titration
wt/vol % of the unknown HC2H3O2 solution _______________ %
Second Titration
wt/vol % of the unknown HC2H3O2 solution _______________ %
Third Titration
wt/vol % of the unknown HC2H3O2 solution _______________ %
Average wt/vol % of the unknown HC2H3O2 solution _______________ %
Page 139

Intentional left blank
Page 140
Experiment 10Kinetics and Equilibrium Lab
Name_________________________ Date____________________
LEARNING OBJECTIVES
Page 141


