Experiential Learning in Hospitality and Tourism -...
73
Experiential Learning in Hospitality and Tourism – an industry/STR perspective THE-ICE IPoE, Stenden University, Nov 26, 2015 Steve Hood, [email protected] , +1 615 824 8664, ext 3315 Senior VP of Research for STR Global and Founding Director of the SHARE Center
Transcript of Experiential Learning in Hospitality and Tourism -...

Experiential Learning in
Hospitality and Tourism
– an industry/STR perspective
THE-ICE IPoE, Stenden University, Nov 26, 2015
Steve Hood, [email protected], +1 615 824 8664, ext 3315
Senior VP of Research for STR Global and Founding Director of the SHARE Center
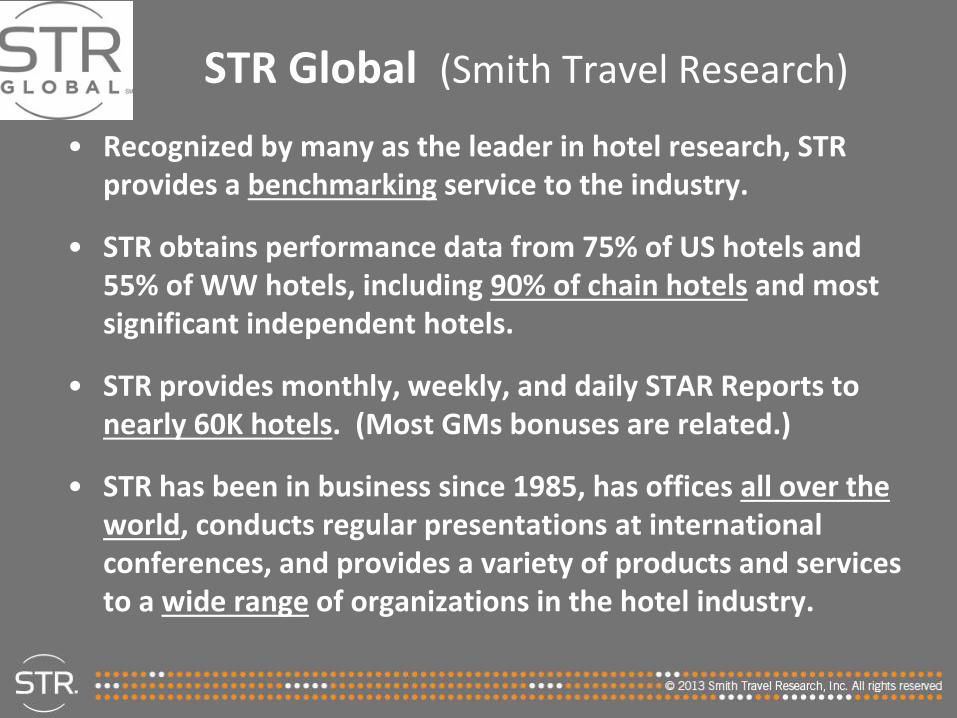
STR Global (Smith Travel Research)
• Recognized by many as the leader in hotel research, STR provides a benchmarking service to the industry.
• STR obtains performance data from 75% of US hotels and 55% of WW hotels, including 90% of chain hotels and most significant independent hotels.
• STR provides monthly, weekly, and daily STAR Reports to nearly 60K hotels. (Most GMs bonuses are related.)
• STR has been in business since 1985, has offices all over the world, conducts regular presentations at international conferences, and provides a variety of products and services to a wide range of organizations in the hotel industry.
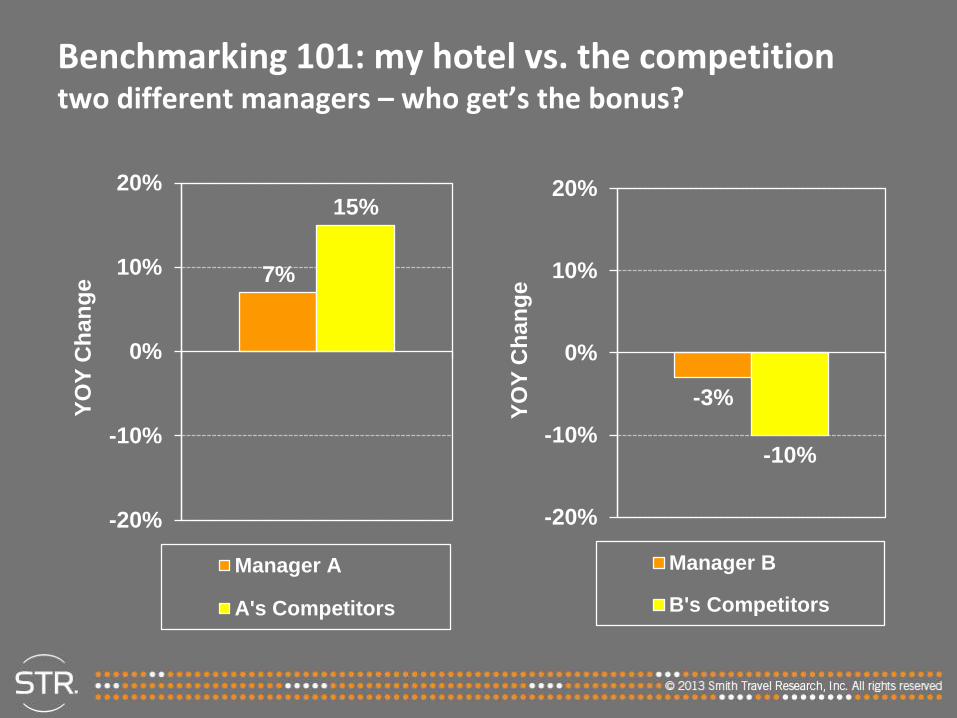
Benchmarking 101: my hotel vs. the competitiontwo different managers – who get’s the bonus?
7%
15%
-20%
-10%
0%
10%
20%
YO
Y C
han
ge
Manager A
A's Competitors
-3%
-10%
-20%
-10%
0%
10%
20%
YO
Y C
han
ge
Manager B
B's Competitors
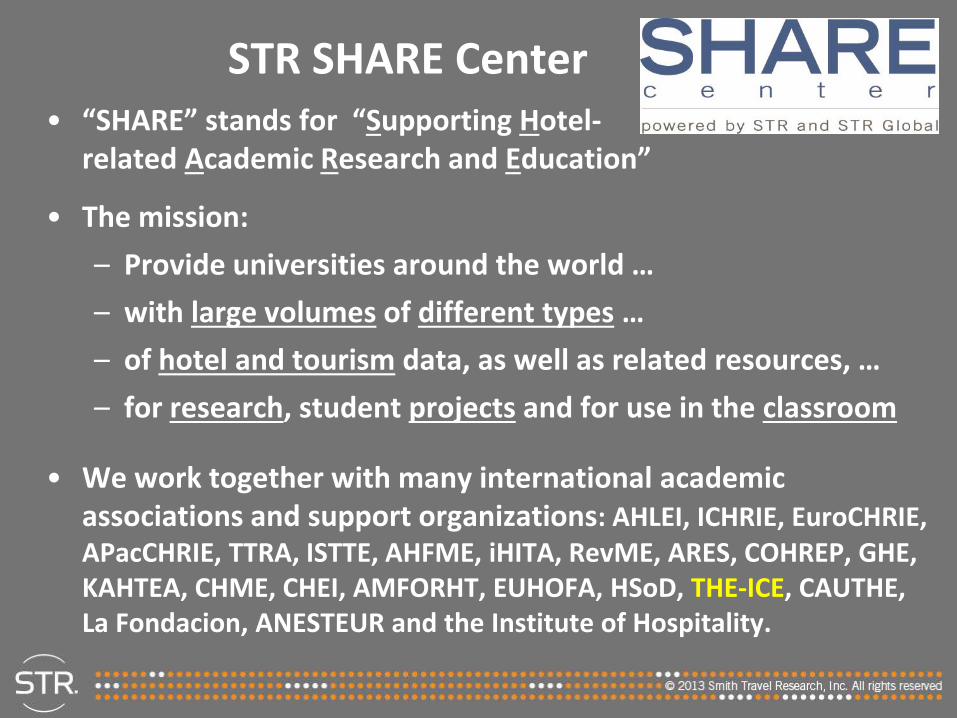
STR SHARE Center• “SHARE” stands for “Supporting Hotel-
related Academic Research and Education”
• The mission:
– Provide universities around the world …
– with large volumes of different types …
– of hotel and tourism data, as well as related resources, …
– for research, student projects and for use in the classroom
• We work together with many international academic associations and support organizations: AHLEI, ICHRIE, EuroCHRIE, APacCHRIE, TTRA, ISTTE, AHFME, iHITA, RevME, ARES, COHREP, GHE, KAHTEA, CHME, CHEI, AMFORHT, EUHOFA, HSoD, THE-ICE, CAUTHE, La Fondacion, ANESTEUR and the Institute of Hospitality.
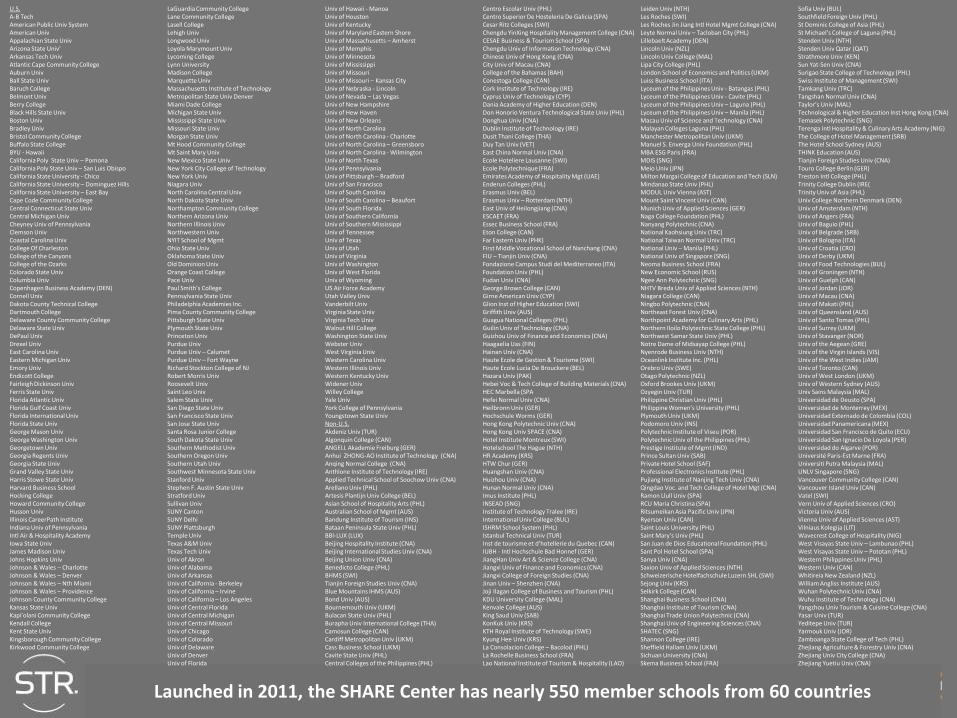
Launched in 2011, the SHARE Center has nearly 550 member schools from 60 countries
U.S.A-B TechAmerican Public Univ SystemAmerican UnivAppalachian State UnivArizona State Univ’Arkansas Tech UnivAtlantic Cape Community CollegeAuburn UnivBall State UnivBaruch CollegeBelmont UnivBerry CollegeBlack Hills State UnivBoston UnivBradley UnivBristol Community CollegeBuffalo State CollegeBYU - HawaiiCalifornia Poly State Univ – PomonaCalifornia Poly State Univ – San Luis ObispoCalifornia State University - ChicoCalifornia State University – Dominguez HillsCalifornia State University – East BayCape Code Community CollegeCentral Connecticut State UnivCentral Michigan UnivCheyney Univ of PennsylvaniaClemson UnivCoastal Carolina UnivCollege Of CharlestonCollege of the CanyonsCollege of the OzarksColorado State UnivColumbia UnivCopenhagen Business Academy (DEN)Cornell UnivDakota County Technical CollegeDartmouth CollegeDelaware County Community CollegeDelaware State UnivDePaul UnivDrexel UnivEast Carolina UnivEastern Michigan UnivEmory UnivEndicott CollegeFairleigh Dickinson UnivFerris State UnivFlorida Atlantic UnivFlorida Gulf Coast UnivFlorida International UnivFlorida State UnivGeorge Mason UnivGeorge Washington UnivGeorgetown UnivGeorgia Regents UnivGeorgia State UnivGrand Valley State UnivHarris Stowe State UnivHarvard Business SchoolHocking CollegeHoward Community CollegeHusson UnivIllinois CareerPath InstituteIndiana Univ of PennsylvaniaIntl Air & Hospitality AcademyIowa State UnivJames Madison UnivJohns Hopkins UnivJohnson & Wales – CharlotteJohnson & Wales – DenverJohnson & Wales – Nth MiamiJohnson & Wales – ProvidenceJohnson County Community CollegeKansas State UnivKapi’olani Community CollegeKendall CollegeKent State UnivKingsborough Community CollegeKirkwood Community College
LaGuardia Community CollegeLane Community CollegeLasell CollegeLehigh UnivLongwood UnivLoyola Marymount UnivLycoming CollegeLynn UniversityMadison CollegeMarquette UnivMassachusetts Institute of TechnologyMetropolitan State Univ DenverMiami Dade CollegeMichigan State UnivMississippi State UnivMissouri State UnivMorgan State UnivMt Hood Community CollegeMt Saint Mary UnivNew Mexico State UnivNew York City College of TechnologyNew York UnivNiagara UnivNorth Carolina Central UnivNorth Dakota State UnivNorthampton Community CollegeNorthern Arizona UnivNorthern Illinois UnivNorthwestern UnivNYIT School of MgmtOhio State UnivOklahoma State UnivOld Dominion UnivOrange Coast CollegePace UnivPaul Smith’s CollegePennsylvania State UnivPhiladelphia Academies Inc.Pima County Community CollegePittsburgh State UnivPlymouth State UnivPrinceton UnivPurdue UnivPurdue Univ – CalumetPurdue Univ – Fort Wayne Richard Stockton College of NJRobert Morris UnivRoosevelt UnivSaint Leo UnivSalem State UnivSan Diego State UnivSan Francisco State UnivSan Jose State UnivSanta Rosa Junior CollegeSouth Dakota State UnivSouthern Methodist UnivSouthern Oregon UnivSouthern Utah UnivSouthwest Minnesota State UnivStanford UnivStephen F. Austin State UnivStratford UnivSullivan UnivSUNY CantonSUNY DelhiSUNY PlattsburghTemple UnivTexas A&M UnivTexas Tech UnivUniv of AkronUniv of AlabamaUniv of ArkansasUniv of California - BerkeleyUniv of California – IrvineUniv of California – Los AngelesUniv of Central FloridaUniv of Central MichiganUniv of Central MissouriUniv of ChicagoUniv of ColoradoUniv of DelawareUniv of DenverUniv of Florida
Univ of Hawaii - ManoaUniv of HoustonUniv of KentuckyUniv of Maryland Eastern ShoreUniv of Massachusetts – AmherstUniv of MemphisUniv of MinnesotaUniv of MississippiUniv of MissouriUniv of Missouri – Kansas CityUniv of Nebraska - LincolnUniv of Nevada – Las VegasUniv of New HampshireUniv of Hew HavenUniv of New OrleansUniv of North CarolinaUniv of North Carolina - CharlotteUniv of North Carolina – GreensboroUniv of North Carolina - WilmingtonUniv of North TexasUniv of PennsylvaniaUniv of Pittsburgh – BradfordUniv of San FranciscoUniv of South CarolinaUniv of South Carolina – BeaufortUniv of South FloridaUniv of Southern CaliforniaUniv of Southern MississippiUniv of TennesseeUniv of TexasUniv of UtahUniv of VirginiaUniv of WashingtonUniv of West FloridaUniv of WyomingUS Air Force AcademyUtah Valley UnivVanderbilt UnivVirginia State UnivVirginia Tech UnivWalnut Hill CollegeWashington State UnivWebster UnivWest Virginia UnivWestern Carolina UnivWestern Illinois UnivWestern Kentucky UnivWidener UnivWilley CollegeYale UnivYork College of PennsylvaniaYoungstown State UnivNon-U.S.Akdeniz Univ (TUR)Algonquin College (CAN)ANGELL Akademie Freiburg (GER)Anhui ZHONG-AO Institute of Technology (CNA)Anqing Normal College (CNA)Anthlone Institute of Technology (IRE)Applied Technical School of Soochow Univ (CNA)Arellano Univ (PHL)Artesis Plantijn Univ College (BEL)Asian School of Hospitality Arts (PHL)Australian School of Mgmt (AUS)Bandung Institute of Tourism (INS)Bataan Peninsula State Univ (PHL)BBI-LUX (LUX)Beijing Hospitality Institute (CNA)Beijing International Studies Univ (CNA) Beijing Union Univ (CNA)Benedicto College (PHL)BHMS (SWI)Tianjin Foreign Studies Univ (CNA)Blue Mountains IHMS (AUS)Bond Univ (AUS)Bournemouth Univ (UKM)Bulacan State Univ (PHL)Burapha Univ International College (THA)Camosun College (CAN)Cardiff Metropolitan Univ (UKM)Cass Business School (UKM)Cavite State Univ (PHL)Central Colleges of the Philippines (PHL)
Centro Escolar Univ (PHL)Centro Superior De Hosteleria De Galicia (SPA)Cesar Ritz Colleges (SWI)Chengdu YinXing Hospitality Management College (CNA)CESAE Business & Tourism School (SPA)Chengdu Univ of Information Technology (CNA) Chinese Univ of Hong Kong (CNA)City Univ of Macau (CNA)College of the Bahamas (BAH)Conestoga College (CAN)Cork Institute of Technology (IRE)Cyprus Univ of Technology (CYP)Dania Academy of Higher Education (DEN)Don Honorio Ventura Technological State Univ (PHL)Donghua Univ (CNA)Dublin Institute of Technology (IRE)Dusit Thani College (THA)Duy Tan Univ (VET)East China Normal Univ (CNA)Ecole Hoteliere Lausanne (SWI)Ecole Polytechnique (FRA)Emirates Academy of Hospitality Mgt (UAE)Enderun Colleges (PHL)Erasmus Univ (BEL)Erasmus Univ – Rotterdam (NTH)East Univ of Heilongjiang (CNA)ESCAET (FRA)Essec Business School (FRA)Eton College (CAN)Far Eastern Univ (PHK)First Middle Vocational School of Nanchang (CNA)FIU – Tianjin Univ (CNA) Fondazione Campus Studi del Mediterraneo (ITA)Foundation Univ (PHL)Fudan Univ (CNA)George Brown College (CAN)Girne American Univ (CYP)Glion Inst of Higher Education (SWI)Griffith Univ (AUS)Guagua National Colleges (PHL)Guilin Univ of Technology (CNA)Guizhou Univ of Finance and Economics (CNA)Haagaelia Uas (FIN)Hainan Univ (CNA)Haute Ecole de Gestion & Tourisme (SWI)Haute Ecole Lucia De Brouckere (BEL)Hazara Univ (PAK)Hebei Voc & Tech College of Building Materials (CNA)HEC Marbella (SPAHefei Normal Univ (CNA)Heilbronn Univ (GER)Hochschule Worms (GER)Hong Kong Polytechnic Univ (CNA)Hong Kong Univ SPACE (CNA) Hotel Institute Montreux (SWI)Hotelschool The Hague (NTH)HR Academy (KRS)HTW Chur (GER)Huangshan Univ (CNA)Huizhou Univ (CNA)Hunan Normal Univ (CNA)Imus Institute (PHL)INSEAD (SNG)Institute of Technology Tralee (IRE)International Univ College (BUL)ISHRM School System (PHL)Istanbul Technical Univ (TUR)Inst de tourisme et d’hotellerie du Quebec (CAN)IUBH - Intl Hochschule Bad Honnef (GER)JiangHan Univ Art & Science College (CNA)Jiangxi Univ of Finance and Economics (CNA) Jiangxi College of Foreign Studies (CNA)Jinan Univ – Shenzhen (CNA) Joji Ilagan College of Business and Tourism (PHL)KDU University College (MAL)Kenvale College (AUS)King Saud Univ (SAB)KonKuk Univ (KRS)KTH Royal Institute of Technology (SWE)Kyung Hee Univ (KRS)La Consolacion College – Bacolod (PHL)La Rochelle Business School (FRA)Lao National Institute of Tourism & Hospitality (LAO)
Leiden Univ (NTH)Les Roches (SWI)Les Roches Jin Jiang Intl Hotel Mgmt College (CNA)Leyte Normal Univ – Tacloban City (PHL)Lillebaelt Academy (DEN)Lincoln Univ (NZL)Lincoln Univ College (MAL)Lipa City College (PHL)London School of Economics and Politics (UKM)Luiss Business School (ITA)Lyceum of the Philippines Univ - Batangas (PHL)Lyceum of the Philippines Univ - Cavite (PHL)Lyceum of the Philippines Univ – Laguna (PHL)Lyceum of the Philippines Univ – Manila (PHL)Macau Univ of Science and Technology (CNA)Malayan Colleges Laguna (PHL)Manchester Metropolitan Univ (UKM)Manuel S. Enverga Univ Foundation (PHL)MBA ESG Paris (FRA)MDIS (SNG)Meio Univ (JPN)Milton Margai College of Education and Tech (SLN)Mindanao State Univ (PHL)MODUL Univ Vienna (AST)Mount Saint Vincent Univ (CAN)Munich Univ of Applied Sciences (GER)Naga College Foundation (PHL)Nanyang Polytechnic (CNA)National Kaohsiung Univ (TRC)National Taiwan Normal Univ (TRC)National Univ – Manila (PHL)National Univ of Singapore (SNG)Neoma Business School (FRA)New Economic School (RUS)Ngee Ann Polytechnic (SNG)NHTV Breda Univ of Applied Sciences (NTH)Niagara College (CAN)Ningbo Polytechnic (CNA)Northeast Forest Univ (CNA)Northpoint Academy for Culinary Arts (PHL)Northern Iloilo Polytechnic State College (PHL)Northwest Samar State Univ (PHL)Notre Dame of Midsayap College (PHL)Nyenrode Business Univ (NTH)Oceanlink Institute Inc. (PHL)Orebro Univ (SWE)Otago Polytechnic (NZL)Oxford Brookes Univ (UKM)Ozyegin Univ (TUR)Philippine Christian Univ (PHL)Philippine Women’s University (PHL)Plymouth Univ (UKM)Podomoro Univ (INS)Polytechnic Institute of Viseu (POR)Polytechnic Univ of the Philippines (PHL)Prestige Institute of Mgmt (IND)Prince Sultan Univ (SAB)Private Hotel School (SAF)Professional Electronics Institute (PHL)Pujiang Institute of Nanjing Tech Univ (CNA)Qingdao Voc. and Tech College of Hotel Mgt (CNA)Ramon Llull Univ (SPA)RCU Maria Christina (SPA)Ritsumeikan Asia Pacific Univ (JPN) Ryerson Univ (CAN)Saint Louis University (PHL)Saint Mary’s Univ (PHL)San Juan de Dios Educational Foundation (PHL)Sant Pol Hotel School (SPA)Sanya Univ (CNA)Saxion Univ of Applied Sciences (NTH)Schweizerische Hotelfachschule Luzern SHL (SWI)Sejong Univ (KRS)Selkirk College (CAN)Shanghai Business School (CNA)Shanghai Institute of Tourism (CNA)Shanghai Trade Union Polytechnic (CNA)Shanghai Univ of Engineering Sciences (CNA)SHATEC (SNG)Shannon College (IRE)Sheffield Hallam Univ (UKM)Sichuan University (CNA)Skema Business School (FRA)
Sofia Univ (BUL)Southfield Foreign Univ (PHL)St Dominic College of Asia (PHL)St Michael’s College of Laguna (PHL)Stenden Univ (NTH)Stenden Univ Qatar (QAT)Strathmore Univ (KEN)Sun Yat-Sen Univ (CNA)Surigao State College of Technology (PHL)Swiss Institute of Management (SWI)Tamkang Univ (TRC)Tangshan Normal Univ (CNA)Taylor’s Univ (MAL)Technological & Higher Education Inst Hong Kong (CNA)Temasek Polytechnic (SNG) Terenga Intl Hospitality & Culinary Arts Academy (NIG)The College of Hotel Management (SRB)The Hotel School Sydney (AUS)THINK Education (AUS)Tianjin Foreign Studies Univ (CNA) Touro College Berlin (GER)Treston Intl College (PHL)Trinity College Dublin (IRE(Trinity Univ of Asia (PHL)Univ College Northern Denmark (DEN)Univ of Amsterdam (NTH)Univ of Angers (FRA)Univ of Baguio (PHL)Univ of Belgrade (SRB)Univ of Bologna (ITA)Univ of Croatia (CRO)Univ of Derby (UKM)Univ of Food Technologies (BUL)Univ of Groningen (NTH)Univ of Guelph (CAN)Univ of Jordan (JOR)Univ of Macau (CNA)Univ of Makati (PHL)Univ of Queensland (AUS)Univ of Santo Tomas (PHL)Univ of Surrey (UKM) Univ of Stavanger (NOR)Univ of the Aegean (GRE)Univ of the Virgin Islands (VIS)Univ of the West Indies (JAM)Univ of Toronto (CAN)Univ of West London (UKM)Univ of Western Sydney (AUS)Univ Sains Malaysia (MAL)Universidad de Deusto (SPA)Universidad de Monterrey (MEX)Universidad Externado de Colombia (COL)Universidad Panamericana (MEX)Universidad San Francisco de Quito (ECU)Universidad San Ignacio De Loyola (PER) Universidad do Algarve (POR)Université Paris-Est Marne (FRA)Universiti Putra Malaysia (MAL)UNLV Singapore (SNG)Vancouver Community College (CAN)Vancouver Island Univ (CAN)Vatel (SWI)Vern Univ of Applied Sciences (CRO)Victoria Univ (AUS)Vienna Univ of Applied Sciences (AST)Vilniaus Kolegija (LIT)Wavecrest College of Hospitality (NIG)West Visayas State Univ – Lambunao (PHL)West Visayas State Univ – Pototan (PHL)Western Philippines Univ (PHL)Western Univ (CAN)Whitireia New Zealand (NZL)William Angliss Institute (AUS)Wuhan Polytechnic Univ (CNA)Wuhu Institute of Technology (CNA)Yangzhou Univ Tourism & Cuisine College (CNA)Yasar Univ (TUR)Yeditepe Univ (TUR)Yarmouk Univ (JOR)Zamboanga State College of Tech (PHL)Zhejiang Agriculture & Forestry Univ (CNA)Zhejiang Univ City College (CNA)Zhejiang Yuetiu Univ (CNA)

What’s included in a SHARE Center membership?
Hotel and Tourism Data
• Hotel Performance (Occupancy, ADR, RevPAR) data
• Hotel Profit & Loss (accounting/profitability) data
• Hotel Pipeline & Supply (development) data
• User-defined Destination/Tourism reports
• Hotel Census data (attribute information)
• Hotel Company information
• Property & Room Counts
• Forecast reports
• Hotel Sales Transaction data

And in addition to Data …
• Training programs with supporting material (applications)
• Research related support – collaboration, special data requests, help merging/correlating third party data
• Access to articles – HotelNewsNow.com our sister company
• Global Industry publications – country, continent, cities
• Sample reports and hotel industry reference information
• Speaker support for Deans, Directors and Department Heads
• Student competitions
• Webinars for faculty or students
• Educator forums connecting academia with industry
• Online community
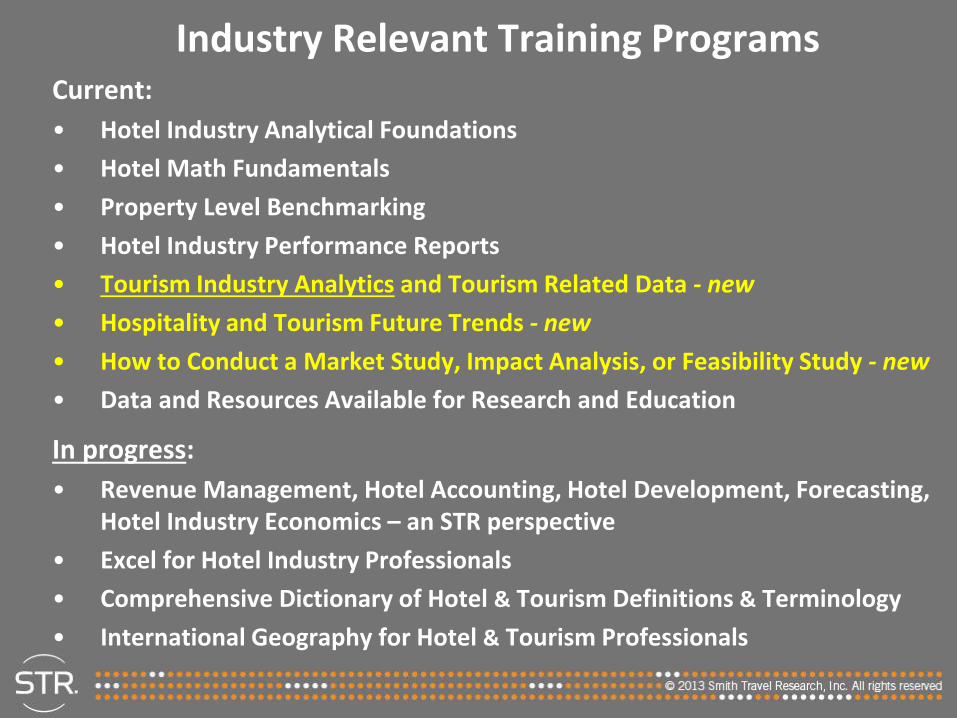
Industry Relevant Training ProgramsCurrent:
• Hotel Industry Analytical Foundations
• Hotel Math Fundamentals
• Property Level Benchmarking
• Hotel Industry Performance Reports
• Tourism Industry Analytics and Tourism Related Data - new
• Hospitality and Tourism Future Trends - new
• How to Conduct a Market Study, Impact Analysis, or Feasibility Study - new
• Data and Resources Available for Research and Education
In progress:
• Revenue Management, Hotel Accounting, Hotel Development, Forecasting, Hotel Industry Economics – an STR perspective
• Excel for Hotel Industry Professionals
• Comprehensive Dictionary of Hotel & Tourism Definitions & Terminology
• International Geography for Hotel & Tourism Professionals

HotelNewsNow.com – Academic Support
• www.hotelnewsnow.com is a free electronic news service focused on the global hotel industry, including performance trends, conference updates and hot topics, with a search capability. Info available on how professors are using HNN in the classroom.
• We have launched a new program “SHARE News Now” where professors are invited to submit industry relevant articles (academic research translated for practitioners, no sigmas/epsilons) to communicate with industry.
• Articles will be featured in HotelNewsNow.com where thousands of industry professionals will be able to download your full research and dialogue with you regarding your findings.
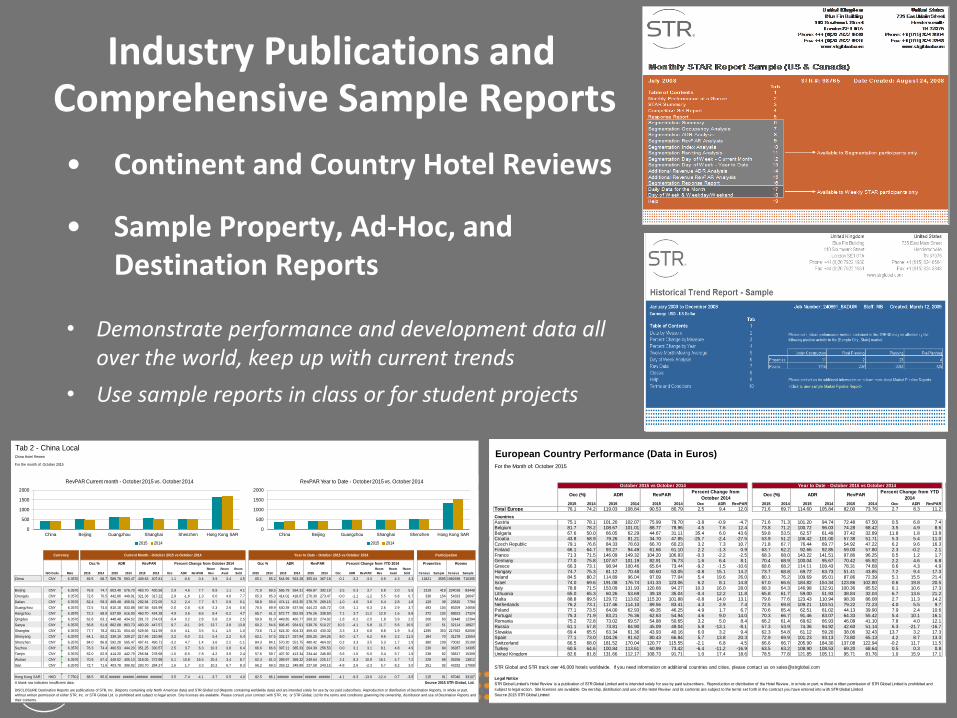
Industry Publications andComprehensive Sample Reports
• Continent and Country Hotel Reviews
• Sample Property, Ad-Hoc, and Destination Reports
• Demonstrate performance and development data allover the world, keep up with current trends
• Use sample reports in class or for student projects
Tab 2 - China LocalChina Hotel Review
For the month of: October 2015
Percent Change from October 2014 Percent Change from YTD 2014
ISO Code Rate 2015 2014 2015 2014 2015 2014 Occ ADR RevPAR
Room
Rev
Room
Avail
Room
Sold 2015 2014 2015 2014 2015 2014 Occ ADR RevPAR
Room
Rev
Room
Avail
Room
Sold Census Sample Census Sample
China CNY 6.3570 69.5 68.7 589.78 593.47 409.63 407.81 1.1 -0.6 0.4 3.9 3.4 4.5 65.1 65.2 544.99 563.28 355.04 367.18 -0.1 -3.2 -3.3 0.9 4.3 4.3 11821 3595 1982938 710395
Beijing CNY 6.3570 76.8 74.7 603.40 576.70 463.70 430.56 2.9 4.6 7.7 8.9 1.1 4.1 71.9 69.5 565.79 564.31 406.87 392.19 3.5 0.3 3.7 5.8 2.0 5.5 1319 419 224018 83449
Chengdu CNY 6.3570 72.6 70.5 442.86 449.91 321.36 317.22 2.9 -1.6 1.3 6.0 4.6 7.7 65.3 65.3 414.02 418.67 270.30 273.47 -0.0 -1.1 -1.2 5.5 6.8 6.7 338 154 54333 28647
Dalian CNY 6.3570 62.4 59.3 469.48 458.51 292.94 272.05 5.2 2.4 7.7 8.7 0.9 6.1 58.8 59.4 474.11 453.35 278.76 269.15 -1.0 4.6 3.6 6.4 2.8 1.8 129 39 23815 7794
Guangzhou CNY 6.3570 72.5 74.0 810.18 833.88 587.58 616.99 -2.0 -2.8 -4.8 -2.3 2.6 0.6 70.5 69.9 630.39 637.56 444.23 445.72 0.8 -1.1 -0.3 2.6 2.9 3.7 493 104 85209 24658
Hangzhou CNY 6.3570 72.2 68.9 637.89 616.00 460.70 424.28 4.9 3.6 8.6 8.4 -0.2 4.7 65.7 61.3 572.77 552.09 376.26 338.50 7.1 3.7 11.2 12.9 1.6 8.8 372 102 58523 17324
Qingdao CNY 6.3570 62.8 63.1 448.48 434.52 281.73 274.03 -0.4 3.2 2.8 5.8 2.9 2.5 59.9 61.0 449.85 450.77 269.32 274.92 -1.8 -0.2 -2.0 1.8 3.9 2.0 206 60 32448 12394
Sanya CNY 6.3570 56.8 51.8 862.68 863.73 490.29 447.57 9.7 -0.1 9.5 13.7 3.8 13.8 60.2 54.6 896.45 934.91 539.76 510.27 10.3 -4.1 5.8 11.7 5.6 16.5 107 51 32114 18927
Shanghai CNY 6.3570 77.7 78.2 681.31 654.40 529.66 511.59 -0.6 4.1 3.5 5.1 1.5 1.0 73.6 71.2 624.30 604.33 459.43 430.32 3.3 3.3 6.8 8.8 1.9 5.4 1295 353 217923 82006
Shenyang CNY 6.3570 64.1 62.2 339.19 339.27 217.46 210.86 3.2 -0.0 3.1 5.4 2.2 5.4 62.1 57.5 332.17 337.94 206.25 194.26 8.0 -1.7 6.2 9.6 3.2 11.5 184 70 31278 13554
Shenzhen CNY 6.3570 84.0 86.8 592.28 565.47 497.41 490.71 -3.2 4.7 1.4 3.6 2.2 -1.1 84.3 84.1 570.20 551.75 480.42 464.02 0.2 3.3 3.5 5.3 1.7 1.9 380 109 70032 25199
Suzhou CNY 6.3570 76.3 74.4 460.53 444.20 351.25 330.57 2.5 3.7 6.3 10.3 3.8 6.4 66.6 66.6 397.11 385.33 264.39 256.53 0.0 3.1 3.1 8.1 4.8 4.9 230 84 36287 14395
Tianjin CNY 6.3570 62.0 62.9 414.20 442.79 256.84 278.68 -1.5 -6.5 -7.8 -4.2 3.9 2.4 57.6 59.7 407.30 413.34 234.44 246.80 -3.6 -1.5 -5.0 0.4 5.7 1.9 238 82 36817 15309
Wuhan CNY 6.3570 70.8 67.4 449.02 405.10 318.05 272.98 5.1 10.8 16.5 20.4 3.4 8.7 62.4 61.0 399.97 369.32 249.64 225.17 2.4 8.3 10.9 16.1 4.7 7.2 229 68 35256 13812
Xian CNY 6.3570 72.7 71.6 403.78 396.92 293.70 284.27 1.6 1.7 3.3 10.2 6.7 8.3 66.2 69.5 359.12 349.89 237.58 243.15 -4.8 2.6 -2.3 5.7 8.2 3.0 251 92 43332 17069
Hong Kong SAR HKD 7.7501 88.5 85.6 ###### ###### ###### ###### 3.5 -7.4 -4.1 -3.7 0.5 4.0 82.5 86.1 ###### ###### ###### ###### -4.1 -9.3 -13.0 -12.4 0.7 -3.5 215 91 67040 33107
A blank row indicates insufficient data. Source 2015 STR Global, Ltd.
PropertiesADR
DISCLOSURE Destination Reports are publications of STR, Inc. (Reports containing only North American data) and STR Global Ltd (Reports containing worldwide data) and are intended solely for use by our paid subscribers. Reproduction or distribution of Destination Reports, in whole or part,
without written permission of either STR, Inc. or STR Global Ltd. is prohibited and subject to legal action. Site licenses are available. Please consult your contract with STR, Inc. or STR Global, Ltd for the terms and conditions governing the ownership, distribution and use of Destination Reports and
their contents.
Participation
Occ %
Current Month - October 2015 vs October 2014Currency
RevPARADROcc %
Year to Date - October 2015 vs October 2014
RoomsRevPAR
0
500
1000
1500
2000
China Beijing Guangzhou Shanghai Shenzhen Hong Kong SAR
RevPAR Current month - October 2015 vs. October 2014
2015 2014
0
500
1000
1500
2000
China Beijing Guangzhou Shanghai Shenzhen Hong Kong SAR
RevPAR Year to Date - October 2015 vs. October 2014
2015 2014
European Country Performance (Data in Euros)For the Month of: October 2015
October 2015 vs October 2014 Year to Date - October 2015 vs October 2014
Occ (%) ADR RevPARPercent Change from
October 2014Occ (%) ADR RevPAR
Percent Change from YTD
20142015 2014 2015 2014 2015 2014 Occ ADR RevPAR 2015 2014 2015 2014 2015 2014 Occ ADR RevPAR
Total Europe 76.1 74.2 119.03 108.84 90.53 80.79 2.5 9.4 12.0 71.6 69.7 114.60 105.84 82.00 73.76 2.7 8.3 11.2
Countries
Austria 75.1 78.1 101.20 102.07 75.99 79.70 -3.8 -0.9 -4.7 71.6 71.3 101.20 94.74 72.48 67.50 0.5 6.8 7.4Belgium 81.7 78.2 108.67 101.01 88.77 78.96 4.5 7.6 12.4 73.8 71.2 100.72 96.03 74.28 68.42 3.5 4.9 8.6Bulgaria 67.6 50.0 66.05 62.29 44.67 31.11 35.4 6.0 43.6 59.8 53.5 62.57 61.49 37.42 32.89 11.8 1.8 13.8Croatia 43.8 58.9 79.26 81.21 34.70 47.85 -25.7 -2.4 -27.5 53.9 51.2 106.42 101.00 57.38 51.71 5.3 5.4 11.0Czech Republic 79.1 76.6 84.33 78.63 66.70 60.23 3.2 7.3 10.7 71.8 67.7 76.44 69.77 54.92 47.22 6.2 9.6 16.3Finland 66.1 64.7 93.27 94.49 61.66 61.10 2.2 -1.3 0.9 63.7 62.2 92.66 92.85 59.00 57.80 2.3 -0.2 2.1France 71.3 71.5 146.09 149.32 104.20 106.83 -0.3 -2.2 -2.5 68.3 68.0 143.22 141.51 97.86 96.25 0.5 1.2 1.7Germany 77.0 75.8 107.67 101.19 82.91 76.73 1.6 6.4 8.1 70.4 68.9 100.04 95.67 70.42 65.92 2.2 4.6 6.8Greece 66.3 73.1 98.94 100.46 65.64 73.44 -9.2 -1.5 -10.6 68.6 68.2 114.11 109.43 78.31 74.68 0.6 4.3 4.9Hungary 74.7 75.3 81.12 70.48 60.60 53.05 -0.8 15.1 14.2 73.7 68.8 69.72 63.73 51.41 43.85 7.2 9.4 17.3Ireland 84.5 80.2 114.89 96.04 97.09 77.04 5.4 19.6 26.0 80.1 76.2 109.69 95.01 87.86 72.39 5.1 15.5 21.4Israel 74.0 69.6 191.08 176.74 141.33 123.06 6.2 8.1 14.8 67.0 66.6 184.82 154.34 123.86 102.80 0.6 19.8 20.5Italy 78.8 71.5 153.09 131.93 120.68 94.27 10.3 16.0 28.0 68.3 64.3 146.98 132.91 100.36 85.52 6.1 10.6 17.3Lithuania 65.0 65.3 60.26 53.69 39.18 35.04 -0.4 12.2 11.8 65.8 61.7 59.00 51.93 38.84 32.04 6.7 13.6 21.2Malta 88.8 89.5 129.72 113.82 115.20 101.88 -0.8 14.0 13.1 79.6 77.6 123.43 110.94 98.30 86.08 2.7 11.3 14.2Netherlands 76.2 73.1 117.46 114.10 89.56 83.41 4.3 2.9 7.4 72.5 69.8 109.21 103.51 79.22 72.23 4.0 5.5 9.7Poland 77.1 73.5 64.00 62.93 49.35 46.25 4.9 1.7 6.7 70.6 65.4 62.51 61.02 44.13 39.90 7.9 2.4 10.6Portugal 75.3 71.9 83.21 76.36 62.63 54.94 4.6 9.0 14.0 70.3 66.7 91.46 83.07 64.33 55.42 5.4 10.1 16.1Romania 75.2 72.8 73.02 69.57 54.88 50.65 3.2 5.0 8.4 66.2 61.4 69.62 66.93 46.08 41.10 7.8 4.0 12.1Russia 61.1 57.8 73.81 84.90 45.09 49.04 5.8 -13.1 -8.1 57.3 53.9 74.36 94.92 42.60 51.14 6.3 -21.7 -16.7Slovakia 69.4 65.5 63.34 61.36 43.93 40.16 6.0 3.2 9.4 62.3 54.8 61.12 59.20 38.06 32.43 13.7 3.2 17.3Spain 77.1 73.0 104.26 91.62 80.43 66.84 5.7 13.8 20.3 72.9 69.9 101.23 93.13 73.80 65.13 4.2 8.7 13.3Switzerland 66.5 68.0 181.52 170.04 120.77 115.55 -2.1 6.8 4.5 66.6 66.7 205.90 184.30 137.08 122.94 -0.2 11.7 11.5Turkey 60.5 64.6 100.84 113.61 60.99 73.42 -6.4 -11.2 -16.9 63.5 63.2 108.90 108.53 69.20 68.64 0.5 0.3 0.8United Kingdom 82.6 81.8 131.66 112.17 108.73 91.71 1.0 17.4 18.6 78.5 77.8 121.85 105.11 95.71 81.76 1.0 15.9 17.1
STR Global and STR track over 46,000 hotels worldwide. If you need information on additional countries and cities, please contact us on [email protected]
Legal Notice
Source 2015 STR Global Limited
STR Global Limited’s Hotel Review is a publication of STR Global Limited and is intended solely for use by paid subscribers. Reproduction or distribution of the Hotel Review , in w hole or part, w ithout w ritten permission of STR Global Limited is prohibited and
subject to legal action. Site licenses are available. Ow nership, distribution and use of the Hotel Review and its contents are subject to the terms set forth in the contract you have entered into w ith STR Global Limited
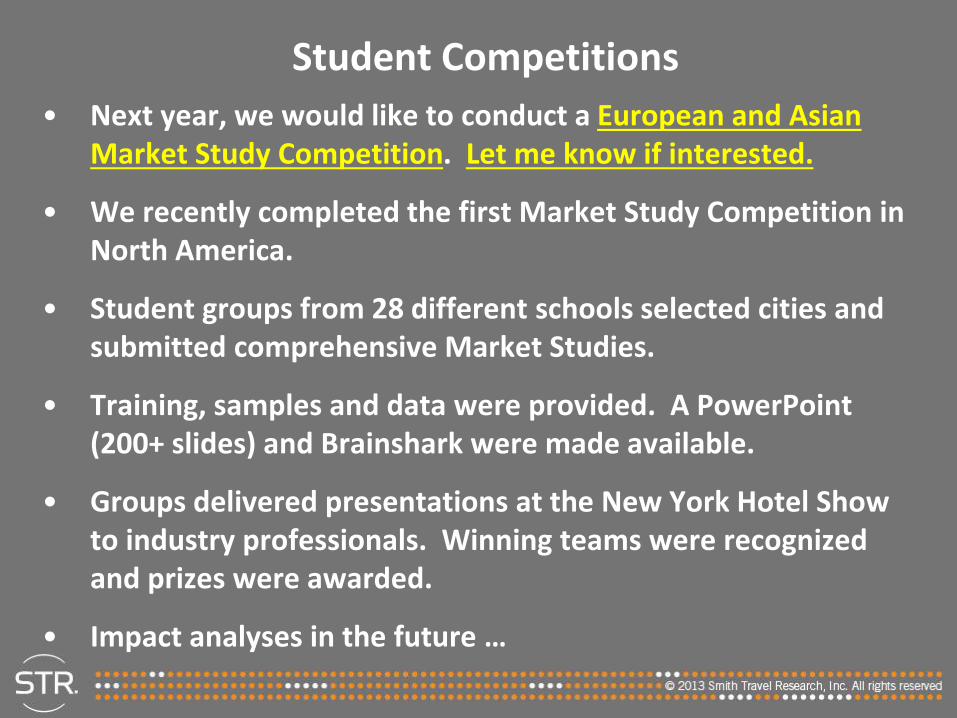
Student Competitions
• Next year, we would like to conduct a European and Asian Market Study Competition. Let me know if interested.
• We recently completed the first Market Study Competition in North America.
• Student groups from 28 different schools selected cities and submitted comprehensive Market Studies.
• Training, samples and data were provided. A PowerPoint (200+ slides) and Brainshark were made available.
• Groups delivered presentations at the New York Hotel Show to industry professionals. Winning teams were recognized and prizes were awarded.
• Impact analyses in the future …
Certification in Hotel Industry Analytics
• In 2012, we launched the “Certification in Hotel Industry Analytics” (CHIA) jointly with ICHRIE and AH&LEI.
• Over 4,000 undergraduate and graduate students, as well as professors have received the CHIA certification.
• 50 free Train-the-Trainer sessions have been conducted for over 1000 professors. Upcoming dates/locations available.
• Qualifying students and professors receive certificates and can use the “CHIA” designation on business cards/resumes.
• Hotel companies are starting to ask for CHIA-certified students. We’ve received great testimonials from students related to the CHIA and their first jobs.
Certification Details
• A comprehensive training package is provided with PowerPoints, applications, quizzes, and case scenarios.
• The cost of the certifications for students is just $75 USD (free for professors, $300 for industry professionals).
• Testing is administered by EI. Hardcopy or online exams are available. 50 multiple choice questions and a minimum passing score of 70%. The passing rate is 75-80%.
• Schools are using a variety of formats to present the CHIA training: different classes, optional or mandatory, grad and undergrad.
• The certification is being offered to lodging, tourism and other hospitality students.
CHIA Train-the-Trainer Sessions
• Free Train-the-Trainer sessions are provided to prepare professors to present the training to their students.
• Upcoming sessions will be conducted all over the world:
– November in New York, Vietnam, and the Netherlands
– December in Orlando and Hong Kong
– January in Philadelphia and the Philippines
– February in Australia and possibly India
– March in Nashville, Switzerland and France
– May in Belfast (CHME), Bangkok (APacCHRIE) and Macedonia (Fondacion)
– July in Dallas (ICHRIE) and the Mideast
– October in Budapest (EuroCHRIE) and Europe (Spain, Italy, Scandinavia)
– November in Africa
• Online training is also available.
Industry version of the CHIA
• An industry version of the CHIA certification was launched in 2014.
• The training has been presented to GMs, RMs, trainers and corporate staff.
• Over 500 industry professionals have already been certified. We have conducted pilots for nearly 20 companies.
• There are a variety of formats: online, public workshop, private workshop for a company or organization.
• The cost of the industry certification is $300 USD.
• Schools can offer the CHIA training to industry professionals(Exec Ed, Career Dev). Let me know if you are interested.
New – Abbreviated Version of the CHIA –Hotel Industry Foundations & Introduction to Analytics
• In 2015, we launched the HIFIA, targeted at two-year colleges, technical schools and schools in developing areas of the world.
• The HIFIA is shorter, 5 modules instead of 16 in the CHIA.
• It is easier, less emphasis on math and reports, but it still builds a hotel industry foundation and an appreciation for analytics (hotel math is not rocket science).
• The HIFIA is personalized for areas of the world. It is translated into Chinese and is being translated into Spanish.
• More information and an outline are available.
• If you’re not already involved in the SHARE Center, we offer complimentary memberships to introduce schools to all of the data and resources.
• If you are a member, let us know how we can help you and your faculty maximize the benefits
Steve Hood, [email protected], +1 615-824-8664, extension 3315

Experiential Learning
Over the last four years, I’ve had the privilege
to work with professors and see how they
have used data in the classroom
“I’m not sure exactly what it is, but I think I am one!”
Here are some things we have done …
1. In the CHIA certification training, we suggest over 20 different application exercises to practice and apply the content.
2. Last year we created a PowerPoint, “H&T Future Trends” that identifies current issues, hot topics and problems/challengesof the hotel and tourism industry, emphasizing industry relevance.
3. Last year we also created a resource to help professors conduct nearly 30 different types of student projects.
4. This year we created a “How to Conduct a Market Study” training. (We will expand this to cover impact analyses, feasibility studies and other popular H&T research projects.)
Here are some things we have learned from you …
1. Professors are using our data and related resources in a variety of creative ways to provide students with hands-on experience working with live hotel and tourism industry data. I’ll share some examples.
2. We’ve done a bad job compiling these examples. That’s a goal for 2016 (online community).
3. As a company, STR conducts numerous research projectsourselves, (but not as much as we would like).
4. Our customers: hotel companies, tourism organizations, and consultants use STR data to perform a wide range of research.

Examples of Experiential Learning
• Observations
• Ways I think we are helping
• What else we can do together?
Observations regarding Experiential Learning – top 5
1. Familiarity with data is priceless. (some examples will follow)
2. Comfort level increases as you graph/visualize data. Numbers in a table become real actionable information.
3. Data taxonomy/levels: analyze (understand) interpret (strategic/improvement) communicate (impart/explain, Cambra)
4. Critical for hospitality and tourism education to be industry relevant (terminology, definitions, formulas, methodologies, reports, hot topics, current challenges)
5. Students can benefit immensely from hands-on experience working with live hotel & tourism industry data, studying real situations and solving actual problems (same data they will be using in a hotel, company, or tourism organization)
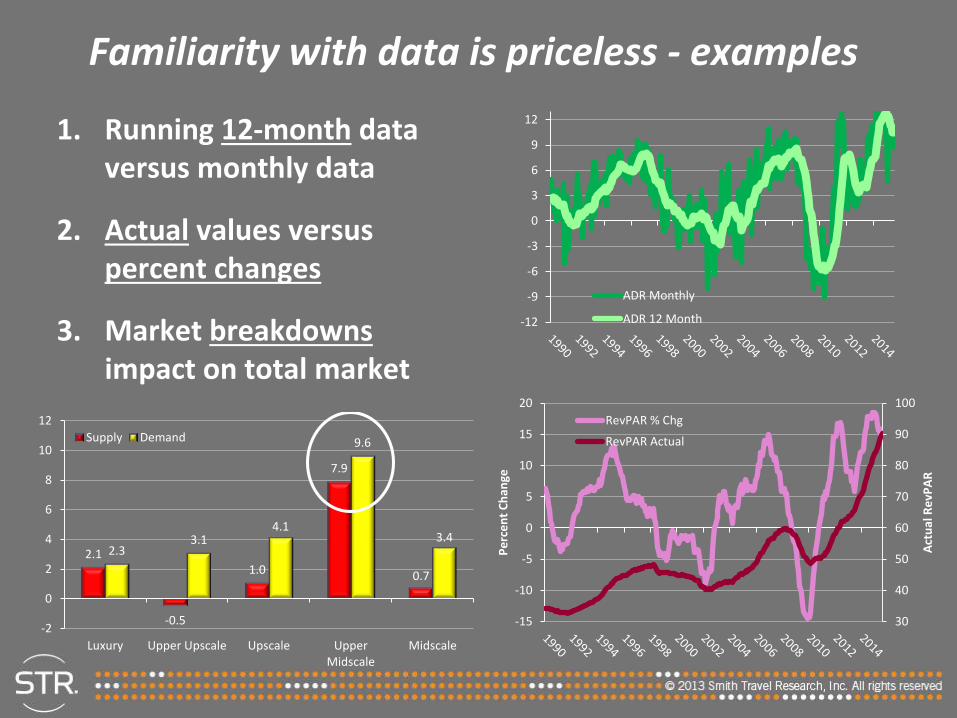
Familiarity with data is priceless - examples
1. Running 12-month data versus monthly data
2. Actual values versus percent changes
3. Market breakdownsimpact on total market
-12
-9
-6
-3
0
3
6
9
12
ADR Monthly
ADR 12 Month
30
40
50
60
70
80
90
100
-15
-10
-5
0
5
10
15
20
Act
ual
Re
vPA
R
Pe
rce
nt
Ch
ange
RevPAR % Chg
RevPAR Actual
2.1
-0.5
1.0
7.9
0.7
2.33.1
4.1
9.6
3.4
-2
0
2
4
6
8
10
12
Luxury Upper Upscale Upscale UpperMidscale
Midscale
Supply Demand
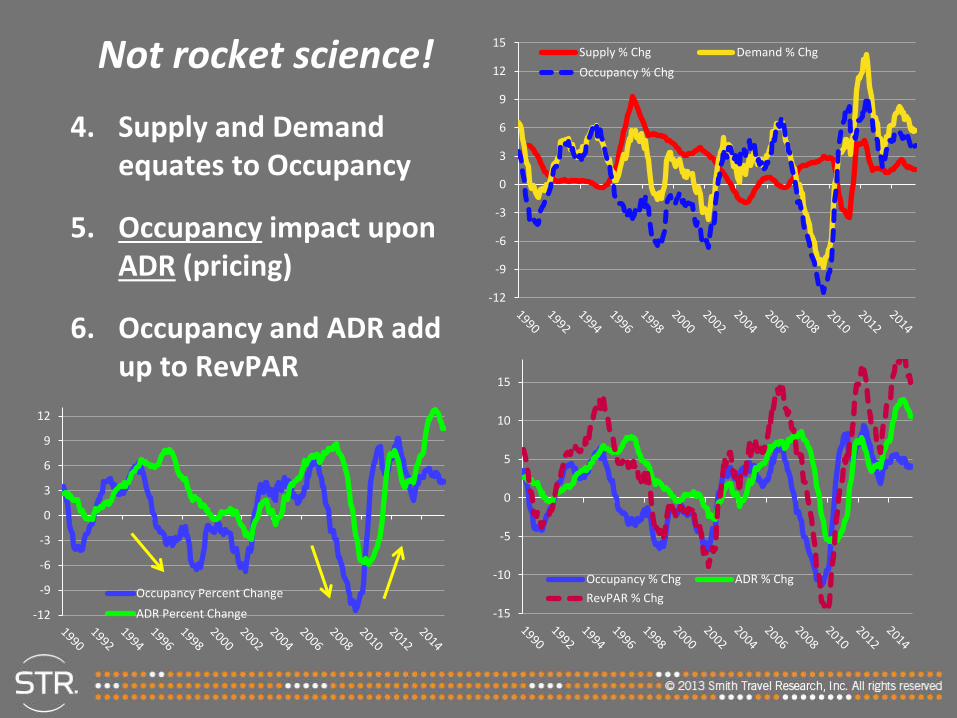
Not rocket science!
4. Supply and Demand equates to Occupancy
5. Occupancy impact upon ADR (pricing)
6. Occupancy and ADR add up to RevPAR
-12
-9
-6
-3
0
3
6
9
12
15Supply % Chg Demand % Chg
Occupancy % Chg
-15
-10
-5
0
5
10
15
Occupancy % Chg ADR % Chg
RevPAR % Chg
-12
-9
-6
-3
0
3
6
9
12
Occupancy Percent Change
ADR Percent Change
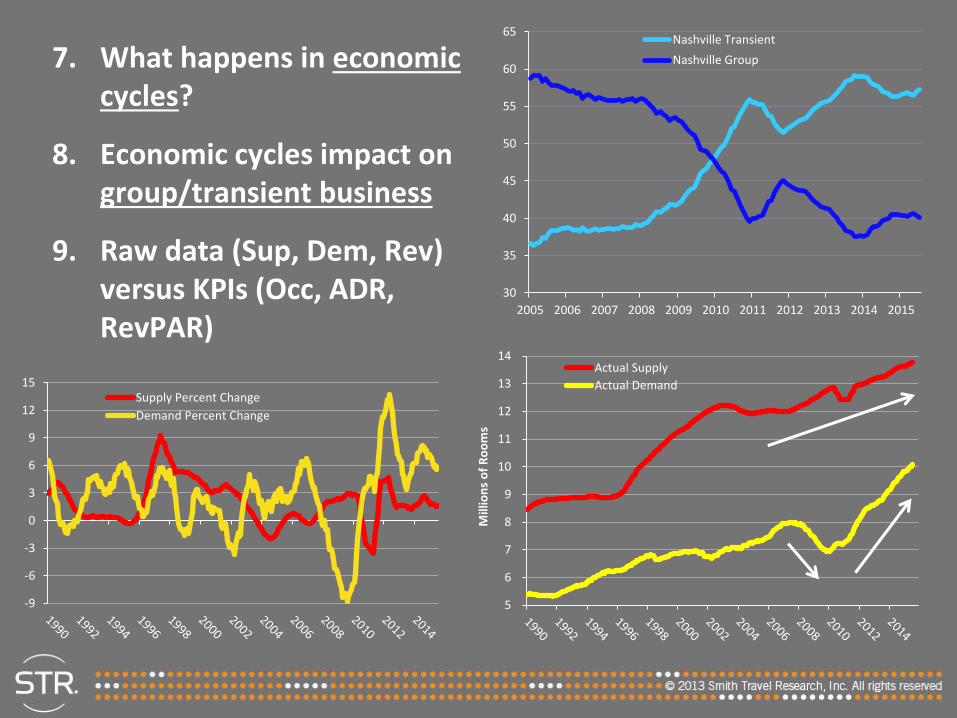
7. What happens in economic cycles?
8. Economic cycles impact on group/transient business
9. Raw data (Sup, Dem, Rev) versus KPIs (Occ, ADR, RevPAR)
-9
-6
-3
0
3
6
9
12
15Supply Percent Change
Demand Percent Change
5
6
7
8
9
10
11
12
13
14
Mill
ion
s o
f R
oo
ms
Actual Supply
Actual Demand
30
35
40
45
50
55
60
65
2005 2006 2007 2008 2009 2010 2011 2012 2013 2014 2015
Nashville Transient
Nashville Group
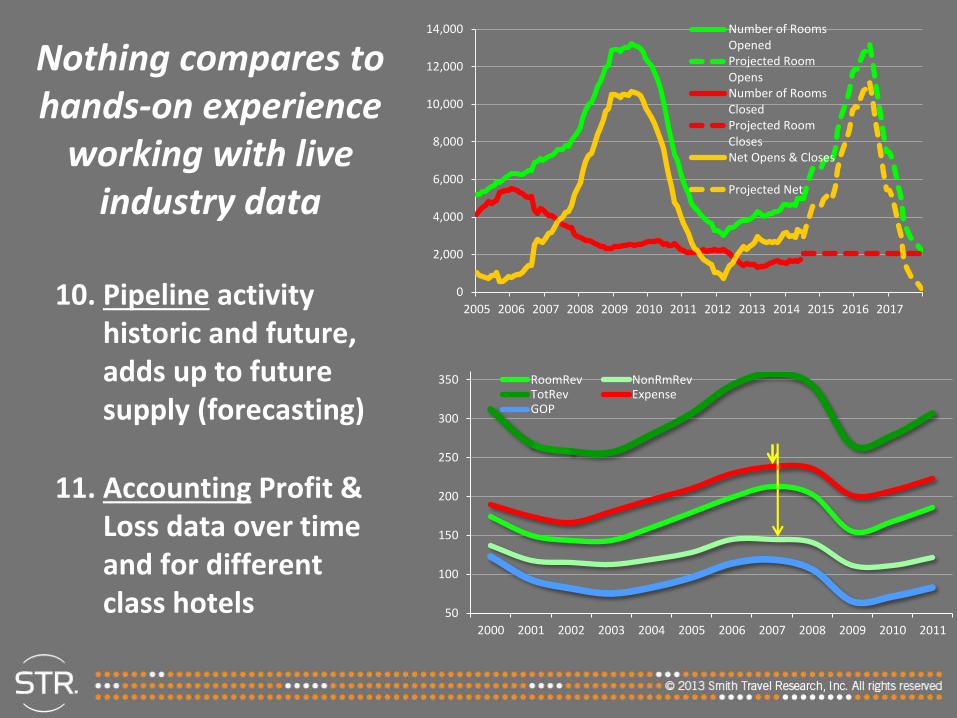
Nothing compares to hands-on experience
working with live industry data
10. Pipeline activity historic and future, adds up to future supply (forecasting)
11. Accounting Profit & Loss data over time and for different class hotels
0
2,000
4,000
6,000
8,000
10,000
12,000
14,000
2005 2006 2007 2008 2009 2010 2011 2012 2013 2014 2015 2016 2017
Number of RoomsOpenedProjected RoomOpensNumber of RoomsClosedProjected RoomClosesNet Opens & Closes
Projected Net
50
100
150
200
250
300
350
2000 2001 2002 2003 2004 2005 2006 2007 2008 2009 2010 2011
RoomRev NonRmRevTotRev ExpenseGOP

How to Conduct a Market Study,
Impact Analysis, or Feasibility Study
brand new!
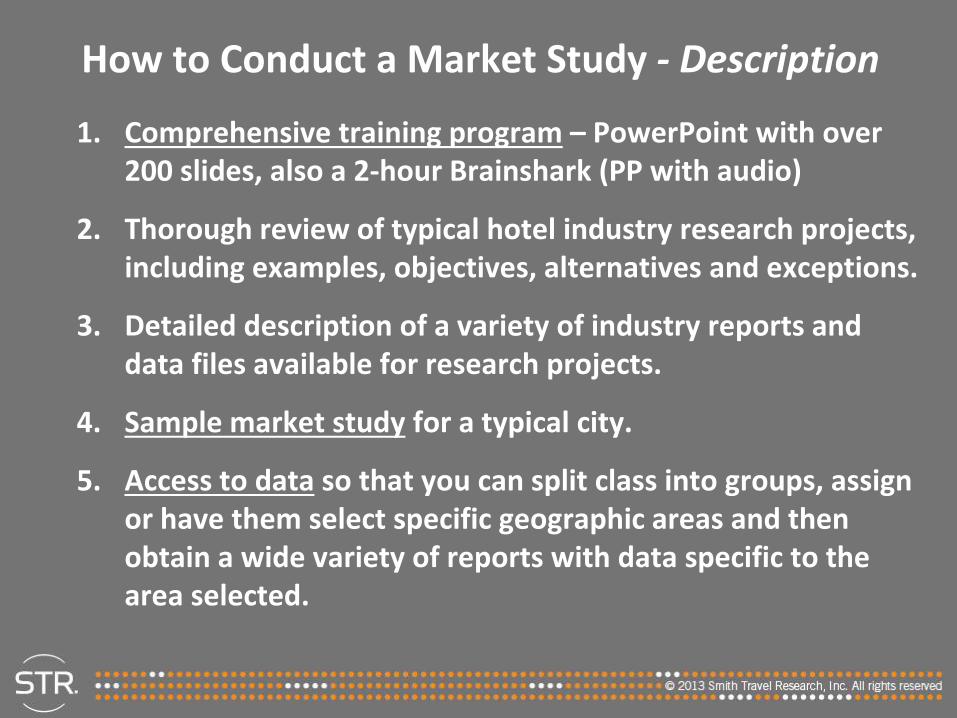
How to Conduct a Market Study - Description
1. Comprehensive training program – PowerPoint with over 200 slides, also a 2-hour Brainshark (PP with audio)
2. Thorough review of typical hotel industry research projects, including examples, objectives, alternatives and exceptions.
3. Detailed description of a variety of industry reports and data files available for research projects.
4. Sample market study for a typical city.
5. Access to data so that you can split class into groups, assign or have them select specific geographic areas and then obtain a wide variety of reports with data specific to the area selected.
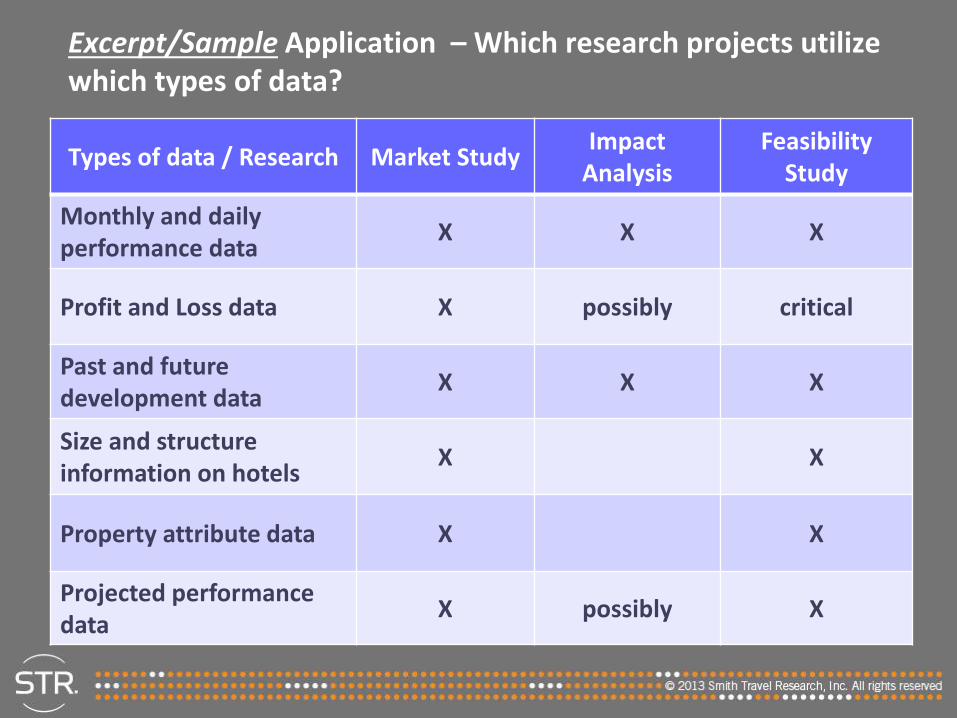
Excerpt/Sample Application – Which research projects utilize which types of data?
Types of data / Research Market StudyImpact
AnalysisFeasibility
Study
Monthly and daily performance data
X X X
Profit and Loss data X possibly critical
Past and future development data
X X X
Size and structureinformation on hotels
X X
Property attribute data X X
Projected performance data
X possibly X
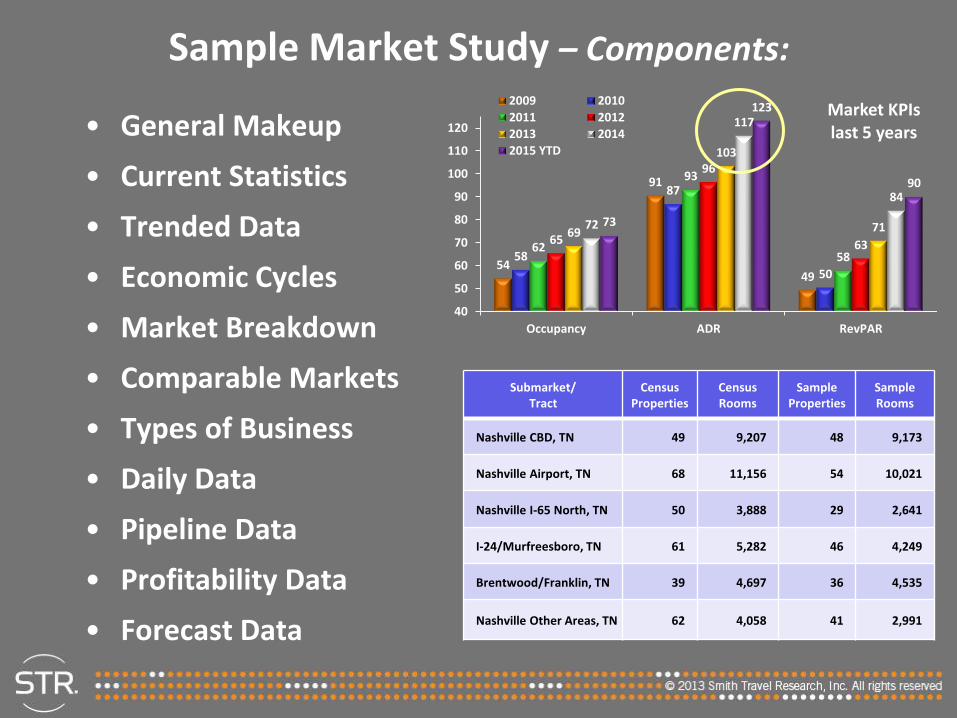
Sample Market Study – Components:
• General Makeup
• Current Statistics
• Trended Data
• Economic Cycles
• Market Breakdown
• Comparable Markets
• Types of Business
• Daily Data
• Pipeline Data
• Profitability Data
• Forecast Data
54
91
49
58
87
50
62
93
58
65
96
6369
103
7172
117
84
73
123
90
40
50
60
70
80
90
100
110
120
Occupancy ADR RevPAR
Market KPIslast 5 years
2009 2010
2011 2012
2013 2014
2015 YTD
Submarket/Tract
Census Properties
Census Rooms
Sample Properties
SampleRooms
Nashville CBD, TN 49 9,207 48 9,173
Nashville Airport, TN 68 11,156 54 10,021
Nashville I-65 North, TN 50 3,888 29 2,641
I-24/Murfreesboro, TN 61 5,282 46 4,249
Brentwood/Franklin, TN 39 4,697 36 4,535
Nashville Other Areas, TN 62 4,058 41 2,991

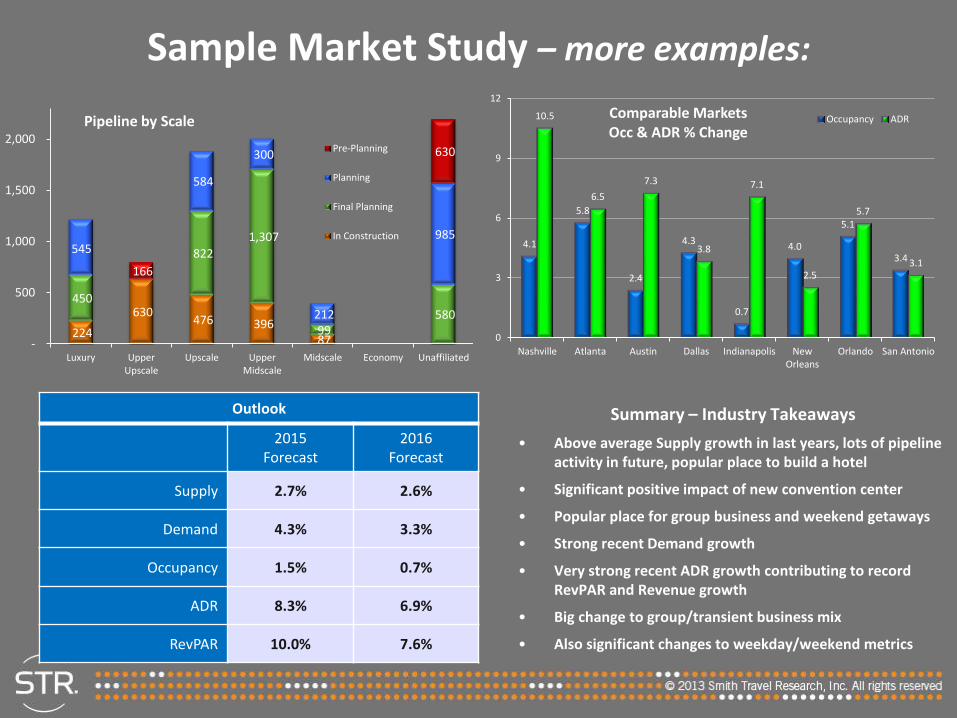
Sample Market Study – more examples:
80
100
120
140
Jan Feb Mar Apr May Jun Jul Aug Sep Oct Nov Dec
Market Seasonality
2010 2011 2012 2013 2014 2015
3.7
0.3
2.6
6.8
4.8
9.2
11.9
9.8
6.9
11.5
0
3
6
9
12
Luxury andUpper Upscale
Upscale UpperMidscale
Midscale Economy
Occupancy & ADR % Change by Class
Occupancy
ADR
50
62
6869 68
7576
53
65
73 7372
78 79
56
69
76 76
73
8081
40
50
60
70
80
Sun Mon Tue Wed Thur Fri Sat
Day of WeekOccupancy
2013 2014 2015
30
40
50
60
2005 2006 2007 2008 2009 2010 2011 2012 2013 2014 2015
Business Mix, Group vs. Transient
Nashville Transient Nashville Group
Sample Market Study – more examples:
4.1
5.8
2.4
4.3
0.7
4.0
5.1
3.4
10.5
6.5
7.3
3.8
7.1
2.5
5.7
3.1
0
3
6
9
12
Nashville Atlanta Austin Dallas Indianapolis NewOrleans
Orlando San Antonio
Comparable Markets Occ & ADR % Change
Occupancy ADR
224
630 476 396
87
450
822
1,307
99 580
545
584
300
212
985
166
630
-
500
1,000
1,500
2,000
Luxury UpperUpscale
Upscale UpperMidscale
Midscale Economy Unaffiliated
Pipeline by Scale
Pre-Planning
Planning
Final Planning
In Construction
Outlook
2015Forecast
2016Forecast
Supply 2.7% 2.6%
Demand 4.3% 3.3%
Occupancy 1.5% 0.7%
ADR 8.3% 6.9%
RevPAR 10.0% 7.6%
Summary – Industry Takeaways
• Above average Supply growth in last years, lots of pipeline activity in future, popular place to build a hotel
• Significant positive impact of new convention center
• Popular place for group business and weekend getaways
• Strong recent Demand growth
• Very strong recent ADR growth contributing to record RevPAR and Revenue growth
• Big change to group/transient business mix
• Also significant changes to weekday/weekend metrics

Hospitality and Tourism
Future Trendsnew!
• Over 100 slides on current issues, hot topics and industry challenges
• Also industry relevant research ideas for professors and students
• Updated on regular basis, downloadable from SHARE Center Dropbox

Future Trends in Hospitality and Tourism
1. Performance Trends
2. Development Trends
3. Hotel Branding
4. Revenue Management
5. Technology Trends
6. Sharing Economy
7. International Tourism Trends
Conclusion - “Unprecedented time of oppor-tunity for Hospitality & Tourism education!”
0
1
2
3
4
5
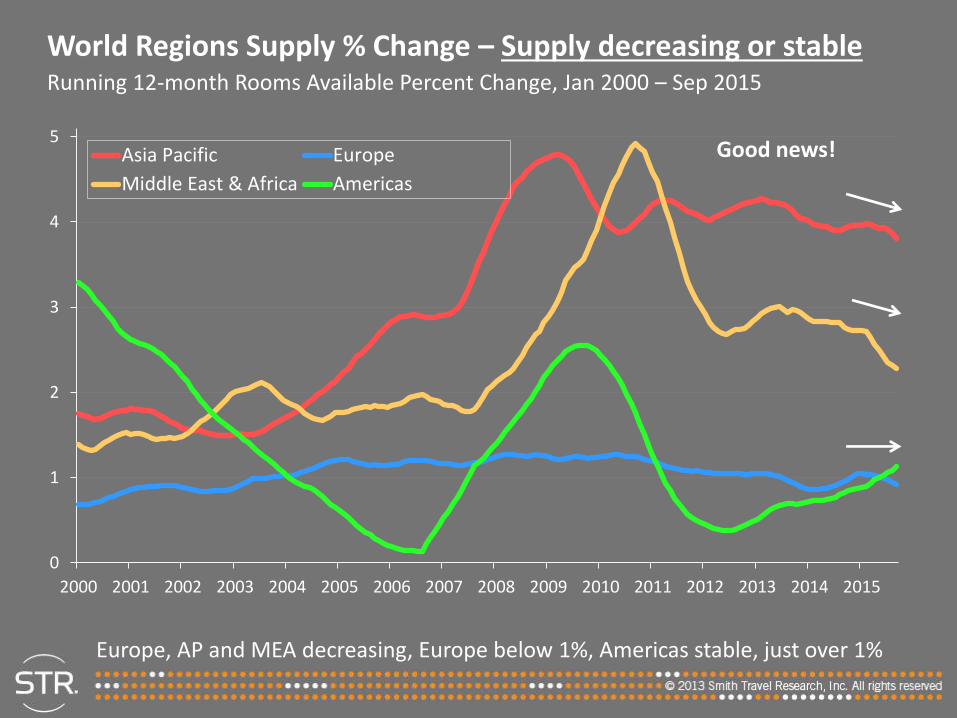
2000 2001 2002 2003 2004 2005 2006 2007 2008 2009 2010 2011 2012 2013 2014 2015
Asia Pacific Europe
Middle East & Africa Americas
World Regions Supply % Change – Supply decreasing or stableRunning 12-month Rooms Available Percent Change, Jan 2000 – Sep 2015
Europe, AP and MEA decreasing, Europe below 1%, Americas stable, just over 1%
Good news!
-6
0
6
12
18
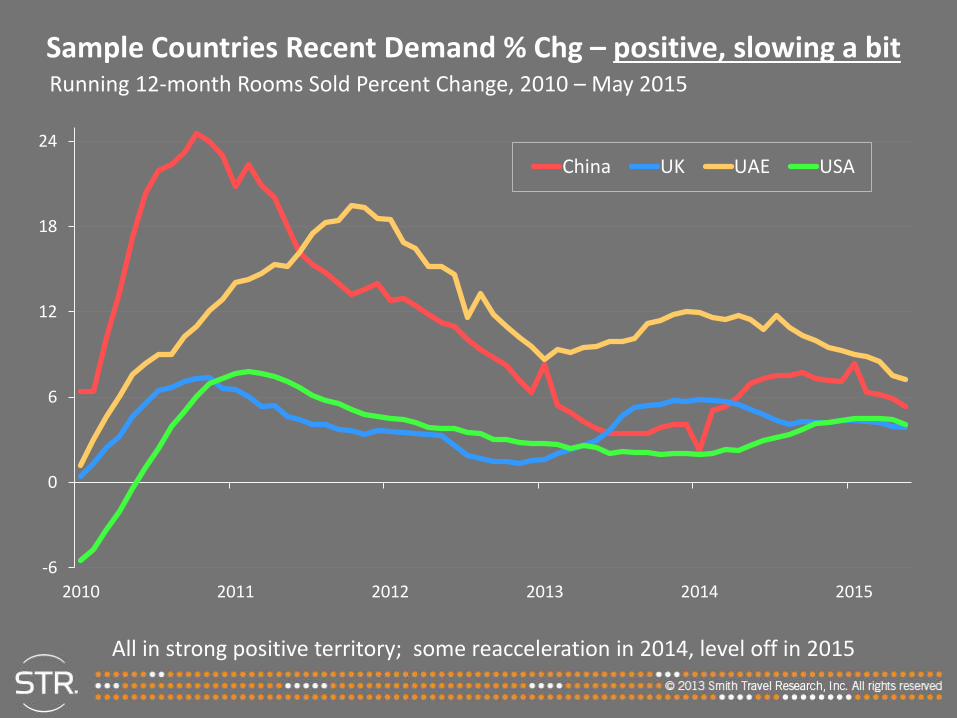
24
2010 2011 2012 2013 2014 2015
China UK UAE USA
Sample Countries Recent Demand % Chg – positive, slowing a bitRunning 12-month Rooms Sold Percent Change, 2010 – May 2015
All in strong positive territory; some reacceleration in 2014, level off in 2015
50
55
60
65
70
75
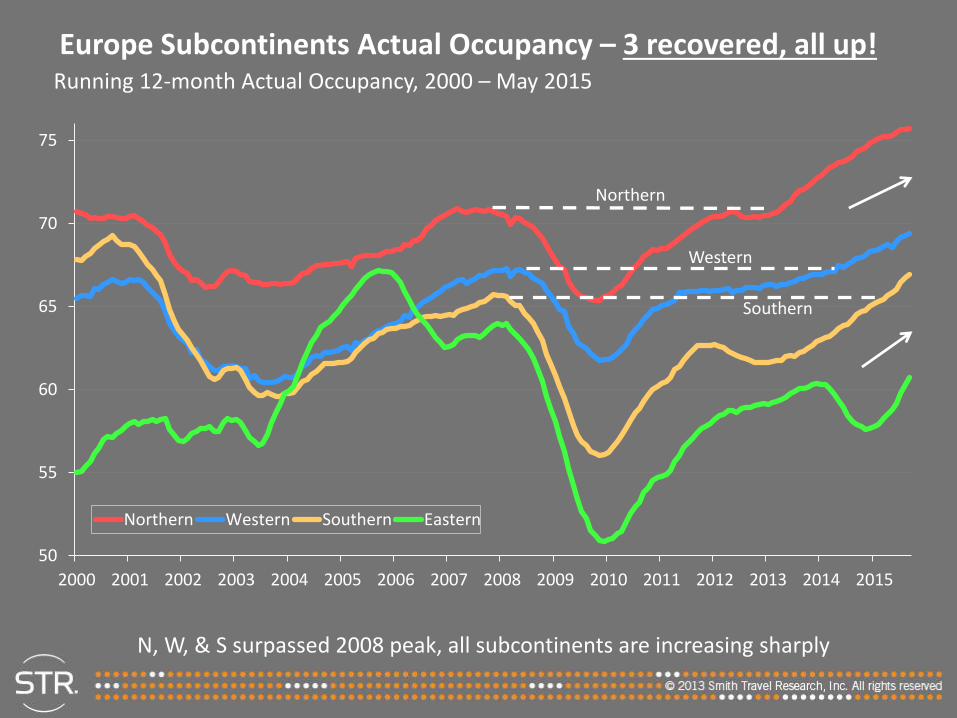
2000 2001 2002 2003 2004 2005 2006 2007 2008 2009 2010 2011 2012 2013 2014 2015
Northern Western Southern Eastern
Europe Subcontinents Actual Occupancy – 3 recovered, all up!Running 12-month Actual Occupancy, 2000 – May 2015
N, W, & S surpassed 2008 peak, all subcontinents are increasing sharply
Northern
Western
Southern
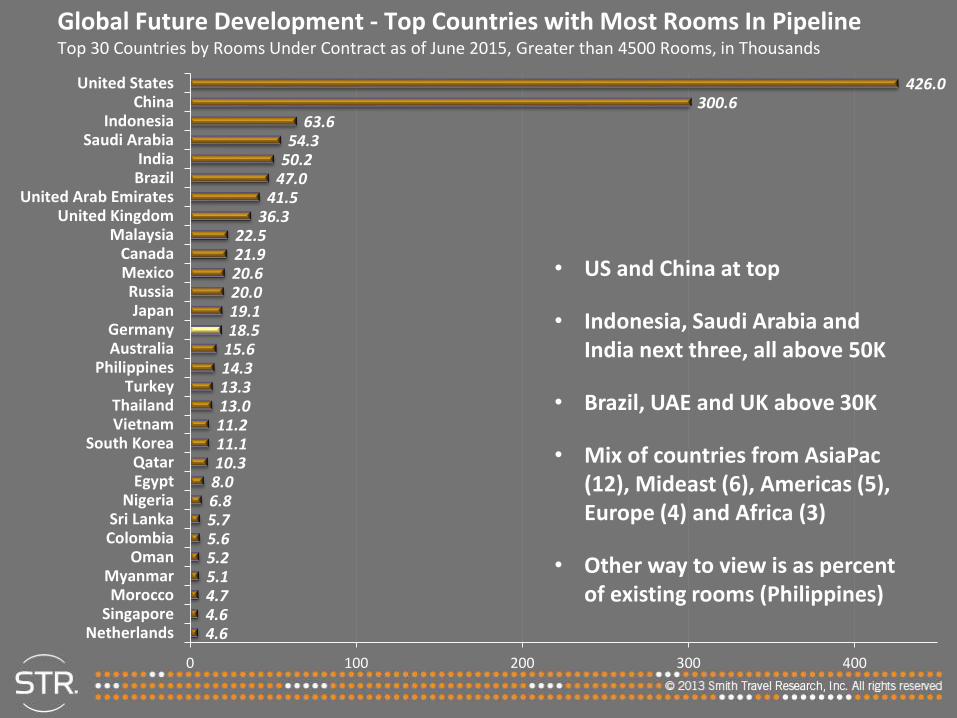
Global Future Development - Top Countries with Most Rooms In PipelineTop 30 Countries by Rooms Under Contract as of June 2015, Greater than 4500 Rooms, in Thousands
4.64.64.75.15.25.65.76.88.010.311.111.213.013.314.315.618.519.120.020.621.922.5
36.341.5
47.050.254.3
63.6300.6
426.0
0 100 200 300 400
NetherlandsSingapore
MoroccoMyanmar
OmanColombiaSri Lanka
NigeriaEgyptQatar
South KoreaVietnamThailand
TurkeyPhilippines
AustraliaGermany
JapanRussia
MexicoCanada
MalaysiaUnited Kingdom
United Arab EmiratesBrazilIndia
Saudi ArabiaIndonesia
ChinaUnited States
Thousands
• US and China at top
• Indonesia, Saudi Arabia and India next three, all above 50K
• Brazil, UAE and UK above 30K
• Mix of countries from AsiaPac(12), Mideast (6), Americas (5), Europe (4) and Africa (3)
• Other way to view is as percent of existing rooms (Philippines)
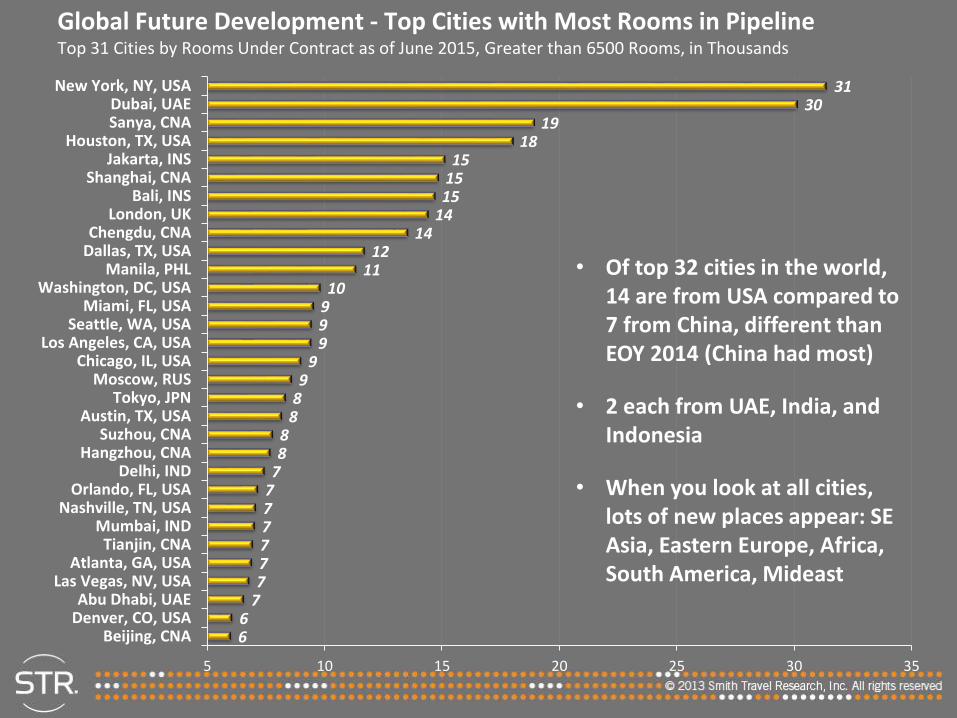
Global Future Development - Top Cities with Most Rooms in PipelineTop 31 Cities by Rooms Under Contract as of June 2015, Greater than 6500 Rooms, in Thousands
66
7777777788
889
999910
1112
1414151515
1819
3031
5 10 15 20 25 30 35
Beijing, CNADenver, CO, USAAbu Dhabi, UAE
Las Vegas, NV, USAAtlanta, GA, USA
Tianjin, CNAMumbai, IND
Nashville, TN, USAOrlando, FL, USA
Delhi, INDHangzhou, CNA
Suzhou, CNAAustin, TX, USA
Tokyo, JPNMoscow, RUS
Chicago, IL, USALos Angeles, CA, USA
Seattle, WA, USAMiami, FL, USA
Washington, DC, USAManila, PHL
Dallas, TX, USAChengdu, CNA
London, UKBali, INS
Shanghai, CNAJakarta, INS
Houston, TX, USASanya, CNADubai, UAE
New York, NY, USA
Thousands
• Of top 32 cities in the world, 14 are from USA compared to 7 from China, different than EOY 2014 (China had most)
• 2 each from UAE, India, and Indonesia
• When you look at all cities, lots of new places appear: SE Asia, Eastern Europe, Africa, South America, Mideast
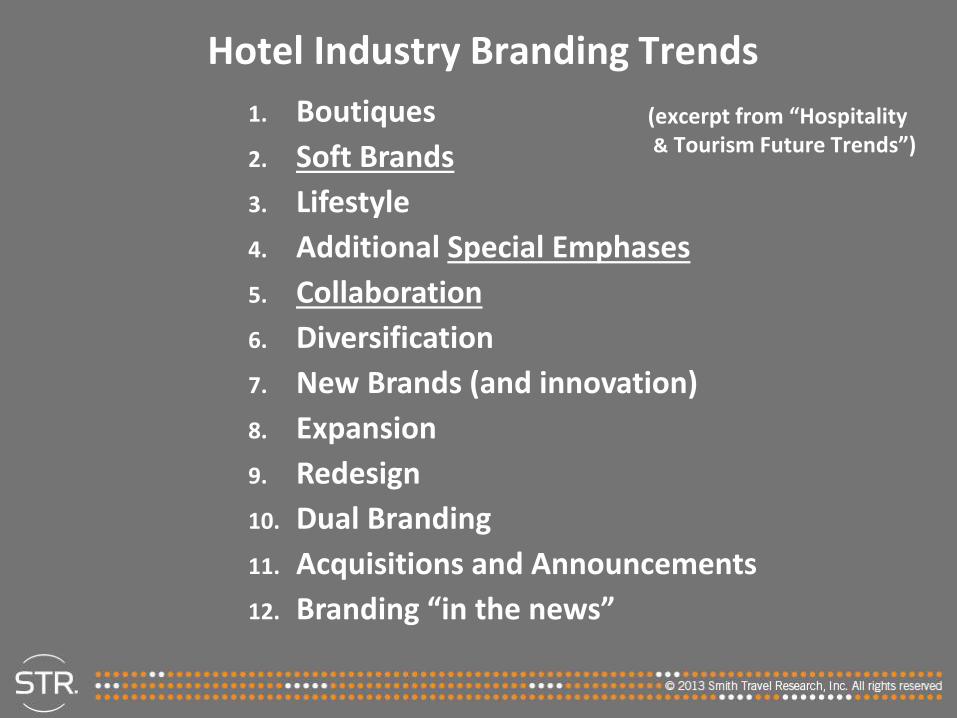
Hotel Industry Branding Trends
1. Boutiques
2. Soft Brands
3. Lifestyle
4. Additional Special Emphases
5. Collaboration
6. Diversification
7. New Brands (and innovation)
8. Expansion
9. Redesign
10. Dual Branding
11. Acquisitions and Announcements
12. Branding “in the news”
(excerpt from “Hospitality& Tourism Future Trends”)
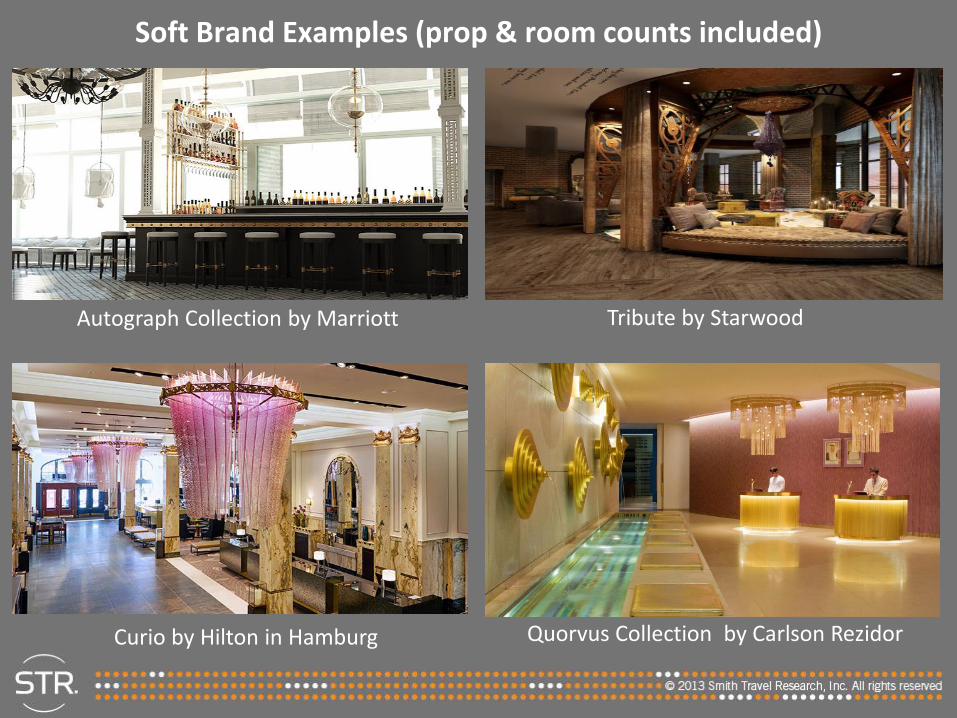
Soft Brand Examples (prop & room counts included)
Autograph Collection by Marriott Tribute by Starwood
Curio by Hilton in Hamburg Quorvus Collection by Carlson Rezidor
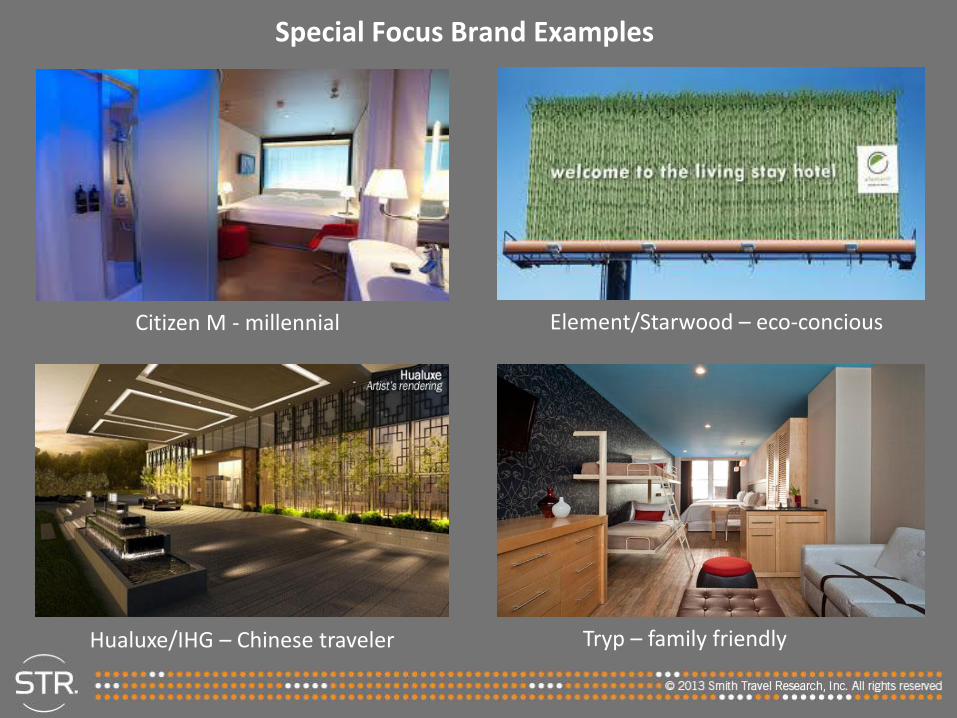
Special Focus Brand Examples
Citizen M - millennial Element/Starwood – eco-concious
Hualuxe/IHG – Chinese traveler Tryp – family friendly
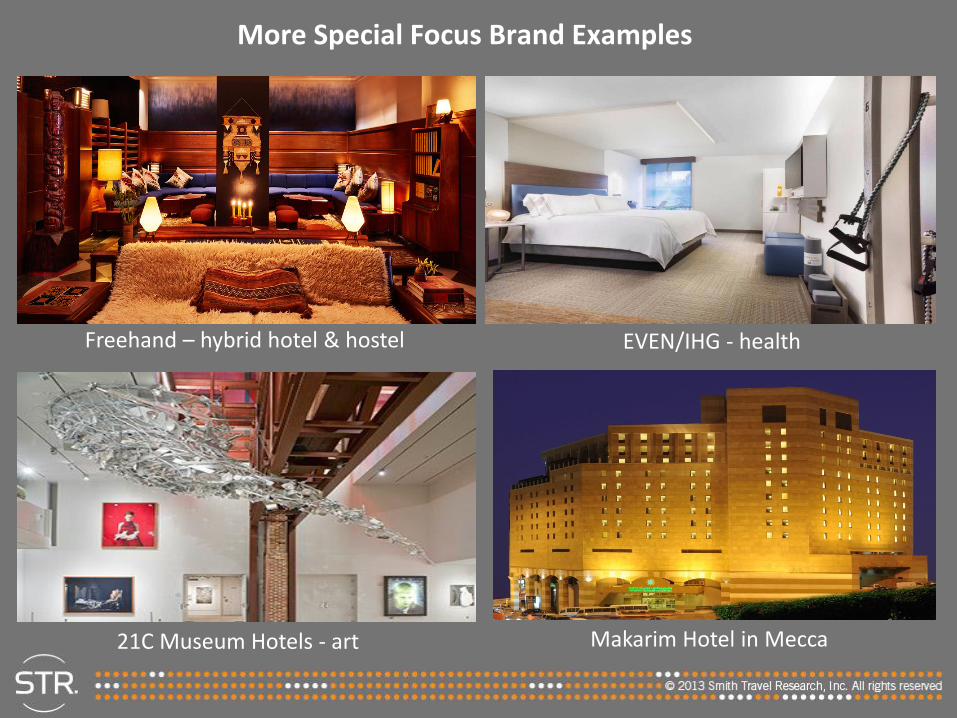
More Special Focus Brand Examples
EVEN/IHG - health
21C Museum Hotels - art
Freehand – hybrid hotel & hostel
Makarim Hotel in Mecca
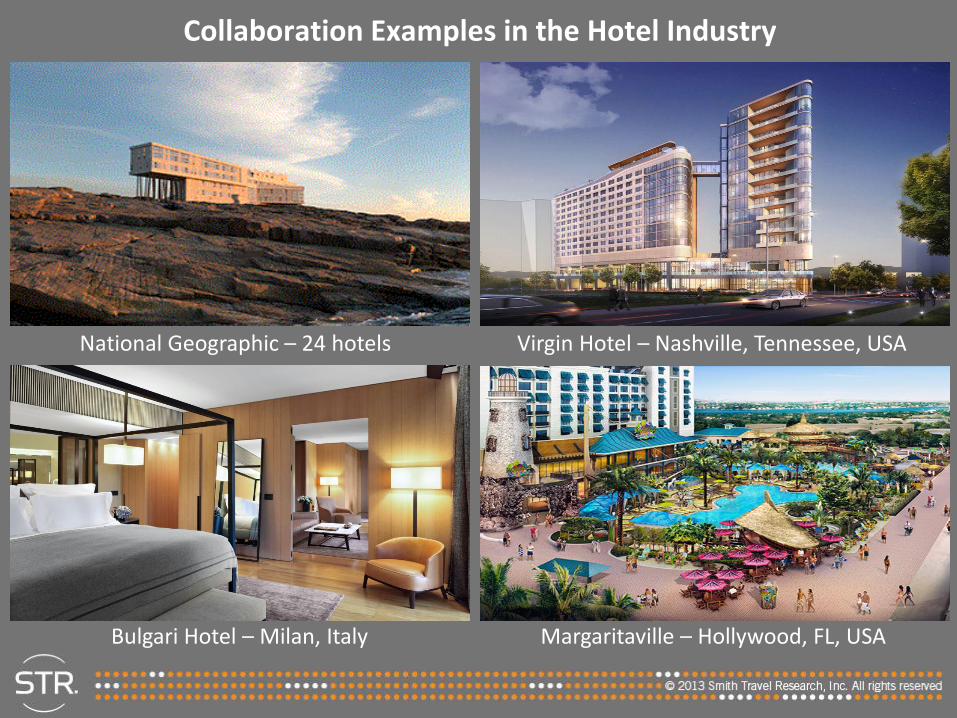
Collaboration Examples in the Hotel Industry
National Geographic – 24 hotels Virgin Hotel – Nashville, Tennessee, USA
Bulgari Hotel – Milan, Italy Margaritaville – Hollywood, FL, USA
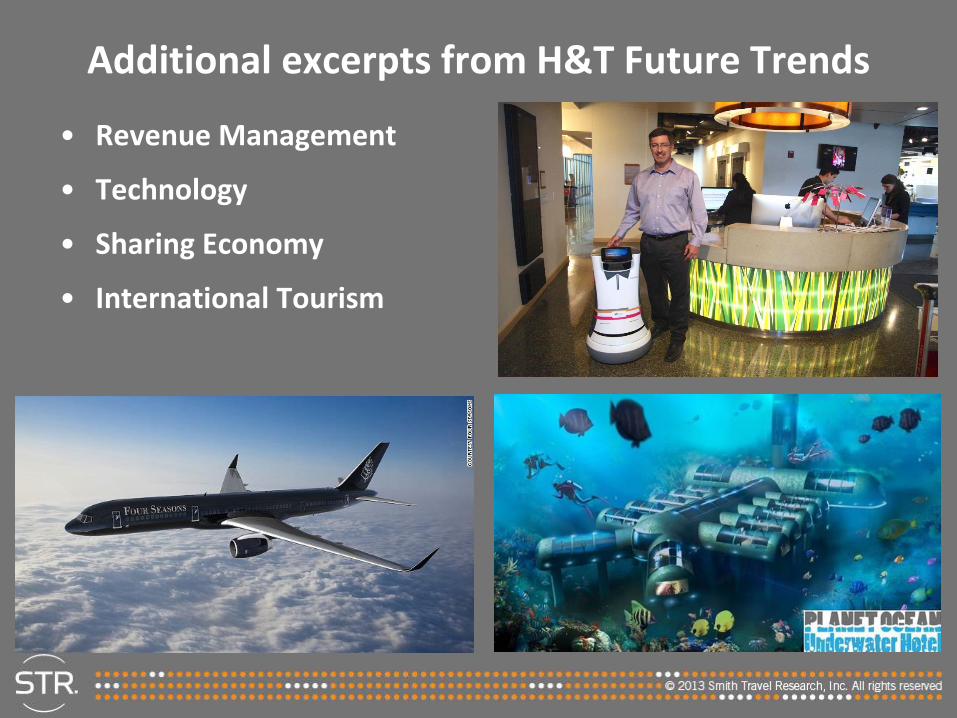
Additional excerpts from H&T Future Trends
• Revenue Management
• Technology
• Sharing Economy
• International Tourism
Certification in Hotel Industry Analytics
The CHIA training program covers critical industry
foundations (terminology, formulas and
methodologies, analytical skills) and includes many
application exercises
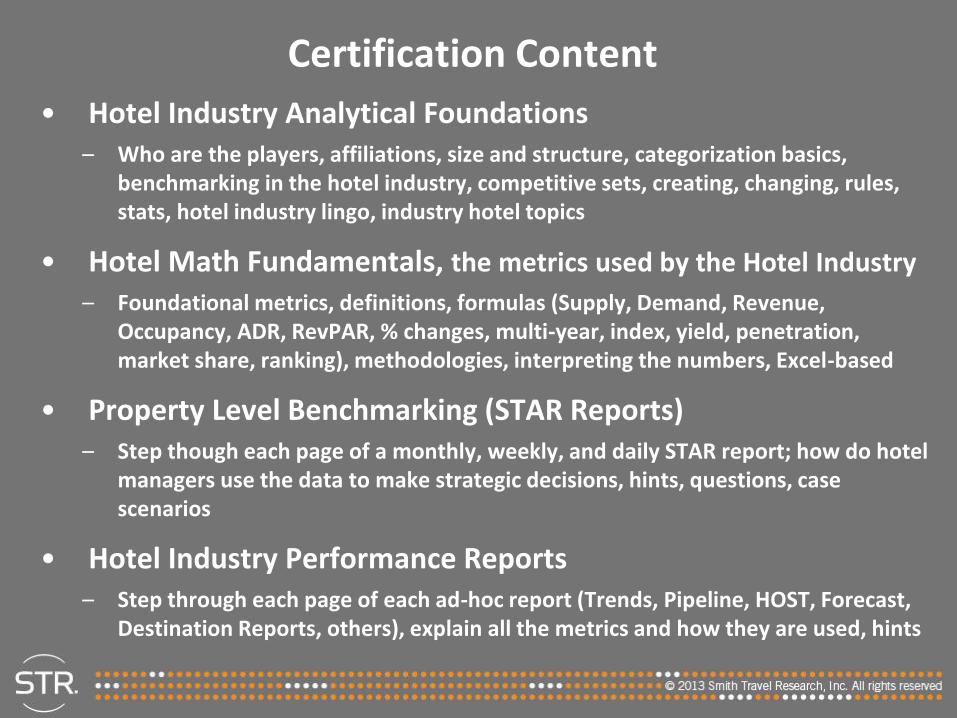
Certification Content
• Hotel Industry Analytical Foundations– Who are the players, affiliations, size and structure, categorization basics,
benchmarking in the hotel industry, competitive sets, creating, changing, rules, stats, hotel industry lingo, industry hotel topics
• Hotel Math Fundamentals, the metrics used by the Hotel Industry
– Foundational metrics, definitions, formulas (Supply, Demand, Revenue, Occupancy, ADR, RevPAR, % changes, multi-year, index, yield, penetration, market share, ranking), methodologies, interpreting the numbers, Excel-based
• Property Level Benchmarking (STAR Reports)– Step though each page of a monthly, weekly, and daily STAR report; how do hotel
managers use the data to make strategic decisions, hints, questions, case scenarios
• Hotel Industry Performance Reports – Step through each page of each ad-hoc report (Trends, Pipeline, HOST, Forecast,
Destination Reports, others), explain all the metrics and how they are used, hints
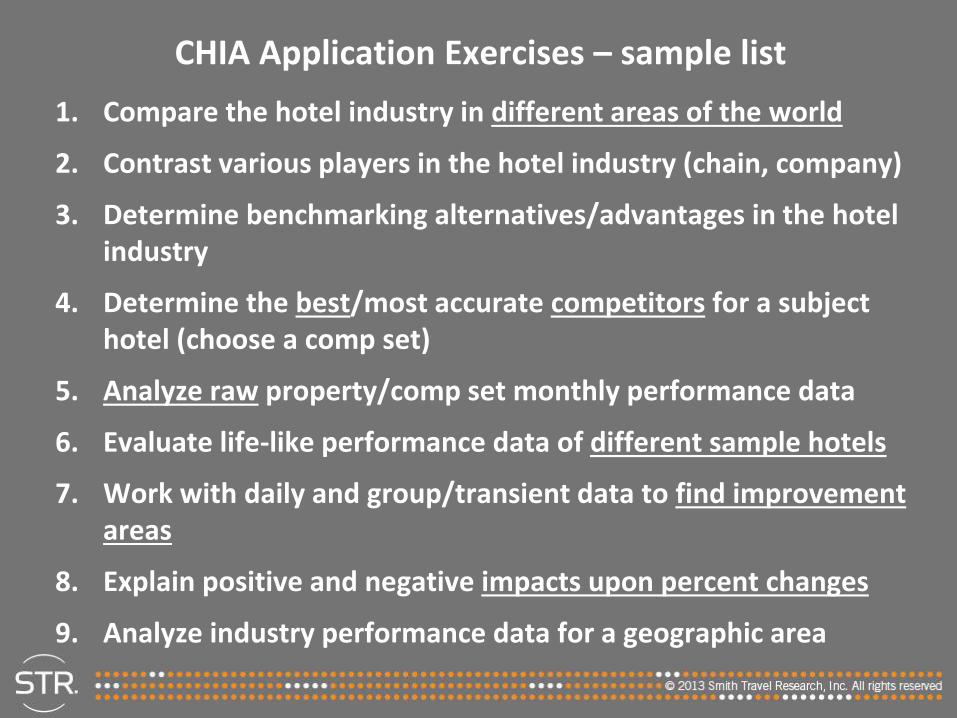
CHIA Application Exercises – sample list
1. Compare the hotel industry in different areas of the world
2. Contrast various players in the hotel industry (chain, company)
3. Determine benchmarking alternatives/advantages in the hotel industry
4. Determine the best/most accurate competitors for a subject hotel (choose a comp set)
5. Analyze raw property/comp set monthly performance data
6. Evaluate life-like performance data of different sample hotels
7. Work with daily and group/transient data to find improvement areas
8. Explain positive and negative impacts upon percent changes
9. Analyze industry performance data for a geographic area
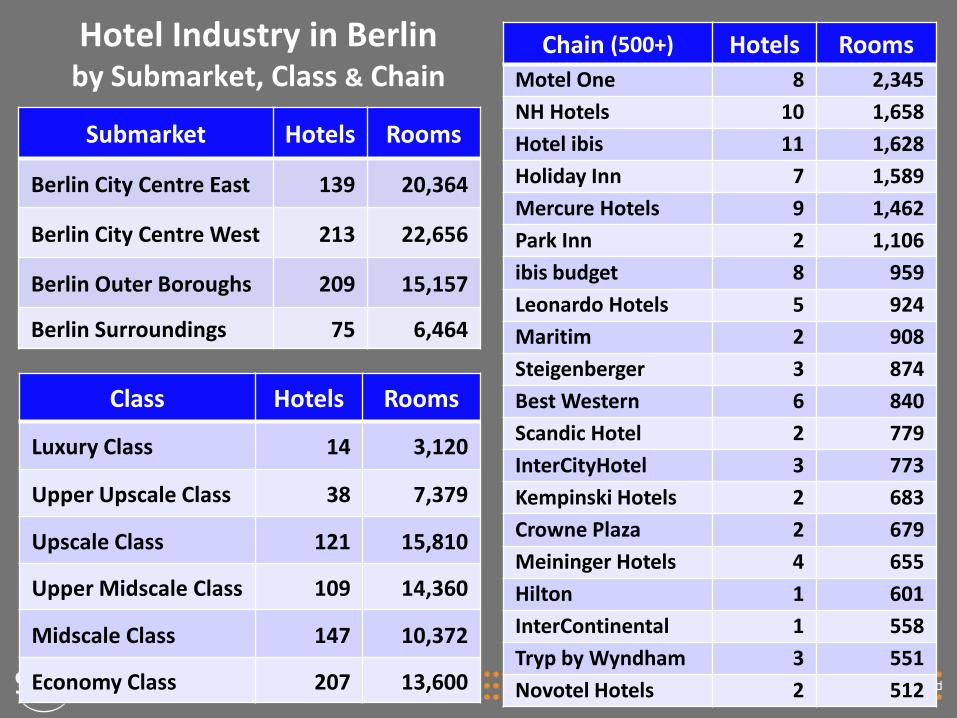
Hotel Industry in Berlin by Submarket, Class & Chain
Submarket Hotels Rooms
Berlin City Centre East 139 20,364
Berlin City Centre West 213 22,656
Berlin Outer Boroughs 209 15,157
Berlin Surroundings 75 6,464
Class Hotels Rooms
Luxury Class 14 3,120
Upper Upscale Class 38 7,379
Upscale Class 121 15,810
Upper Midscale Class 109 14,360
Midscale Class 147 10,372
Economy Class 207 13,600
Chain (500+) Hotels Rooms
Motel One 8 2,345
NH Hotels 10 1,658
Hotel ibis 11 1,628
Holiday Inn 7 1,589
Mercure Hotels 9 1,462
Park Inn 2 1,106
ibis budget 8 959
Leonardo Hotels 5 924
Maritim 2 908
Steigenberger 3 874
Best Western 6 840
Scandic Hotel 2 779
InterCityHotel 3 773
Kempinski Hotels 2 683
Crowne Plaza 2 679
Meininger Hotels 4 655
Hilton 1 601
InterContinental 1 558
Tryp by Wyndham 3 551
Novotel Hotels 2 512
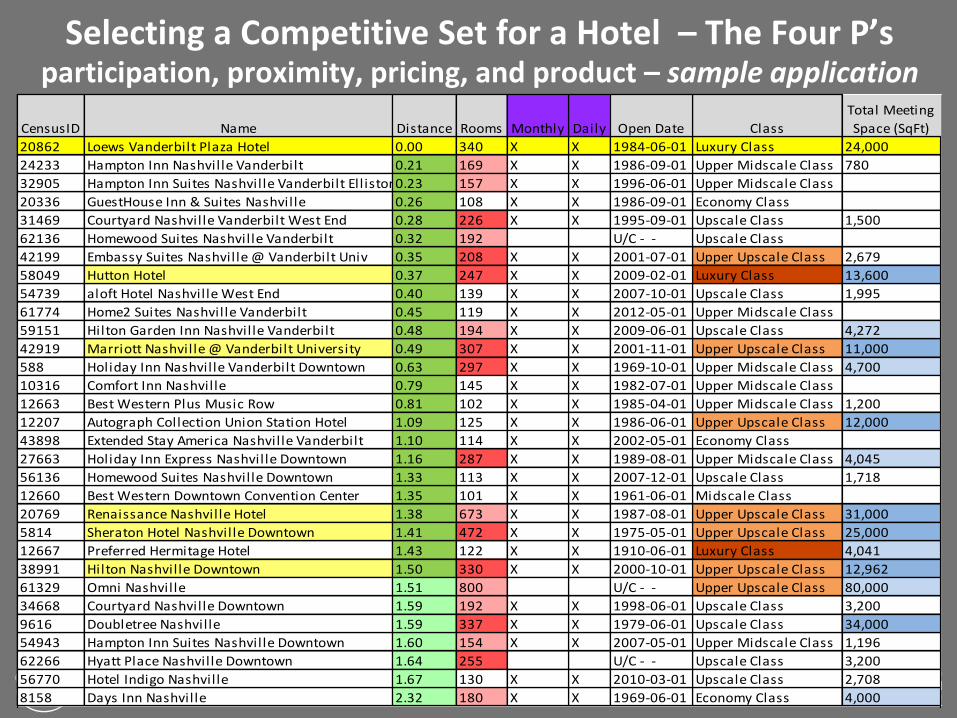
Selecting a Competitive Set for a Hotel – The Four P’sparticipation, proximity, pricing, and product – sample application
CensusID Name Distance Rooms Monthly Daily Open Date Class
Total Meeting
Space (SqFt)
20862 Loews Vanderbilt Plaza Hotel 0.00 340 X X 1984-06-01 Luxury Class 24,000
24233 Hampton Inn Nashville Vanderbilt 0.21 169 X X 1986-09-01 Upper Midscale Class 780
32905 Hampton Inn Suites Nashville Vanderbilt Ell iston Place0.23 157 X X 1996-06-01 Upper Midscale Class
20336 GuestHouse Inn & Suites Nashville 0.26 108 X X 1986-09-01 Economy Class
31469 Courtyard Nashville Vanderbilt West End 0.28 226 X X 1995-09-01 Upscale Class 1,500
62136 Homewood Suites Nashville Vanderbilt 0.32 192 U/C - - Upscale Class
42199 Embassy Suites Nashville @ Vanderbilt Univ 0.35 208 X X 2001-07-01 Upper Upscale Class 2,679
58049 Hutton Hotel 0.37 247 X X 2009-02-01 Luxury Class 13,600
54739 aloft Hotel Nashville West End 0.40 139 X X 2007-10-01 Upscale Class 1,995
61774 Home2 Suites Nashville Vanderbilt 0.45 119 X X 2012-05-01 Upper Midscale Class
59151 Hilton Garden Inn Nashville Vanderbilt 0.48 194 X X 2009-06-01 Upscale Class 4,272
42919 Marriott Nashville @ Vanderbilt University 0.49 307 X X 2001-11-01 Upper Upscale Class 11,000
588 Holiday Inn Nashville Vanderbilt Downtown 0.63 297 X X 1969-10-01 Upper Midscale Class 4,700
10316 Comfort Inn Nashville 0.79 145 X X 1982-07-01 Upper Midscale Class
12663 Best Western Plus Music Row 0.81 102 X X 1985-04-01 Upper Midscale Class 1,200
12207 Autograph Collection Union Station Hotel 1.09 125 X X 1986-06-01 Upper Upscale Class 12,000
43898 Extended Stay America Nashville Vanderbilt 1.10 114 X X 2002-05-01 Economy Class
27663 Holiday Inn Express Nashville Downtown 1.16 287 X X 1989-08-01 Upper Midscale Class 4,045
56136 Homewood Suites Nashville Downtown 1.33 113 X X 2007-12-01 Upscale Class 1,718
12660 Best Western Downtown Convention Center 1.35 101 X X 1961-06-01 Midscale Class
20769 Renaissance Nashville Hotel 1.38 673 X X 1987-08-01 Upper Upscale Class 31,000
5814 Sheraton Hotel Nashville Downtown 1.41 472 X X 1975-05-01 Upper Upscale Class 25,000
12667 Preferred Hermitage Hotel 1.43 122 X X 1910-06-01 Luxury Class 4,041
38991 Hilton Nashville Downtown 1.50 330 X X 2000-10-01 Upper Upscale Class 12,962
61329 Omni Nashville 1.51 800 U/C - - Upper Upscale Class 80,000
34668 Courtyard Nashville Downtown 1.59 192 X X 1998-06-01 Upscale Class 3,200
9616 Doubletree Nashville 1.59 337 X X 1979-06-01 Upscale Class 34,000
54943 Hampton Inn Suites Nashville Downtown 1.60 154 X X 2007-05-01 Upper Midscale Class 1,196
62266 Hyatt Place Nashville Downtown 1.64 255 U/C - - Upscale Class 3,200
56770 Hotel Indigo Nashville 1.67 130 X X 2010-03-01 Upscale Class 2,708
8158 Days Inn Nashville 2.32 180 X X 1969-06-01 Economy Class 4,000

GM Explanations for Performance Percent Changes
Positive Percent Changes
1. I’m a good general manager
2. I have a great staff
Negative Percent Changes
1. Economic cycles – in downturn, everyone negative
2. Calendar issues – different number of WD/WE days
3. Holiday issues – holiday such as Valentines day, Easter, …
4. Special event (last year) –conference, sporting, weather, …
5. Hotel-specific event – such as a renovation, cancellation, …
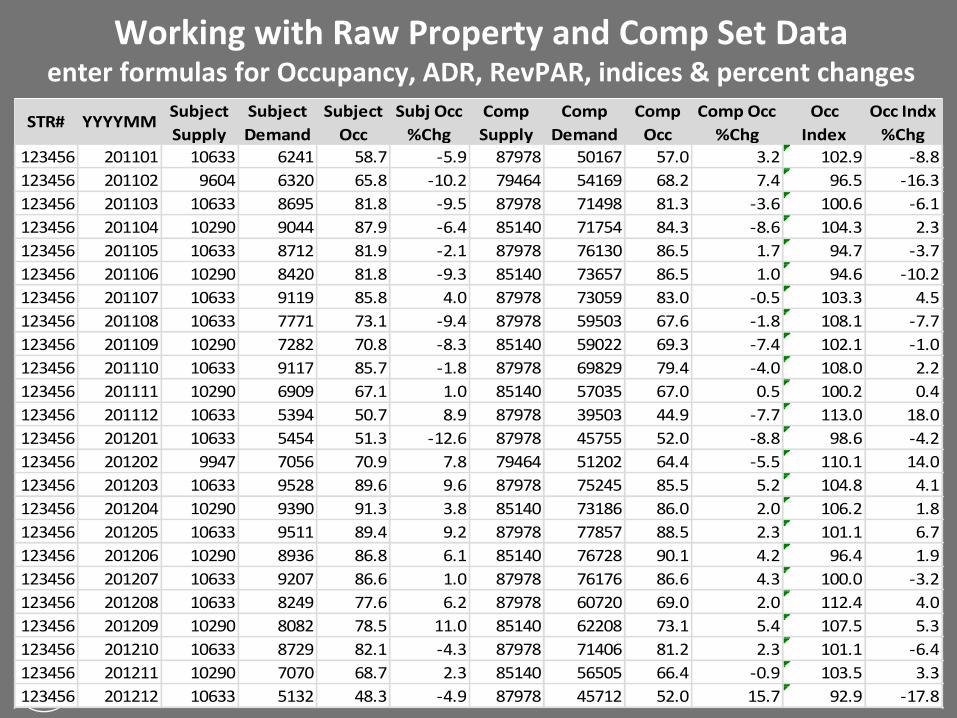
Working with Raw Property and Comp Set Dataenter formulas for Occupancy, ADR, RevPAR, indices & percent changes
STR# YYYYMMSubject
Supply
Subject
Demand
Subject
Occ
Subj Occ
%Chg
Comp
Supply
Comp
Demand
Comp
Occ
Comp Occ
%Chg
Occ
Index
Occ Indx
%Chg
123456 201101 10633 6241 58.7 -5.9 87978 50167 57.0 3.2 102.9 -8.8
123456 201102 9604 6320 65.8 -10.2 79464 54169 68.2 7.4 96.5 -16.3
123456 201103 10633 8695 81.8 -9.5 87978 71498 81.3 -3.6 100.6 -6.1
123456 201104 10290 9044 87.9 -6.4 85140 71754 84.3 -8.6 104.3 2.3
123456 201105 10633 8712 81.9 -2.1 87978 76130 86.5 1.7 94.7 -3.7
123456 201106 10290 8420 81.8 -9.3 85140 73657 86.5 1.0 94.6 -10.2
123456 201107 10633 9119 85.8 4.0 87978 73059 83.0 -0.5 103.3 4.5
123456 201108 10633 7771 73.1 -9.4 87978 59503 67.6 -1.8 108.1 -7.7
123456 201109 10290 7282 70.8 -8.3 85140 59022 69.3 -7.4 102.1 -1.0
123456 201110 10633 9117 85.7 -1.8 87978 69829 79.4 -4.0 108.0 2.2
123456 201111 10290 6909 67.1 1.0 85140 57035 67.0 0.5 100.2 0.4
123456 201112 10633 5394 50.7 8.9 87978 39503 44.9 -7.7 113.0 18.0
123456 201201 10633 5454 51.3 -12.6 87978 45755 52.0 -8.8 98.6 -4.2
123456 201202 9947 7056 70.9 7.8 79464 51202 64.4 -5.5 110.1 14.0
123456 201203 10633 9528 89.6 9.6 87978 75245 85.5 5.2 104.8 4.1
123456 201204 10290 9390 91.3 3.8 85140 73186 86.0 2.0 106.2 1.8
123456 201205 10633 9511 89.4 9.2 87978 77857 88.5 2.3 101.1 6.7
123456 201206 10290 8936 86.8 6.1 85140 76728 90.1 4.2 96.4 1.9
123456 201207 10633 9207 86.6 1.0 87978 76176 86.6 4.3 100.0 -3.2
123456 201208 10633 8249 77.6 6.2 87978 60720 69.0 2.0 112.4 4.0
123456 201209 10290 8082 78.5 11.0 85140 62208 73.1 5.4 107.5 5.3
123456 201210 10633 8729 82.1 -4.3 87978 71406 81.2 2.3 101.1 -6.4
123456 201211 10290 7070 68.7 2.3 85140 56505 66.4 -0.9 103.5 3.3
123456 201212 10633 5132 48.3 -4.9 87978 45712 52.0 15.7 92.9 -17.8
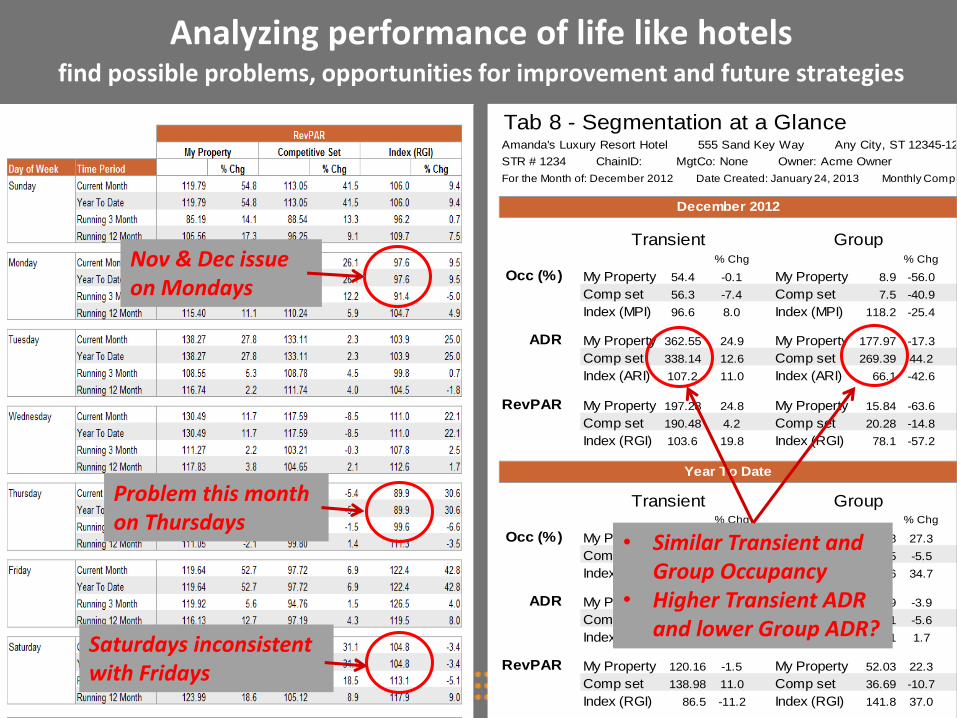
Analyzing performance of life like hotelsfind possible problems, opportunities for improvement and future strategies
Nov & Dec issue on Mondays
Problem this month on Thursdays
Saturdays inconsistent with Fridays
Tab 8 - Segmentation at a Glance
% Chg % Chg
Occ (%) My Property 54.4 -0.1 My Property 8.9 -56.0
Comp set 56.3 -7.4 Comp set 7.5 -40.9
Index (MPI) 96.6 8.0 Index (MPI) 118.2 -25.4
ADR My Property 362.55 24.9 My Property 177.97 -17.3
Comp set 338.14 12.6 Comp set 269.39 44.2
Index (ARI) 107.2 11.0 Index (ARI) 66.1 -42.6
RevPAR My Property 197.28 24.8 My Property 15.84 -63.6
Comp set 190.48 4.2 Comp set 20.28 -14.8
Index (RGI) 103.6 19.8 Index (RGI) 78.1 -57.2
% Chg % Chg
Occ (%) My Property 43.7 -13.7 My Property 22.8 27.3
Comp set 53.7 0.9 Comp set 15.5 -5.5
Index (MPI) 81.4 -14.5 Index (MPI) 147.6 34.7
ADR My Property 275.06 14.2 My Property 227.89 -3.9
Comp set 258.94 9.9 Comp set 237.11 -5.6
Index (ARI) 106.2 3.9 Index (ARI) 96.1 1.7
RevPAR My Property 120.16 -1.5 My Property 52.03 22.3
Comp set 138.98 11.0 Comp set 36.69 -10.7
Index (RGI) 86.5 -11.2 Index (RGI) 141.8 37.0
Transient Group
Amanda's Luxury Resort Hotel 555 Sand Key Way Any City, ST 12345-1234 Phone: (555) 121-1212
December 2012
Year To Date
Transient Group
For the Month of: December 2012 Date Created: January 24, 2013 Monthly Competitive Set Data Includes Subject Property
STR # 1234 ChainID: MgtCo: None Owner: Acme Owner
• Similar Transient and Group Occupancy
• Higher Transient ADR and lower Group ADR?
Student Projects
Last year we created a resource to help
professors conduct nearly 30 different types of
student projects, including foundations, step-
by-steps, data and suggested deliverables.
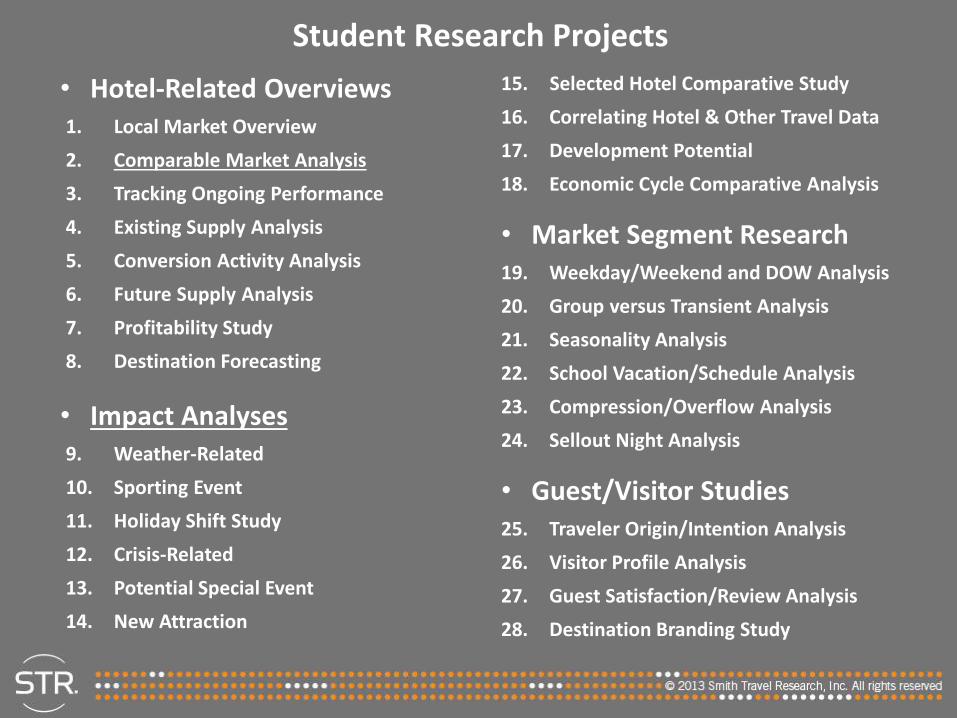
Student Research Projects
• Hotel-Related Overviews1. Local Market Overview
2. Comparable Market Analysis
3. Tracking Ongoing Performance
4. Existing Supply Analysis
5. Conversion Activity Analysis
6. Future Supply Analysis
7. Profitability Study
8. Destination Forecasting
• Impact Analyses9. Weather-Related
10. Sporting Event
11. Holiday Shift Study
12. Crisis-Related
13. Potential Special Event
14. New Attraction
15. Selected Hotel Comparative Study
16. Correlating Hotel & Other Travel Data
17. Development Potential
18. Economic Cycle Comparative Analysis
• Market Segment Research19. Weekday/Weekend and DOW Analysis
20. Group versus Transient Analysis
21. Seasonality Analysis
22. School Vacation/Schedule Analysis
23. Compression/Overflow Analysis
24. Sellout Night Analysis
• Guest/Visitor Studies25. Traveler Origin/Intention Analysis
26. Visitor Profile Analysis
27. Guest Satisfaction/Review Analysis
28. Destination Branding Study
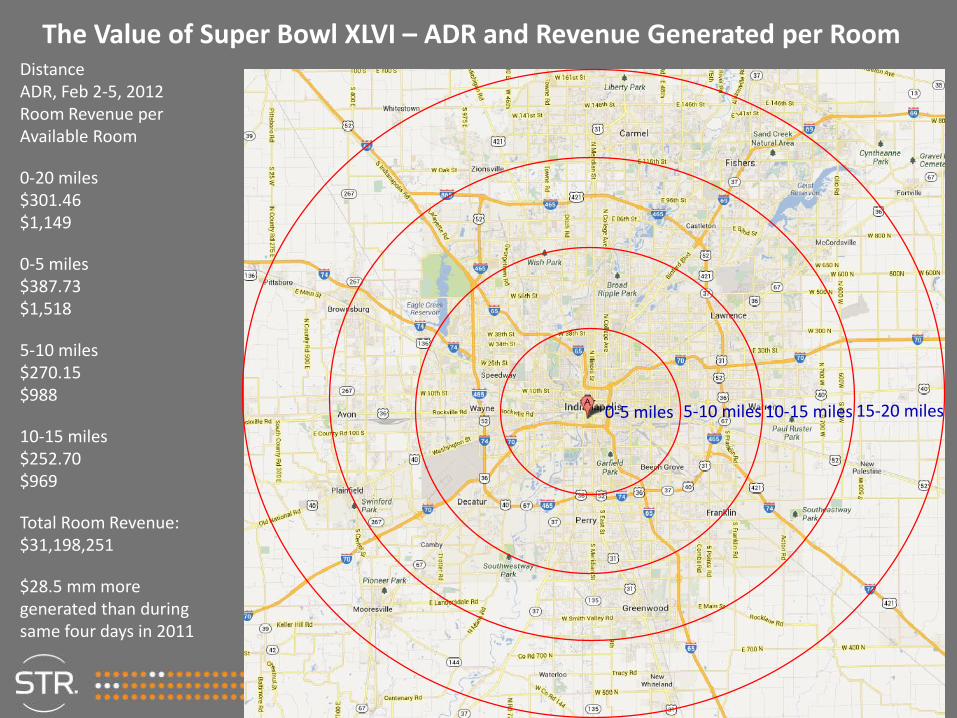
The Value of Super Bowl XLVI – ADR and Revenue Generated per Room
0-5 miles 5-10 miles 10-15 miles 15-20 miles
DistanceADR, Feb 2-5, 2012Room Revenue per Available Room
0-20 miles$301.46$1,149
0-5 miles$387.73$1,518
5-10 miles$270.15$988
10-15 miles$252.70$969
Total Room Revenue:$31,198,251
$28.5 mm more generated than during same four days in 2011
-50
0
50
100
150
200
250
300
350
400
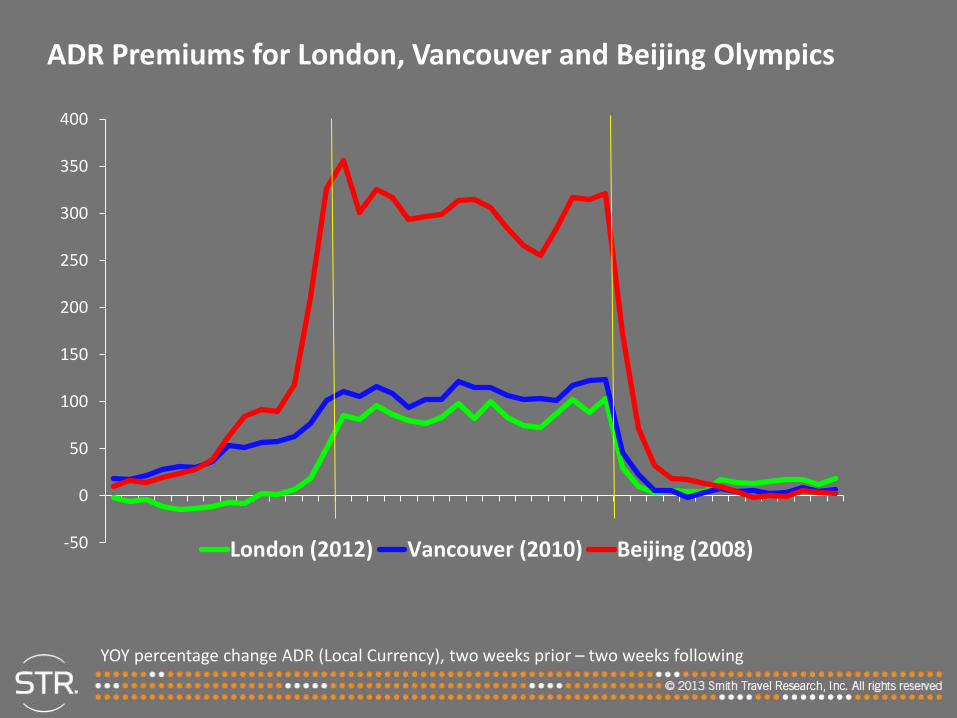
London (2012) Vancouver (2010) Beijing (2008)
ADR Premiums for London, Vancouver and Beijing Olympics
YOY percentage change ADR (Local Currency), two weeks prior – two weeks following
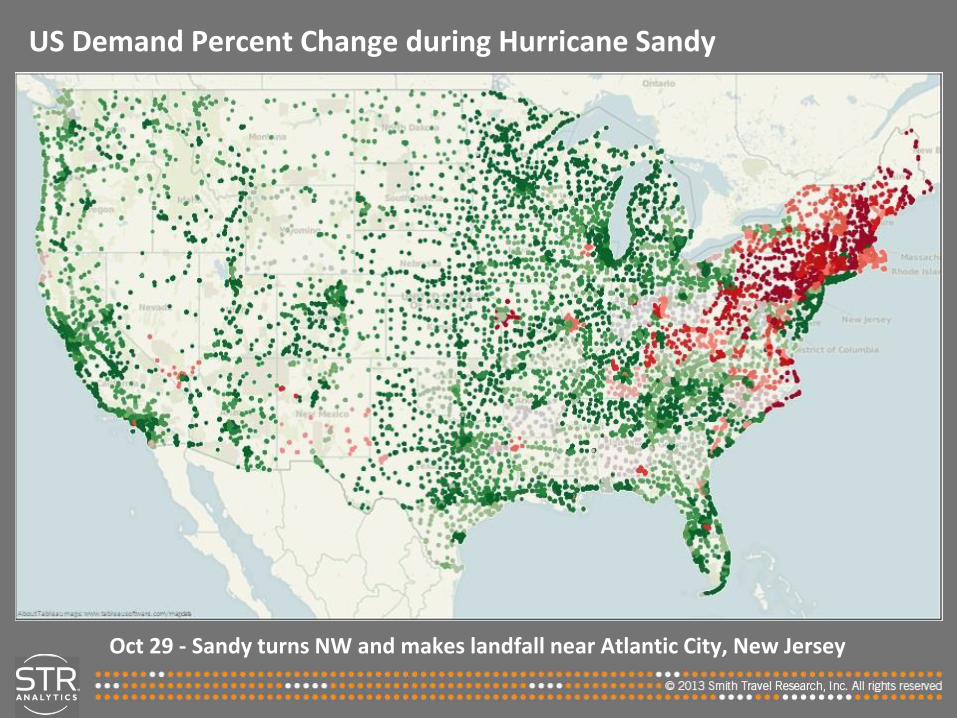
US Demand Percent Change during Hurricane Sandy
Oct 29 - Sandy turns NW and makes landfall near Atlantic City, New Jersey

Outside the box!
H&T professors are among the most
creative when I see the unique ways they
utilize data/resources.
Let us know other things you are doing!
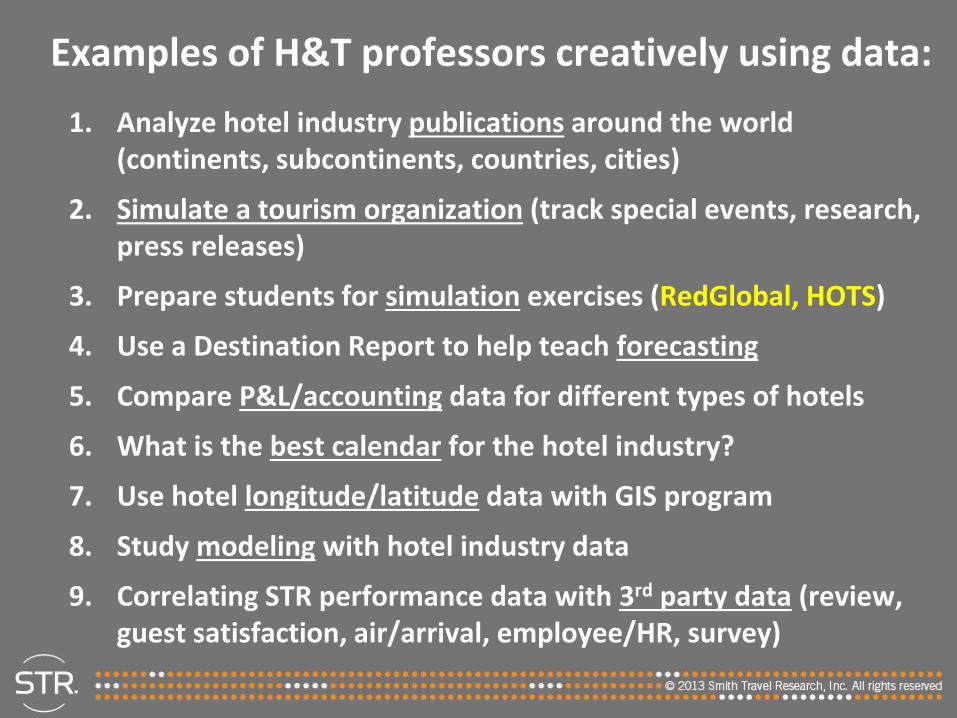
Examples of H&T professors creatively using data:
1. Analyze hotel industry publications around the world (continents, subcontinents, countries, cities)
2. Simulate a tourism organization (track special events, research, press releases)
3. Prepare students for simulation exercises (RedGlobal, HOTS)
4. Use a Destination Report to help teach forecasting
5. Compare P&L/accounting data for different types of hotels
6. What is the best calendar for the hotel industry?
7. Use hotel longitude/latitude data with GIS program
8. Study modeling with hotel industry data
9. Correlating STR performance data with 3rd party data (review, guest satisfaction, air/arrival, employee/HR, survey)

Simulating a Tourism Organization - Beijing
Geographic breakdowns
Class/price subcategories
Sizes and Location types
Comparable Chinese cities
Comparable Asian cities
• Professor can create a user defined report personalized for a specific geographic area
• Possible to track performance over time, analyze special events
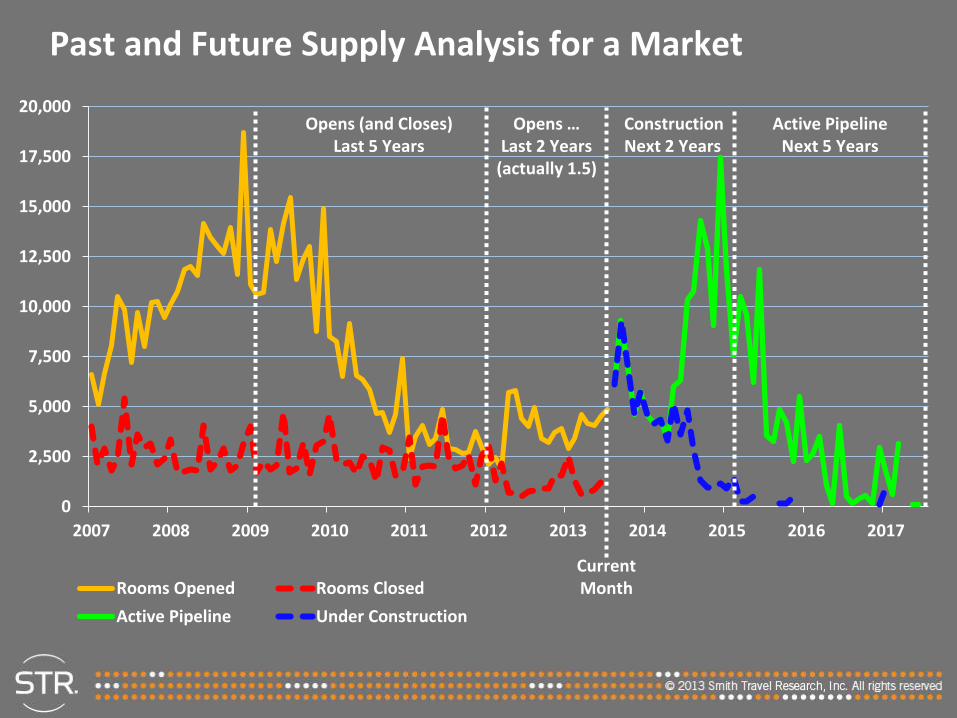
Past and Future Supply Analysis for a Market
0
2,500
5,000
7,500
10,000
12,500
15,000
17,500
20,000
2007 2008 2009 2010 2011 2012 2013 2014 2015 2016 2017
Rooms Opened Rooms Closed
Active Pipeline Under Construction
Opens (and Closes)Last 5 Years
Opens …Last 2 Years
(actually 1.5)
ConstructionNext 2 Years
Active PipelineNext 5 Years
CurrentMonth
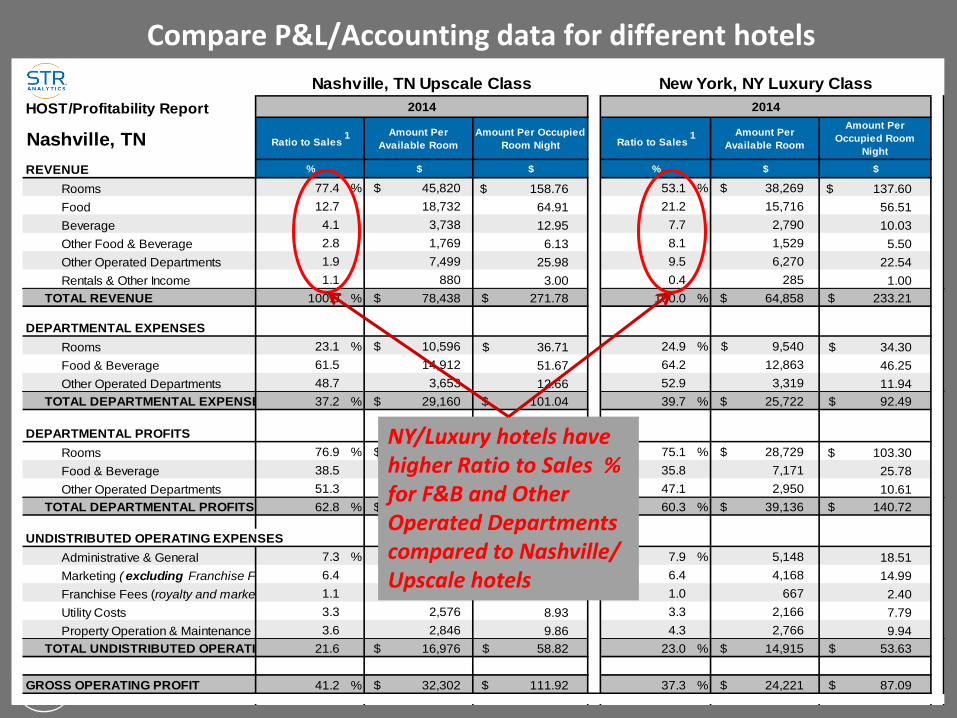
Compare P&L/Accounting data for different hotels
Nashville, TN
REVENUE
Rooms 77.4 % $ 45,820 158.76$ 53.1 % $ 38,269 137.60$
12.7 18,732 64.91 21.2 15,716 56.51
4.1 3,738 12.95 7.7 2,790 10.03
2.8 1,769 6.13 8.1 1,529 5.50
1.9 7,499 25.98 9.5 6,270 22.54
1.1 880 3.00 0.4 285 1.00
100.0 % $ 78,438 271.78$ 100.0 % $ 64,858 233.21$
DEPARTMENTAL EXPENSES
23.1 % $ 10,596 36.71$ 24.9 % $ 9,540 34.30$
61.5 14,912 51.67 64.2 12,863 46.25
48.7 3,653 12.66 52.9 3,319 11.94
37.2 % $ 29,160 101.04$ 39.7 % $ 25,722 92.49$
DEPARTMENTAL PROFITS
76.9 % $ 35,225 122.05$ 75.1 % $ 28,729 103.30$
38.5 9,327 32.32 35.8 7,171 25.78
51.3 3,847 13.33 47.1 2,950 10.61
62.8 % $ 49,278 170.74$ 60.3 % $ 39,136 140.72$
UNDISTRIBUTED OPERATING EXPENSES
7.3 % 5,742 19.89 7.9 % 5,148 18.51
6.4 4,984 17.27 6.4 4,168 14.99
1.1 829 2.87 1.0 667 2.40
3.3 2,576 8.93 3.3 2,166 7.79
3.6 2,846 9.86 4.3 2,766 9.94
21.6 $ 16,976 58.82$ 23.0 % $ 14,915 53.63$
GROSS OPERATING PROFIT 41.2 % $ 32,302 111.92$ 37.3 % $ 24,221 87.09$
%
TOTAL DEPARTMENTAL PROFITS
Food & Beverage
$ $
TOTAL UNDISTRIBUTED OPERATING EXPENSES
TOTAL DEPARTMENTAL EXPENSES
Other Operated Departments
Other Operated Departments
Amount Per Occupied
Room Night
Rooms
Ratio to Sales 1
TOTAL REVENUE
Rentals & Other Income
Amount Per
Occupied Room
Night
Other Operated Departments
Amount Per
Available Room
Other Food & Beverage
Ratio to Sales 1
Beverage
Property Operation & Maintenance
2014
Amount Per
Available Room
Utility Costs
Franchise Fees (royalty and marketing)
Marketing ( excluding Franchise Fees)
Food & Beverage
Rooms
Administrative & General
2014
Food
% $ $
HOST/Profitability Report
Nashville, TN Upscale Class New York, NY Luxury Class
NY/Luxury hotels have higher Ratio to Sales % for F&B and Other Operated Departments compared to Nashville/ Upscale hotels
STR Examples
research we have done as well as projects
performed by consultants, hotel
companies and tourism organizations
with STR data

Additional Research examples – ideas for you
• Compression/Overflow
• Group/Transient (change in business mix)
• School vacation (impact of switch)
• Seasonality (ADR changes, shoulder months)
• Gas price (impact of in/decrease)
• Sandy and Katrina (hurricanes)
• Ash cloud (cancellations, airport hotels)
• Olympics, World Cup, Expo (positive or negative)
• Gulf Oil Spill (tourism loss versus side effects)
• New attraction/Convention Center (potential gain)
• National Parks (mountains versus beaches, drive-to holidays)
• Impact of government business and shutdown
• Currency fluctuation, inflation adjustment
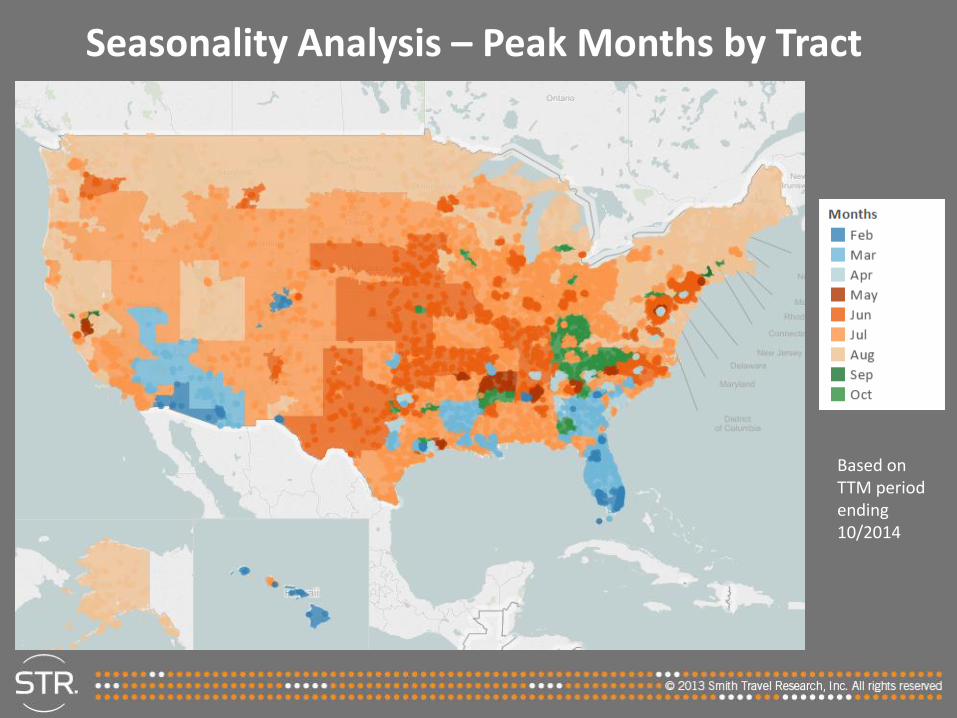
Seasonality Analysis – Peak Months by Tract
Based on TTM period ending 10/2014
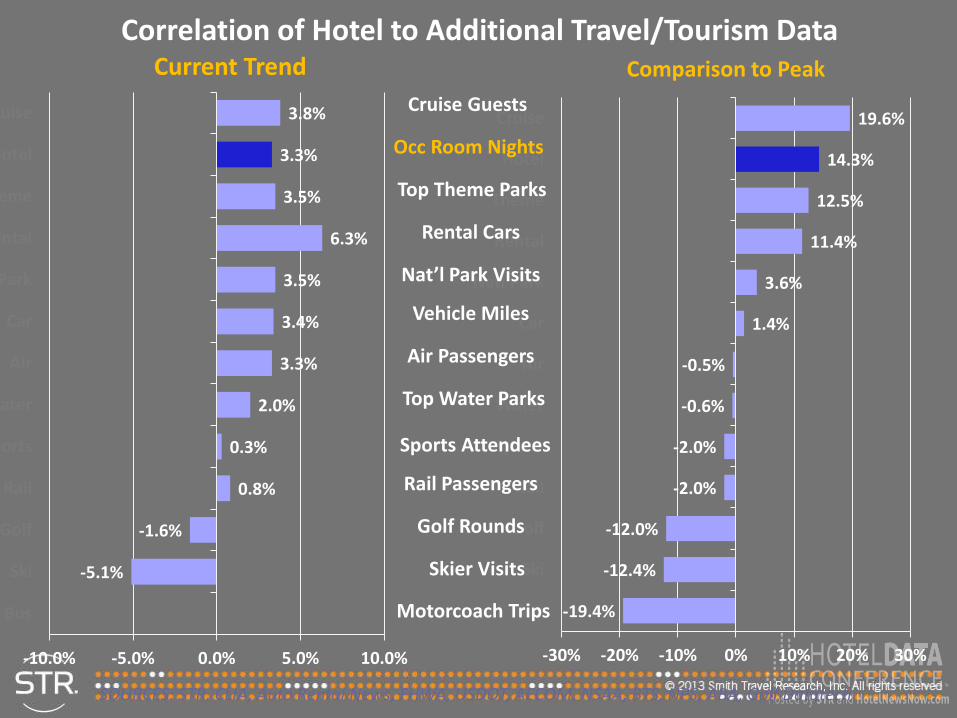
Current Trend Comparison to Peak
-5.1%
-1.6%
0.8%
0.3%
2.0%
3.3%
3.4%
3.5%
6.3%
3.5%
3.3%
3.8%
-10.0% -5.0% 0.0% 5.0% 10.0%
Bus
Ski
Golf
Rail
Sports
Water
Air
Car
Natl Park
Rental
Theme
Hotel
Cruise
-19.4%
-12.4%
-12.0%
-2.0%
-2.0%
-0.6%
-0.5%
1.4%
3.6%
11.4%
12.5%
14.3%
19.6%
-30% -20% -10% 0% 10% 20% 30%
Bus
Ski
Golf
Rail
Sports
Water
Air
Car
Natl Park
Rental
Theme
Hotel
Cruise
SOURCES: STR, CLIA, Auto Rental News, FHWA, USDOT, AECOM, NSAA, BTS, NPS, ABA, Golf Datatech
Rail Passengers
Air Passengers
Rental Cars
Vehicle Miles
Motorcoach Trips
Occ Room Nights
Golf Rounds
Skier Visits
Sports Attendees
Nat’l Park Visits
Top Water Parks
Top Theme Parks
Cruise Guests
Correlation of Hotel to Additional Travel/Tourism Data
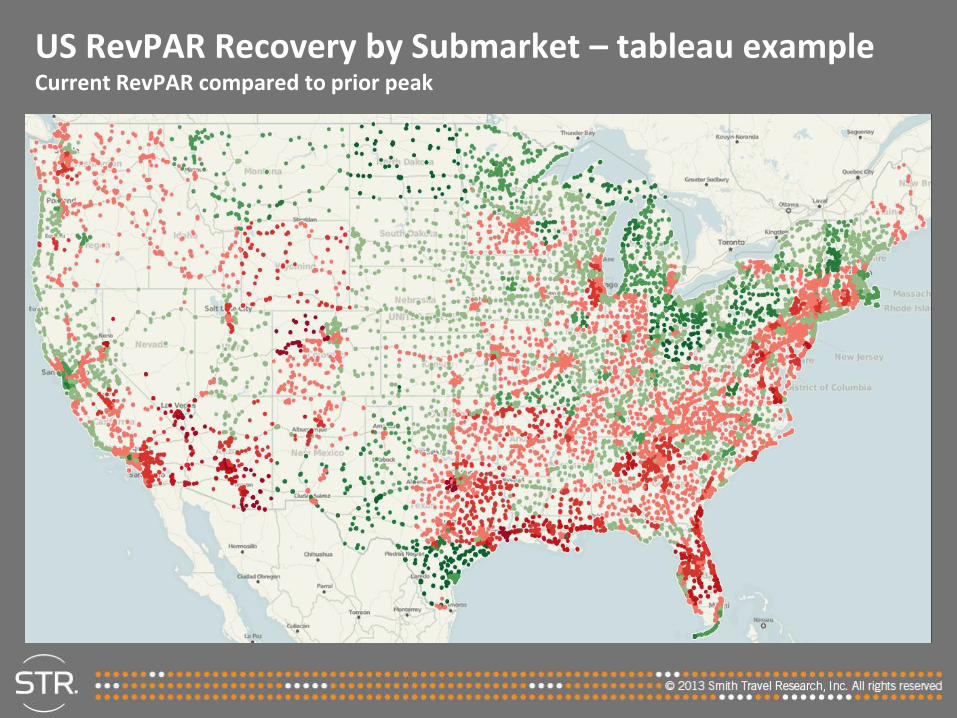
US RevPAR Recovery by Submarket – tableau exampleCurrent RevPAR compared to prior peak
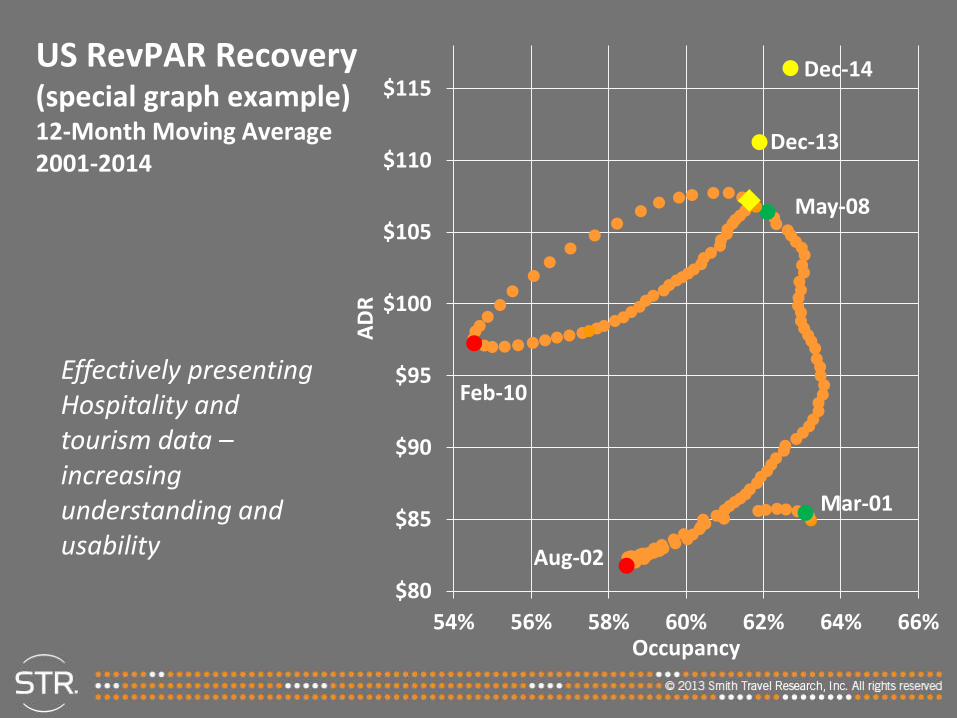
US RevPAR Recovery(special graph example)12-Month Moving Average2001-2014
Mar-01
Feb-10
May-08
Aug-02
Dec-13
Dec-14
$80
$85
$90
$95
$100
$105
$110
$115
54% 56% 58% 60% 62% 64% 66%
AD
R
Occupancy
Effectively presentingHospitality and tourism data –increasing understanding and usability
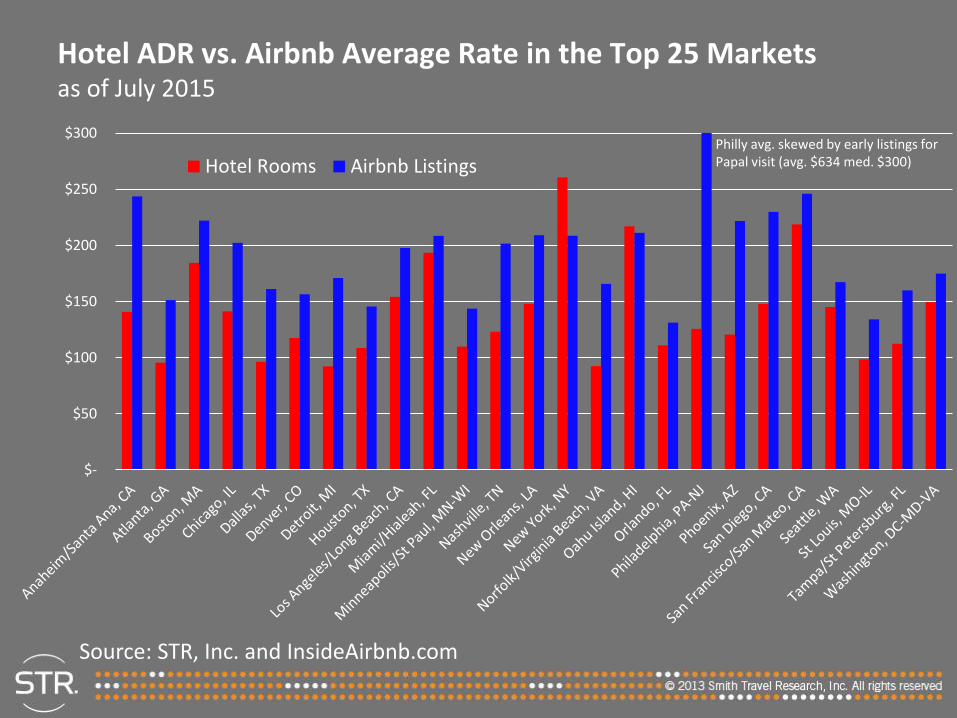
Hotel ADR vs. Airbnb Average Rate in the Top 25 Marketsas of July 2015
$-
$50
$100
$150
$200
$250
$300
Hotel Rooms Airbnb ListingsPhilly avg. skewed by early listings for Papal visit (avg. $634 med. $300)
Source: STR, Inc. and InsideAirbnb.com

“If we knew what it was we were doing, it would not be called research would it?” - Albert Einstein
Nobel Prize Winning Physicist
“An expert is one who knows more and more about less and less until he knows absolutely everything about nothing.” - Nicholas Murray Butler
Nobel Peace Prize Recipient
“Research consists in seeing what everyone else has seen, but thinking what no one else has thought” - Albert Szent-Gyorgyi
Nobel Prize Winning Physiologist

Some observations and ideas – hopefully they’ve helped
Four years ago ….
What else can we do together?
Let us know how we can help.
Steve Hood, [email protected]+1 615 824 8664, extension 3315