
Experiences of Discrimination: The Impact of Metropolitan and Non-Metropolitan Location
25
Experiences of Discrimination: The Impact of Metropolitan and Non- Metropolitan Location Brian Ray, University of Ottawa Valerie Preston, York University
description
Experiences of Discrimination: The Impact of Metropolitan and Non-Metropolitan Location. Brian Ray, University of Ottawa Valerie Preston, York University. Geographical Understanding of Discrimination and Discomfort. Experiences of discomfort & discrimination Being ‘in and out of place’ - PowerPoint PPT Presentation
Transcript of Experiences of Discrimination: The Impact of Metropolitan and Non-Metropolitan Location

Experiences of Discrimination: The Impact of Metropolitan and Non-
Metropolitan Location
Brian Ray, University of OttawaValerie Preston, York University

Geographical Understanding of Discrimination and Discomfort
• Experiences of discomfort & discrimination
• Being ‘in and out of place’– How racialization operates
within place(s)– How racialization is placed– Feminist geography– Whiteness literature
• Experiential constructions of whiteness
• ‘White’ landscapes

Understanding Experiences of Discomfort/Discrimination
• Psychological and sociological studies– Discomfort can arise when
people made aware of being different
– Discrimination experienced by group more than discrimination reported by individual
– Multiple causes of discomfort and discrimination

Understanding Discomfort/Discrimination
• Relatively little research about the spatial variation of discomfort/discrimination generally, and racist attitudes in particular– Although do know much more about spatial
variation in family status, community relations (e.g., social life in cities vs. rural areas)

Does Geography Matter?
• Are experiences of discrimination and discomfort the same in Canada’s three gateway cities, other metropolitan areas, and non-metropolitan areas?

Presentation Outline
• Ethnic Diversity Survey
• Canada’s uneven geography
• Description of discrimination and discomfort
• Explanations of discrimination and discomfort
• Implications

Ethnic Diversity Survey
• Post-census survey
• A general population survey
• Approximately 42,000 individuals
• Population 15 years of age & over
• Identity, social behaviours, experiences of discrimination and feelings of discomfort
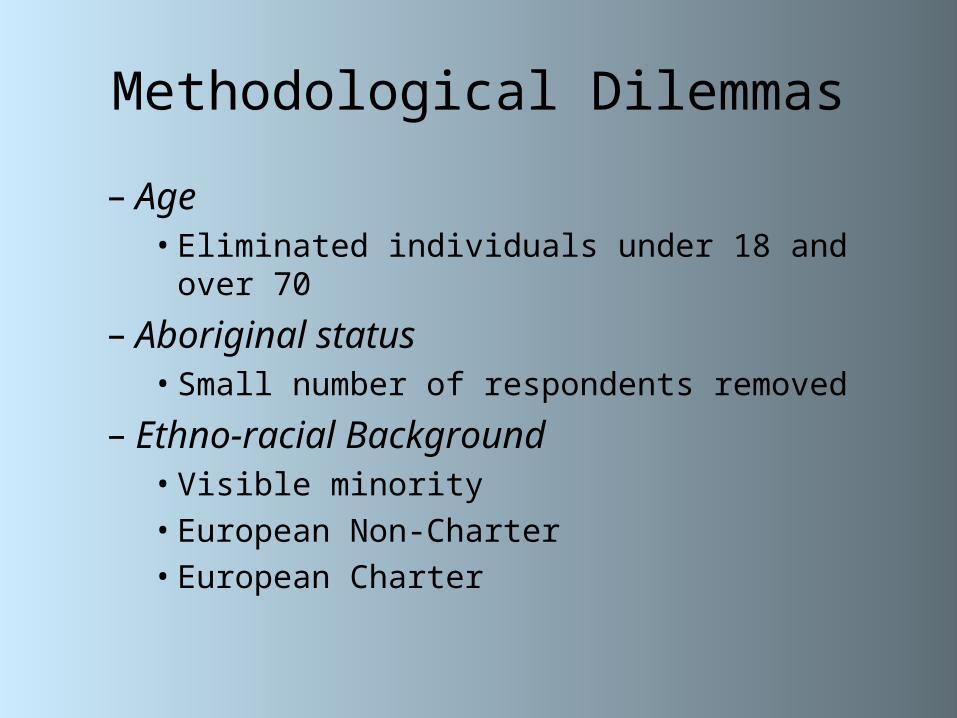
Methodological Dilemmas
– Age• Eliminated individuals under 18 and over 70
– Aboriginal status• Small number of respondents removed
– Ethno-racial Background• Visible minority• European Non-Charter• European Charter

Uneven Geography: Visible Minorities
• 71.8 percent in Toronto, Montreal and Vancouver
• 4.8 percent in small towns and rural areas
• Highly correlated with distribution of immigrants
Distribution of Visible Minority Population in Canada, 2006
71.8
23.4
4.8
M,T,V Other CMA Non-metro
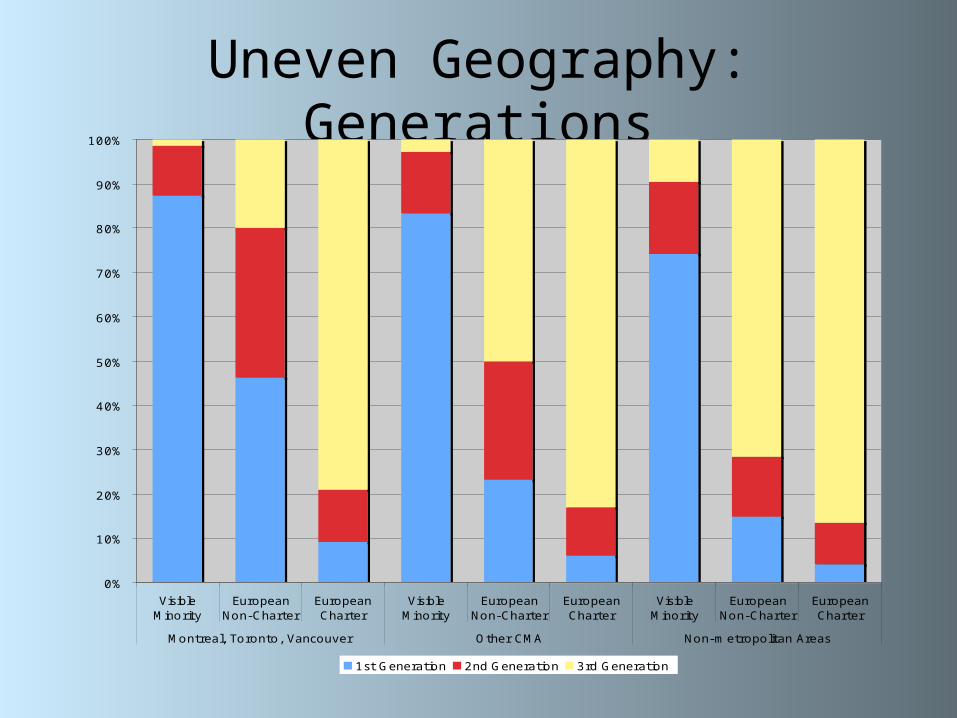
Uneven Geography: Generations
0%
10%
20%
30%
40%
50%
60%
70%
80%
90%
100%
VisibleMinority
EuropeanNon-Charter
EuropeanCharter
VisibleMinority
EuropeanNon-Charter
EuropeanCharter
VisibleMinority
EuropeanNon-Charter
EuropeanCharter
Montreal, Toronto, Vancouver Other CMA Non-metropolitan Areas
1st Generation 2nd Generation 3rd Generation
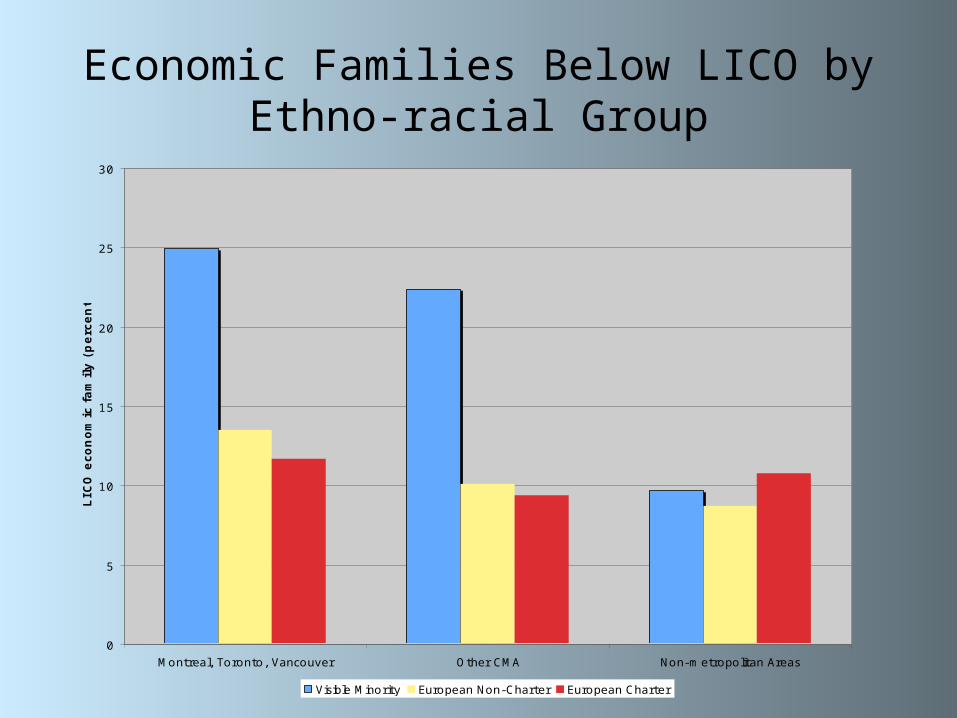
Economic Families Below LICO by Ethno-racial Group
0
5
10
15
20
25
30
Montreal, Toronto, Vancouver Other CMA Non-metropolitan Areas
LIC
O e
con
om
ic f
am
ily (
perc
en
t)
Visible Minority European Non-Charter European Charter

Table 3: Behavioural characteristics of ethno-cultural groups by geographic area
Visible MinorityEuropean Non-
CharterEuropean Charter
MTV CMANon-metro
MTV CMANon-metro
MTV CMANon-metro
Importance ofethnic ancestry
Percent Percent Percent
Not important 8.3 6.0 8.2 24.4 34.9 36.2 25.3 28.0 25.9 Ambivalent 18.0 16.8 12.7 19.8 26.3 28.9 22.0 25.4 26.1 Important 73.8 77.3 79.1 55.8 38.8 34.8 52.8 46.6 47.9
Sense ofbelonging toethnic group Weak 12.7 14.5 15.1 27.5 40.1 39.8 23.4 28.4 27.5 Moderate 22.8 23.7 21.9 23.5 23.5 26.3 24.3 25.4 22.7 Strong 64.5 61.9 63.0 49.1 36.4 33.9 52.3 46.3 63.0
Involvement inan ethnic club Yes 36.2 41.7 41.0 44.8 48.4 47.5 44.4 49.4 49.8
Number of co-ethnics in socialnetwork None 6.4 11.1 19.6 22.8 28.6 28.7 12.8 22.8 11.8 Some 22.6 25.4 21.0 34.0 43.9 48.5 31.2 34.0 30.0 Over 50% 71.1 63.6 59.4 43.2 27.5 22.8 56.0 43.2 58.2
Sense ofbelonging tocity/town Weak 12.6 13.9 15.7 17.8 19.4 20.0 21.3 19.3 17.6 Modest 23.1 25.9 25.0 26.8 29.3 30.2 31.7 32.4 28.7 Strong 64.3 60.2 59.3 55.4 51.2 49.8 47.0 48.4 53.8
Overall level oftrust Can trust 46.0 53.4 56.2 51.2 55.0 59.6 48.8 53.4 50.9
Trust neighbours No trust 14.5 12.5 5.8 12.7 9.2 6.6 10.5 8.5 7.0 Somewhat 65.8 65.1 53.7 64.8 61.4 55.6 67.2 60.8 56.8 A lot 19.8 22.4 40.6 22.5 29.4 37.8 22.3 30.6 36.2
Source: Ethnic Diversity Survey.
Visible minority group everywhere:• ethnic ancestry important• ethnic group belonging strong• co-ethnics in networks – over 50%• belonging to city/town strong
Visible minority group:• Networks: co-ethnics decrease assize of place decreases• Overall sense of trust increases as size of place decreases•Trust neighbours increases as size of place decreases
European non-charter:• Ethnic ancestry most impt. in M,T,V• Sense of belonging strongest in largestplaces • Overall level of trust higherin all places relative to other groups
European Charter:• Ethnic ancestry most impt. in M,T,V• Co-ethnics in networks: highest proportionin biggest & smallest places • Sense of belonging to place strongest insmall places• Overall level of trust strongest in smallest places

Discomfort in Past 5 Years
0
10
20
30
40
50
60
M, T, V Other CMAs Non-metropolitan All regions
Perc
en
t R
ep
ort
ing
Dis
co
mfo
rt in
Past
Fiv
e Y
ears
Visible Minority European Non-Charter European Charter

Discrimination in Past 5 Years
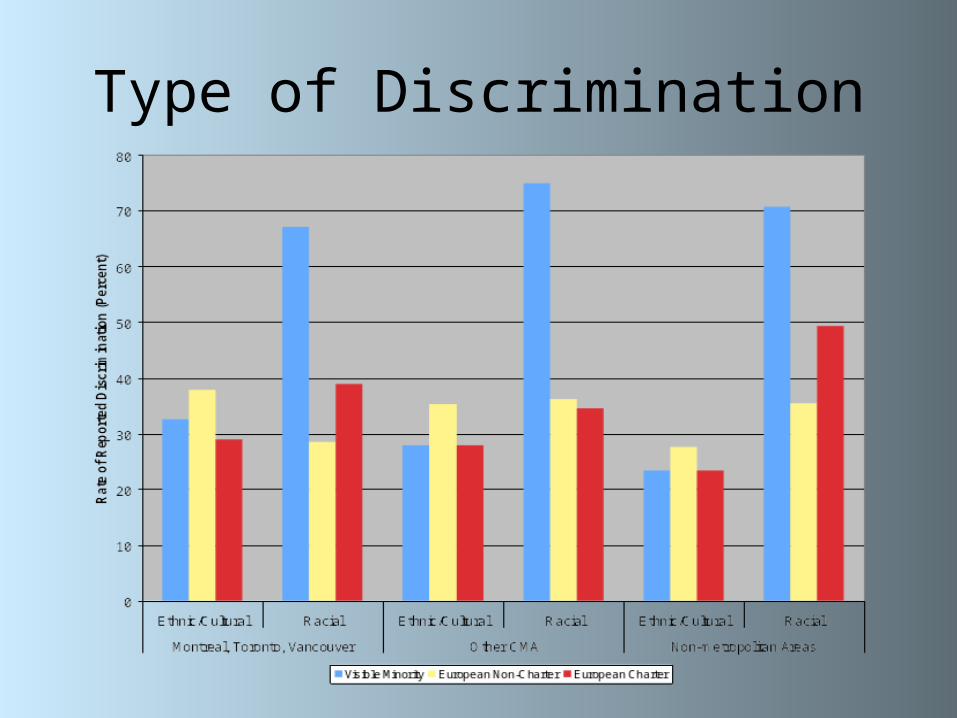
Type of Discrimination

Visible Minority Experiences of Discrimination
0
10
20
30
40
50
60
70
80
Montreal, Toronto, Vancouver Other CMA Non-metropolitan Areas
Rate
of
Rep
ort
ed
Dis
cri
min
ati
on
(P
erc
en
t)
Ethnic/Cultural Racial

Explaining Variations in Discrimination and Discomfort
Social Characteristics
Behaviour
Residential Characteristics
• Sex• Marital Status• Children under 18• Social class (Low-income status,
household income, education)• Visible Minority Status• Birthplace• Generation Status• Religion
• Language, at home and with friends• Involvement in ethnic clubs• Co-ethnics in social network• Sense of belonging to:
• Ethnic group• City
• Level of trust• Trust in neighbours
•Tenure• Dwelling type• Where live – size of
place
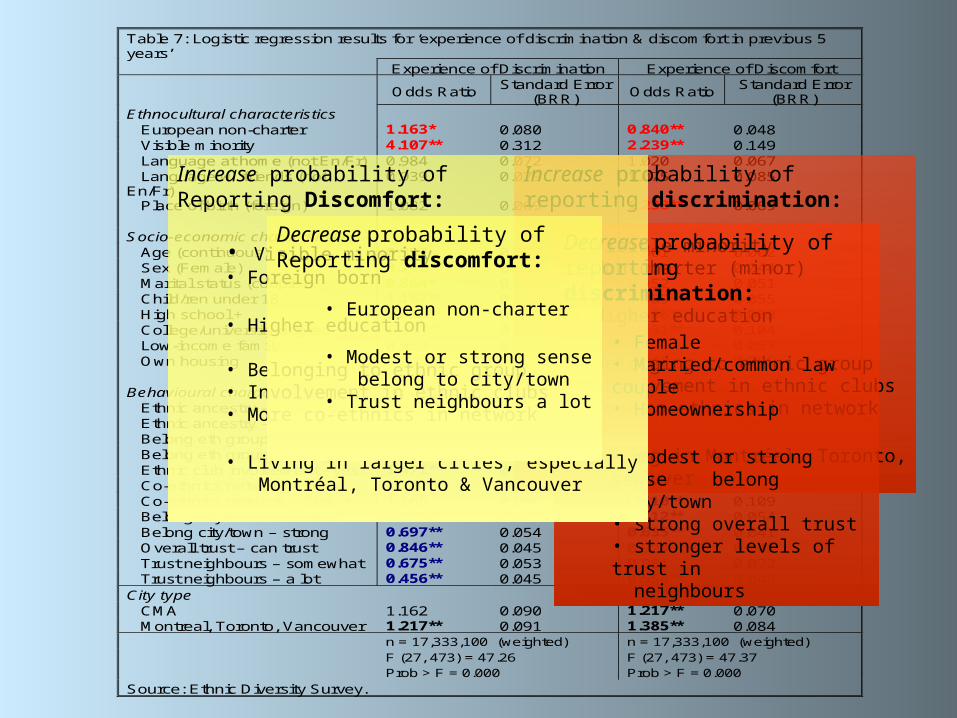
Table 7: Logistic regression results for ‘experience of discrimination & discomfort in previous 5years’
Experience of Discrimination Experience of Discomfort
Odds RatioStandard Error
(BRR)Odds Ratio
Standard Error(BRR)
Ethnocultural characteristics European non-charter 1.163* 0.080 0.840** 0.048 Visible minority 4.107** 0.312 2.239** 0.149 Language at home (not En/Fr) 0.984 0.072 1.020 0.067 Language w. friends (notEn/Fr)
0.939 0.079 1.075 0.085
Place of birth (foreign) 1.082 0.069 1.238** 0.069
Socio-economic characteristics Age (continuous) 0.997 0.002 1.001 0.002 Sex (Female) 0.762** 0.037 1.010 0.044 Marital status (couple) 0.864* 0.055 0.952 0.051 Child/ren under 18 1.187** 0.067 1.089 0.055 High school + 1.336** 0.116 1.166* 0.083 College/university degree 1.497** 0.123 1.531** 0.104 Low-income family 0.953 0.072 0.971 0.067 Own housing 0.865* 0.053 1.043 0.055
Behavioural characteristics Ethnic ancestry – ambivalent 0.935 0.074 0.951 0.063 Ethnic ancestry – important 1.087 0.086 1.038 0.065 Belong eth group - moderate 1.188* 0.089 1.211** 0.075 Belong eth group – strong 1.379** 0.104 1.365** 0.084 Ethnic club involvement - yes 1.471** 0.074 1.188** 0.051 Co-ethnics network – some 1.227** 0.096 1.287** 0.084 Co-ethnics network - 50% + 1.165 0.096 1.610** 0.109 Belong city/town – modest 0.795** 0.061 0.812** 0.054 Belong city/town – strong 0.697** 0.054 0.635** 0.041 Overall trust – can trust 0.846** 0.045 0.924 0.042 Trust neighbours – somewhat 0.675** 0.053 0.981 0.072 Trust neighbours – a lot 0.456** 0.045 0.558** 0.048City type CMA 1.162 0.090 1.217** 0.070 Montreal, Toronto, Vancouver 1.217** 0.091 1.385** 0.084
n = 17,333,100 (weighted) n = 17,333,100 (weighted)F (27, 473) = 47.26 F (27, 473) = 47.37Prob > F = 0.000 Prob > F = 0.000
Source: Ethnic Diversity Survey.
Increase probability ofreporting discrimination:
• Visible minority• Non-charter (minor)
• Higher education
• Belonging to ethnic group• Involvement in ethnic clubs• Some co-ethnics in network
• Living in Montréal, Toronto, Vancouver
Decrease probability ofreporting discrimination:
• Female• Married/common law couple• Homeownership
• modest or strong sense belong city/town• strong overall trust• stronger levels of trust in neighbours
Increase probability of Reporting Discomfort:
• Visible minority• Foreign born
• Higher education
• Belonging to ethnic group• Involvement in ethnic clubs• More co-ethnics in network
• Living in larger cities, especially Montréal, Toronto & Vancouver
Decrease probability ofReporting discomfort:
• European non-charter
• Modest or strong sense belong to city/town• Trust neighbours a lot
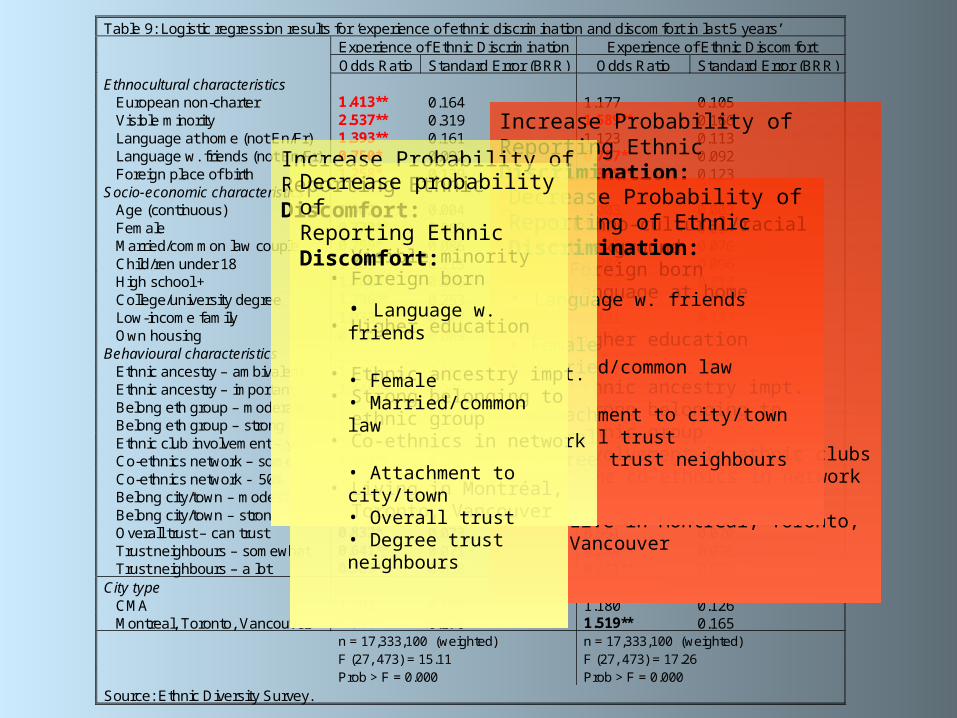
Table 9: Logistic regression results for ‘experience of ethnic discrimination and discomfort in last 5 years’Experience of Ethnic Discrimination Experience of Ethnic DiscomfortOdds Ratio Standard Error (BRR) Odds Ratio Standard Error (BRR)
Ethnocultural characteristics European non-charter 1.413** 0.164 1.177 0.105 Visible minority 2.537** 0.319 1.589** 0.166 Language at home (not En/Fr) 1.393** 0.161 1.123 0.113 Language w. friends (not En/Fr) 0.750* 0.092 0.787* 0.092 Foreign place of birth 1.258* 0.139 1.305** 0.123Socio-economic characteristics Age (continuous) 1.002 0.004 1.003 0.003 Female 0.770** 0.063 0.856* 0.064 Married/common law couple 0.799* 0.086 0.807* 0.076 Child/ren under 18 1.109 0.113 1.084 0.096 High school + 1.385* 0.215 1.569** 0.213 College/university degree 1.796** 0.253 2.358** 0.287 Low-income family 1.033 0.117 1.131 0.137 Own housing 0.914 0.089 1.116 0.102Behavioural characteristics Ethnic ancestry – ambivalent 1.115 0.162 1.292* 0.164 Ethnic ancestry – important 1.448** 0.205 1.366* 0.167 Belong eth group – moderate 1.282 0.172 1.206 0.148 Belong eth group – strong 1.324* 0.187 1.299* 0.153 Ethnic club involvement – yes 1.408** 0.119 1.135 0.078 Co-ethnics network – some 1.567** 0.206 1.387** 0.140 Co-ethnics network - 50% + 1.306 0.191 1.470** 0.176 Belong city/town – modest 0.676** 0.089 0.864 0.092 Belong city/town – strong 0.617** 0.073 0.700** 0.072 Overall trust – can trust 0.832* 0.073 0.951 0.070 Trust neighbours – somewhat 0.641** 0.071 0.734** 0.076 Trust neighbours – a lot 0.389** 0.058 0.431** 0.058City type CMA 1.192 0.165 1.180 0.126 Montreal, Toronto, Vancouver 1.300* 0.170 1.519** 0.165
n = 17,333,100 (weighted) n = 17,333,100 (weighted)F (27, 473) = 15.11 F (27, 473) = 17.26Prob > F = 0.000 Prob > F = 0.000
Source: Ethnic Diversity Survey.
Increase Probability of Reporting EthnicDiscrimination:
• Ethno-cultural/racial background• Foreign born• Language at home
• Higher education
• Ethnic ancestry impt.• Strong belonging to ethnic group• Involvement in ethnic clubs• Some co-ethnics in network
• Live in Montréal, Toronto, Vancouver
Decrease Probability of Reporting of EthnicDiscrimination:
• Language w. friends
• Female• Married/common law
• Attachment to city/town• Overall trust• Degree trust neighbours
Increase Probability of Reporting EthnicDiscomfort:
• Visible minority• Foreign born
• Higher education
• Ethnic ancestry impt.• Strong belonging to ethnic group• Co-ethnics in network
• Living in Montréal, Toronto, Vancouver
Decrease probability ofReporting EthnicDiscomfort:
• Language w. friends
• Female• Married/common law
• Attachment to city/town• Overall trust• Degree trust neighbours

Table 8: Logistic regression results for ‘experience of racial discrimination and discomfort in last 5 years’Experience of Racial Discrimination Experience of Racial DiscomfortOdds Ratio Standard Error (BRR) Odds Ratio Standard Error (BRR)
Ethnocultural characteristics European non-charter 1.193 0.128 0.772* 0.078 Visible minority 13.702** 1.320 8.480** 0.791 Language at home (not En/Fr) 0.634** 0.062 0.569** 0.051 Language w. friends (not En/Fr) 1.007 0.112 0.845 0.121 Foreign place of birth 0.716** 0.057 0.795** 0.062Socio-economic characteristics Age (continuous) 0.995 0.003 0.995* 0.003 Female 0.659** 0.041 0.890 0.057 Married/common law couple 0.806* 0.068 0.901 0.074 Child/ren under 18 1.398** 0.114 1.150 0.090 High school + 1.389** 0.161 1.250 0.146 College/university degree 1.366** 0.150 1.433** 0.165 Low-income family 0.825 0.081 0.921 0.087 Own housing 0.919 0.075 0.992 0.075Behavioural characteristics Ethnic ancestry – ambivalent 0.899 0.106 0.813* 0.084 Ethnic ancestry – important 0.972 0.100 0.836 0.080 Belong eth group – moderate 0.992 0.107 0.972 0.101 Belong eth group – strong 1.096 0.110 0.967 0.095 Ethnic club involvement – yes 1.422** 0.099 1.334** 0.084 Co-ethnics network – some 1.288* 0.141 1.271* 0.129 Co-ethnics network - 50% + 1.031 0.117 1.141 0.118 Belong city/town – modest 0.966 0.097 0.837 0.080 Belong city/town – strong 0.879 0.088 0.774** 0.073 Overall trust – can trust 0.722** 0.050 0.836** 0.055 Trust neighbours – somewhat 0.636** 0.065 1.029 0.100 Trust neighbours – a lot 0.439** 0.059 0.651** 0.001City type CMA 1.111 0.120 1.272* 0.124 Montreal, Toronto, Vancouver 1.176 0.126 1.621** 0.165
n = 17,333,100 (weighted) n = 17,333,100 (weighted)F (27, 473) = 78.79 F (27, 473) = 65.38Prob > F = 0.000 Prob > F = 0.000
Source: Ethnic Diversity Survey.
Increase probabilityof reporting Racial Discrimination:
• Visible minority
• Children < 18• Higher education
• Involvement in ethnic clubs• Some co-ethnics in network
Decrease probability of reporting RacialDiscrimination:
• Language at home• Foreign born
• Female• Marital status
• Overall trust• Degree trust neighbours
Increase probability of reporting Racial Discomfort:
• Higher education
• Involvement in ethnic clubs• Some co-ethnics in network
• Living in larger cities, especially Montréal, Toronto, Vancouver
Decrease probability of reporting Racial Discomfort:
• Ethno-cultural/ racial background• Foreign born• Language at home
• Age (slight)
• Ethnic ancestry (minor)• Sense belong to city/town• Overall trust levels• Trusting neighbours a lot

How Does Geography Matter?• Complicated geographies of discomfort &
discrimination • Geographical variation in who reports discomfort
& discrimination– Size and type of place seem to play a role– But in small cities, towns, rural areas must also
consider size of visible minority population & generation status
• Possible to avoid ethnocultural/racial difference versus a welcoming community

How Does Geography Matter?
• Visible minority status influences experiences of discrimination and feelings of discomfort, particularly those related to race– Strongly tied to places where visible minority
populations are large
• Immigrant status influences experiences of discrimination and discomfort– Increases odds for ethnic discomfort/ discrimination– Reduces odds for racial discomfort/ discrimination
Implications

IMPLICATIONS
• Processes of racialization are geographically variable but reporting discrimination largely due to visible minority status (racialized difference)
• Impact of co-ethnic ties & involvement in ethnic institutions may pose significant challenges for effective public policy formation & delivery