EXPERIENCE WITH SIGNIFICANT INCIDENTS IN ROAD … · experience with significant incidents in road...
17
EXPERIENCE WITH SIGNIFICANT INCIDENTS IN ROAD TUNNELS 19 2017R35EN 3. COLLISIONS WITHIN ROAD TUNNELS 3.1. BACKGROUND As stated in chapter 1.2, lthe detailed definition of significant incidents differs from country to country, depending on national requirements. Examples for incidents which are considered as significant by different countries are presented in Appendix 1 . Collisions and fires are considered as significant incidents (in all countries), because they may result in serious consequences. This chapter deals with collisions within road tunnels. Other types of significant incidents can be considered in analogy to the listed issues on collisions. Fires are considered in chapter 4. In this chapter factors influencing collisions in road tunnels are described and parameters relevant for collisions and other types of incidents are discussed; including parameters such as tunnel profile, collision profile, driver(s) and vehicle(s) profile and the behaviour of people involved. A comprehensive list of data to be collected on tunnel collisions, an evaluation of available statistical data from different countries on collision rates and its possible application are also presented in this chapter. 3.2. CHARACTERISTICS OF COLLISIONS IN ROAD TUNNELS A road tunnel is a section of road in a confined space with lateral and vertical restrictions. The distinct differences of collisions in tunnel sections in comparison to open road sections are determined by some specific characteristics of the whole tunnel system, which can be summarised as follows: • Tunnels are enclosed structures with confined space that can cause, for some users, feelings of anxiety, and particular behaviour in the event of a collision (this can be true for people both directly or indirectly involved in a collision). • Generally in tunnels, fewer (or no) junctions, interchanges, crossroads and intersections are present, as well as no traffic to and from adjoining access roads. • Pedestrians and slow moving vehicles (like mopeds, motorcycles, agricultural tractors or other equipment), are generally prohibited in tunnels. • Proximity of stationary obstacles (like tunnel portals, road signs, tunnel ceiling, tunnel wall) may influence driving behaviour. • Protective measures typical for open road sections (e.g. barriers or other energy absorption systems) are not present in all tunnels. • Emergency lanes are not present in many motorway tunnels, different to open roads. • Tunnel users need to perceive, analyse and understand a different driving environment. • Critical situations in road tunnels may require decisions from car drivers in short time frames, under different conditions from which they are used to. • If air quality is not controlled and kept within permissible limits the behaviour of users can be affected. • Environmental conditions are better controlled within tunnels (absence of rain, snow, ice, wind, fog and less slippery road surface), but sudden changes may occur at tunnel portals.
Transcript of EXPERIENCE WITH SIGNIFICANT INCIDENTS IN ROAD … · experience with significant incidents in road...

EXPERIENCE WITH SIGNIFICANT INCIDENTS IN ROAD TUNNELS19
2017R35EN
3. COLLISIONS WITHIN ROAD TUNNELS
3.1. BACKGROUND
As stated in chapter 1.2, lthe detailed definition of significant incidents differs from country to country, depending on national requirements. Examples for incidents which are considered as significant by different countries are presented in Appendix 1.
Collisions and fires are considered as significant incidents (in all countries), because they may result in serious consequences. This chapter deals with collisions within road tunnels. Other types of significant incidents can be considered in analogy to the listed issues on collisions. Fires are considered in chapter 4.
In this chapter factors influencing collisions in road tunnels are described and parameters relevant for collisions and other types of incidents are discussed; including parameters such as tunnel profile, collision profile, driver(s) and vehicle(s) profile and the behaviour of people involved.
A comprehensive list of data to be collected on tunnel collisions, an evaluation of available statistical data from different countries on collision rates and its possible application are also presented in this chapter.
3.2. CHARACTERISTICS OF COLLISIONS IN ROAD TUNNELS
A road tunnel is a section of road in a confined space with lateral and vertical restrictions. The distinct differences of collisions in tunnel sections in comparison to open road sections are determined by some specific characteristics of the whole tunnel system, which can be summarised as follows:
• Tunnels are enclosed structures with confined space that can cause, for some users, feelings of anxiety, and particular behaviour in the event of a collision (this can be true for people both directly or indirectly involved in a collision).
• Generally in tunnels, fewer (or no) junctions, interchanges, crossroads and intersections are present, as well as no traffic to and from adjoining access roads.
• Pedestrians and slow moving vehicles (like mopeds, motorcycles, agricultural tractors or other equipment), are generally prohibited in tunnels.
• Proximity of stationary obstacles (like tunnel portals, road signs, tunnel ceiling, tunnel wall) may influence driving behaviour.
• Protective measures typical for open road sections (e.g. barriers or other energy absorption systems) are not present in all tunnels.
• Emergency lanes are not present in many motorway tunnels, different to open roads.• Tunnel users need to perceive, analyse and understand a different driving environment.• Critical situations in road tunnels may require decisions from car drivers in short time frames,
under different conditions from which they are used to.• If air quality is not controlled and kept within permissible limits the behaviour of users can be
affected.• Environmental conditions are better controlled within tunnels (absence of rain, snow, ice,
wind, fog and less slippery road surface), but sudden changes may occur at tunnel portals.

20
EXPERIENCE WITH SIGNIFICANT INCIDENTS IN ROAD TUNNELS2017R35EN
• Tunnels are normally lit at all times, but sudden changes in light conditions may occur at tunnel portals.
• The monotonous atmosphere of long tunnels may hamper a driver´s awareness.• The tunnel conditions may cause misjudgement of horizontal and vertical alignment, as well
as of safe driving distance from other vehicles and obstacles.
In light of the above considerations, collisions in tunnels may differ from those on the open road with respect to:
Occurrence of incidents:• Specific types of collisions cannot occur in tunnels, e.g. collisions caused by wind, rain, snow
and other environmental influences.• Specific types of collisions have a reduced probability of occurrence in tunnels, e.g. collisions
caused by lane changing or turning manoeuvres, pedestrians, wild animals, or loss of traction on a slippery road surface.
• Specific types of collisions have an increased probability of occurrence, e.g. collisions with stationary obstacles like tunnel walls or entry portals.
• There are causes for incidents which are unique to tunnels, such as sudden windscreen misting resulting in impaired visibility or sudden flooding in a subaqueous tunnel.
Consequences of incidents:• Collisions may have increased consequences in a tunnel, mainly caused by space limitations,
for instance collisions with the tunnel sidewall (instead of with a safety barrier) or collisions causing fires, explosions or spillage of dangerous goods.
• Emergency response may be impaired, due to impeded access to an incident for the emergency services.
3.3. INFLUENCING FACTORS FOR COLLISIONS IN ROAD TUNNELS
The aspects addressed in the previous chapter that are specific to road tunnels, could influence both the frequency and consequence of collisions. In a first approach, the relevant factors are identified and discussed qualitatively. The next step involves detailed discussion of the most relevant factors – based on results from detailed studies of collisions in road tunnels. There is little evidence that the influence of these factors can be addressed individually, and only for a very limited number, is a quantitative approach available.
The factors identified can be discussed as follows – without claiming to be complete:
• Basic tunnel configuration – unidirectional or bidirectional tunnel: there is a significant influence with respect to collision type, by frequency as well as consequence; information for a quantitative evaluation is available (see chapter 3.5) ;
• Horizontal alignment: an unfavourable or unclear alignment, e.g. small radii bends, may reduce the line-of-sight distance in a tunnel thus favouring collisions with obstacles on the road such as queuing vehicles.
• Vertical alignment: a high adverse gradient may slow HGV’s significantly, which would result in greater speed differentials between HGV’s and passenger cars, and could also cause a misperception of distance.
• Number of driving lanes: a sufficient number of traffic lanes with respect to the expected

EXPERIENCE WITH SIGNIFICANT INCIDENTS IN ROAD TUNNELS21
2017R35EN
traffic load, facilitates smooth traffic flow (in most cases ‘sufficient’ corresponds to having the same number of traffic lanes as on the open road); however, a higher number of driving lanes per driving direction increases the frequency of lane-changing manoeuvres, which causes interference with traffic on neighbouring lanes.
• Width of driving lanes: a narrower lane may cause interferences with traffic flow in the adjacent lane.
• Separation between driving lane and tunnel wall: a tunnel wall too close to the traffic lane may influence the lateral position of vehicles and their speed.
• Presence/distance of layby’s or emergency lanes: collisions following a breakdown can be avoided, if the effected vehicle does not block a driving lane.
• Tunnel length: miscellaneous experiences have been recorded such as “longer tunnel may influence driving concentration” so that the collision rate might increase with tunnel length or “as most collisions occur within the entrance and exit zones, as a consequence longer tunnels on average might exhibit lower collision rates”.
• Tunnel zones: frequency and type of collisions are different at different tunnel zones, e.g. at the entrance zone more collisions are expected due to slow adaptation of the eyes to the obscure environment expected in a tunnel.
• Traffic load, composition and characteristics: the total traffic load and specific traffic characteristics that include peak traffic flows and congestion, influence the frequency as well as consequences of collisions; the proportion of HGV’s also influences collision rates, e.g. due to difference in speed of HGV’s and passenger cars, and in particular, consequences of collisions.
• Speed: speed has a particular influence on consequences; hence monitoring and traffic calming measures may also influence the consequences.
• Intersections and ramps: Presence of on/off ramps or intersections may considerably influence collision rates.
• Tunnel lighting: the level of tunnel lighting as well as other lighting characteristics like brightness of tunnel walls as well as transition lighting in the entrance and exit zones may be relevant influencing parameters.
• Optical guidance for drivers: guidance provided by LED in the road or at the verge, or other measures, may be relevant in particular in the case of a specific horizontal alignment.
• Driver information and traffic management systems: may be of particular relevance to complex and urban tunnels with high traffic load.
• Technical standard of vehicles: may influence frequency and consequences of collisions.• Cultural factors: driving habits and vehicle maintenance may have considerable influence on
frequency and consequences of collisions.
The combined influence of these parameters is complex and hence quantification of parametric influence is challenging. However, there are published studies that provide information on this topic.
One of the first studies on collisions in road tunnels was carried out by the PIARC Technical Committee C5 Road Tunnels described in Technical Report Road Safety in Tunnels (1995) [8]. This Technical report concluded that: safety in road tunnels is better than on the open road, except in case of failures in the geometric design. Unidirectional motorway tunnels offer better road safety conditions than bidirectional tunnels. However, the aforementioned report is now over 20 years old and due to improvements in incident data collection and evaluation, the data now available is more informative. On the basis of this improved information on tunnel collisions, several studies have been carried out, addressing some of the influential parameters mentioned

22
EXPERIENCE WITH SIGNIFICANT INCIDENTS IN ROAD TUNNELS2017R35EN
above, individually and with respect to their interaction. Furthermore, for several countries comprehensive quantitative data are available, which can be used to calculate collision rates for specific types of tunnels (see chapter 3.5).
In a Swiss study on traffic safety in motorway tunnels from 2004 [35] a statistical multi-parameter analysis of tunnel collisions with respect to several tunnels and traffic parameters was carried out. Correlations between five parameters and the collision frequency and consequences could be identified:
• Unidirectional or bidirectional tunnel: unidirectional tunnels show a lower collision risk • Tunnel length: longer tunnels show a lower collision rate • Traffic load – AADT4 : tunnels with a high traffic load show a higher collision risk• Heavy freight traffic: a higher share of HGVs increases the collision risk (more severe
consequences) • Distance between driving lane and tunnel wall: an increasing distance reduces the collision rate
In risk analysis studies, the presence of on or off-ramps is often taken into account as a significant additional risk factor.
In an Austrian study on traffic safety in motorway tunnels [34] covering the period from 1999 – 2009, in particular the collision rates with respect to tunnel zones, were studied; 5 zones were defined:
• Pre-portal zone: 250m before the tunnel• Portal area: 10m before/after tunnel portal• Entrance area: 10m -150m inside the tunnel• Interior zone: more than 150m from both portals• Exit area: up to 250m behind the tunnel
The highest collision rates were found in the portal area followed by the entrance area, whereas the interior zone shows a significantly lower collision rate
Pre-portal area
0,00 0,05 0,10 0,15 0,20 0,25 0,30
Bidirectional tunnels
Unidirectional tunnels
Portal area
Entrance area
Interior zone
Exit area
Illustration 4 : collision rates (collisions with casualties per 1 million vehicle km) in different tunnel zones in austrian motorway tunnels [34]
4 Annual average daily traffic in a specific tunnel

EXPERIENCE WITH SIGNIFICANT INCIDENTS IN ROAD TUNNELS23
2017R35EN
In the same study 502 tunnel collisions were examined with respect to their causes. The results are shown in illustration 5. The dominating causes were found to be driving errors and lack of awareness. The study also revealed that unidirectional tunnels show a higher collision rate than bidirectional tunnels; however, the values established for bidirectional and unidirectional tunnels respectively are based on groups of tunnels with different average length and traffic. For this reason the Austrian tunnel risk model includes a specific function to take the influence of these parameters into account when calculating collision rates for an individual tunnel. In Austria, in an increasing number of tunnels an electronic speed control system is installed (“Section control”) which shows positive effects on collision risk.
Driver error
Inattention
Misinterpretation of conditions
Speed
Mechanical problems
Other events
0% 10%5% 15% 25% 35% 45%20% 30% 40% 50%
Bidirectional tunnels
Unidirectional tunnels
Illustration 5 : causes of collisions in austrian motorway tunnels [34]
An Italian study [30] has shown that in motorway tunnels with unidirectional traffic, the average collision rate is 12/108 veh∙km for collisions with casualties (fatalities and injuries). In the same monitoring period, on the motorway sections containing these tunnels the average collision rate was estimated to be 9/108 veh∙km for collisions with casualties. There is no relevant difference in the procedure used for collecting data on collisions with casualties in tunnels compared to that of open roads, so the rates can be considered as comparable. Moreover the risk of underreporting is negligible as injuries and fatalities are recorded systematically in tunnels and open sections. The data base was provided by the Italian Ministry of Transport. The study was based on a 4-year monitoring period from 2006 to 2009. During this time 762 collisions with casualties (fatal and injury collisions only) were registered in 195 unidirectional tunnel tubes.
The collision rates mentioned above show that the average rate of collisions with casualties is 33.3% higher in tunnels than on the motorways containing these structures. This increment is considered significant.
In general it can be said (relying on existing literature) that in Italy the frequency of all collisions (collisions involving material damage, injuries, and fatalities) in contrast to the frequency of collisions with casualties is lower in tunnels than on comparable open road sections.
24
EXPERIENCE WITH SIGNIFICANT INCIDENTS IN ROAD TUNNELS2017R35EN
In subsequent studies [31] [32] it has been shown for Italian motorway tunnels that the frequency5 of collisions with casualties occurring within tunnels increases with tunnel length, the annual average daily traffic per lane, the percentage of trucks and the number of lanes. In contrast, the sidewalk variable was not found to be statistically significant. In these studies a significant continuous reduction of collisions with casualties in motorway tunnels over the years was also found. This reduction over years might be attributable to: an increasing installation of electronic speed control systems on the motorways containing the tunnels investigated; the positive effects of the introduction of the driving licence with a penalty point system in the event of violation of the Highway Code; and to the implementation and/or reinforcement of safety measures in tunnels after October 2006, the date the European Directive 2004/54/EC came into force in Italy.
In a French study published in 2015 [47], in-depth statistical analyses were carried out in order to identify and understand the influence of specific parameters on the number of breakdowns, collisions and fires. The following parameters were taken into consideration: traffic volume, number of HGVs, tunnel length, type of traffic flow (unidirectional or bidirectional), urban or non-urban environment, speed limits, gradient, tunnel control centre, year of occurrence.
These analyses involve isolating a parameter and studying its influence on the number of incidents, with all other parameters being held constant6. The conclusions described below refer exclusively to collisions and “significant” parameters. A parameter is considered as significant if it has been proved to have a significant influence on collision rate (occurrence per veh.km).
The study was carried out to include only collisions with casualties and collisions with material damage. Two main conclusions were reached based on these in-depth statistical analyses.
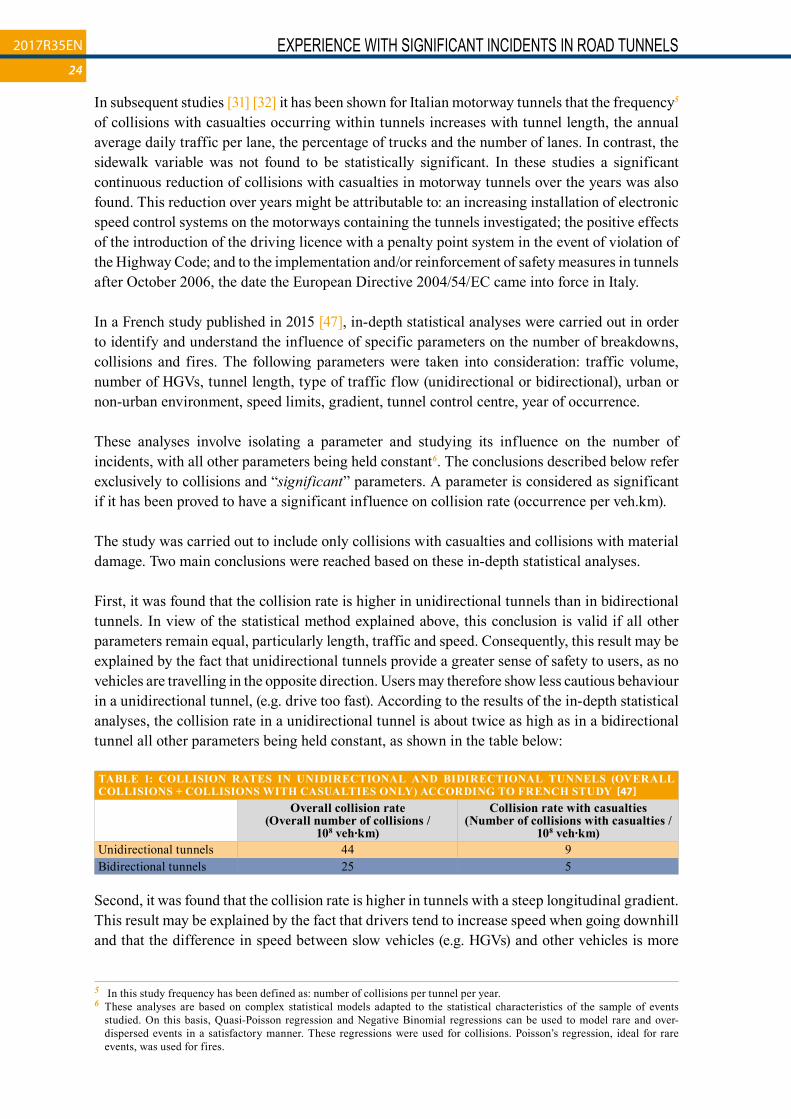
First, it was found that the collision rate is higher in unidirectional tunnels than in bidirectional tunnels. In view of the statistical method explained above, this conclusion is valid if all other parameters remain equal, particularly length, traffic and speed. Consequently, this result may be explained by the fact that unidirectional tunnels provide a greater sense of safety to users, as no vehicles are travelling in the opposite direction. Users may therefore show less cautious behaviour in a unidirectional tunnel, (e.g. drive too fast). According to the results of the in-depth statistical analyses, the collision rate in a unidirectional tunnel is about twice as high as in a bidirectional tunnel all other parameters being held constant, as shown in the table below:
TABLE 1: COLLISION RATES IN UNIDIRECTIONAL AND BIDIRECTIONAL TUNNELS (OVERALL COLLISIONS + COLLISIONS WITH CASUALTIES ONLY) ACCORDING TO FRENCH STUDY
Overall collision rate (Overall number of collisions /
108 veh∙km)
Collision rate with casualties (Number of collisions with casualties /
108 veh∙km)Unidirectional tunnels 44 9Bidirectional tunnels 25 5
Second, it was found that the collision rate is higher in tunnels with a steep longitudinal gradient. This result may be explained by the fact that drivers tend to increase speed when going downhill and that the difference in speed between slow vehicles (e.g. HGVs) and other vehicles is more
5 In this study frequency has been defined as: number of collisions per tunnel per year.6 These analyses are based on complex statistical models adapted to the statistical characteristics of the sample of events
studied. On this basis, Quasi-Poisson regression and Negative Binomial regressions can be used to model rare and over-dispersed events in a satisfactory manner. These regressions were used for collisions. Poisson’s regression, ideal for rare events, was used for fires.

EXPERIENCE WITH SIGNIFICANT INCIDENTS IN ROAD TUNNELS25
2017R35EN
significant on uphill sections. From a quantitative point of view, it was found that gradient effects are the same whether vehicles are moving upwards or downwards, i.e. collision rates are higher in tunnels with a high gradient (upwards or downwards). According to the results of the in-depth statistical analyses, correcting factors have been determined in order to estimate collision rates as a function of the longitudinal gradient. For example, the collision rate in a tunnel with a 3% gradient (upwards or downwards) is 1.3 times higher than in a tunnel with a 0% gradient. The table below shows how the overall collision rate (i.e. collisions with and without casualties) is modified according to the tunnel gradient:
TABLE 2: OVERALL COLLISION RATE CORRECTION FACTORS ACCORDING TO TUNNEL GRADIENTTunnel gradient Correction factor
0 % 1±1 % 1.1±2 % 1.2±3 % 1.3±4 % 1.4±5 % 1.5
Additional conclusions have been drawn according to the figures calculated and the in-depth statistical analyses:
• The overall HGV collision rate is 1.3 times higher than the overall collision rate for passenger vehicles. However, no statistically significant influence of the “Heavy goods vehicle” characteristic has been found for this result;
• According to a simple analysis on collision rates (collisions with casualties only, including fatalities), it has been found that the rate of collisions with casualties is lower in tunnels than on the open road, according to the figures in the table below:
TABLE 3 COLLISIONS WITH CASUALTIES: COMPARISON BETWEEN TUNNELS AND OPEN ROADS IN FRANCE - PERIOD 2007-2011
Tunnel Open roadRate of collisions with casualties (Number of collisions with casualties / 108 veh∙km) 6.35 13.7Injury rate (Number of injuries / 108 veh∙km) 6.86 16.4Fatality rate (Number of fatalities / 108 veh∙km) 0.21 0.76
The above-cited literature from studies in Switzerland, Italy, Austria and France shows that different results have been obtained (some support each other, others seem to be contradictory), and as a consequence the influence on collisions in tunnels due to the aforementioned factors needs to be better understood. The discussions between the experts of the working group during the elaboration of this report also revealed that great care has to be taken when comparing and discussing results from different studies, because the results are influenced by many factors, such as conditions and methods for data acquisition, quality and completeness of data, definitions and methods applied for the study as well as specific national aspects relevant for traffic safety and traffic management. The table below provides a summary of the most relevant findings and conclusions of the above-cited studies, reflecting this issue:

26
EXPERIENCE WITH SIGNIFICANT INCIDENTS IN ROAD TUNNELS2017R35EN
TABLE 4 SURVEY OF FINDINGS OF SOME STUIDES ON TUNNEL COLLISIONS Influencing factor Salvisberg, 2004
[35], SwitzerlandCaliendo et al. 2014,[30], Italy
Nussbaumer et al. 2009 [34], Austria
CETU 2015 [47], France
Traffic mode:Unidirectional or bidirectional
Unidirectional tunnels show a lower collision risk
Only unidirectional tunnels are investigated
Unidirectional tunnels show a higher collision rate than bidirectional tunnels (based on groups of tunnels with different average length and traffic)
Both rate of collisions with casualties and overall collision rate are higher in unidirectional tunnels than in bidirectional tunnels (all other parameters being held constant)
Traffic load (AADT) Tunnels with a high traffic load show higher collision rates
The frequency of collisions with casualties increases with AADT per lane
Traffic composition A higher share of HGVs increases the consequences of collisions
The frequency of collisions with casualties increases with the percentage of trucks
Overall HGV collision rate is 1,3 times higher than overall passenger car collision rate, (influence not statistically significant)
Tunnel zones Highest collision rate in portal area followed by entrance area, significantly lower collision rate in interior zone
Overall collision rate is higher in portal areas than in the middle of tunnels
Tunnel length Longer tunnels show a lower collision rate
The frequency of collisions with casualties increases with tunnel length
The collision rate decreases with tunnel length (due to influence of high rates in portal zone)
Tunnel slope Overall collision rate is higher in tunnels with a high longitudinal gradient.
Electronic speed control systems
An increasing Installation of electronic speed control systems appears to show positive effects on the reduction of collisions over time
An installation of electronic speed control system shows positive effects on frequency and consequences of collisions
Tunnels and open road
The average rate of collisions with casualties is higher in tunnels than on the motorways containing these structures
The rate of collisions with casualties is lower in tunnels than on open road sections
Rate of collisions with casualties is lower in tunnels than on open roads
Further studies are required to improve the knowledge on tunnel collisions (in particular the interaction of the various influencing parameters). To provide a sound basis for such studies the specific requirements for data collection on tunnel collisions needs to be defined, covering both the incident itself as well as the boundary conditions and influencing parameters as mentioned above.

EXPERIENCE WITH SIGNIFICANT INCIDENTS IN ROAD TUNNELS27
2017R35EN
3.4. DATA COLLECTION ON TUNNEL COLLISIONS
Depending on the relevance of the collision, the objectives of data collection and the further use of the data, the amount of data to be collected can vary considerably. The list presented below may be considered as a largely comprehensive list of data which can be collected for a collision, and may be used for a broad range of incident types. For the definition of the scope of data to be collected in practice, reference is made to chapter 2 (in particular 2.5), where relevant practical aspects and limitations are discussed. A specific reference for a minimum data set to be used for supporting risk analysis is also presented as an example of data collection for a specific application.
General information• Name and identification code (if any) of the tunnel.• Time (date/hour): time of occurrence and of detection of the collision, duration of the event,
time for return to normal traffic.• Location: tube, travel direction of involved vehicles, location on the route, traffic lane, shoulder,
specific structures in the vicinity of the event, etc. In order to record the differing driving (environmental) conditions, it is recommended to adopt a predefined tunnel zoning system and to categorize the location of the incident accordingly. A list of tunnel zoning systems is presented in the present report in Appendix 3.1. It should be noted that in various countries different definitions of the zoning system are used. This makes it difficult to compare results between different countries.
Tunnel profile and traffic information• Tunnel description: a detailed tunnel description in most cases is not necessary as this
information can be taken out of the relevant data base for the tunnel infrastructure. What is needed is a brief description of structural and geometrical characteristics of the tunnel (length, gradient, emergency lanes, lay-bys etc.) focusing on the vicinity of the event, specific safety measures in action (prevention – mitigation – emergency response).
• Road description: number of lanes, horizontal alignment, gradient, relevant safety facilities, speed limit etc.
• Road surface in the vicinity of the event: type (antiskid asphalt concrete, antiskid concrete, asphalt or concrete surface), condition etc.
• Road and tunnel signing and marking: availability, condition, location.• Characteristic traffic data (AADT, traffic composition, in particular share of HGVs etc.), specific
traffic characteristics (in particular congestion), traffic situation before and during the event.• Regulations for the transport of dangerous goods (regime, classification according to ADR etc.)
Collision profile• Collision identification (e.g. a unique number-based system) and/or description of the type of
collision. • It is recommended to use a standardization system in order to avoid arbitrary verbal descriptions
as much as possible. Classification or description of incidents should be based on just what was observed and not on what has been considered as the initial cause. The basis of the standardisation system (or of the free description, if such a system is not adopted), for the classification of collisions should take into account several aspects of the components which describe the event. Such aspects which must be answered by the classification system could be:
– Vehicles involved in the collision: DG vehicle/No DG vehicle/None.

28
EXPERIENCE WITH SIGNIFICANT INCIDENTS IN ROAD TUNNELS2017R35EN
– Consequences to human life and health: Yes/No. – Material damage (tunnel infrastructure, installations, or equipment): Yes/No. – Material damage (vehicles or property): Yes/No. – Damage to the environment: Yes/No. – Situation: Fire / Vehicle(s) collision / Vehicle breakdown / Structure breakdown / Meteorological conditions / Insufficient lighting level / Pedestrian presence / Cyclist presence / Object presence.
– Type of vehicle collision (head-on collision, rear-end collision, side collision, sideswipe collision, single vehicle collision).
• Collision consequences: number of slightly injured persons, number of seriously injured persons, number of fatalities, damage to tunnel’s structure or installations or equipment, damage to vehicles, damage to property (third party damage), indirect damage (losses), damage to immaterial values (e.g. loss of reputation), damage to environment. Above mentioned “damages” should be described accurately and, if possible, estimate the economic cost.
• Road surface in the vicinity of the event: actual conditions – e.g. snowy, wet, icy surface, black ice, slippery surface.
• Visibility conditions: fog, smoke, dust, suspended particulates, inadequate lighting.• Environmental conditions: dry, fog, rain, snow, wind, icicles, ice fog, abnormal gas concentration.• Presence of on-going road works (construction, maintenance, etc.).• Obstacles on the road surface.• Event recorded: by closed circuit TV (CCTV), inductive loops, automatic incident detection,
other means.• Use of safety facilities: lay-by, nature and use of emergency exits.• Use and activation of safety equipment: ventilation system, barriers, bollards, radio
communication, radio frequency interruption and broadcast of specific emergency messages, information provided to users.
• Tunnel systems technical failures (number, origin of the failures).• Main causes of collision (speeding, overtaking, right of way, mechanical breakdown, etc).• Emergency service involvement.• Actual time of alarm and alert of involving external emergency services and, if any, the internal
ones.• Actual time of intervention by involved services (i.e. fire brigade, traffic police, ambulance
service).• Real sequence of events is highly recommended to be recorded
Driver(s) and vehicle(s) profilePersonal data have to be treated with care according to the legal provisions and restrictions• Driver data: category of license, driver experience, sex, age, nationality education.• Impairment of the driver: alcohol, drugs, other.• Condition of the driver: alert, tired, impulsive, sudden indisposition, suicidal.• Use of restraint devices: helmet, safety belt, child seat.• Licence plate number (if not prohibited by law).• Type and number of vehicle(s) involved. • In order to describe the type of vehicles and to avoid arbitrary descriptions, it is recommended
to use prescribed classification systems for categorisation of vehicles. Such categorisation systems are defined for instance in two EC-Directives (2002/24/EC of 18th March 2002 and 2007/46/EC of 5th September 2007).
• Vehicle operator: private, commercial, public transport.• Age of the vehicle.

EXPERIENCE WITH SIGNIFICANT INCIDENTS IN ROAD TUNNELS29
2017R35EN
Behaviour of involved people • Description and analysis of behaviour of tunnel users involved in the incident, either recorded
by CCTV or by interview, or witness, or any other reliable means.• Description and analysis of operator’s behaviour.• Description and analysis of emergency services behaviour.
From the point of view of data evaluation with respect to establishing quantitative information and input data for risk analysis a minimum data set can be defined as follows:
General information• Name and identification code, if this is the case, of the tunnel.• Time (date/hour): time of occurrence and of detection of the collision.• Location: tube, travel direction of involved vehicles, location on the route, tunnel zone, traffic
lane, shoulder, specific structures in the vicinity of the event, etc.
Tunnel profile and traffic information • Tunnel description: a brief description of structural and geometrical characteristics of the tunnel
(length, gradient, emergency lanes, lay-bys) focusing on the vicinity of the event, specific safety measures in action.
• Road description: number of lanes, gradient, horizontal alignment, relevant safety facilities, speed limit (prevention – mitigation – emergency response).
• Road and tunnel signing and marking: availability, condition, location.• Characteristic traffic data (AADT, traffic composition, in particular share of HGVs), specific
traffic characteristics (in particular congestion) traffic situation before and during the event.• Regulations for the transport of dangerous goods (regime, classification according to ADR)
Collision profile• Collision identification (e.g. a unique number-based system) and/or description of type of
collision. • Collision consequences: number of lightly injured, number of heavily injured, number of
fatalities, damage to tunnel’s structure or installations or equipment, damage to vehicles, damage to property (third party damages).
• Presence of on-going road works (construction, maintenance, etc.).• Obstacles on the road surface.• Event recorded: by closed TV circuit (CCTV), inductive loops, automatic incident detection,
other means.• Use of safety facilities: lay-by, nature and use of emergency exits.• Use and activation of safety equipment: ventilation system, barriers, bollards, radio
communication, radio frequency interruption and broadcast of specific emergency messages, information provided to users.
• Main causes of collision: speeding, overtaking, right of way, mechanical breakdown etc.• Emergency service involvement.• Actual time of alarm and alert of involving external emergency services and, if any, the internal
ones.• Actual time of intervention by involved services (i.e. fire brigade, traffic police, ambulance
service).• Real sequence of events is highly recommended to be recorded

30
EXPERIENCE WITH SIGNIFICANT INCIDENTS IN ROAD TUNNELS2017R35EN
Driver(s) and vehicle(s) profile• Type and number of vehicle(s) involved.
For drawing conclusions for incident management on object level additional information may be required.
3.5. COLLISION RATES
The collision rate (CR) considered in this report applies to collisions with casualties only and is defined as the number of collisions with casualties per year divided by the annual traffic performance of the respective tunnel (expressed as per hundred million vehicle-kilometre).
Where:AADT: Annual average daily traffic in a specific tunnel [vehicles/day]CWC: Annual number of collisions with casualties which occurred in the tunnel [collisions/year]Collisions with casualties (CWC) are collisions which caused at least one injury or fatality. L: Length of tunnel tube [km]The above formula refers to a single tunnel. For a set of tunnels this formula must be changed as follows:
Where:CRn: The collision rate for the set of n tunnels.CWCn: Annual number of collisions with casualties (injured people and/or fatalities) in the set of n tunnels [collisions/year].Li: Length of tunnel i [km].AADTi: Annual average daily traffic in tunnel i [vehicles/day].
The collision rates presented in the body of this report are based only on the information immediately available to the task group members responsible for the drafting of the report. For more specific information, the basis of these data and the background, refer to appendix 3.2.
Bidirectional and unidirectional tunnels are addressed separately to take into account the different conditions and to enable assessment of whether these different conditions lead to a different collision rate.
With the data included in appendix 3.2 it is possible to calculate the average collision rate for road tunnels for some countries. These rates are not necessarily representative of all tunnels of this country, but represent only a sample.

EXPERIENCE WITH SIGNIFICANT INCIDENTS IN ROAD TUNNELS31
2017R35EN
TABLE 5 AVERAGE COLLISION RATES (CR) FOR ROAD TUNNELS IN VARIOUS COUNTRIES (COLLISIONS WITH CASUALTIES)
Country Type of traffic Collision rate (CR) (per 108 veh. km)Austria bidirectional 3.60 *
Argentina bidirectional 5.74 **France bidirectional 5.30 ***
Norway bidirectional 11.72 ****Spain bidirectional 9.30 *****
Vietnam bidirectional 71.98 (18.00) ******Collision rate (CR) (per 108 veh. Km)
Austria unidirectional 9.80 *Denmark unidirectional 3.97
France unidirectional 8.72 ***Italy unidirectional 12.02
Netherlands unidirectional 5.35Norway unidirectional 11.60 ****
South Korea unidirectional 2.10Spain unidirectional 6.30 *****
Switzerland unidirectional 7,58 *******
* Figures not calculated in this report but obtained from the report Safety of Road Tunnels - Traffic Safety in Highway and Expressway Tunnels (1999 to 2009) [34]**The collision rate reported for Argentina covers only one tunnel (Túnel Subfluvial Uranga-Sylvestre Begnis) [50]*** Figures not calculated in this report but obtained from the report [47]**** Figures are derived from the report “Studies on Norwegian road tunnels II. An analysis on traffic incidents in road tunnels 2001-2006” [29]***** Figures not calculated in this report but obtained from the report [53]****** The collision rate reported for Vietnam covers only one tunnel (Hai Van tunnel), the collision rate includes all collisions – also those without casualties; the number in brackets gives an estimation of the rate for collision with casualties (reduction by a factor 4 – based on expert judgement); this number is included in illustration 6 ******* The rate covers all Swiss tunnels (mainly unidirectional tunnels) as given in [42]Background data concerning collision rates see appendix 3.2, table 11 and table 12.
Austria
Argentina
France
Norway
SpainVietnam
7 collisions per 108 veh. km
3,5 collisions per108 veh. km
11 collisions per 108 veh. km
0,0
50,0
100,0
150,0
200,0
250,0
300,0
350,0
400,0
450,0
500,0
550,0
600,0
'0,0 '10,0 '20,0 '30,0 '40,0 '50,0 '60,0 '70,0 '80,0
)C
WC( snoisilloc fo reb
mun latoT
Traffic volume [108 veh. km]
Illustration 6: total number of collisions in the records shown in relation to the corresponding traffic for various countries – reference line for collision rates in bidirectional tunnels

32
EXPERIENCE WITH SIGNIFICANT INCIDENTS IN ROAD TUNNELS2017R35EN
Austria
DK
France
Italy
NL
Norway
South Korea
Spain
Switzerland
7,5 collisions per 108veh. km
5 collisions per 108 veh. km
11 collisions per 108 veh. km
0,0
200,0
400,0
600,0
800,0
1000,0
1200,0
1400,0
1600,0
1800,0
2000,0
2200,0
2400,0
2600,0
2800,0
3000,0
'0,0 '50,0 '100,0 '150,0 '200,0 '250,0 '300,0 '350,0 '400,0
)C
WC( snoisilloc fo reb
mun latoT
Traffic volume (108 veh. km)
Illustration 7: total number of collisions in the records shown in relation to the corresponding traffic for various countries – reference line for collision rates in unidirectional tunnels
The average collision rate (CR) for different countries varies from approximately 2 to 12 in unidirectional tunnels and from 3 to 18 in bidirectional tunnels. These differences might not only be attributable to different road safety parameters (e.g. driving behaviour, technical standard of vehicles) or tunnel and traffic parameters (like tunnel geometry, tunnel equipment, AADT etc.) but also to different data acquisition factors (like collection and evaluation methods, size and completeness of data sample, number and length of tunnels investigated, monitoring period). Some examples are discussed in the paragraphs below.
The collision rates presented in table 5 for instance were calculated on the basis of incident statistics that cover a certain period of time, which differs from country to country. When evaluating the data it was observed that in data covering a longer period of time the collision rates were decreasing over time. Hence the rates presented in table 5 represent an average value for the registered period. The reasons for this effect have not been addressed and therefore this effect is not discussed in more detail in this report. It is not clear at this stage, to what extent this decrease in rates of collisions with personal injuries is due to a general increase in traffic safety or due to specific efforts to increase tunnel safety in particular.
Furthermore, the statistics on collision rates cover different types of tunnels; for instance, in Austria and Italy the data refers to motorway tunnels only, whereas in Norway all tunnel types are included. Moreover, the standard of tunnel equipment in many Norwegian tunnels is quite different to other countries, because in Norway many tunnels are located in quite remote areas.
French and Austrian collision rates (CR) show that bidirectional tunnels have lower rates than unidirectional tunnels. In Austria the collision rate of 9.8 collisions per 100 million vehicle kilometres for unidirectional tunnels is approximately 2.7 times higher than that of bidirectional tunnels (3.6). In France the collision rate of 8.72 collisions per 100 million vehicle kilometres for unidirectional tunnels is approximately 1.6 times higher than that of bidirectional tunnels (5.3). This at first sight seems to be in contrast with the common sense and experience. However,

EXPERIENCE WITH SIGNIFICANT INCIDENTS IN ROAD TUNNELS33
2017R35EN
looking at the background of these calculated rates some possible explanations can be offered.
• Bidirectional tunnels in France and Austria are much longer than the unidirectional ones. In the Austrian study [34] the average length of bidirectional tunnel is significantly higher (4.2km) than that of unidirectional tunnels (1.25km). On average, bidirectional tunnels are three times longer than unidirectional tunnels. In this Austrian study the highest CR were found in the portal area followed by the entrance area, whereas the interior zone shows a significantly lower collision rate. Taking into account that a significant percentage of collisions occur in the entrance and exit zones (of fixed length, same for both types of tunnels) the calculated rates for the whole tunnel length are highly influenced by this length, resulting in lower rates for longer tunnels (the case of bidirectional).
• Unidirectional tunnels provide a greater sense of safety to users, as no vehicles are travelling in the opposite direction. Users may therefore show less cautious behavior in a unidirectional tunnel, (e.g. drive too fast). In the Austrian study the dominating causes were found to be driving errors and lack of awareness
• There could also be an influence of traffic volume. In Austria the traffic volume (per lane) is lower in these bidirectional tunnels, which might reflect a minor exposure to collisions compared to unidirectional ones. However, this does not seem to be a valid explanation according to the French study. This study has shown that the collision rate is higher in unidirectional tunnel whatever the traffic volume
The collision rates presented above represent average values of certain sets of tunnels. Such calculated average rates if considered as unique output of statistical data processing may conceal important information. A simple reading of the average values does not give any information about the influence of parameters reported above which may have a significant influence on the results. To go some way to account for these influences, in Austria for instance the basic average incident rates – if used in risk analysis – are adapted to specific tunnels by applying modification factors that depend on tunnel length and traffic characteristics of the tunnel under investigation. Although tunnel length and traffic volume are the most obvious influencing parameters, there might be others which influence tunnel collision rates (see list in chapter 3.3). Hence it can be concluded that it is challenging to compare collision rates on a statistical level without having specific knowledge on the underlying conditions. Despite some recent studies on the topic, there is still a lack of knowledge on the interaction of the various parameters influencing collision rates in road tunnels.
For an in-depth scrutiny of road tunnel safety, specific collision rates may be calculated and used based on the above formula. Issues of particular interest for road tunnel safety can be highlighted and accentuated by focusing on specific collision rates. Such specific collision rates can be the ones in different tunnel zones, or rates in different time windows, distribution of rates to individual drivers groups or involved vehicle types, they may refer to specific geometrical characteristics (e.g. zones of different longitudinal gradients), to specific types of collisions etc..
Regarding the analysis period, the approach described in PIARC Report 05.04.B 1995 “Road Safety in Tunnels” [8] (chapter IV.1 - General comments IV1.1), remains valid. The analysis period and the number of events are essential factors for the registered rates. Plus or minus one incident may change the rates considerably if an individual tunnel is considered. Generally, calculations of collision rates based on large numbers of observations (collisions) can provide more accurate estimates of the true, underlying rate. Conversely, calculations based on small

34
EXPERIENCE WITH SIGNIFICANT INCIDENTS IN ROAD TUNNELS2017R35EN
numbers of observations may fluctuate dramatically from year to year, or differ considerably from one tunnel to another, even when differences seem at first glance to be not significant. But these differences and their significance are very important given that calculations of collision rates are based on small samples. In our opinion it should be adequate to consider an analysis period of 5 years at least in urban areas (high traffic) and 7-10 years in interurban areas (mean and low traffic), so that the data might be more significant from a strictly statistical viewpoint.
3.6. APPLICATION OF THE DATA
The availability and accessibility of up-to-date tunnel collision data is a fundamental element for an efficient road tunnel safety management system. These data have many uses and are incorporated in various ways into the safety management system, depending on many factors such as the structure of this system, the legal and regulatory requirements and obligations, the availability and exhaustiveness of the data, the preferences and the priorities of the society etc. The most frequent uses of the collision data are:
• To support the application of risk analysis for road tunnels: the collision data along with their statistical processing and other supplementary data constitute the basis of the application of risk analysis methodologies which allow for a quantitative assessment of the risks in a tunnel. The key input data strongly depends on the risk analysis methodology and its requirements. Hence a specific quantitative risk analysis method requires as input the collision rates for all anticipated types of collisions and the implied consequences. But some qualitative risk analysis methods (scenario analysis) also require collision data in order to select the most representative scenarios and to select reliable input parameters such as response time, time to achieve the closure of the tunnel etc. The required level of exhaustiveness of collision data is directly linked to the complexity and the particular requirements of the applicable risk analysis methodology. The reliability and the uncertainty of the outcomes of risk analysis are strongly influenced by the reliability and the uncertainty of the input data for collisions. When these data are applied as input for risk analysis special attention must be given to the specific conditions under which the collision data have been developed. Before collision data can be applied to a risk analysis for a specific tunnel it has to be assessed whether the conditions of this tunnel are comparable and the necessary calibrations have been made, if required. Further, the above presented collision rates usually represent “basic” values which have to be calibrated at least for the most significant influencing parameters (like tunnel length and traffic volume, horizontal alignment, tunnel gradient, existence of intersections or other complex underground layouts), in order to represent applicable collision rates for the specific tunnel considered. The Dutch study “Guideline for incident probabilities” [36] for instance specifically addresses the input of incident data in the risk analysis procedure. The incident frequency is an important input value in the Dutch Quantitative risk analysis method. For existing tunnels the actual statistical data can be used, for new (to be built) tunnels an estimation has to be made. To provide the risk analyst with better data and tools for the estimation of the incident frequency, research was done in this study on the (quantitative) relation between traffic and tunnel/road design characteristics and incident frequency. Based on literature research and expert judgment correction factors on the basic incident frequency were determined for 15 factors such as the number of traffic lanes, the width of the traffic lanes, tunnel length, share of heavy goods vehicles, traffic intensity etc. The results were checked by comparing the outcome of the tool with the actual incident frequency of 17 existing state owned tunnels. This verified that the results of the tools were within the same range as the actual incident frequencies and therefore gives confidence in the

EXPERIENCE WITH SIGNIFICANT INCIDENTS IN ROAD TUNNELS35
2017R35EN
method. Another issue when applying collision data as input in risk analysis is the projection of the data to the timeframe for the risk analysis; this is outside the scope of this report. In other countries (e.g. in Austria [43] and Switzerland [42]) information and data (such as incident rates and influencing parameters) derived from national or international incident statistics are implemented in the respective tunnel risk models.
• For undertaking a detailed analysis of the occurrence and the course of the specific collision: by applying such a scenario-based approach the actions by the different parties involved (operating personnel, safety officer, tunnel manager, internal or external emergency team, maintenance team, etc.) and the effectiveness of safety facilities can be examined. The aim in this case is to assess the quality and the effectiveness of the actions taken by the involved parties (response, coordination, management, application and applicability of procedures and provisions of Emergency Action Plans, etc.) and the pertinence and performance of the equipment, safety facilities and procedures used to disclose any “black spots” or increased frequencies of specific types of collisions in the tunnel considered. For example an increased rear – end collision rate in a specific tunnel may indicate a poor perception of distances and actions to improve this perception have to be undertaken (e.g. adoption of LEDs signs). This may be the starting point for a specific study on an identified problem, for instance to develop a statistical data set for the specific tunnel or a set of tunnels (e.g. collision rates, use of equipment)
• Disclosure of repeatedly observed inappropriate driving behaviour in a tunnel, thus offering an opportunity to implement specific supervision measures or to improve the drivers training program or to launch information campaigns and brochures.
Accordingly, collection and evaluation of tunnel collision data are applied at two levels:
• Application at a local level (concerning a specific tunnel): constitutes an important basis for the assessment of the acceptability of the real or scheduled safety of the specific tunnel and also supports the decision making process regarding general road safety improvements of a specific tunnel. Furthermore, the evaluation of the collisions which occurred in a specific tunnel may allow the detection of deficiencies in the infrastructure, equipment, signalling, emergency response, etc. and to propose and implement appropriate improvement measures.
• Application at a national or international level: provides a basis for a reference framework to inform safety policy development by the authorities (regarding tunnels as a specific element of the whole road system). In particular, it allows risk quantification for the critical events that may endanger life; the evaluation of the effectiveness of safety installations; and possibly the comparison of the level of safety of a given tunnel with a national or international benchmark. The evaluation of collisions at network level allows the main incident rates of different types of tunnels to be obtained, thus providing data (national statistics for specific types of tunnels) for risk analysis for tunnels in the design stage or in operation without sufficient specific data. On this basis, prioritisation of improvement measures can be made – together with other relevant aspects (e.g. operational and/or financial parameters). This general assessment can be complemented with specific analyses, to study for instance the occurrence of collisions at specific locations in a tunnel (e.g. lay-bys) or the influence of specific types of equipment (like different systems of tunnel lighting).
General information about road incident investigation can be found in PIARC Technical Report 2013R07 “Road accident investigation guidelines for road engineers” [40].