Experience based Technical Sidetrack
86
Experience based Technical Sidetrack Tural Huseynov Petroleum Engineering Supervisor: Sigbjørn Sangesland, IPT Co-supervisor: Bjørn Brechan, IPT Department of Petroleum Engineering and Applied Geophysics Submission date: July 2016 Norwegian University of Science and Technology
Transcript of Experience based Technical Sidetrack

Experience based Technical Sidetrack
Tural Huseynov
Petroleum Engineering
Supervisor: Sigbjørn Sangesland, IPTCo-supervisor: Bjørn Brechan, IPT
Department of Petroleum Engineering and Applied Geophysics
Submission date: July 2016
Norwegian University of Science and Technology


i
Summary
Drilling is more experience-based than any other field in oil and gas industry. It involves many
industry standards and regulations in order to enhance technical integrity. In addition, the “best
practices” provide a system-wide reference for the engineers to plan as well as execute drilling and
completion operations. If it is possible to transfer the experiences globally, the best practices and
procedures can be even further improved. This approach is a paradigm shift from the tradition and
can achieve the enormous enhancements in the drilling industry.
In this thesis, sidetracking activity is introduced to show the applicability of the experiences,
regulations and industry standards for drilling operations. The method to sidetrack a wellbore, the
required BHA design and operational parameters are established mainly by the experiences
extracted from NTNU-governing documents and NORSOK Standards. Sidetracking from cement
plug with the rotary steerable system, some experience-based recommendations and adjustments
are concluded for our well model.
Moreover, the original and sidetracked well models are simulated in Landmark engineering
programs. The well trajectories are designed in Compass, hydraulic as well as torque and drag
programs are simulated in WellPlan, the casing designs are built in WellCat in order to check the
safety of the well models and find critical results, which can threaten the operations. Furthermore,
the risks in sidetracking and drilling operations are revealed and assessed based on the field
experiences, where the risk levels are also reduced to the acceptable degree.
The observations of this research study indicate that the experience transfer is usually running
smoothly in the same field. However, it is difficult to share the “learned lessons” among the
different fields. Therefore, drilling organizations should be eager to incorporate and establish a
simulator/experience transfer system that stores all industry standards and experiences in one
database. In addition, the experience transfer system should have the capability to integrate with
currently available software package in the company, which will make the system more user-
friendly to find relevant standards and experiences.
Obviously, there will be challenges to find appropriate information out of the huge database in the
experience transfer system. Thus, the system should have the well-organized search mechanism,
which is another research study of this topic.

ii

iii
Acknowledgement
This thesis is completed at the Department of Petroleum Engineering and Applied Geophysics,
Norwegian University of Science and Technology (NTNU). The main objective of the project has
been to write a scientific paper and specialize in drilling engineering. The report has been prepared
in close cooperation with professors at NTNU.
Hence, I would like to express my gratitude to my supervisor, Professor Sigbjørn Sangesland for
providing me with this opportunity. Working together with him on this topic, led me to improve
my knowledge.
A deep gratitude goes to Bjørn Brechan, my co-supervisor. I would like to thank him for arranging
meetings with the engineers at Statoil, all the input data he has supplied and all the knowledge he
has shared, which kept me motivated through the semester. I could not have had a better supervisor.
Last but not the least, I am thankful to my fellow students for sharing their knowledge and
interesting discussions made during the semester.
Tural Huseynov
Trondheim, July 2016

iv

v
Table of Contents
Summary .......................................................................................................................................... i
Acknowledgement ......................................................................................................................... iii
Table of Contents ............................................................................................................................ v
List of Figures ............................................................................................................................... vii
List of Tables ................................................................................................................................. ix
1 Introduction ............................................................................................................................. 1
1.1 Case Study ........................................................................................................................ 1
1.2 Methodology .................................................................................................................... 1
2 Fundamental Theory ................................................................................................................ 3
2.1 Experience and Work Process .......................................................................................... 3
2.1.1 Drilling Workflow .................................................................................................... 4
2.1.2 Drilling Performance Curve ...................................................................................... 5
2.1.3 Positive and Negative Experiences ........................................................................... 6
2.1.4 Risk Assessment ....................................................................................................... 8
2.1.5 Importance of Offset Well Data ................................................................................ 9
2.2 Sidetracking Methods ..................................................................................................... 10
2.2.1 Sidetracking Procedure ........................................................................................... 10
2.2.2 Design Considerations ............................................................................................ 12
2.2.3 Cement plug vs Openhole whipstock ..................................................................... 14
3 Sidetracking Well Model - Industry Standards & Results .................................................... 17
3.1 Wellbore Visualization ................................................................................................... 18
3.1.1 Section Overview .................................................................................................... 20
3.2 Casing Design ................................................................................................................ 20
3.2.1 Casing Depth ........................................................................................................... 20
3.2.2 TOC Depth .............................................................................................................. 21
3.2.3 Design Factors ........................................................................................................ 22
3.2.4 Lost Returns with mud drop ................................................................................... 22
3.3 Operational Risks ........................................................................................................... 23
3.3.1 Risks during Sidetracking Activity ......................................................................... 23
3.3.2 Risks during Drilling 12 ¼” section ....................................................................... 25
4 Evaluation of the Results and Discussion .............................................................................. 29

vi
4.1 Method Selection............................................................................................................ 29
4.2 BHA Design ................................................................................................................... 31
4.2.1 RSS vs PDM ........................................................................................................... 31
4.2.2 Gyro vs MWD......................................................................................................... 33
4.2.3 BHA Capacity ......................................................................................................... 34
4.3 Operational Procedure .................................................................................................... 35
4.4 Operational Parameters .................................................................................................. 35
4.5 Risk Assessment ............................................................................................................. 36
4.5.1 Risk Assessment for Sidetracking Activity ............................................................ 36
4.5.2 Risk Assessment for Drilling 12 ¼” section ........................................................... 39
5 Conclusion ............................................................................................................................. 43
6 Further Work ......................................................................................................................... 45
Appendices .................................................................................................................................... 47
Appendix A, Drilling Work Process ......................................................................................... 47
A.1 Work Process in Operating Company ............................................................................ 47
A.2 Recommendations for Company Structure ..................................................................... 47
A.3 Scheduling & Reporting ................................................................................................. 48
A.4 Drilling Integrated Workflow Environment ................................................................... 50
Appendix B, Technical Sidetrack.............................................................................................. 51
B.1 Sidetracking Procedure with a whipstock ....................................................................... 52
B.2 Advanced Whipstock System ......................................................................................... 53
Appendix C, Deflection Tools and Techniques ........................................................................ 55
C.1 PDM vs RSS ................................................................................................................... 56
Appendix D, Outputs of Engineering Programs ....................................................................... 57
D.1 Pressure Prognosis .......................................................................................................... 57
D.2 Well Profile ..................................................................................................................... 58
D.3 Torque and Drag Analysis .............................................................................................. 60
D.4 Hydraulic Evaluations .................................................................................................... 63
D.5 Casing Program .............................................................................................................. 66
Abbreviations ................................................................................................................................ 69
Bibliography ................................................................................................................................. 71

vii
List of Figures
Figure 1. Drilling workflow (François Clouzeau, 1998). ............................................................... 4
Figure 2. A typical learning curve for the drilling process (Hellström, 2010). .............................. 6
Figure 3. The Risk Assessment Process (Main, 2004). .................................................................. 8
Figure 4. A sequence of operation to kick off the cement plug (Broussard et al., 2009). ............ 11
Figure 5. The gravity effects over a sidetracking operation. The gravity supports sidetracking if
the toolface is oriented to the low-side (Ketil Tørge et al., 2014). ............................................... 13
Figure 6. 3D Views of the original and sidetracked wellbore trajectories. A red line represents
the sidetracked well trajectory, while a blue line is the original wellpath. T1-T5 are the
geological targets. ......................................................................................................................... 18
Figure 7. Design Limit Plot for 13 3/8” intermediate casing. ....................................................... 23
Figure 8. The position of the MWD tool in the openhole at the beginning of the sidetracking
operation. ...................................................................................................................................... 33
Figure 9. Integrated workflows enabled through DIWE (Mohan et al., 2014). ............................ 51
Figure 10. Technical Sidetrack (Baker_Hughes, 1995). ............................................................... 52
Figure 11. Whipstock and operational sequences for drilling (Bourgoyne et al., 1986). ............. 53
Figure 12. A bit tilt angle and sideforce (Heriot-Watt_University, 2010). ................................... 55
Figure 13. Pressure Prognosis. ...................................................................................................... 57
Figure 14. 3D Views of All Present Wells in the Template. A red line is sidetracked wellbore,
while the blue one is the original wellbore. .................................................................................. 58
Figure 15. Vertical Planes of Original and Sidetracked Wellbores. A red line is sidetracked well,
while the blue one is the original well. ......................................................................................... 59
Figure 16. Inclination and Azimuth changes along Original and Sidetracked Wellbores. ........... 60
Figure 17. Effective Tension vs Depth for the Sidetracked Well. ................................................ 60
Figure 18. Hook Load vs Depth for the Sidetracked Well. .......................................................... 61
Figure 19. Torque vs Depth for the Sidetracked Well. ................................................................. 61
Figure 20. Fatigue Ratio vs Depth for the Sidetracked Well. ....................................................... 62
Figure 21. Side Force vs Depth for the Sidetracked Well. ........................................................... 62
Figure 22. Circulating Pressure vs Depth for the Sidetracked Well. ............................................ 63
Figure 23. Cuttings transport for the Sidetracked Well. ............................................................... 63
Figure 24. ECD vs Depth for the Sidetracked Well. ..................................................................... 64

viii
Figure 25. Min. Flow rate vs ROP for the Sidetracked Well. ....................................................... 64
Figure 26. Pump Pressure vs Pump Rate for the Sidetracked Well. ............................................. 65
Figure 27. Well Schematic – Casing program for the Sidetracked Well. ..................................... 66
Figure 28. Design limits of 9 5/8” production casing for the Sidetracked Well. .......................... 67

ix
List of Tables
Table 1. Geological Prognosis for Formations and Zones. ........................................................... 19
Table 2. 12 ¼” Section Overview. ................................................................................................ 20
Table 3.Min kick tolerance or max gas kick volume. ................................................................... 21
Table 4. Design Factors. ............................................................................................................... 22
Table 5. Sidetracking risks and their possible outcomes. ............................................................. 25
Table 6. Drilling Risks for 12 ¼” section. .................................................................................... 27
Table 7. Operational parameters for the original and sidetracked well designs. .......................... 36
Table 8. Analysis for Sidetracking Risks. ..................................................................................... 39
Table 9. Analysis of the Drilling Risks for the 12 ¼” section. ..................................................... 42

x

1
1 Introduction
Drilling operations are established principally by field experiences. That is why, the collected
experiences out of drilling operations are very valuable and can determine the required technical
models, such as BHA design, casing program, cement design, mud program etc. The field
experiences can also detect the potential risks and reveal their countermeasures. As the wells
become more complicated to drill, many technical issues emerge and become solved in the drilling
industry. The reports, which consist of drilling problems and their solutions, are the supportive
experiences for the execution of the same well activities in the future and can avoid potential
dangers in advance or solve the problems in a shorter period of time with a better quality.
1.1 Case Study
In this thesis, sidetracking activity is chosen to illustrate the applicability of the experience and
industry standards for drilling operations. The data was provided by my co-supervisor, Bjorn Astor
Brenchan, and it reflects one of the wells in the North Sea. In this well, the conductor, surface and
intermediate casings were set and cemented in place. While drilling for the next hole section, the
drilling was stopped at 2250 m MD due to a bad weather condition. Once drilling started after
several days of wait on weather (WOW), the formation collapsed and it was not possible to follow
the planned well trajectory because of wellbore instability issues. To avoid these problems, it was
decided to perform technical sidetrack in openhole at 2200 m MD.
1.2 Methodology
Sidetracking and drilling operations for this well are designed based on the regulations and
industry standards. The method to sidetrack a wellbore, the required BHA design and operational
parameters are detected mainly by the experiences extracted from NTNU-governing documents
and NORSOK Standards.
Moreover, all activities performed in both original and sidetracked wellbores have been simulated
in Landmark products to evaluate the safety and integrity of the well models. The wellpaths are
built in Compass, torque & drag as well as hydraulic programs are established in WellPlan and
casing designs are modeled in WellCat. It is worth mentioning that the simulations based on
predetermined operational parameters did not show any critical result for sidetracked well model.

2
Furthermore, the risks in sidetracking and drilling operations are uncovered as well as assessed
based on the field practices. The relevant countermeasures are also found in order to mitigate the
risk level as well as provide safe sidetracking and drilling operations.

3
2 Fundamental Theory
2.1 Experience and Work Process
Exploration and Production (E&P) projects, that are profitable to commence drilling operations,
are considered as a subsequent series of separate tasks rather than as a whole workflow in the past
years. It is now perceived that the field development has to be treated as a whole workflow to
decrease the time and expenditure spent on the entire process. As a result, the generation of a
smooth project workflow gets more crucial ever than before particularly due to today’s low price
of crude oil and hardly accessible reserves. Many of the new discoveries are either small or located
in the harsh environment. In addition, the recovery of remaining reserves under the maturing fields
also gets increasingly difficult, leading the companies to investigate the methods how to decrease
the time spent on operations (McCann et al., 1998).
E&P expenses can be reduced by involving the cost control and risk reduction for all phases of the
workflow. Especially, a drilling workflow has more potential to affect E&P costs. In the E&P
cycle, a drilling workflow begins with the planning of a well trajectory and ends at the well
construction (François Clouzeau, 1998). The research performed by a team in late 1997 revealed
eight principles that commonly contribute to a successful project and have been observed almost
in any thrived operation (Thorogood, 2000). These principles are:
Accomplish early planning and effective design
Execute risk assessment thoroughly and properly
Set clear milestones, delegate the workload with the special focus on accountabilities of
team members
Evaluate performance of the project consistently against stretch targets
Run the whole project seriously with total commitment to the goals
Be eager to learn as a company
Strive for a balanced position or interest between contracts and business goals
Implicate all team members into the project
Some of these principles will be reviewed further in this chapter.

4
2.1.1 Drilling Workflow
The investigation of the operational process designates “gaps” in the procedures and provides
consistently sound workflow in the drilling. A general structure for the workflow is shown in
Figure 1. There are 3 phases of drilling operation:
Planning and Design
Execution
Evaluation
The first phase of drilling workflow consists of two separate stages - “preliminary well planning”
and “detailed well design”. An operating company is responsible for implementing the entire
planning and design of a well. The accountabilities of an operator are explained with more details
in Appendix A.1. Execution phase is where both contractor and service companies are largely
involved in the process. A contractor is in charge of drilling a well and service companies are
responsible for providing mud, cement programs and other well constructions. The execution
phase gets started as soon as the operator obtains the permits to run a field. When the execution
phase is finalized, real-time data shall be gathered in the database in the appropriate format in order
to enable easy access for analysis of the drilling performance and risks. The collection of the
operational data will support the subsequent activities in the field.
Figure 1. Drilling workflow (François Clouzeau, 1998).

5
Drilling workflow is always followed by scheduling and reporting to keep the drilling time in the
predetermined frame and document every single activity. Proper reporting enables easy
information sharing among all members of a team, and scheduling empowers the generation of the
smooth workflow. Both reporting and scheduling are important and supportive for the drilling
activities. Major types of reports and schedules are introduced in Appendix A.2 .
2.1.2 Drilling Performance Curve
There is no real economic model that reflects the evaluation of the drilling performance. The
classic approach - depth versus days plot is the main technique to compare a success or failure of
the drilling performance (Brett and Millheim, 1986). The drilling is apparently more experienced-
based and performed for a series of wells in the field. This approach triggered the curiosity of the
researchers to apply “learning curve theory” techniques into the process as an evaluation tool.
The application of the learning curve theory to drilling operations or so-called Drilling
Performance Curve (DPC) model is a quantification of what has been observed qualitatively – The
first well to drill in the area is expensive and the last one is cheap (Emery, Sternberg, 1982). The
best mathematical algorithm that reflects the learning curve theory for drilling operations is (Brett
and Millheim, 1986, Shapero):
2(1 n) C1 3t C e C
(1)
Where,
t = the time required to drill nth well.
n = the well number in the area of uniform geology.
C1 = the difference in time spent on drilling the first and the last well in the field.
C2 = an adaptation rate of the drilling team to the new geological environment.
C3 = an optimum average time to drill a well in the area.
The higher C2 is, the faster the company adapts to the new drilling environment. The following
factors increase C2 value:
The tight communication between the well planners and field engineers
The proper documentation and successful analysis of the drilling problems
The competent application of the plans
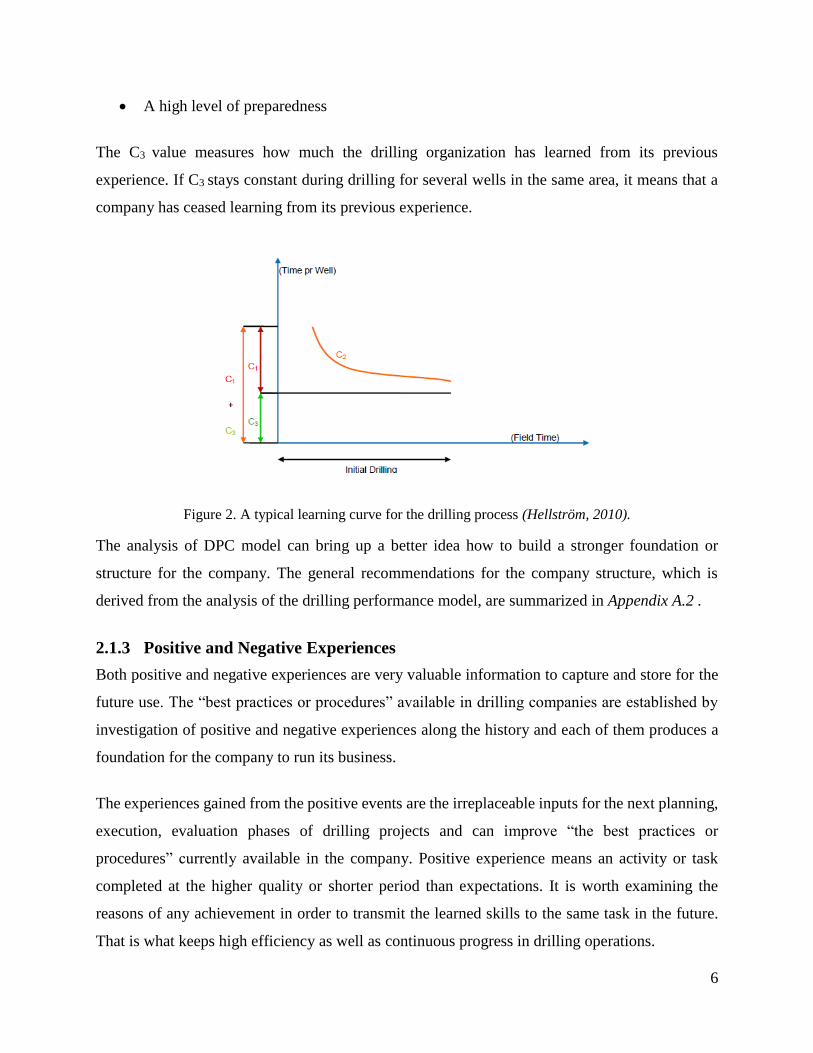
6
A high level of preparedness
The C3 value measures how much the drilling organization has learned from its previous
experience. If C3 stays constant during drilling for several wells in the same area, it means that a
company has ceased learning from its previous experience.
Figure 2. A typical learning curve for the drilling process (Hellström, 2010).
The analysis of DPC model can bring up a better idea how to build a stronger foundation or
structure for the company. The general recommendations for the company structure, which is
derived from the analysis of the drilling performance model, are summarized in Appendix A.2 .
2.1.3 Positive and Negative Experiences
Both positive and negative experiences are very valuable information to capture and store for the
future use. The “best practices or procedures” available in drilling companies are established by
investigation of positive and negative experiences along the history and each of them produces a
foundation for the company to run its business.
The experiences gained from the positive events are the irreplaceable inputs for the next planning,
execution, evaluation phases of drilling projects and can improve “the best practices or
procedures” currently available in the company. Positive experience means an activity or task
completed at the higher quality or shorter period than expectations. It is worth examining the
reasons of any achievement in order to transmit the learned skills to the same task in the future.
That is what keeps high efficiency as well as continuous progress in drilling operations.

7
The negative experience causes non-productive time (NPT) for the drilling operations leading to
the escalation of drilling costs. NPT can be defined as an unexpected event that ceases the drilling
process and extends the operational schedule (Reid et al., 2006). Nevertheless, the negative
experience also supports identifications of the risks in the operations and enables to apply “learned
lessons” to the upcoming activities.
In addition to the waste of time and costs, delays in drilling process can develop the risk for drilling
fluid to be over-exposed. The overexposure of drilling fluids can result in the damage of wellbore
and increase a skin factor of the borehole that, in turn, reduces reservoir throughput. The interaction
of drilling fluid with the rock formation can also cause the onset of irrecoverable instability and
the well can become collapsed (Wang et al., 2009).
There are many root-causes of NPT. It is hard to identify the most time-consuming reasons due to
a fact that the reasons can be changed by geographical regions of oil and gas resources (Amadi-
Echendu and Yakubu, 2015). However, generally, the followings are the main sources of NPT
(Moazzeni et al., 2011):
Lost circulation
Mechanical or differential pipe sticking
Killing the influx or kick
Formation breakdown because of high equivalent circulating density (ECD) or pressure
surges
Wellbore instability problems
Reduced ROP in hard formation
Unplanned tripping to change a drill bit
Fishing activities
Remedial cementing operations
According to Dodson, approximately, 40% of NPT is produced by both wellbore instability and
pore pressure issues such as kicks, gas flow, shallow water flow, lost circulation and stuck pipe
(Villatoro et al., 2009).

8
2.1.4 Risk Assessment
Risk assessment is a key activity for the entire project that is extended from a conceptual planning
phase to the day-to-day execution. It provides a better understanding of risks and their effects on
the business delivery. Risk assessment is an integral part of the whole workflow, as well as strongly
associated with the time-estimating process and contingency costs of the project (Thorogood and
Bardwell, 1998). In the risk assessment, the goals to accomplish are:
Detect the possible hazards
Evaluate the risks
Minimize the risk levels
Record the results
Even though there are numerous risk assessment systems used by different companies, the
fundamental of the system is common and its iterative process to achieve the goals are shown in
Figure 3 (Main, 2006).
Figure 3. The Risk Assessment Process (Main, 2004).

9
2.1.4.1 Types of Risk Assessment
There are also several types of risk assessment to identify different risks and hazards for the drilling
operations. Some of them will be introduced in this section.
A project risk assessment brings up the main business concerns, such as partner, political, financial
and schedule issues. This evaluation is supported by a well risk assessment in order to define the
technical issues by the analysis of offset wells or peer reviews. The risk assessment of a well
commences from the conceptual planning phase of the drilling workflow and extends up to the
execution phase. It identifies technical work programs and structures many planning activities. As
the plan gets more detailed and the number of involved people increases, an operational risk
assessment is required to develop. The operational risk assessment makes the engineers conscious
of the potential problems in the area and empowers them to bring up their own experience to
anticipate - what can go wrong? Thus, it equips the crew members to be prepared for the avoidance
of the risks as a team (Thorogood, 2000).
2.1.5 Importance of Offset Well Data
A large volume of operational data from the drilled wells has been historically stored. These data
usually consist of well trajectories, casing points, casing analysis, drilling risks, drilling events,
BHA performance, operational window, costs, time etc. There are also huge data generated by
engineering programs used in the planning phase of drilling. The engineering programs simulate
different drilling scenarios and produce outputs, such as ROP, WOB, TOB, RPM, hook load,
torque etc. If it is feasible to save useful data at high quality, those data can be enormously valuable
in the well planning and execution of the operations. The historical data can support or achieve the
following goals:
Prediction of potential issues, failure events, challenges and risks
Mitigations of operational problems
Engineering analysis, modeling and optimization
Multiple well correlations
Time analysis for lost and trouble zones
Real-time monitoring
Performance measurement and benchmarking

10
Evaluation of the service quality/costs
In the modern drilling system, static and historical well data are integrated with the real-time data
to advance the operations and provide valuable information on a real-time basis. This structure is
explained shortly in Appendix A.4 .
2.2 Sidetracking Methods
The sidetracking operation can be executed in both open and cased wellbores. It can be classified
as below:
1. Cased hole sidetracking with a whipstock (Ketil Tørge et al., 2014).
2. Openhole sidetracking with a whipstock (Appendix B.1 ).
3. Openhole sidetracking over the whipstock with a mud motor (Appendix B.2 ).
4. Openhole sidetracking over the cement plug with a mud motor.
5. Openhole sidetracking without deflection barrier (Dang et al., 2013).
The whipstocks for OH sidetrack (method 2) are almost never used today due to a fact that
changing trajectory is very complicated and too much experience is demanded to run the tools
accurately. Downhole motors are more advanced and relatively less costed tools (Appendix C).
Therefore, they have replaced permanent/removable whipstocks in OH sidetracking operation.
Currently, the most applied method to sidetrack a well in the openhole is to use a mud motor with
a deflection barrier. A deflection barrier can be either openhole whipstock (method 3) or cement
plug (method 4).
2.2.1 Sidetracking Procedure
The steering with a mud motor over the cement plug is one of the most employed techniques in
openhole sidetracking and its operational procedure will be described in this section.
Firstly, the cement slurry is pumped to fill across the kickoff interval and then engineers must wait
for the cement to be cured in the formation. Afterward, a conventional bit and straight-hole drilling
assembly are run into the hole to time-drill the cement plug up to the planned KOP. Drilling with
considerably low ROP, WOB, TOB as well as RPM are called “time-drilling” (Chamat and
Leavitt, 2011), and time-drilling the cement plug up to KOP is named “dressing off” the cement

11
plug (Broussard et al., 2009). Usually, the time-drilling is employed to have more chance of
success in sidetracking operation. If the DS takes the weight and the motor begins to stall during
dressing off the cement plug, it means that the plug is strong enough to commence kicking off
activity. ROP operated for dressing off the cement plug should be, at least, lower than 50% of ROP
applied for penetrating the formation.
Figure 4. A sequence of operation to kick off the cement plug (Broussard et al., 2009).
If the cement plug is confirmed to be firm, a directional BHA should replace the conventional
assembly and shall be run to the dressed top of the cement plug. The toolface of the downhole
motor should be then orientated in the formation. Time-drilling is also employed for kicking off
the wellbore. Afterward, drilling parameters can be increased for penetrating further to the planned
target (Ron Dirksen, 2015).
If the cement plug is not sufficiently firm to commence sidetracking, the cement will be washed
away during dressing off and extra trips will become mandatory to set a new cement plug. The
success of OH sidetrack from the cement plug with a mud motor are primarily dependent on the
followings (Dewey et al., 2012):

12
Formation Compressive Strength
Downhole temperature/ pressure
Cement plug depth
Wellbore deviation
Quality of Cement
Cure time of Cement
BHA design and deflection tool (Appendix C)
2.2.2 Design Considerations
There are three main parameters to consider for the planning phase of sidetracking activity in order
to accomplish the operation efficiently and successfully (Ron Dirksen).
1. Strength of a formation
The sidetracking point in the openhole should be selected in the softest formation to increase the
chance of success. Preferably, it should be softer than the cement plug or should place between
harder formations. Since the bit always has a tendency to penetrate into the least resistance zone,
trying to enter into a hard rock can be very problematic. The strength of the rock is measured by
the parameter, called unconfined compressive strength (UCS). This parameter represents the
maximum compressive load, which a rock can withstand before the failure. If the formation rock
is very hard (UCS>25 000 psi), a whipstock is more likely to be used due to low possibility of the
cement to be harder than the formation. For a medium formation, where UCS is between 15000
and 25000 psi, a motor with a good cement plug can be considered to execute sidetracking. For a
soft formation (UCS<15 000 psi), sidetracking can be successful by operating a mud motor toward
the high side of the hole with a good cement plug or to the low side of the hole without cement
plug (Dang et al., 2013).
2. Inclination angle of the wellbore
The inclination is necessary to consider during the planning of the sidetracking operation in order
to obtain the gravity assistance. If the sidetrack point is in the vertical section of a well, inclination
has nothing to support the activity and there is no preferable direction to orient the toolface to
obtain the assistance of the gravity. Therefore, cutting efficiency of the stabilizer and BHA against
13
borehole will be minimized leaving more challenging condition for the operation. But, if the point
is located in an inclined wellbore, the orientation of the toolface to the low side of the hole will
support technical sidetracking due to a gravity effect that will try to drag the BHA down (Figure
5). When a mud motor or RSS is applied, it is the best to sidetrack at the point where the wellpath
has a high inclination or azimuth change.
Figure 5. The gravity effects over a sidetracking operation. The gravity supports sidetracking if the
toolface is oriented to the low-side (Ketil Tørge et al., 2014).
3. Depth of a sidetrack point
The depth of a sidetrack point determines the DLS required for reaching a target that, in turn,
identifies the required BHA configuration and deflection tool (Appendix C). Sometimes, the
sidetrack depth can also establish whether the activity will be performed in the cased or open hole.
If the sidetracking can be executed in either location in the wellbore, it is often recommended to
perform the operation in the openhole in order to avoid milling activity and generation of sharp
dogleg angle.

14
2.2.3 Cement plug vs Openhole whipstock
The procedures hired to sidetrack from cement plug and openhole whipstock are introduced in the
sub-chapter above and Appendix B.2 respectively. Pros and cons of these two methods will be
reviewed in this section.
Sidetracking from the cement plug is difficult in the following well conditions:
Highly deviated wellbores
Small diameter openhole sections
High pressure and temperature intervals
A cement plug is operationally simple for execution, but the strength of the cement becomes
occasionally stronger than the surrounding rock in the sidetrack point. In addition to that, the
cement gets strung out if the DLS is high at KOP in the borehole. In some well applications, the
numerous cement plugs must be set to achieve a successful sidetracking operation that results in
the waste of time and money.
In the case of sidetracking from the openhole whipstock, all uncertainties and limitations related
to the cement plug are eliminated and the following benefits are gained (Danny Harrell, 2001):
Possibility to sidetrack at high temperature and pressure
Elimination of a separate trip for setting the cement plug
No need to wait for the cement to be cured
No loss of material to replace a failed cement plug
In any well configuration, sidetracking from whipstock takes much less time than the sidetracking
from the cement plug unless any of unexpected events has been encountered during execution of
the activity. There is no need to wait for cement to get hardened, and extra trips to set the cement
plug are also eliminated during sidetracking from whipstock. The cement treatment takes
approximately 24 hours and extra trips might take several hours based on the well depth. Thus,
sidetracking from whipstock with a mud motor saves minimally a day price of the rig, giving a
great economical profit. Traditionally, there was a risk of deployment of the whipstock in the
wrong direction and it was one of the reasons to avoid the method. Now, that problem is completely
15
removed by the flexibility of the system. The flexibility of the system enables the orientation of
the whipstock face before its mechanisms are actuated (Appendix B.2 ). However, the technique
still carries two risks (Al-Salmi et al., 2011):
1. The fall of a whipstock while running into the hole.
2. The spinning of a whipstock during drilling.
The first risk can be minimized by involving an experienced engineer to run a system and follow
the best practice in order to deploy a whipstock safely in the hole. The second risk is reduced by
the introduction of the hydraulically set expandable anchor and ability to cement the whipstock
itself in the formation (Appendix B.2 ). Nevertheless, if the formation is soft or medium in strength,
the operation can fail while drilling over the whipstock regardless of its gripping mechanisms due
to a fact that formation can break apart and whipstock can start to spin inside the broken rock.
Consequently, the openhole sidetracking from whipstock with a mud motor is not recommended
to be executed in the soft or medium strength formation.

16
17
3 Sidetracking Well Model - Industry Standards & Results
The problem in the given well was introduced shortly in the “Introduction” chapter above and will
be reviewed at the details in this chapter.
During drilling 12 ¼” hole section at 2250 mMD, a bad weather condition imperiled the operation
and it was decided to stop drilling for a while. Wait on Weather (WOW) took several days. When
drilling commenced, wellbore instability issues emerged, and the hole was collapsed. As a result,
technical sidetrack was planned for this section. The objectives of technical sidetrack are:
Deviate the wellbore trajectory away from the dangerous zone/wellbore instability
problems.
Hit all geological targets after sidetracking wellbore.
Generate as low DLS as possible along the borehole.
In addition to the mentioned objectives above, the purposes to drill a new 12 ¼” section are:
Fix the TD of 12 ¼” hole section at 4313 mMD/3968 mTVD.
Set 9 5/8” casing at 4313 mMD/3968 mTVD in the Intense sand formation (Table 1).
Achieve an acceptable cement job and acquire enough cement above 9 5/8” production
casing shoe.
Since the thesis relates to sidetracking and experience transfer, the general objectives for drilling
12 ¼” section are out of the scope and some parts of these objectives, revealed only by field
experiences, will be reviewed in this report.
The previous experience in the field, as well as industry standards and regulations, are documented
in every drilling company. These documents are extensively referred to run the business safely and
efficiently. The referred documents in this thesis, where necessary standards and experiences are
gathered for the operations, will be the followings:
NTNU-Casing Design (Brechan, 2014a)
NTNU-Drilling and Completion Operations (Brechan, 2014b)
NTNU-Drilling Experience (Brechan, 2014d)

18
NTNU-Well Construction (Brechan, 2014f)
NORSOK Standards D-010 (2013)
Drilling Programs extracted from the same field (Brechan, 2014c)
Recommendations to drill/ Statement of Requirements (Brechan, 2014e)
3.1 Wellbore Visualization
Wellbore instability issuers are developed at 2250 mMD/2216 mTVD in the 12 ¼” section of the
borehole. The previous casing is 13 3/8” intermediate casing, which is set at 2120 mMD/2093
mTVD. It is decided to kick off the original trajectory at 2200 mMD/2169 mTVD, nearly 80 m
below the previous casing shoe and 50 m above the collapsed area, in order to not to fall over the
problematic zone again.
Compass software of Landmark products is used to develop the required trajectory for the
new/sidetracked wellbore. A new wellbore trajectory is built as close to the original wellpath as
possible to avoid an extreme difference in the sidetracked well model (Figure 6).
Figure 6. 3D Views of the original and sidetracked wellbore trajectories. A red line represents the
sidetracked well trajectory, while a blue line is the original wellpath. T1-T5 are the geological targets.

19
The sidetracked wellpath is away from the original wellpath between 2200 mMD (KOP) and 3700
mMD, which is enough to be aside from the problematic zone. These trajectories overlap
considerably in between 3700 mMD and 5500 mMD. At the end of the wellbore, the sidetracked
wellpath deviate again from the original well trajectory while hitting the geological targets (Figure
15).
There are totally five geological targets and all of them are hit successfully in the sidetracked
wellbore. The max. DLS along the borehole is increased from 2.990/30m to 3.410/30m after the
wellbore is sidetracked. This change in DLS produces the slight difference and should not
introduce the complex challenges for the new/sidetracked well design.
Geological prognosis for formations is shown in Table 1. This table will be referred extensively
while explaining the experiences in the given field. The wellbore will be kicked off and sidetracked
approximately 40 m above Alone formation and the casing is planned to be set at 4313 mMD/3968
mTVD in Intense formation.
FORMATIONS and
ZONES
PROGNOSIS
Depth [mTVD RKB] Thickness [ mTVD]
Alone 2207 62
Gaia 2269 55
Free 2324 110
Stellar 2434 355
Brute 2689 449
Tuvan 3138 31
Sail 3169 371
Sail sandstone (sst) 3540 115
Base Sail sst 3655 68
Garn 3723 24
Unknown* 3747 39
Unknown* 3786 106
Intense 3892 97
Mirage 3989 29
Imagine 3.3 4018 70
Shivers 4088 120
ASOT (6) 4208 146
Aisha 4354 19
TD 4373 - Table 1. Geological Prognosis for Formations and Zones.

20
3.1.1 Section Overview
Technical sidetrack will be executed in 12 ¼” hole section which extends from 2120 mMD/2093
mTVD to 4313mMD/3968 mTVD (Table 2), and this section will be on focus in the upcoming
sub-chapters. Once drilling is finalized at the TD of 12 ¼” section, 9 5/8” production casing is
designed to be run into the hole.
mMD mTVD
Section Start 2120 2093
Section TD 4313 3968
Section Length 2193 1875
Casing Shoe 4313 3968 Table 2. 12 ¼” Section Overview.
There are both inclination and azimuth changes along 12 ¼” section. The highest inclination and
azimuth are 670 and 2990 respectively (Figure 16). The DLS along the section is not high and
fluctuates between 0.4-1.66 0/30m. The inclination is dropped from 190 to 100 along 2120-2810
mMD interval and built up to 670 at TD. Unlike the inclination changes, azimuth angle keeps only
increasing along the entire 12 ¼” section from 149.690 to 2990.
3.2 Casing Design
Every single load generated by drilling operations are modeled in WellCat for the casing designs
of the original and sidetracked wells. The only result of the “lost return with mud drop” load in the
sidetracked well will be examined since there is not any other critical result that can endanger
drilling operations for the sidetracking well model. In addition to the result of the “lost return with
mud drop” load case, the industry standards and regulations of the casing design will be introduced
and discussed in this section.
3.2.1 Casing Depth
A casing shall be set at the depth where a safety margin is enough between formation fracture
pressure and well control limit. The well control limit is determined by kick tolerance, which is
one of the most important parameters for building the casing design. The kick tolerance is the
highest gas volume that can be circulated safely out of the hole without fracturing the formation
in the openhole. Its volume should be enough to be recognized while drilling. The industry

21
standards for the kick tolerance are extracted from NTNU governing documents and shown in
Table 3.
Well Condition Kick Tolerance
Drilling the hole sections where the hydrocarbon reservoirs cannot be
exposed.
4 m³
Drilling the hole sections larger than 8 ½” where hydrocarbon reservoirs can
be exposed.
8 m³ for 12 ¼” hole
Drilling the hole sections smaller than 8 ½” where hydrocarbon reservoirs
can be exposed.
4 m³
Table 3.Min kick tolerance or max gas kick volume.
Intense formation is hydrocarbon bearing zone and present at the end of 12 ¼” section in our well
model (Table 1). Therefore, the kick tolerance for 12 ¼” section is determined 8 m³ while building
the casing design for the sidetracked well model.
3.2.2 TOC Depth
According to NTNU- Drilling Experience document, the TOC for 9 5/8” casing must be 400 mMD
above the casing shoe. It is also mentioned in NORSOK Standards that the planned cement length
shall be 200 mMD above the source of inflow. Tuvan is the hydrocarbon-bearing formation and
its uppermost part is at 3138 mTVD (Table 1). In the sidetracked borehole, the uppermost part of
Tuvan formation falls to 3206 mMD and 200 m MD above this depth is 3006 mMD where the
TOC must be reached.
Moreover, 9 5/8” casing is production casing where the packer will be deployed. It is
recommended to set a packer in the cemented area of the casing to enhance the operating envelope
of the packer. Referring to NTNU governing documents, the TOC of the casing must be minimum
10 m above the planned setting depth of the packer. The packer is intended to be set at 3100 mMD
in our well model. Consequently, when the TOC for 9 5/8” casing is reached at 3006 mMD in
order to cover Tuvan formation, the packer will be naturally set at the cemented area of the casing.
To conclude with, TOC for 9 5/8” production casing must be set minimally at 3006 mMD in our
well model.

22
3.2.3 Design Factors
A design factor is defined as the minimum allowable safety factor. By knowing this value, the
maximum allowable load can be determined and compared with the anticipated loads. Industry
standards for the design factors are extracted from NTNU-Casing Design document and illustrated
in Table 4. These values are applied to both original and sidetracked well models while building
the load cases for drilling operations.
DESIGN FACTORS Burst Tension Compression Collapse Triaxial
Casing 1.1 1.4 1.4 1.1 1.25
Casing Connection 1.1 1.4 1.3 N/A N/A
Table 4. Design Factors.
3.2.4 Lost Returns with mud drop
“Lost returns with mud drop” represents the load generated by evacuation of drilling fluids in the
casing. When the hydrostatic pressure of mud is much higher than the pore pressure, the mud
invades into the formation and its level falls down in the casing. This causes a sudden pressure
decrease at the internal pressure profile of a casing. Since the external pressure profile remains the
same, the case leads to collapse loading. This load case creates the most dangerous collapse
loading, which can lead the casing to the failure during drilling.
The international standard is to assume the loss-circulation zone to be at TD. That is how WellCat
also establishes the depth of loss zone. The “lost return with mud drop” load case threatens the
drilling operations in our well model. This load is severe during drilling 12 ¼” hole section and
collapses the connections of 13 3/8” intermediate casing as seen in a blue line in Figure 7.
The simulations indicate that the mud level drops 1300 m inside 13 3/8” intermediate casing while
drilling 12 ¼” section. The casing should not get hollow of mud more than 250 m based on NTNU
governing documents when the field is known. The field is drilled before and pressure prognosis
is known from the offset wells in this project (Figure 13). Hence, another load case scenario of the
“lost returns with mud drop” is created to meet the regulation. In the triaxial plot (Figure 7), a pink
line represents a newly created load scenario and it does not exceed the safety envelope. Therefore,
the case meets the design criteria and there is no risk of casing failure.

23
Figure 7. Design Limit Plot for 13 3/8” intermediate casing.
3.3 Operational Risks
There are some potential risks during sidetracking and drilling for 12 ¼” section that can damage
operations and injure personnel. Those risks are split as below and will be evaluated accordingly
in the“Risk Assessment” sub-chapter.
Risks linked to sidetracking activity
Risks linked to drilling for 12 ¼” hole section
3.3.1 Risks during Sidetracking Activity
There are five potential risks related to sidetracking activity in our well model. The consequences
of these risks are dangerous and can result in the catastrophic incidents. These five risks and their
possible outcomes will be introduced separately in the following sections.

24
3.3.1.1 Bad weather condition
A bad weather condition triggers unsafe environment for drilling operations that are hardly
possible to deal with. This harsh environment can lead the drilling operations to be ceased until
the weather condition becomes better and allows for safe drilling. In addition, delays in drilling
process produce the danger for drilling fluids to be over-exposed. The interaction of drilling fluid
with the rock formation can cause the onset of irrecoverable instability problems, which are
difficult to cure. That is why the preferred solution is usually to sidetrack the wellbore away from
the problematic zone. The same problem was encountered during drilling 12 ¼” section in the
given well, which directed the operations to sidetracking activity.
3.3.1.2 Poor cement plug
A cement plug is a necessary barrier for technical sidetrack to assist the wellbore deviation. The
poor cement plug means that sidetracking barrier is weak and kicking off the wellbore is more
likely to fail. The failure to sidetrack the wellbore over the cement plus demands for setting a new
cement plug and causes the loss of time, money as well as material.
3.3.1.3 Insufficient hole cleaning
If the hole cleaning is not sufficient, the cuttings will tend to accumulate on the low side of the
hole. When the cuttings bed height is considerably high, DS can get stuck leading to delayed
operations or fishing activities.
3.3.1.4 Casing wear and corrosion
Casing wear and corrosion are critical parameters and should be measured accurately to check the
safety and integrity of a casing. Loss of casing wall thickness due to the wear and excessive
corrosion are the reasons of the decreased well integrity and can result in the disastrous events,
such as oil spills and blow-outs.
3.3.1.5 Collision with other wells
The collision can be a large risk for sidetracking operations. The outcome of collision is
catastrophic and causes the destruction of nearby wells. In addition, it causes drilling a new section
in order to proceed the operations.

25
3.3.1.6 Summary of Sidetracking Risks
Five risks and their consequences are described above and summarized in Table 5 below. Each of
them endangers sidetracking operations and carries the potential peril to increase NPT. Therefore,
they will be evaluated in the“Risk Assessment for Sidetracking Activity” sub-chapter to decrease
the risk levels for sidetracking activity.
Sidetracking Risks
Risk Description Consequence Description
1 Bad weather condition Delayed operations and potential wellbore instability
issues after WOW
2 Poor cement plug Failure to sidetrack a well- loss of time/money and
material
3 Insufficient hole cleaning due to additional
inclination created by sidetracking
Stuck pipe
4 Casing wear and corrosion due to
additional DLS produced by sidetracking
Loss of well integrity- potential catastrophic
incidents, such as oil spills and blow outs
5 Collision with other wells Destroyed offset wells and demand to drill a new
section/wellbore
Table 5. Sidetracking risks and their possible outcomes.
3.3.2 Risks during Drilling 12 ¼” section
Five risks during drilling 12 ¼” section and their possible outcomes will be introduced in the
upcoming sections. Each of them is defined by field experience and carries potential danger for
the operations.
3.3.2.1 ECD during cementing
When the section is long and fracture pressure at the casing shoe is low, the cementing activity can
be a problem in such a narrow window due to high ECD generated by the displacement of the
cement slurry. The fractures around the casing shoe cause the loss of cement slurry to the
formation, disable drilling for the next hole section, and leave the undesired conditions for the
cementing of the casing.
In the sidetracked well model, fracture gradient at casing shoe is 1.97 S.G. and the shoe is set at
4313 mMD/3968 mTVD. The simulated values show that cementing activity produces 10600 psi
pressure at the casing shoe, while the fracture pressure at the same depth is 11150 psi. The
difference between these pressures is equal to 550 psi. The cement job, in this case, might be

26
achieved without any adjustment in the activity, but it would carry a potential risk to fracture the
formation. Consequently, the adjustments in the cementing activity are required to reduce the risk
level.
3.3.2.2 Differential sticking across permeable sand intervals
Differential sticking is one of the most observed sources of NPT in drilling operations and occurs
usually at permeable sand zones. Its outcomes are delayed operations and fishing activities, which
result in the loss of time/costs. It can be more problematic if the sticking takes place while running
the casing. The rig might be unable to overpull a heavy casing once it is lowered into the hole.
3.3.2.3 Swabbing
The swabbing is the temporary reduction in the bottom hole pressure, generated by pulling the DS
out of the hole. If the hydrostatic pressure reduction is large enough to establish the underbalanced
condition, the well will take a kick and subsequently blow out.
3.3.2.4 Wellbore instability
Wellbore instability is the undesirable condition of an openhole interval that does not preserve its
gauge size and structural integrity, leading to the collapsed borehole.
3.3.2.5 Worn drill bit
The bit sometimes gets worn during penetrating through the different formations, which causes
reduced ROP and increased NPT. If the bit is considerably worn, it can also be a reason for the
extra trips during drilling operations.
In our well model, 12 ¼” section is intended to be kicked off and subsequently drilled in one trip.
That is why the risk level of getting worn bit should be minimized as much as possible to eliminate
the possibility of the unplanned bit trips.
3.3.2.6 Summary of Drilling Risks for 12 ¼” section
Five risks and their possible consequences are described above and summarized in Table 6 below.
Each of them involves the potential danger to cease the drilling operations and increase NPT. Thus,
they will be examined in the “Risk Assessment for Drilling 12 ¼” section” sub-chapter to find the
effective countermeasures for the reduction of the risk level.

27
Drilling Risks of 12 ¼” section
Risk description Consequence description
1 Formation fracture due to high ECD induced by
cementing activity of 9 5/8” casing
Loss of cement slurry, poor cement job and
unable to drill for the next hole section
2 Differential sticking across permeable sand
intervals
Delayed operations and potential fishing
activities- loss of time/costs
3 Swabbing during POOH Potential well control problems- fluid influx,
kick and blow out
4 Wellbore instability Collapsed hole
5 Worn drill bit Extra bit trips
Table 6. Drilling Risks for 12 ¼” section.

28
29
4 Evaluation of the Results and Discussion
A method selected to sidetrack a well, BHA design required to achieve successful sidetracking and
drilling, as well as countermeasures applied to mitigate the operational risks, will be discussed in
this chapter. Many of the recommendations for the elements of the sidetracking well model are
made based on the field experiences and industry standards during evaluations.
4.1 Method Selection
There are several methods to sidetrack a well in openhole. The most applied method today is either
sidetracking from cement plug or OH whipstock with a downhole motor. Advantages and
disadvantages of these methods are already reviewed in the “Cement plug vs Openhole whipstock”
sub-chapter. In this sub-chapter, application of both methods to the given task will be discussed in
order to identify a better technique for the sidetracking well model.
Some parameters in the well configuration play an important role to reveal the chance of success
for the method applied to the sidetracking operation. These parameters are the followings:
Formation Strength
Downhole Temperature
Downhole Pressure
Formation strength, downhole temperature and pressure at the sidetracking interval are very
important parameters to identify a better method for the operation. If the formation strength (UCS
>25 000 psi) as well as downhole temperature and pressure are high (Tformation >140 0C; Ppore
>10 000 psi), sidetracking over OH whipstock must be considered to eliminate the uncertainties
associated with the cement plug. It is not necessary to have all mentioned parameters at the high
level to employ OH whipstock for the sidetracking activity. Even if one of them is high in the
setting area of the cement plug, the operation is more likely to fail for several times during kicking
off the wellbore. That is why OH whipstock is more reasonable to utilize in the sidetracking
activity under the well condition where any of the mentioned parameters is high.
If the cement plug is planned in our well model, the length of the plug would cover the distance
from 2150 mMD/2121 mTVD to 2250 mMD/2215 mTVD, where:

30
15 000 psi > UCS >25 000 psi
60 0C > Tformation >80 0C
3 500 psi > Ppore >4 500 psi
It must be emphasized that sidetracking over OH whipstock with a downhole motor involves a
significant risk when the formation is soft or medium in strength. Since the formation strength is
medium in our well model, the operation can fail while drilling over the whipstock regardless of
its gripping mechanisms due to a fact that formation can break apart and whipstock can start to
spin inside the broken rock. This risk carries an enormous danger for the entire drilling operation.
It can be a reason of being stuck with the whipstock and loss a well. Moreover, the downhole
temperature and pressure in our well model are not high and allows the application of the cement
plug. Thus, it is more rational to hire the cement plug under the existing well configuration.
However, the following factors should be also investigated before making a final decision whether
to apply the cement plug or not:
DLS along the cement plug
DLS required to deviate the wellbore
Inclination at KOP
High wellbore deviation along the cement plug creates the obstacles for the cement to be cured
properly. The cement can get strung out if the DLS is high. The cement plug is set in the original
wellbore and, therefore, DLS meant in this context belongs to the original wellpath. The max DLS
along the cement plug is 0.4 0/30m in our well model, which is low and will not induce any problem
for the setting of the cement.
In addition, the required DLS to build the curvature in the formation is also necessary. It determines
the BHA configuration and deflection tool. In some formations, it can be challenging to build the
required DLS to hit the expected area. In our well model, the required DLS for reaching a new
target is low (1.66 0/30m) and it should be possible to build the needed deviation with a downhole
mud motor.

31
When KOP is located in the vertical section of the borehole, where the inclination is zero, it can
also be a problem to deviate the wellbore. The assistance of the gravity cannot be obtained in the
vertical section, which causes the reduced cutting efficiency of the BHA and leaves the challenging
conditions for the wellbore deviation. Since the inclination at KOP is 190 in the given well, it is
possible to sidetrack to the low-side of the hole as seen in Figure 6. The deviation to the low-side
of the hole enhances the cutting efficiency of the BHA and increases the chance of the success for
the sidetracking activity.
None of the factors discussed above showed the critical problem for the application of the cement
plug. As a result, the final decision is to employ the cement plug as a deflection barrier for the
sidetracking activity.
4.2 BHA Design
A BHA design shall provide the required steering ability and effective survey measurements for
the operations. It is intended in this thesis to build the BHA design that manages to sidetrack and
drill the section in one trip. The components of this BHA are mainly selected by field experiences
and industry regulations.
4.2.1 RSS vs PDM
A PDM is cheaper, but less powerful than the RSS. The ability to slide with a PDM at large depth
is in question due to poor weight transfer to the bit. An RSS should be a preferred tool, at least,
when any of the followings exists in the well condition:
Abrasive wellbore tortuosity
High DLS along the borehole
High friction factor in cased or open hole
Sidetracking/drilling area at high depth
In our well design, friction factor (FF) in cased hole is 0.25 and in openhole is 0.3. The highest
DLS for the entire 12 ¼” section is 1.66 0/30m, and the sidetrack point is at 2200 mMD. None of
the factors indicates that the use of a PDM with the bent-sub can be a problem in the given well
conditions. However, the experience collected from the same field states the opposite. According

32
to NTNU-Drilling Experience document, it is difficult to slide or orient in Tuvan zone when the
mud motor with the bent-sub is used. Tuvan layer covers the interval from 3138 mTVD to 3169
mTVD in the formation (Table 1), which falls over the 12 ¼” section in our well model. That is
the main reason why RSS is recommended for this hole section.
The RSS can also dress off the cement plug till the KOP, deviate the trajectory and drill until the
TD of the section – in one trip, which saves time/costs for the entire drilling operation. The
following advantages and disadvantages have been noticed for the RSS based on NTNU-Drilling
Experience document:
Advantages:
The RSS drills a smoother well trajectory.
It has a great steering ability and can create the DLS between 3.5-5 deg/30m.
The RSS generates less wear on the bit and can save an extra bit trip.
It achieves relatively higher ROP.
Disadvantages:
High-pressure drop in mud system can make the RSS motor impossible to operate, leading
to an extra bit trip.
An extra bit trip can be required due to the tool failure – this risk is low based on the latest
experiences with the tool.
During planning the well path, consider that the assembly will have a slight rotary build
throughout the section (0.2 deg/ 30 m) apart from Free formation (Table 1), where the layer
has a drop tendency.
According to the field experiences, steering above Sail formation (Table 1) with the RSS is not a
problem, but it gets challenging in the Sail formation and further down. So, it is also recommended
to include a dog-sub to the BHA design, which will provide enough steering ability for the drilling
assembly.

33
Considering all facts mentioned above, the RSS and dog-sub are recommended to be used in the
BHA design. This BHA design shall manage to complete the execution of the sidetracking and
drilling for the 12 ¼” section in one trip.
4.2.2 Gyro vs MWD
An MWD tool is cheaper than the gyro but has magnetic interference with the metal objects. In
our case, a metal object will be the last casing shoe that can affect negatively to the functions of
the MWD tool. This casing shoe is set at 2120 mMD in the borehole.
In the given well, the top of cement plug reaches to 2150 mMD where the sidetracking operation
will start up. It means that the bottom of the BHA will also be at 2150 mMD - 30m in front of the
casing shoe prior to the operation begins. Under this condition, the position of the MWD tool in
the BHA design becomes fundamental whether the last casing shoe will have a negative effect on
the survey measurements or not.
The length of the MWD tool is 7 m and its bottom is positioned 12 m above the drill bit in the
BHA design. Therefore, the top of the MWD tool is nearly 10m in front of the casing shoe in the
openhole at the beginning of the sidetracking operation as seen in Figure 8. This distance should
be enough for a successful operation of the MWD tool.
Figure 8. The position of the MWD tool in the openhole at the beginning of the sidetracking operation.

34
However, the TD of the 12 ¼” hole section is close to the top of Intense zone which is the reservoir
formation and begins at 3892 mTVD/4143 mMD (Table 1). According to NTNU governing
documents, a gyro tool must be run, at least, 500 mMD before entering the reservoir. Therefore,
tripping activities have to be performed when drilling reaches at 3643 mMD in order to replace an
MWD tool with the gyro. Drilling activities for 12 ¼” section are planned to be completed in one
trip in our well model. Consequently, it is more reasonable to include a gyro tool into the BHA
design in order to eliminate the extra trips in the middle of the operations and finalize drilling for
the 12 ¼” section in one trip.
To conclude with, it is decided to apply the gyro tool for the complete 12 ¼” section. A gyro tool
in the BHA design under the existing well conditions will enable sidetracking and drilling
operations to be completed in one trip.
4.2.3 BHA Capacity
The selected BHA design has been used in several wells in the field and the collected experience
recommends keeping the operational parameters in the following frame:
Max drill string RPM while drilling: 220 rpm
Max drill string RPM while backreaming: 135 rpm
Max drill string RPM while off bottom: 135 rpm
Max Bit RPM at all times: 250 rpm
Flow Range: Min. 2750 lpm - Max. 3400 lpm
Recommended WOB range: Min. 3 ton – Max. 15 ton
In our well model, none of these limits is exceeded and it is safe to proceed to drill with the pre-
determined operational parameters. The drilling parameters determined for the sidetracked well
model will be introduced in the “Operational Parameters” sub-chapter.

35
4.3 Operational Procedure
According to the selected technique and BHA design, the operational procedure will be in the
following details:
1. Trip in hole with the open-ended drill pipe
Pump 100 m balanced cement plug
Trip out of the hole
Give time for the cement to set
2. Trip in hole with the RSS
Dress off the cement plug up to the KOP
Time-drill 50 m into the formation to build a curvature
Proceed to drill till the TD of the 12 ¼” section
The cement plug is set from 2150 mMD to 2250 mMD in the original borehole. Once the cement
is cured properly, the RSS shall be run to dress off the cement plug and build a curvature. The
time-drilling is employed for dressing off the cement plug and drilling the following 50 m into the
formation. Thus, drilling till the KOP (2200 mMD) and the next 50 m into the formation will be
executed by the lowest possible drilling parameters (WOB, TOB, RPM and ROP). Then, the
operational parameters will be increased to the “normal level” to complete drilling activities for
the 12 ¼” hole section.
4.4 Operational Parameters
Since there are no significant changes in the sidetracked well trajectory, there should not be
considerable variations in the results of the casing, torque & drag, hydraulic, and other well
programs. That is why the operational parameters for the sidetracked well model have been
extracted from the Drilling Program of the original well.
However, the operational parameters applied for time-drilling from 2150 mMD to 2250 mMD
should be much lower than the ones used for drilling from 2250 mMD to 4313 mMD, as described
in the sub-chapter above. Therefore, TOB and WOB are decreased for twice, ROP is reduced for
four times and RPM of DS is lowered from 140 to 60 during dressing off the cement plug and
kicking off the wellbore in order to escalate the chance of the success for the sidetracking

36
operation. Flow rate is kept the same for the entire 12 ¼” section. The values of the drilling
parameters for both original and sidetracked well models are listed in Table 7.
Operational Parameters Flow Rate
[lpm]
RPM
[r/min]
ROP
[m/h]
WOB
[kN]
TOB
[kN*m]
Original Well 3200 140 20 60 5
Sidetracked Well
from 2150 mMD to 2250
mMD (time-drilling) 3200 60 5 30 2.5
from 2250 mMD to 4313
mMD 3200 140 20 60 5
Table 7. Operational parameters for the original and sidetracked well designs.
According to the field experience extracted from one of the Drilling Programs, it is recommended
to slow down on RPM and WOB through Tuvan and Sail sandstones to improve the bit life.
Recommended RPM is 60-80 and WOB is 100-150 kN in these zones. In the sidetracked wellbore,
Tuvan formation extends from 3196 mMD to 3228 mMD and Sail sandstone covers the distance
from 3639 mMD to 3781 mMD. RPM and WOB through these formations in our well model are
planned to be 140 and 60 kN accordingly. Thus, these parameters must be adjusted based on the
indications of the field experience while penetrating through Tuvan and Sail formations in order
to extend the bit life and avoid the undesired bit trips.
4.5 Risk Assessment
The risks, related to sidetracking and drilling for the 12 ¼” section, are already described in the
“Operational Risks” sub-chapter. These risks have to be evaluated in order to mitigate the
potential problems and provide safe drilling operations.
4.5.1 Risk Assessment for Sidetracking Activity
Five risks during sidetracking activity are mentioned in the “Risks during Sidetracking Activity”
section and each of them will be assessed in this sub-chapter. The main point during the evaluation
is to involve the field experiences in order to identify the risk mitigating methods as well as clarify
the risk level after the countermeasures are applied to the operation.
4.5.1.1 Bad weather condition
A reason for sidetracking the given well was a bad weather condition that caused WOW and
resulted in the wellbore instability issues. To prevent this problem from happening again, the
weather forecast must be checked beforehand and drilling operations must be planned accordingly.

37
It would be the worst case if the harsh weather condition is encountered during casing running
activity. According to NTNU-Drilling Experience document, the single trip tool made up to the
hanger should be utilized as an emergency hang off tool while running the 13 3/8" and 9 5/8"
casings. 9 5/8” production casing will be run into the hole once the drilling for 12 ¼” section is
finalized. So, the technique written in NTNU governing document should be also applied to the
casing running activity in our well model.
To conclude with, the bad weather can still be a problem for the given well even though the
operations are planned accordingly. It is a fact that the weather forecast can be inaccurate/wrong.
4.5.1.2 Poor cement plug
There are some factors that influence the quality of the cement plug. The major ones are listed
below:
Formation Compressive Strength
Temperature/Pressure
Wellbore Tortuosity
All of these factors are already analyzed in the “Method Selection” sub-chapter and concluded
that there is not any critical issue in the application of the cement plug under the existing well
configurations.
However, a few more factors may also play a necessary role in the quality of the cement plug. One
of them is setting time of the cement. Earlier begun drilling can cause the bit to rotate on the green
cement and fall over the original wellbore instead of being deflected. A typical cure time of the
cement is 24 h. Even though the cement is cured thoroughly, drilling over the cement plug must
be performed carefully and slowly in order to keep it safe. Hence, time-drilling is employed in the
sidetracked well model for dressing off the cement plug. In addition, the cured cement strength
has to be stronger or equal to the formation strength.
The risk level for getting poor cement plug is low and sidetracking should be accomplished without
any serious problem if all mentioned factors have been taken seriously into account.

38
4.5.1.3 Insufficient hole cleaning
The results simulated in WellPlan showed zero value of the cuttings bed height, which can be seen
in Figure 23. Thus, the determined drilling parameters are sufficient to achieve the proper hole
cleaning. That is why the probability of this risk for happening is low.
Nevertheless, there is a rule cited in NTNU governing documents that should be obeyed to avoid
poor hole cleaning. This rule expresses that if the pumps are turned off (i.e. at connections), the
build-up of the cuttings on the low side of the hole is feasible in the wellbores where the inclination
is higher than 350. In our well model, the inclination reaches 670 towards the end of the 12 ¼”
section. Therefore, it is recommended keep high RPM (150+) on the drill string to support the hole
cleaning if the indications of the poor hole cleaning (e.g. increased torque) are present.
4.5.1.4 Casing wear and corrosion
According to NTNU governing documents, if re-entry operation or sidetracking activity has been
performed the current well condition must be simulated for the casing wear prediction via
CWearTM (also called DrillNet) software. Only simulations to measure the wall thickness loss is
not enough. It is also required to quantify the casing wear through either acoustic
measurements/'USIT' or multi finger caliper.
In the given well, the casing wear was simulated for the original wellbore and confirmed to be safe
for the well integrity. Sidetracking caused the slight increase in DLS - from 2.99 0/30m to
3.410/30m. Since the casing wear is directly proportional to the DLS existing in the wellbore, the
results should not introduce the excessive wear that can threaten the well integrity. Thus, the
possibility of this risk to befall is low.
4.5.1.5 Collision with other wells
An anti-collision program is run in Compass software for the sidetracked well model and the best
plan with enough safety margins is selected (Appendix D.2 ). In addition, a gyro tool is run for the
drilling of the entire 12 ¼” section that will provide more accurate survey measurements. Thus,
the feasibility to collide with other wells is low.

39
4.5.1.6 Risk Assessment Summary for Sidetracking
Five risks for the sidetracking activity are assessed above and summarized in Table 8 below. The
possibilities of these risks to take place during sidetracking activity will be minimized considerably
if the recommended countermeasures are applied. However, there is still a risk that endangers the
operation. It is the bad weather condition where the risk level is moderate even the
countermeasures are applied.
Analysis of Sidetracking Risks
Risk Description Risk Level
Previously
Applied Countermeasures Risk Level
Currently
1 Bad weather condition High Plan ahead; check the weather
forecast; make up the single trip tool to
the hanger for casing running activity
Moderate
2 Poor cement plug Moderate Employ time-drilling; achieve good
quality of the cement; provide enough
time for the cement to set
Low
3 Insufficient hole cleaning
due to additional
inclination created by
sidetracking
Moderate Build efficient hydraulics program;
ensure good hole cleaning
Low
4 Casing wear and
corrosion due to
additional dog-leg angle
generated by sidetracking
Moderate Maintain the DLS within acceptable
level; simulate a new well condition
for the casing wear; perform acoustic
measurements /'USIT' or multi
finger caliper
Low
5 Collision with other wells Moderate Build an efficient anti-collision
program; run a gyro tool
Low
Table 8. Analysis for Sidetracking Risks.
4.5.2 Risk Assessment for Drilling 12 ¼” section
Five risks during drilling 12 ¼” section are explained in the “Risks during Drilling 12 ¼” section”
sub-chapter. Each of them will be assessed in this section to mitigate the risk level and achieve as
low NPT as possible.
4.5.2.1 ECD during cementing
According to NTNU-Drilling Experience document, the value of ECD can be minimized by
thinning the mud to low end of the drilling specifications before pulling the DS out of the hole for
casing running. This process should commence during drilling the last 100 m of the section. If the
mud thinning is not accomplished successfully while drilling, it can be also done after the casing
40
is landed and prior to cementing. In that case, consider spending some time to thin the mud to the
acceptable level. Another recommendation gained from the field experience is to use the foam
cement to balance a narrow window. It secures successful cementing activity and avoids formation
fracturing as well as prevents the loss of the cement to the formation.
Once the mentioned countermeasures are applied to the cementing activity of 9 5/8” production
casing, the risk of the formation fracturing at the casing shoe is not a problem and its possibility
of occurrence is low.
4.5.2.2 Differential sticking across permeable sand intervals
It is written in one of the Drilling Programs that differential sticking was noticed in Sail and Garn
formations while running 9 5/8” casing into the hole where 1.70 S.G. OBM was present. Since the
same scenario exists in our well model, the detected experience should be transferred.
Sail and Garn zones are formed back-to-back and they extend from 3540 mTVD to 3723 mTVD
(Table 1). The DS must be rotated at high RPM to achieve sufficient hole cleaning before pulling
the string out of the hole in order to avoid the possibility of the sticking while running the casing.
The differential sticking can be also minimized by rotating the casing itself as continuously as
possible while running it into the hole. In our well model, the casing rotation is required, at least,
when the casing is reached to Sail formation - 3540mTVD/3639 mMD in order to evade the
sticking issues.
If the mentioned countermeasures are fulfilled, the differential sticking during running of the 9
5/8” casing is not a problem and its feasibility to happen is low.
4.5.2.3 Swabbing
According to one of the Drilling Programs, there is the risk of swabbing in Tuvan formation while
pulling the DS out of the hole. Tuvan is the hydrocarbon-bearing formation and extends from 3138
mTVD/3196 mMD to 3169 mTVD/3228 mMD (Table 1). Therefore, the geoservices shall supply
the swab simulations for the POOH activity. Since the swabbing risk is known in advance, the
problem can be eliminated by adjusting the pulling velocity of the DS. That is why the risk level
of having problematic swabbing effects is low.

41
4.5.2.4 Wellbore instability
The experience gained from the same field indicates that the instability problems exist in Gaia
zone, and inclination above 40 degrees should be avoided through this layer. Gaia zone occupies
the interval from 2269 mTVD to 2324 mTVD in the formation (Table 1). This interval in the
sidetracked wellbore covers the distance between 2305 mMD and 2362 mMD where the highest
inclination is 160, meaning that the wellbore instability problems should not be present in Gaia
layer.
4.5.2.5 Worn drill bit
As mentioned before in the “Operational Parameters” sub-chapter, it is recommended to decrease
the rotation of the DS to 60-80 RPM and apply 100-150 kN WOB while drilling through Tuvan
and Sail formations in order to extend the bit life (Table 1). Therefore, the drilling parameters must
be adjusted accordingly in the planning phase of the drilling in order to eliminate the possibility
of the extra bit trips.
The risk level to trip for the worn bit is low in our well model if the adjustments in the drilling
parameters are fulfilled.
4.5.2.6 Risk Assessment Summary for Drilling 12 ¼” section
Five risks during drilling 12 ¼” section have been evaluated above and summarized in Table 9
below. All of these risks and their countermeasures have been identified by field experiences
written in NTNU governing documents and Drilling Programs. The possibilities of these risks to
happen in our well model are reduced by applying the relevant countermeasures. These risks do
not imperil the operations if the countermeasures are implemented fully.

42
Analysis of Drilling Risks for 12 ¼” section
Risk Description Risk Level
Previously
Applied Countermeasures Risk Level
Currently
1 Formation fractures due to
high ECD induced by
cementing activity of 9
5/8” casing
Moderate Perform mud thinning prior to
POOH for casing running; use the
foam cement
Low
2 Differential sticking across
permeable sand intervals
Moderate Circulate the hole for the cleaning
prior to POOH for casing running;
Rotate the casing while RIH
Low
3 Swabbing during POOH Moderate Pulling velocity of the DS should be
controlled if swabbing simulations
indicate the danger
Low
4 Wellbore instability Moderate Obtain inclination less than 400
through Gaia formation
Low
5 Worn drill bit Moderate Reduce WOB and ROP to the
recommended level while
penetrating Tuvan and Sail
formations
Low
Table 9. Analysis of the Drilling Risks for the 12 ¼” section.

43
5 Conclusion
Based on the simulations as well as involved field experiences, the following conclusions and
recommendations are made for sidetracking and drilling activities in our well model:
The experience indicates that it is risky to set a whipstock in the formation interval where
UCS< 25 000 psi. Thus, the cement plug as a deflection barrier must be employed for
sidetracking activity.
RSS is recommended due to a fact that the field experience shows Tuvan formation is
difficult to be penetrated by PDM.
“Lost returns with mud drop” load case shows 1300 m mud loss inside the casing, which
collapses the connections of the casing in our well model. The experience indicates that the
mud loss in the casing cannot occur more than 250 m when the field in known.
Consequently, there is no need to spend extra money to make the casing stronger since 250
m mud loss does not damage the selected casing.
Tuvan and Sail formations must be penetrated by recommended drilling parameters (60-
80 RPM and 100-150 kN WOB) in order to avoid the extra bit trips.
Sail and Garn formations generate the differential sticking issues during casing running
process. Consider to rotate the casing while running into the hole.
Industry standards indicate that the safe depth of the TOC is 200 mMD above the source
of the inflow and the field experience shows that Tuvan is hydrocarbon-bearing formation.
Hence, the TOC must be minimally reached to 3006 mMD for 9 5/8” casing.
Tuvan formation produces the swabbing effects. Consider to decrease the pulling velocity
of the DS.
The industry is good at transferring the experiences to the upcoming well operations in the same
field. However, it is a challenge to transmit the “learned lessons” from the one field to another one.
This challenge can be eliminated by involving drilling companies to corporate and establish a
simulator linked to the common database where important experiences are gathered.
The author recommends that the simulator for the experience transfer should be built, and the
system should integrate with Landmark products or any other software package that is in use in
the company in order to make it more user-friendly. When the well configurations are set, the

44
experience transfer system should show the industry standards and experiences employed for the
well design. For instance, when an engineer is intended to design the sidetracking activity the
experience transfer system should reveal the closest well condition where the sidetracking was
executed before. Then, an engineer can extract the appropriate experiences and industry standards,
which are necessary for the analysis of his/her well model.
If the experience transfer is achieved globally, the best practices and procedures can be even further
enhanced. The difficulty is confidentiality of the data in each company and a lack of the desire to
build the simulator/system that collects all valuable experiences in one database for the future use.

45
6 Further Work
The followings shall be implemented as the further work of this research study:
A harsh weather condition is still the potential danger. The additional investigations can be
performed in order to find the way to continue drilling under the bad weather condition.
A gyro tool is decided to be run for the entire 12 ¼” section. However, it is more accurate
to make an economical analysis. An MWD tool can be used from the beginning of the
operation till 3643 mMD, then tripping is required to replace the MWD tool with the gyro
and the gyro must be operated from 3643 mMD up to the end of the 12 ¼” section. The
costs of these actions shall be compared with the costs of the action where the only gyro
tool is run for the entire 12 ¼” section. Afterward, the costs analysis will identify precisely,
whether the gyro tool for the use of the entire section is beneficial or not.
Due to time restrictions, the simulations for the casing wear in DrillNet is neglected. This
simulation is required for the operations even though sidetracking activity did not create
the high DLS.
Time evaluation and operational barriers are necessary to analyze in any drilling activity.
Both of them are ignored due to time restrictions.
The field related documents can be investigated more to find relevant experiences in order
to apply those experiences to the model. However, more information about the field is
required, which is difficult to discover because of the data confidentiality.
The main principles and data search mechanisms can be investigated and established for
the experience transfer system.

46
47
Appendices
Appendix A, Drilling Work Process
A.1 Work Process in Operating Company
Once geologists and geophysicists determined a drilling target, they can update interpretations and
visualize the intended wellpath in the software (Figure 1). Drilling engineers can use geological
data while building a well trajectory, which enables to design an optimal wellpath. Iterations to
determine a target and surface location of the well between geologists, geophysicists and engineers
are minimized due to data sharing among all involved members of a team, which makes a process
smoother and faster than before. After selection of the tentative surface location and target, the
well prognosis for lithology column, pore and fracture pressure gradients should be defined where
iterations can be necessary again to adjust the previously determined surface location and
trajectory in order to eradicate drilling hazards such as shallow gas and over-pressured zones
(François Clouzeau, 1998). An engineer is then able to model a casing design according to
geological interpretations and offset data. Service companies get involved into workflow at this
point to support the process by supplying mud, cement programs and other well constructions for
the operating company. At the end of the planning phase, operating company applies for permits
and prepares logistic arrangements to start execution phase of the project.
A.2 Recommendations for Company Structure
The general recommendations for the drilling company, identified by drilling performance model,
are summarized below (Brett and Millheim, 1986):
Drilling programs should be planned for the long-term goals, not well by well, to create a
positive impact on economics.
A sufficient number of experts should be present in the company who have drilled many
exploitation and exploration wells.
The first wells in the field should be drilled by the best personnel, applying the highest
technology and communication method.
It is important to gather as much drilling data as possible from the first drilled wells.

48
The high-quality drilling dates should be achieved as many as possible during drilling for
the first wells. Because it takes more time to drill the first wells rather than the later-coming
wells in the field.
When the experienced team reaches a point where drilling curve flattened out, substitute
the team with less experienced personnel and transfer them to the newly developing areas
to focus again on the drilling of the first wells. Since the geology of the drilled field is fully
recovered and experience is captured, as well as saved in the database, the less experienced
team will not need the support to execute the operations.
The advanced analytical tools are essential to investigate the process of planning, execution
and evaluation prior to starting to drill a series of wells in the field.
A high level of communication is necessary during drilling for the first wells, and when
the team is exchanged in the platform.
An organizational structure, which allows optimation of the strategies and the rapid
implementation of a new technology, should be obtained in the company.
A significant amount of money can be wasted if the mentioned points are not applied and
recognized in the company policy.
The application of analytical tools/ software simulators for the examination of DPC model enables
to test a variety of operational strategies and analyze the impacts of these strategies on C1, C2, C3
(Brett and Summers, Millheim, 1983). Software simulators can also identify as the ideal C3 value
as possible and support the rate of learning. It is necessary to use an analytical tool for the analysis
of the strategies, particularly in the development of the small fields prior to the actual application
of the new strategy.
A.3 Scheduling & Reporting
Scheduling and reporting are imperative to keep the drilling time in the predetermined frame and
document drilling activities to use for different purposes in the future. Several schedules and
reports are required to have in any drilling organizations.

49
A.3.1 Detailed time curve and Drilling schedule
A “drilling schedule” lists all the predicted operations during drilling, and a “detailed time curve”
shows anticipated time for executions of those operations. The drilling schedule makes a drilling
crew aware of the upcoming activities and enables a smooth transition between tasks (Pittman,
1985). Drilling crew must be prepared in advance for the next step and its implication.
Maintenance personnel must know what machinery and equipment will be needed for repair in
order to schedule preventive tasks accordingly. Service companies have to test and make their
equipment ready before an activity begins in the rig-site. All of these basic steps demand the
discipline of a formal program to ensure a smooth process (McGhee, 1985).
A.3.2 Historical Rig Time Curve
“Historical rig time curves” are largely used by operating companies to calculate expenditures and
measure drilling efficiency. They consist of performance times for the drilling operations (Remson,
1985). The average time that it takes a rig to perform an activity is termed “performance time”.
Usually, every rig owns a list of activities and their performance times, which are annually updated.
Thereby, it founds the basis to determine drilling efficiency (Remson, 1989).
A.3.3. 48-hour schedule
In addition to the detailed work schedule, the rig supervisors formulate a schedule for the next 48
hours. Many organizations are involved in drilling operations at the cross-purposes. This schedule
creates a focal point for the coordination of those organizations and ensures the information flow
among involved companies.
Another advantage of 48-hour schedule is that the safety of the personnel can be managed in
advance. It provides extra time to think of possible hardships and be prepared. It is also useful for
the people who appear rarely at the rig-site and follow the progress from a management or logistic
point of view.
A.3.4 Morning Reports
A computerized “morning report” is a tool that delivers data collection of the rig performance and
well progress. If the collection of the morning reports is correctly used as an estimation tool in the
well-planning review and communication process, it can enhance the workflow considerably as
50
well as assist management and customer service organizations. The morning report is the input
value into the database of the drilling organization and provides simplified access for evaluation
of technical and structural systems of the company. The morning report in the database can be
edited, printed, sent, retrieved and used for any required analysis if the software package is user-
friendly. The information collection, established by morning reports, can also be utilized to
generate a number of regular reports (Remson, 1989). Some of them are:
End-of-the well report
Annular rig performance analysis report
Annular performance time charts for each rig
Monthly safety and regulatory body compliance report
Rig location history report
Rig downtime summary report
Apart from the standard reports, databases are often accessed to produce many non-standard
reports to strengthen the quality of maintenance, sales, drilling workflow and activities.
A.3.5 End of Well Report
The “End of Well Report” is retrieved from morning report database to compare actually achieved
performance with the previously planned one. The report introduces downtime, safety statistics,
unexpected events and challenges. If the results in “End of Well Report” do not meet the
expectations of either operator or contractor, the reasons caused unsatisfactory outcomes must be
discussed in order to reveal “gaps” existed in the operations and subsequently transfer “learned
lessons” to the upcoming well operations (Remson, 1989).
A.4 Drilling Integrated Workflow Environment
Many engineering programs have limited integration capabilities due to a fact that they are
provided by different vendors. The efficiency of engineering programs (e.g. well-planning, geo-
steering and real-time operation center) is increased when offset well data are integrated with real-
time data. This is what makes Drilling Integrated Workflow Environment (DIWE) essential to
apply to drilling operations. It achieves the seamless integration with a multi-vendor environment

51
(Figure 9) and enables drilling workflow updated on a real time basis which is a paradigm shift
from the tradition (Mohan et al., 2014).
DIWE integrates historical, static and real-time data as well as stores all available offset well
information, engineering designs, lessons learnt, best practices and root causes of failures in a
manageable format. It advances planning, execution and evaluation phases of the drilling operation
which, in turn, increases performance and safety in drilling activities (Deeks et al., 2012). DIWE
also contributes to building the engineering and earth models. Generally, it brings the following
benefits in business ability:
Increased Drilling Performance
Enhanced Drilling HSE
Improved Planning and Field Development
Less Drilling Time
Decreased NPT and Invisible Loss Time (ILT)
Reduced Operational Costs
Figure 9. Integrated workflows enabled through DIWE (Mohan et al., 2014).
Appendix B, Technical Sidetrack
The sidetracking is the deviation of the wellbore from the present, original trajectory (Figure 10).
There are many applications that sidetracking is required or profitable. In fact, it is often difficult
to control the bit direction to penetrate into the desired zone. The corrections or adjustment along
the wellpath might be necessary to maintain the course of the wellbore.

52
During drilling, DS can fail and a part of it can fall into the hole. The metal fatigue/break of DS is
one of the reasons to sidetrack a well and pass alongside a fish. Technical sidetracking might be
also performed to re-drill or re-complete for new ledges or laterals of a multilateral well. If a kick
off point is in the cased borehole, the sidetracking provides a solution for this challenge too by
involving the techniques that enable milling a window in the casing. (Bourgoyne et al., 1986).
Figure 10. Technical Sidetrack (Baker_Hughes, 1995).
B.1 Sidetracking Procedure with a whipstock
The first of all, a whipstock assembly is run into the openhole and oriented in place to drill a “rat
hole” below the toe of a whipstock. Then, the weight is applied to set the tool and shear the pin to
start up the operation. Once the pin is sheared, drilling carries on until the top of the whipstock
assembly reaches the “stop”, meaning that it is time to pull the whipstock out of the hole (a-d,
Figure 11). To enlarge the rat hole further to full gauge, a hole opener is run to ream the hole and
tripped out afterward. Finally, a rapid angle build assembly is lowered to smoothen and maintain
the trajectory (e and f, Figure 11). This whole procedure might be repeated for several times in the
kickoff.

53
Figure 11. Whipstock and operational sequences for drilling (Bourgoyne et al., 1986).
Obviously, the main disadvantage of a whipstock tool is the number of trips required to complete
the operation that is time-consuming, causing drilling costs to increase. Another disadvantage is
that the traditional whipstock generates a sudden and sharp angle change and results in difficulties
for subsequent activities. The advantage is that it is a fairly simple piece of equipment that requires
relatively less maintenance and has no temperature or pressure restrictions (Inglis, 1988).
B.2 Advanced Whipstock System
An advanced whipstock system is illustrated in the next page. The system consists of a typical
assembly with the individual components to sidetrack over the whipstock by operating the mud
motor. The mechanism of the system enables cementing below the string in the case of need and
provides three gripping points against borehole to secure operation. In addition, there is no need
to wait for the cement to get hardened, which saves time/costs. It includes the following
components and abilities (Dewey et al., 2012):

54
A whipstock builds the path over its ramp for a directional
BHA and provides a smooth deviation.
An expandable anchor, which is hydraulically set,
provides three-point firm grip with the hole wall to restrict
the turning motion of the system during drilling.
It is possible to orient the whipstock ramp to the desired
azimuth.
A cementing stinger provides the path for pumping the
cement below the system to isolate zones.
A long tail pipe is to reach the cement to the bottom of the
hole.
A capability to complete running, orienting, anchor
setting, cementing and stringer retrieving operations - all
in one trip.
Once the KOP is determined, operators decide whether to isolate
the main bore (so-called mother bore) below the lateral. Usually,
the main bore is required to be plugged for safety reasons. Then,
the cement will be pumped from the cementing stringer to the
bottom of the hole. Once the cementing activity is completed, a
cementing stringer can be then pulled out of the hole, leaving the
whipstock and anchor in place for the subsequent procedure, which is to receive the directional
BHA and sidetrack a well. To increase stability, the cement can be pumped to the top of the
whipstock.
The system has been applied to more than 65 fields and run for 135 times successfully. The deepest
hole, where the technique applied successfully, has been 4 400 m. The system demands a gyro tool
to orient the direction (Dewey et al., 2012).

55
Appendix C, Deflection Tools and Techniques
There are several deflection tools that can succeed to deviate the wellbore. To find an optimal one
for a given application, pros and cons of these tools should be analyzed. The tools applied to
deviate the wellbore are:
Whipstocks
Turbines or Turbodrills
Mud motors with a bent-sub (or PDM)
Non-rotating Steerable Drilling Systems
Rotary Steerable Drilling Systems
Turbines, PDMs and non-rotating steerable drilling systems are established by two simple
principles. The first principle is a bit tilt angle introduced to the BHA axis just above the bit and
the second one is a generation of a sideforce on the bit (Figure 12). The introduction of a tilt angle
and sideforce lead the bit to drill at an angle with respect to the present trajectory and cause
wellpath deviation.
Figure 12. A bit tilt angle and sideforce (Heriot-Watt_University, 2010).

56
The most applied downhole motors, today, are PDMs and RSSs. Since the deviation tools are not
in the scope of this thesis, only, PDM and RSS are compared in Appendix C.1 in order to
comprehend their effects over sidetracking operations.
C.1 PDM vs RSS
A PDM provides drilling in the sliding mode, which causes several inefficiencies. The sliding
mode enables only the rotation of mud motor while steering the borehole. The motor has to be
oriented to the desired direction to deviate the wellbore and the orientation of the motor can be
challenging in the hole. Since the DS absorbs the torque over such a long distance, it can be
required to turn the DS for 10-15 times at surface just to achieve one revolution of the toolface in
the hole. Once the tool is positioned in the hole, it is also a problem to keep the BHA on the course
due to the reverse torque generated by the motor as the bit drills. Surface torque is applied to hold
the motor in proper orientation against revise torque. Since the DS rotation is absent, the removal
of cuttings in the borehole also becomes difficult. In addition, high drag forces can restrict the
running of DS into the hole and weight transfer to the bit can also become problematic due to the
lack of DS rotation.
An RSS produces rotary drilling which makes DS rotation possible while steering the wellbore
(Warren, 2006). The benefits achieved by the RSS are:
Effective weight transfer
Improved hole clearing
Reduced pipe sticking
Smoother well trajectory
No dependence on friction factor
With the RSS, the toolface is stationary in the hole and the bit shaft can stay constant to the desired
direction.

57
Appendix D, Outputs of Engineering Programs
D.1 Pressure Prognosis
Figure 13. Pressure Prognosis.

58
D.2 Well Profile
Figure 14. 3D Views of All Present Wells in the Template. A red line is sidetracked wellbore, while the
blue one is the original wellbore.

59
Figure 15. Vertical Planes of Original and Sidetracked Wellbores. A red line is sidetracked well, while the
blue one is the original well.

60
Figure 16. Inclination and Azimuth changes along Original and Sidetracked Wellbores.
D.3 Torque and Drag Analysis
Figure 17. Effective Tension vs Depth for the Sidetracked Well.

61
Figure 18. Hook Load vs Depth for the Sidetracked Well.
Figure 19. Torque vs Depth for the Sidetracked Well.
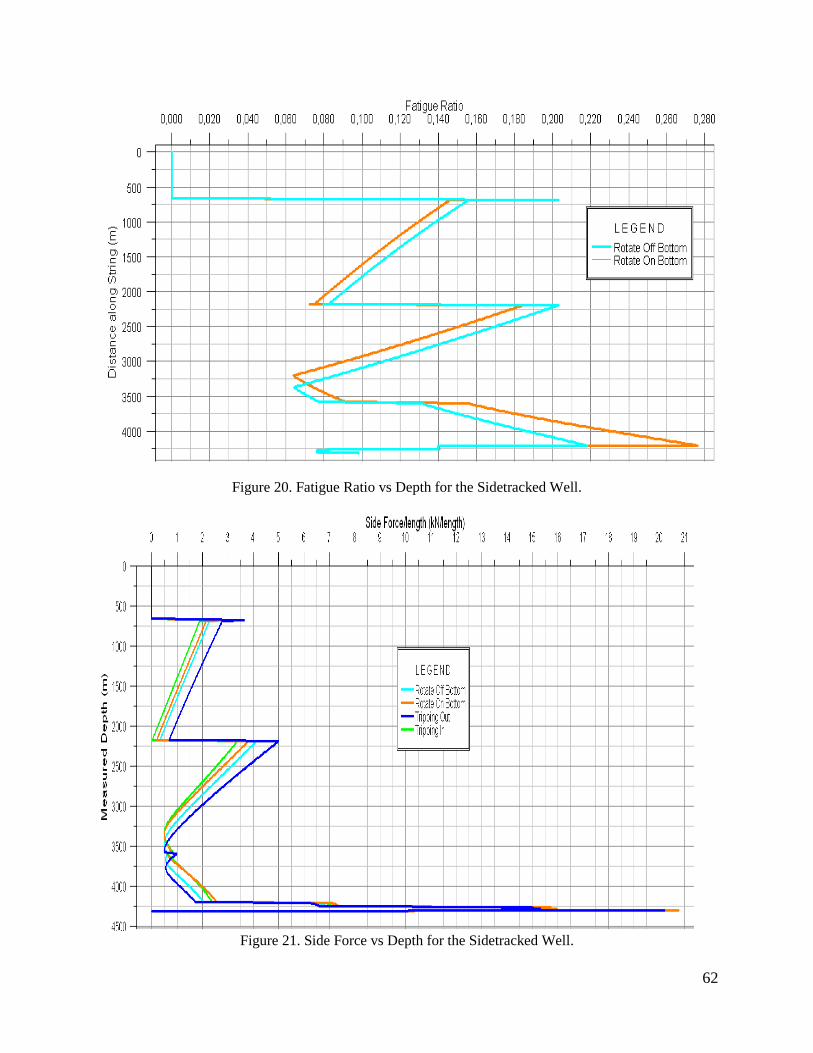
62
Figure 20. Fatigue Ratio vs Depth for the Sidetracked Well.
Figure 21. Side Force vs Depth for the Sidetracked Well.

63
D.4 Hydraulic Evaluations
Figure 22. Circulating Pressure vs Depth for the Sidetracked Well.
Figure 23. Cuttings transport for the Sidetracked Well.

64
Figure 24. ECD vs Depth for the Sidetracked Well.
Figure 25. Min. Flow rate vs ROP for the Sidetracked Well.

65
Figure 26. Pump Pressure vs Pump Rate for the Sidetracked Well.

66
D.5 Casing Program
Figure 27. Well Schematic – Casing program for the Sidetracked Well.

67
Figure 28. Design limits of 9 5/8” production casing for the Sidetracked Well.

68

69
Abbreviations
E&P- Exploration and Production
DIWE- Drilling Integrated Workflow Environment
BHA- Bottom hole assembly
ROP- Rate of penetration
WOB- Weight on bit
NPT- Non-productive time
ECD- Equivalent circulating density
DPC- Drilling performance curve
G&G data – Geological and geophysical data
DS - Drill string
TVD- True vertical depth
TC - Technical sidetrack
DLS - Dogleg severity
PDC bit – Polycrystalline-diamond compact bits
MWD - Measurement while drilling
PDM - Positive Displacement Motor
DC - Drill Collar
RSS - Rotary Steerable System
WOB - Weight on Bit
LCM - Loss Circulation Material
OH- Openhole
UCS - Unconfined Compressive Strength
TOC- Top of Cement
RPM – Revolutions per Minute
KOP- Kick-off point
RIH- Running into the hole
MD- Measured Depth
TVD- True Vertical Depth
WOW-Wait on weather

70
T&D - Torque and Drag
HSE – Health Safety Environment
ILT - Invisible Loss Time
TOB – Torque on Bit
POOH – Pull out of the hole
DP – Drill Pipe
MWD- Measurement While Drilling
FF – Friction Factor

71
Bibliography
AL-SALMI, A. A. D., AL-HAJI, Y., AL-HAMHAMI, S. & AL FADHLI, A. 2011. New
Technique To Side Track Across Very Hard Formation In The North Of Oman. Society
of Petroleum Engineers.
AMADI-ECHENDU, J. & YAKUBU, A. E. 2015. Asset Operations: Non-productive Times
During Oil Well Drilling. In: LEE, B. W., CHOI, B., MA, L. & MATHEW, J. (eds.)
Proceedings of the 7th World Congress on Engineering Asset Management (WCEAM
2012). Cham: Springer International Publishing.
ASSOCIATION, N. O. A. G. 2013. NORSOK D-010 Standard, Well integrity in drilling and
well operations. Norway
BAKER_HUGHES 1995. Drilling Engineering Workbook, Baker Hughes INTEQ Training &
Development 2520 W.W. Thorne Houston, TX 77073 United States of America 713-625-
4415.
BOURGOYNE, A. T., JR., MILLHEIM, K. K., CHENEVERT, M. E. & YOUNG, F. S., JR.
1986. Applied drilling engineering, Richardson, TX, Richardson, TX, United States: Soc.
Pet. Eng.
BRECHAN, B. A. 2014a. Casing Design, NTNU Governing Documentation, Norwegian
University of Science and Technology
BRECHAN, B. A. 2014b. Drilling and Completion Operations, NTNU Governing
Documentation. Norwegian University of Science and Technology
BRECHAN, B. A. 2014c. Drilling Program, TPG4525 Drilling Engineering, Norwegian
University of Science and Technology
BRECHAN, B. A. 2014d. General Drilling Experience, TPG4525 Drilling Engineering.
Norwegian Univeristy Science and Technology
BRECHAN, B. A. 2014e. Recommendation to Drill / Statement of Requirments, TPG 4525
Drilling Engineering Norwegian University Science and Technology
BRECHAN, B. A. 2014f. Well Construction, NTNU Governing Documentation. Norwegian
University of Science and Technology
BRETT, J. F. & MILLHEIM, K. K. 1986. The Drilling Performance Curve: A Yardstick for
Judging Drilling Performance. Society of Petroleum Engineers.

72
BRETT, J. F. & SUMMERS, M. A. 1984. Planning and Practical Problem Solving Using an
Engineering Simulator for Drilling. Society of Petroleum Engineers.
BROUSSARD, A. N., TEMPLETON, G. W. & TRAVIS, D. 2009. Whipstock-and-Inflatable
Packer Combination Decreases Openhole Sidetracking Costs in Central Arkansas.
Society of Petroleum Engineers.
CHAMAT, E. H. & LEAVITT, T. 2011. New Approach for Successful Sidetracking of a Cement
Plug in Salt and Sub-Salt Wells at High Inclinations Using Rotary Steerable Tools and
Reamers. Society of Petroleum Engineers.
DANG, L., PENG, P., ZHOU, G., CHEN, Z., PHAN, C. V., WALKER, J., ZHAO, J., ZHAO, Z.
& LIU, G. 2013. First Openhole Sidetrack in Deep Horizontal Well Saves Time and
Lowers Cost: A Case Study. International Petroleum Technology Conference.
DANNY HARRELL, G. N., AND ROCKY SEALE-SMITH INTERNATIONAL INC. 2001.
Knowing Your Options When Attempting to Sidetrack in Open Hole. American
Association of Drilling Engineers.
DEEKS, N. R., AREVALO, Y. I. & FERNANDES, A. 2012. A WITSML Enabled Workflow
for Integrating Offset Well Drilling Risks and Events Into Well Planning and Execution.
Society of Petroleum Engineers.
DEWEY, C. H., SWADI, S. N., CAMPBELL, J. M. & DESAI, P. 2012. New Tools and
Procedures Increase Reliability of Openhole Sidetrack Operations. Society of Petroleum
Engineers.
EMERY, J. C. 1969. Organizational planning and control systems : theory and technology,
London, Macmillan.
FRANÇOIS CLOUZEAU, G. M., DIANE NEFF, GRAHAM RITCHIE, RANDY HANSEN,
DOMINIC MCCANN, LAURENT PROUVOST 1998. Planning and Drilling Wells in
the Next Millennium. Oilfield Review.
HELLSTRÖM, A. H. K. 2010. ”Statoil Drilling and Well Learning Curves, Experience and
Theory Is there a learning curve from drilling the first well with a new rig and onwards?
HERIOT-WATT_UNIVERSITY 2010. Syllabus of Drilling Engineering course at Heriot-Watt
University.
INGLIS, T. 1988. Directional Drilling Springer Netherlands.

73
KETIL TØRGE, R. S., JIMMY LAND, MORAN, D. & SHANTANU SWADI, G. B. 2014.
Whipstock Options for Sidetracking. Oilfield Review, 10.
MAIN, B. W. 2004. Risk Assessment. Professional Safety, 49, 37-47.
MAIN, B. W. 2006. The Basics of Risk Assessment. American Society of Safety Engineers.
MCCANN, D. P., RITCHIE, G. M. & WARD, V. L. 1998. The Integrated Solution: New System
Improves Efficiency of Drilling Planning and Monitoring. Society of Petroleum
Engineers.
MCGHEE, E. 1985. Structuring of Tasks Can Boost Drilling Rate. Offshore.
MILLHEIM, K. K. 1983. An Engineering Simulator for Drilling: Part I. Society of Petroleum
Engineers.
MOAZZENI, A. R., NABAEI, M. & GHADAMI, S. 2011. Nonproductive Time Reduction
Through a Deep-Rig Time Analysis: Case Study. Society of Petroleum Engineers.
MOHAN, R. D., BERMUDEZ, R. A. & AILLUD, G. S. 2014. Achieving Drilling Excellence
through Next Generation Workflows Enabled By Integrating Historical Drilling Data and
Real Time Data. Society of Petroleum Engineers.
PITTMAN, J. 1985. Computer Speeds Offshore Well Planning, Rig Scheduling. Oil & Gas
Journal.
REID, D., ROSENBERG, S., MONTGOMERY, M., SUTHERLAND, M. & YORK, P. 2006.
Drilling-Hazard Mitigation-Reducing Nonproductive Time by Application of Common
Sense and High-Value-Well Construction Techniques. Offshore Technology Conference.
REMSON, D. 1985. Planning Technique-Key to Drilling Efficiency (includes associated papers
14971 and 15044 ).
REMSON, D. R. 1989. Experience With Effective Drilling. Society of Petroleum Engineers.
RON DIRKSEN, B. D., CHRIS MAINGOT 2015. IADC Drilling Manual, International
Association of Drilling Contractors (IADC).
SHAPERO, A. 1960. Human Engineering Testing and Malfunctions Data Collection in Weapon
System Test Programs. Wright-Patterson Air Force Base.
STERNBERG, R. J. 1982. Handbook of human intelligence, Cambridge, Cambridge University
Press.
THOROGOOD 2000. Delivering World Class Exploration Drilling - Integration of Design,
Planning and Execution. Society of Petroleum Engineers

74
THOROGOOD, J. L. & BARDWELL, K. S. 1998. Risk Assessment of a Dynamically
Positioned Drilling Operation. Society of Petroleum Engineers.
VILLATORO, J. J., SCHMIGEL, K. & BOUTALBI, S. M. 2009. Controlled Pressure Drilling
(CPD) Candidate Screening Methodology. Society of Petroleum Engineers.
WANG, H., SOLIMAN, M. Y. & TOWLER, B. F. 2009. Investigation of Factors for
Strengthening a Wellbore by Propping Fractures.
WARREN, T. M. 2006. Steerable Motors Hold Their Own Against Rotary Steerable Systems.
Society of Petroleum Engineers.