
Operational Risk Management Improvements within Internal Control ...

PNNL-13756
Experience and Operational Improvements in Mixer Pump Performance F. F. Erian O. D. Mullen M. I. Kellogg March 2002 Prepared for the U.S. Department of Energy under Contract DE-AC06-76RL01830

DISCLAIMER This report was prepared as an account of work sponsored by an agency of the United States Government. Neither the United States Government nor any agency thereof, nor Battelle Memorial Institute, nor any of their employees, makes any warranty, express or implied, or assumes any legal liability or responsibility for the accuracy, completeness, or usefulness of any information, apparatus, product, or process disclosed, or represents that its use would not infringe privately owned rights. Reference herein to any specific commercial product, process, or service by trade name, trademark, manufacturer, or otherwise does not necessarily constitute or imply its endorsement, recommendation, or favoring by the United States Government or any agency thereof, or Battelle Memorial Institute. The views and opinions of authors expressed herein do not necessarily state or reflect those of the United States Government or any agency thereof. PACIFIC NORTHWEST NATIONAL LABORATORY operated by BATTELLE for the UNITED STATES DEPARTMENT OF ENERGY under Contract DE-ACO6-76RLO183O Printed in the United States of America Available to DOE and DOE contractors from the Office of Scientific and Technical Information, P.O. Box 62, Oak Ridge, TN 37831-0062; ph: (865) 576-8401 fax: (865) 576-5728 email: [email protected] Available to the public from the National Technical Information Service, U.S. Department of Commerce, 5285 Port Royal Rd., Springfield, VA 22161 ph: (800) 553-6847 fax: (703) 605-6900 email: [email protected] online ordering: http://www.ntis.gov/ordering.htm
This document was printed on recycled paper. (8/00)

PNNL-13756
Experience and Operational Improvements in Mixer Pump Performance F. F. Erian O. D. Mullen M. I. Kellogg(a)
March 2002 Prepared for the U.S. Department of Energy under Contract DE-AC06-76RL01830
Pacific Northwest National Laboratory Richland, Washington 99352
______________________________ (a) Graduate Student, Brigham Young University

iii
Summary Millions of gallons of radioactive waste are stored in large underground tanks at various DOE sites. In many cases, the waste in the tanks is made up of a layer of settled solids, in sludge form, at the bottom with a layer of supernatant liquid on top of it. The thickness and composition of each layer vary from tank to tank. It is necessary to mix the solids in the sludge layer with the supernatant liquid to facilitate waste removal from the storage tanks. The goal of this project is to improve the mobilization of the settled solids in the sludge layer by optimizing their mixing with the supernatant liquid and by preserving the mobility of the solids in that mixture. This report documents work related to two series of tests and provides a brief account of the successful mobilization and removal of most of the radioactive waste from Tank D8-2 at the West Valley Demonstration Project. Recently, the Savannah River Site (SRS) expressed interest in finding out whether time-phase separa-tion between mixer pump head oscillations has an effect on the overall mobilization performance of the mixer pumps. This issue is especially significant when mobilizing solids with specific gravities of greater than 2.5. Such solids tend to resettle to the tank bottom shortly after the passing of a mixing jet. If a mixing jet from another mixer pump happens to follow temporarily the path of the leading mixing jet, it may be possible to prevent or slow down the resettling of the heavy particles and keep them in suspen-sion. If a retrieval pump were operating at that time, it would facilitate removal of such particles. Pre-liminary experiments were carried out to observe whether time-phase separation has some influence on the overall mobilization. To meet the original SRS specifications for required discharge flow rate per mixing nozzle (two nozzles per mixer pump), the manufacturer of the mixer pumps modified the pump casing design by cutting off a 90-degree bend that was just upstream of the mixing nozzle’s exit. Eliminating the pressure losses due to that 90-degree bend increased the discharge rate per nozzle to the specified value (600 gpm). However, this modification changed the mixing nozzle’s discharge direction from radial to tangential. No consideration was given to the effect of this direction change on the mixing and mobilization performance of the mixer pumps. This report documents our attempt to determine which nozzle orientation would provide better overall mobilization performance under identical operating conditions: 1) the new tan-gentially oriented mixing jets operating at the specified discharge rate or 2) the original radially oriented mixing jets operating at a lower-than-specified discharge rate. The two mixing nozzle orientations produced significantly different wave patterns in the mixed upper region of our model mixing tank, indicating differences in mobilization effectiveness. But, because of inadequate sampling equipment and the rapid erosion of the 90-degree elbows that produced the tangentially oriented mixing jets, it was not possible to reach a definitive determination.

iv

v
Acknowledgment This work was funded by the U.S. Department of Energy’s EM-50 Tanks Focus Area (TFA) under the Retrieval Process Development and Enhancements Project, Office of Environmental Management..

vi

vii
Contents
Summary ...................................................................................................................................................... iii
Acknowledgment .......................................................................................................................................... v
1.0 Introduction......................................................................................................................................... 1.1
2.0 Mixer Pump Operational Improvement—Time Phase Separation ..................................................... 2.1 2.1 Introduction .................................................................................................................................... 2.1 2.2 Physical Basis for Improvements ................................................................................................... 2.3 2.3 The Experiments............................................................................................................................. 2.5 2.4 Test Matrix ..................................................................................................................................... 2.5 2.5 Experimental Facilities and Instrumentation .................................................................................. 2.6
2.5.1 Mixing Tank............................................................................................................................ 2.6 2.5.2 Mixing Heads .......................................................................................................................... 2.6 2.5.3 Main Pumps............................................................................................................................. 2.7 2.5.4 Local Slurry Density Measurements ....................................................................................... 2.7
2.6 Data Acquisition System ................................................................................................................ 2.8 2.7 Material Characterization and Experimental Preparations ............................................................. 2.8 2.8 Experimental Procedures and Data Acquisition and Analysis ....................................................... 2.9
2.6.1 Data Collection...................................................................................................................... 2.10 2.8.2 Time Series of the Mixture Density ...................................................................................... 2.11 2.8.2 Data Analysis ........................................................................................................................ 2.15
2.9 Conclusions and Recommendations for Future Work.................................................................. 2.20
3.0 Mixer Pump Operational Improvement—Nozzle Orientation............................................................ 3.1 3.1 Introduction .................................................................................................................................... 3.1 3.2 Experimental Facilities ................................................................................................................... 3.1 3.3 Instrumentation and Measurement Methods .................................................................................. 3.4 3.4 The Test Materials .......................................................................................................................... 3.4 3.5 Experimental Procedures................................................................................................................ 3.5 3.6 Data Acquisition Procedures .......................................................................................................... 3.5 3.7 Qualitative Results.......................................................................................................................... 3.6 3.8 Nozzle Evaluation .......................................................................................................................... 3.9
3.8.1 Radial Nozzles......................................................................................................................... 3.9 3.8.2 Tangential Nozzles ................................................................................................................ 3.11 3.8.3 High-Flow Radial Jets ........................................................................................................... 3.12
3.9 Fluffed (Quick) Sand.................................................................................................................... 3.14 3.10 Conclusions ................................................................................................................................ 3.14
4.0 West Valley Demonstration Project Experience−Tank D8-2 ............................................................. 4.1 4.1 Introduction .................................................................................................................................... 4.1 4.2 Facilities ......................................................................................................................................... 4.1 4.3 Pretreatment.................................................................................................................................... 4.2 4.4 Waste Composition ........................................................................................................................ 4.3 4.5 Procedures ...................................................................................................................................... 4.3 4.6 Operations and Effectiveness ......................................................................................................... 4.4

viii
4.7 Process Improvements.................................................................................................................... 4.4 4.8 Major Challenges............................................................................................................................ 4.4 4.9 Lessons Learned ............................................................................................................................. 4.5
5.0 Reference ............................................................................................................................................ 5.1
Appendix A: Flow Meter Calibration ...................................................................................................... A.1
Appendix B: Physical Properties of the Solid Particles ............................................................................B.1
Appendix C: Solid Particles Washing Procedures and Test Conditions...................................................C.1
Appendix D: Data Collection Procedures ................................................................................................ D.1
Appendix E: HLW Mobilization and Retrieval at West Valley Demonstration Project...........................E.1

ix
Figures 2.1 General Arrangement of the Mixing Tank Apparatus ..................................................................2.1 2.2a Mixing Heads with Tangentially and Radially Oriented Nozzles ................................................2.2 2.2b Mixing Heads with Nozzle System at Various Phase Angle Separations and
Combined Coordinate System ......................................................................................................2.2 2.3 Boundaries of Effective Cleaning Radius and Temporal Zone of Influence for
Mixing Heads at the Center of a Tank ..........................................................................................2.4 2.4 Two Mixing Heads with Tangentially Oriented Jets Oscillating with Time Phase Separation ....2.4 2.5 Mixture Density Behavior under Equilibrium Conditions..........................................................2.11 2.6 Mixture Density Behavior under Equilibrium Conditions and 45° Phase Separation ................2.12 2.7 Instantaneous Mixture Density with 180° Phase Lag Between Mixing Nozzles........................2.13 2.8 Instantaneous Mixture Density with 45° Phase Lag Between Mixing Nozzles..........................2.14 2.9 Instantaneous Mixture Density with 90° Phase Lag Between Mixing Nozzles..........................2.14 2.10 Instantaneous Mixture Density with 135° Phase Lag Between Mixing Nozzles........................2.15 2.11a Average Mixture Density with 180° Phase Lag Between Mixing Nozzles ................................2.16 2.11b Average Mixture Density with 90° Phase Lag Between Mixing Nozzles ..................................2.16 2.12 Summary of Slurry Density Variations with Phase Angle at Two Radial Locations .................2.17 2.13 Average Density at Equilibrium .................................................................................................2.19 2.14 Average Slurry Density Change .................................................................................................2.19 2.15 Absolute and Relative Slurry Density Change ...........................................................................2.20 3.1 Mixing Tank and Oscillating Mechanism of the Mixing Head ....................................................3.2 3.2 Mixing Head Nozzles Assembly ..................................................................................................3.3 3.3 Three Different Solids Contours that Resulted from the Shown Operating Conditions...............3.6 3.4 Pump Operation with Bottom Suction ..........................................................................................3.7 3.5 Tangential Nozzle Inserts at Various Stages of Erosion at the 90° Bend .....................................3.8 3.6 Typical Mixing/Mobilization Pattern During Radial Mixing Nozzle Operation..........................3.9 3.7 Observed Depths of the Settled Solids Layer for Radially Oriented Nozzles ............................3.10 3.8 Solids Volume Concentration in the Mixed Slurry as It Changes with Time.............................3.10 3.9 Mobilization Patterns for Tangentially Oriented Nozzles ..........................................................3.11 3.10 Solids Volume Concentration in the Mixed Slurry as it Changes with Time .............................3.12 3.11 Mobilization Patterns for Tangentially Oriented Nozzles ..........................................................3.13 3.12 Solid Volume Concentration in Mixed Slurry as it Changes with Time at Higher
Mixing Jet Flow Rates ................................................................................................................3.13
Tables 3.1 Quicksand Void Fraction ............................................................................................................3.14

1.1
1.0 Introduction
Millions of gallons of radioactive waste are contained in large underground storage tanks at various DOE sites. In many cases, these tanks contain a layer of settled sludge at the bottom of the tank and a layer of supernatant liquid on top of that. The thickness of each layer varies from tank to tank. The layer of liquid is frequently needed to keep the active sludge layer from overheating. When the layer of super-natant liquid is reduced in height due to evaporation, additional liquid is usually added to maintain the thermal balance and stability of the waste. Tank interiors vary in size and internal structure and contain different quantities of radioactive waste. The waste itself is not uniform in composition and species distribution within the tank’s storage space. It is fair to say that each tank presents a nearly unique waste-handling situation. The underground storage tanks have a finite lifetime, and many have reached the point when it is prudent to remove the waste that is stored in them for safety reasons. Regardless, radioactive waste must eventually be retrieved and delivered to pretreatment facilities and/or vitrification plants for permanent long-term storage. Our goal is to improve the overall mobilization of the settled solids in the sludge layer by optimizing the mixing processes between the settled solids and the liquid in the supernatant layer, and by preserving the mobility of the solids in that mixture. Many of the radioactive waste-containing tanks have internal obstructions in the form of support columns, instrument trees, cooling coils, and other structural and non-structural components that performed special functions in the past and became part of the radioactive material that is contained within them. At some point in the process of specifying and designing suitable equipment to handle the stored waste and developing appropriate strategies to mobilize and retrieve it from the tanks, consideration must be given to these obstructions. Both the selection and positioning of the hardware and the choice of strategies for mixing, mobilizing, and retrieving the waste must take into account the impact of these interior obstructions. Mixing and mobilization are related terms but describe different functions. Mixing is usually a temporary, short-term operation performed to achieve certain objectives such as the release of gas bubbles from the sludge layer into the tank dome space or to achieve waste uniformity for extracting a representa-tive waste sample. Once these objectives are achieved the mixing process can be stopped, and the solids and liquids return to their initial unmixed, or two-layer, stratified geometry after a certain equilibration time. No waste removal usually follows a simple, short-term mixing operation. Mobilization, on the other hand, is achieved by mixing the solids and liquids, not necessarily to achieve mixture uniformity for some temporary action but to maintain the solids in suspension for as long as necessary to retrieve the waste mixture from the tank. In Section 2 of this report, we respond to the interest expressed by the Savannah River Site (SRS) in finding out whether the time-phase separation between oscillating pump heads (each pump head contains two mixing jets) that are submerged in a sludge layer has an effect on the mobilization performance of the mixer pumps. This issue is relevant mainly when mobilizing high specific-gravity solids (higher than 2.5 or 3). A mixing jet rotating slowly within a settled bed of fine solid particles will fluidize, then suspend these particles. If the average settling time of these particles is longer than half a rotation period of the mixer pump, the mixing jets will tend to maintain such particles in suspension. If, on the other hand, the

1.2
solid particles have a shorter settling time than half the mixing jet’s rotation period, then, by virtue of their higher specific gravity and even if they are small in size, they will settle quickly to the bottom once the mixing jets move away from the region within which these particles have been momentarily influenced by the mixing jet’s momentum. Clearly, it is much more difficult to keep high specific-gravity particles mobilized than lighter ones. In Section 2 we report the results of some preliminary experiments that may shed some light on the influence of time-phase separation on mobilization. Section 3 describes the modification applied to the baseline mixer pumps by their manufacturer that allowed them to meet the specifications of SRS, the purchaser. The issue was the inability of the original mixer pumps to meet the 600 gpm per mixing nozzle (two mixing nozzles per mixer pump) requirement specified by SRS engineers. The pump included two radially oriented mixing nozzles that were attached to the perimeter of the pump casing (the volute) via two small-radius 90-degree elbows. The considerable pressure losses due to the high-speed flow through these elbows prevented the pump from supplying the specified flow rate. The manufacturer modified that geometry by eliminating the 90-degree elbows, causing the nozzles to have a tangential discharge direction instead of the original radial nozzle geometry. No consideration was given to the effect of this modification on the mixing and mobilization effectiveness of the mixer pump. The question that we attempted to answer was whether the overall mobilization performance of the Lawrence mixer pump was better with the new tangential geometry operating at somewhat higher velocity, 600 gpm, than with the original radially oriented geometry, operating at a somewhat lower velocity, corresponding to a flow rate that is less than 600 gpm. Many studies have been carried out to characterize the waste and to develop methods for its mobiliza-tion and eventual retrieval. A few waste removal operations have been attempted with varying degrees of success. For instance, at the West Valley Demonstration Project (WVDP), 1.3 million liters of high-level waste (HLW) were removed successfully from two large underground storage tanks. The waste mobiliza-tion and removal operations resulted in many “lessons learned” that may benefit others who are now, or will be in the future, performing similar operations. Section 4 of this report contains a brief summary of the WVDP waste mobilization and removal operations from Tank D8-2. Additional information may be found in the appendixes at the end of the report.

2.1
2.0 Mixer Pump Operational Improvement—Time Phase Separation
The desire to find methods and procedures to improve the operation of the baseline mixer pumps derives from the availability of a large number of such pumps at SRS and the desire to use them in the best way possible rather than considering alternatives. In this section we test the idea that applying time-phase separation between the oscillating pump heads will enhance the mobilization performance of a mixer pump, especially when dealing with waste that contains relatively high specific-gravity solids.
2.1 Introduction
In this experimental effort we hope to obtain data to characterize the effectiveness of the mixing process between two initially stationary layers. A layer of fine but fast-settling solid particles (having relatively high specific gravity) is placed at the bottom of a small, 6-ft-diameter tank to simulate a settled waste particulate material. A layer of water is placed on top of the solids layer to simulate a supernatant liquid. For simplicity, the two layers are of equal height, 1 ft, but the water will also fill the interstitial spaces of the solids layer. Our goal is to improve the overall mobilization of the solids by optimizing the mixing processes between the settled solids and the supernatant liquid layer and by preserving the mobility of the solids in that mixture. The purpose of these tests is to observe the influence of time-phase separation between two oscillating mixing heads on the effectiveness of the overall mixing process. Each mixing head contains two nozzles that produce powerful liquid jets. The jets emanate from the two oscillating mixing heads and can be oriented for either radial or tangential discharge. In Figure 2.1, the
������������������������������������������������������������������������������������������������������������������������������������������������������������������������������������������������������������������������������������������������������
1.5 ft
6-8 in
6 ft
TableSupportSystem
Scissor Lift
Motor
Pump
CorriolisMeter
PeristolticPump
SampleTube
4-BeamUnistrut
Base
FlowMeter
Mixing JetSupply Pipe
RotaryMechanism
1 ft
1 ft
SupernateLayer
SettledSolids
MixingTank
Figure 2.1. General Arrangement of the Mixing Tank Apparatus
2.2
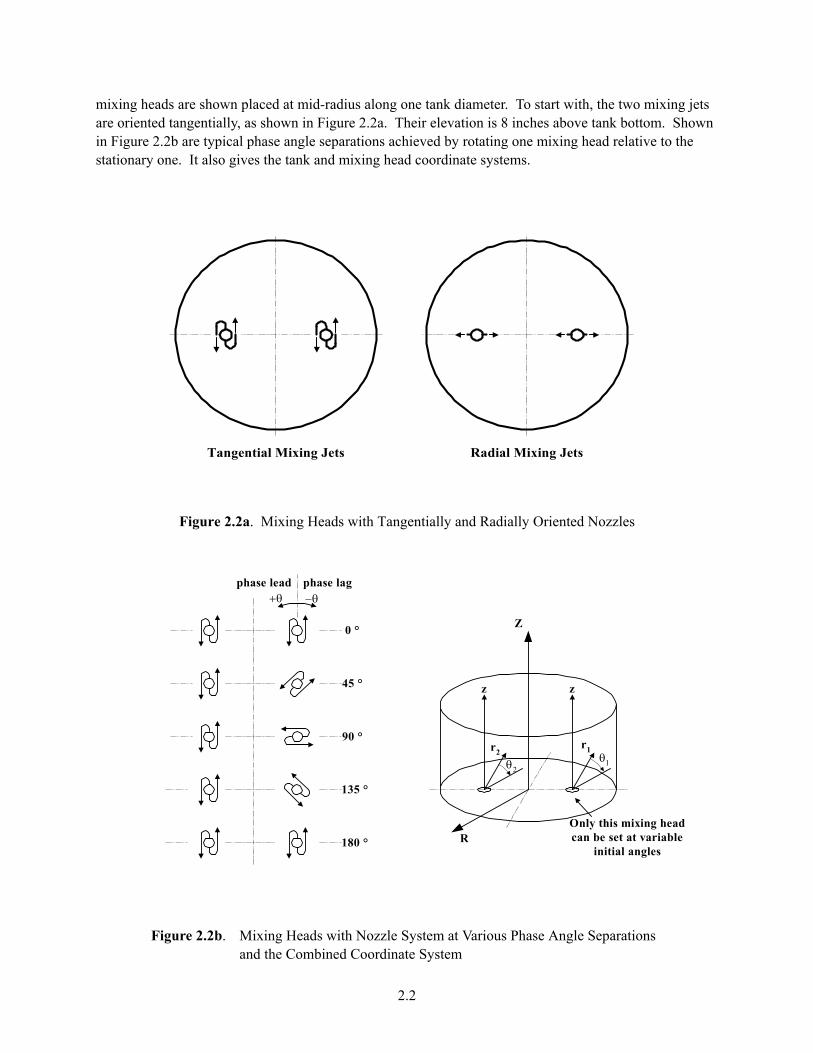
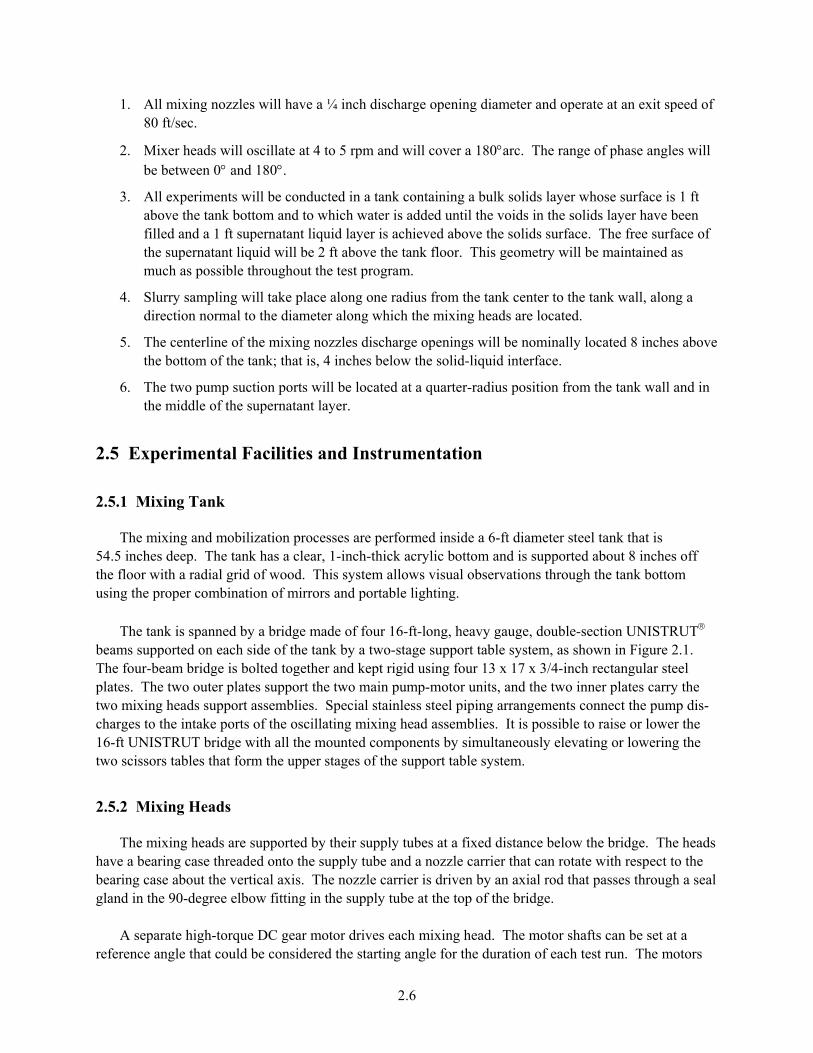
mixing heads are shown placed at mid-radius along one tank diameter. To start with, the two mixing jets are oriented tangentially, as shown in Figure 2.2a. Their elevation is 8 inches above tank bottom. Shown in Figure 2.2b are typical phase angle separations achieved by rotating one mixing head relative to the stationary one. It also gives the tank and mixing head coordinate systems.
Tangential Mixing Jets Radial Mixing Jets
Figure 2.2a. Mixing Heads with Tangentially and Radially Oriented Nozzles
z
0 °
45 °
90 °
135 °
180 °
z
r2r1
θ2θ1
Only this mixing headcan be set at variable
initial angles
−θ+θphase lead phase lag
Z
R
Figure 2.2b. Mixing Heads with Nozzle System at Various Phase Angle Separations and the Combined Coordinate System

2.3
The overall goal of the experiment is to demonstrate, qualitatively, that measurable improvements can be achieved in the effectiveness of the mixing process when the two mixing heads have certain discrete time-phase separations in their oscillating pattern. The test results are not scalable to the operation of the mixing pumps in full-scale tanks. No comprehensive scale-up rules exist, and the results must be viewed only qualitatively. However, the observations will help identify the types of equipment that can produce such improvements, if any, as well as the operational strategies that lead to their occurrence.
2.2 Physical Basis for Improvements
Mixing is still subject to extensive studies both in academia and in industry. Mixing large volumes of initially separated (usually stratified) materials that are stored in large tanks continues to represent a sig-nificant challenge. Powerful liquid jets imbedded into wet or dry granular beds have been used exten-sively to “cut” particles out from their surrounding settled or packed beds. The liquid jets can maintain such materials in a well-mixed and mobilized state as long as they continue to impart significant amounts of energy directly into a finite size region that we call the “zone of influence” (ZOI). The size of that zone depends on the liquid jet momentum, the physical properties of the granular material, and the nature of the interaction between the liquid jet and the few granular layers that are sheared by the jetstream. If the mixing jet is made to move continuously along a prescribed path, new solids will be suspended and mobilized in new ZOIs, while those in the previous zones will begin to settle. If the prescribed path of the mixing jet is a circle, the outer boundary of the collective region that would be influenced by the mixing jet is normally characterized by the term “effective cleaning radius” (ECR), as shown in Figure 2.3. This parameter is useful in characterizing the potential mobilized zone in a tank containing solids that are of the non-settling type (more precisely, “the very slow settling type”). Non-settling solids have a character-istic settling time that is much longer than the mixing jet’s rotational period. For instance, some of the sludge being mobilized in Tank 8 at the SRS stays suspended after many days of mixer pump operation. Retrieval processes usually follow the completion, or reaching, of steady-state ECR. During the retrieval operation the sludge stays in the mobilized state with little settling. The parameter ECR is not applicable to solids whose settling time is much less than the mixing jet’s rotational period. Some of the sludge in the Hanford storage tanks has a high specific gravity and falls into the fast-settling category. In this case the solids will settle shortly after the mixing jet’s ZOI has passed by.
A specific solids volume will experience suspension and settling cycles with a frequency that is a function of the mixing nozzle’s rotational speed and path length. In most real situations, the specific gravity of the solid particles is high enough to cause the solid particles to be in the settled state for most of a single mixing jet cycle. Multiple mixing jets that are independently driven and separated by a certain time phase can significantly increase the suspension time portion of the total cycle period as well as main-tain the quality of the mixture as represented by the local concentration. Multiple mixing jet systems that follow a circular motion, separated by an appropriate time lag, are shown schematically in Figure 2.4. Clearly, the larger the width of the ZOI, the larger the suspended volume will be. In this situation a strategy must be developed to match the mixing jet dispersive characteristics, which are dependent on the waste solids physical properties, with an optimal positioning of the retrieval pump.

2.4
ECR ZOI
Figure 2.3. Boundaries of the Effective Cleaning Radius (ECR) and the Temporal Zone of Influence (ZOI) for Mixing Heads in the Center of a Tank
ZOI
ZOI
MixingHead
Figure 2.4. Two Mixing Heads with Tangentially Oriented Jets Oscillating with a Time Phase Separation

2.5
2.3 The Experiments The goal of the experimental work is to observe the influence of time-phase separation between two opposite oscillating mixing heads, each equipped with two nozzles, on the overall mixing and mobiliza-tion of the two stratified layers in the 6-ft mixing tank. The information is oriented toward the needs of the main users of mixer pumps, especially those at SRS and Hanford. We hope that the results of these tests will help achieve optimum mixing and mobilization when full-scale mixer pumps are deployed in waste storage tanks at these two sites. The test equipment is not geometrically scaled to any existing tank, and the tests’ operating condi-tions are scaled neither kinematically nor dynamically to any specified operating conditions. Observed changes in the mobilization effectiveness are strictly dependent on comparisons between measured quantities, such as slurry density, when the mixing heads are oscillating in synchrony and when a time-phase separation exists between their oscillations. Two mixing heads that operate in a 6-ft-diameter model tank performed the mobilization action. In the first series of tests, the mixing heads’ geometry approximately mimicked the configuration of the Lawrence mixer pump nozzle assemblies as installed in Tank 8 at SRS (see Figure 2.2a with tangential nozzles). Each head is suspended at the base of a vertically oriented slurry supply pipe that positions it radially at mid-radius along a single tank diameter. The mixing heads can be raised or lowered to achieve any desired depth within the packed solids layer. Two identical but independently driven slurry pumps supplied the nozzles installed in the two mixing heads. Each jet-mixing head has two diametrically opposed nozzles that can be oriented along the radial or tangential directions, relative to the suspending pipe axis. Each nozzle pair can produce, independently, either radially oriented or tangentially oriented jet streams. It may also be possible to combine both radial and tangential mixing-jet streams on one mixing head. The model tank is set at the beginning of each test to contain a layer of fine solid particles that may vary in height from 6 to 18 inches and a layer of clean water, usually of equal height, above that. The solid particles have been selected to offer a challenging mobilization task to the mixing jets. They are hard glass beads of nearly uniform size, about 100 µm. They have been washed to maintain our ability to visualize, at least partially, the topographical results of the mixing process a few moments after the mixing jets have stopped. Their high specific gravity, ~2.7, will cause them to settle fast in less than 10 seconds (settling velocity ≈ 0.05 ft/sec). Mobilization performance was evaluated by sampling the solids/water mixture at strategic locations over the tank’s cross-section, starting with sample extractions along a diameter perpendicular to the one along which the mixing heads are located. The local solids contents in a sample that is a measure of the sustainable mobilization is directly related to the local slurry density in the sample. The local slurry density, an output of the Coriolis Micro-Motion flowmeter, is shown as a function of oscillation cycle time and other relevant parameters in Section 2.8.
2.4 Test Matrix Significant effort was devoted to developing the experimental facilities needed to perform the tests. Both facilities and instrumentation system are designed to perform a wide variety of tests that can satisfy the needs of this problem as well as many others. The following is the test matrix:
2.6
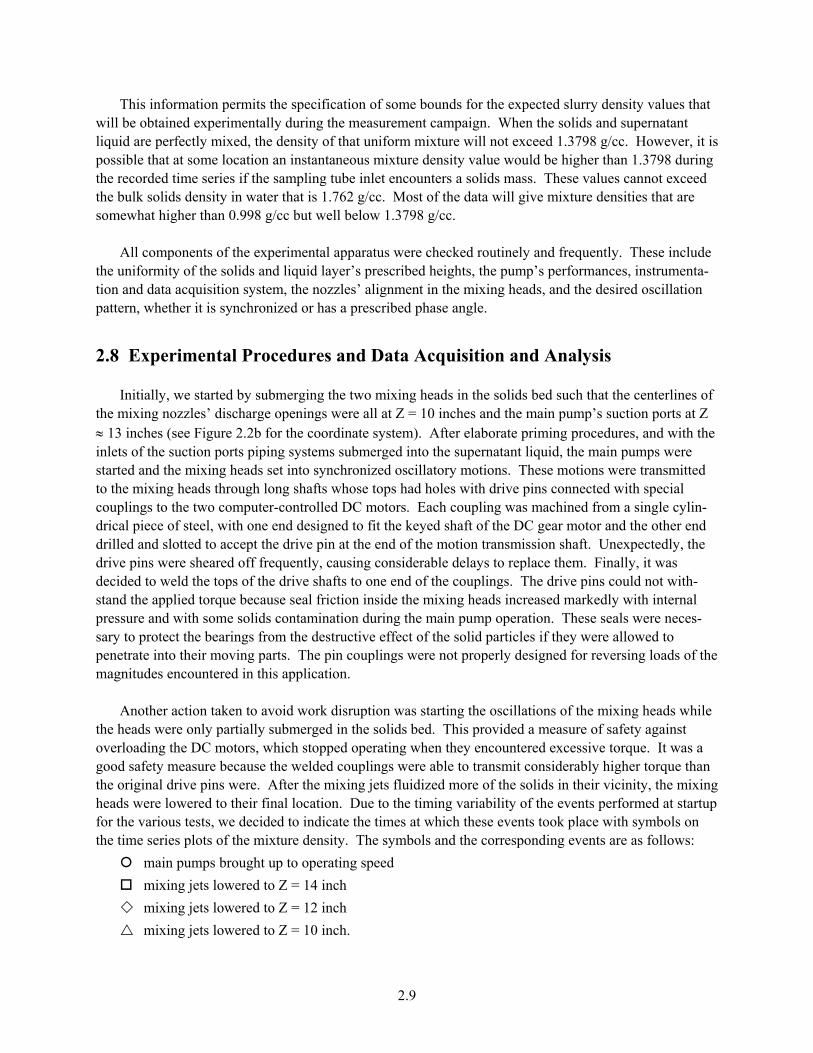
1. All mixing nozzles will have a ¼ inch discharge opening diameter and operate at an exit speed of 80 ft/sec.
2. Mixer heads will oscillate at 4 to 5 rpm and will cover a 180°arc. The range of phase angles will be between 0° and 180°.
3. All experiments will be conducted in a tank containing a bulk solids layer whose surface is 1 ft above the tank bottom and to which water is added until the voids in the solids layer have been filled and a 1 ft supernatant liquid layer is achieved above the solids surface. The free surface of the supernatant liquid will be 2 ft above the tank floor. This geometry will be maintained as much as possible throughout the test program.
4. Slurry sampling will take place along one radius from the tank center to the tank wall, along a direction normal to the diameter along which the mixing heads are located.
5. The centerline of the mixing nozzles discharge openings will be nominally located 8 inches above the bottom of the tank; that is, 4 inches below the solid-liquid interface.
6. The two pump suction ports will be located at a quarter-radius position from the tank wall and in the middle of the supernatant layer.
2.5 Experimental Facilities and Instrumentation
2.5.1 Mixing Tank The mixing and mobilization processes are performed inside a 6-ft diameter steel tank that is 54.5 inches deep. The tank has a clear, 1-inch-thick acrylic bottom and is supported about 8 inches off the floor with a radial grid of wood. This system allows visual observations through the tank bottom using the proper combination of mirrors and portable lighting. The tank is spanned by a bridge made of four 16-ft-long, heavy gauge, double-section UNISTRUT beams supported on each side of the tank by a two-stage support table system, as shown in Figure 2.1. The four-beam bridge is bolted together and kept rigid using four 13 x 17 x 3/4-inch rectangular steel plates. The two outer plates support the two main pump-motor units, and the two inner plates carry the two mixing heads support assemblies. Special stainless steel piping arrangements connect the pump dis-charges to the intake ports of the oscillating mixing head assemblies. It is possible to raise or lower the 16-ft UNISTRUT bridge with all the mounted components by simultaneously elevating or lowering the two scissors tables that form the upper stages of the support table system.
2.5.2 Mixing Heads
The mixing heads are supported by their supply tubes at a fixed distance below the bridge. The heads have a bearing case threaded onto the supply tube and a nozzle carrier that can rotate with respect to the bearing case about the vertical axis. The nozzle carrier is driven by an axial rod that passes through a seal gland in the 90-degree elbow fitting in the supply tube at the top of the bridge.
A separate high-torque DC gear motor drives each mixing head. The motor shafts can be set at a reference angle that could be considered the starting angle for the duration of each test run. The motors

2.7
that rotate the mixing heads are provided by Oriental Motors and are from their Alpha Step Series. They are controlled like stepping motors but act like servo motors in that they will indicate an error condition if they are more than 1.8° out of sync with the drive signal. These motors are coupled to 36:1 gear reducers that allow them to develop 321 in.-lb of torque. The motors are computer controlled using the LabView graphical user interface and a proprietary driver to operate the mixing heads independently in a complete rotary mode or cause them to oscillate between any prescribed angles from any starting point. The angles over which the mixing heads oscillate can be synchronized or be made to have any desired phase angle between their respective motions. The commanded angular location of each mixing nozzle’s exit is recorded simultaneously with the other physical data obtained from the other instruments.
2.5.3 Main Pumps A Grundfos CR8 centrifugal pump mounted vertically on the bridge supplies flow to each of the two mixing heads. Two variable frequency drives (VFD) provide independent flow control to each mixing head. The selected pumps are able to supply the desired flow at sufficient pressures to operate the two nozzles mounted on each mixing head. Varying the motor speed from nearly 3600 rpm (the nominal operating speed) down to 900 rpm offers a substantial range of flow rate variations that should cover any mixing-jet exit velocity requirement. Two Toshiba magnetic flowmeters are mounted downstream of each of the pump-motor assemblies. These meters are regularly calibrated and are a part of the data acquisition system. They are set by the data acquisition system to ensure that identical flows are delivered to both mixing heads.
2.5.4 Local Slurry Density Measurements During system operation, continuous samples of the mixed slurry are extracted from several locations along the measurement radius. A peristaltic pump provides a constant flow of the mixed slurry to a precision Coriolis flow meter, whence the sample flow is returned to the mixing tank. This device is configured to provide recordable digital outputs of both mass flow rate and density of the mixture. In conjunction with the known characteristics of the two phases, the solids and the liquid, the local volume concentration can be calculated. The sampling probe is a length of 3/8-inch stainless steel tube with a ¼-inch internal diameter. The size of the internal diameter is selected to 1) permit enough upward flow velocity to minimize solids holdup in the sampling tube, 2) maintain a sufficient slurry transport velocity within the interior passages of the Coriolis flowmeter to avoid solids settling within those passages, and 3) ensure that the slurry velocity is not too high to cause serious erosion of the Coriolis flowmeter interior passages. The tube inlet is shaped to minimize entrance losses, and the tube is supported in a fixture that allows the inlet to be conveniently positioned within the tank working volume with the elevation of the inlet known to within ± ¼ inch and the radial position to within ±1/2 inch. A few locations are somewhat obstructed by the equipment bridge, but the probe arrangement provides for extensive detailed mapping capability of the slurry density distribution.

2.8
2.6 Data Acquisition System
The data acquisition unit is made up of a National Instruments FieldPoint system and a Windows NT-based computer. The FieldPoint system is composed of the FP-1000 RS-232 network module, two FP-AI-110 analog input modules, and one FP-TC-120 thermocouple input module. The FP-1000 performs the interface function between the FieldPoint system and the computer using the COM port. The FP-AI-110 modules provide eight channels of 16-bit analog input from ± 60 mV to ± 10 V each. The FP-TC-120 module provides eight channels of 16-bit thermocouple input or ± 25 mV to ± 100 mV differential input. Each module has built-in filters to quiet noisy signals, and together they provide the ability to sense and record four to 20 mA data down to data generated by bridge circuits, such as strain or pressure transducers. Used in conjunction with LabView software, these data can be displayed and recorded.
The mixing heads’ drive motors come with matched drivers that are controlled with National Instruments Open Loop Stepper Controller. The controller resides in the data acquisition computer, and LabView is used to program the drive functions. Because LabView is used for both control and data acquisition, it makes a seamless environment and facilitates the correlation between nozzle direction and sensor data.
2.7 Material Characterization and Experimental Preparations
The solid particles used in this experiment are small glass beads, and the liquid is city tap water having near-standard properties. The selected solids were Mil 10 Ballotini impact glass beads supplied by Potters Industries, Inc. These beads were chosen because of their small size and narrow size distribution, (99% are between 75 and 150 µm). They have a smooth surface and a nearly spherical shape. Examina-tion in our analytical laboratory indicated a void fraction of 55% and a specific gravity of 2.7. Another highly advantageous characteristic of these beads was that they contained very little free silica. Free silica and other minute particles had the effect of clouding the supernatant so that it became totally opaque during and after the experimental runs. By removing the free silica it was hoped that the fluid would remain relatively transparent, so that during the experimental runs the solids layer could be visually inspected. This added clarity is thought to enhance the detection process needed to determine the effec-tiveness of the mixing jets. Based on these physical data and starting, nominally, with a 1-ft-deep layer of settled solids at the bottom of the tank that is saturated with water, and a 1-ft-deep layer of supernatant liquid (water) on top of that, we can define and calculate the following solids and liquid characteristics:
ρ l = density of water at nominal laboratory conditions, 0.998 g/cc ρs = material density of the solid particles, 2.695 g/cc ρsbl = bulk density of the solid particles in liquid, 1.762 g/cc ρsba = bulk density of the solid particles in air, 1.213 g/cc fv = void fraction is 0.55 cc void/cc naturally packed volume of solid particles Cv = solids concentration by volume for a uniform mixture, 0.225 ρm = local density of the solid/liquid mixture, g/cc ρ = density when the solids and liquid are perfectly mixed, 1.3798 g/cc.
2.9
This information permits the specification of some bounds for the expected slurry density values that will be obtained experimentally during the measurement campaign. When the solids and supernatant liquid are perfectly mixed, the density of that uniform mixture will not exceed 1.3798 g/cc. However, it is possible that at some location an instantaneous mixture density value would be higher than 1.3798 during the recorded time series if the sampling tube inlet encounters a solids mass. These values cannot exceed the bulk solids density in water that is 1.762 g/cc. Most of the data will give mixture densities that are somewhat higher than 0.998 g/cc but well below 1.3798 g/cc.
All components of the experimental apparatus were checked routinely and frequently. These include the uniformity of the solids and liquid layer’s prescribed heights, the pump’s performances, instrumenta-tion and data acquisition system, the nozzles’ alignment in the mixing heads, and the desired oscillation pattern, whether it is synchronized or has a prescribed phase angle.
2.8 Experimental Procedures and Data Acquisition and Analysis
Initially, we started by submerging the two mixing heads in the solids bed such that the centerlines of the mixing nozzles’ discharge openings were all at Z = 10 inches and the main pump’s suction ports at Z ≈ 13 inches (see Figure 2.2b for the coordinate system). After elaborate priming procedures, and with the inlets of the suction ports piping systems submerged into the supernatant liquid, the main pumps were started and the mixing heads set into synchronized oscillatory motions. These motions were transmitted to the mixing heads through long shafts whose tops had holes with drive pins connected with special couplings to the two computer-controlled DC motors. Each coupling was machined from a single cylin-drical piece of steel, with one end designed to fit the keyed shaft of the DC gear motor and the other end drilled and slotted to accept the drive pin at the end of the motion transmission shaft. Unexpectedly, the drive pins were sheared off frequently, causing considerable delays to replace them. Finally, it was decided to weld the tops of the drive shafts to one end of the couplings. The drive pins could not with-stand the applied torque because seal friction inside the mixing heads increased markedly with internal pressure and with some solids contamination during the main pump operation. These seals were neces-sary to protect the bearings from the destructive effect of the solid particles if they were allowed to penetrate into their moving parts. The pin couplings were not properly designed for reversing loads of the magnitudes encountered in this application.
Another action taken to avoid work disruption was starting the oscillations of the mixing heads while the heads were only partially submerged in the solids bed. This provided a measure of safety against overloading the DC motors, which stopped operating when they encountered excessive torque. It was a good safety measure because the welded couplings were able to transmit considerably higher torque than the original drive pins were. After the mixing jets fluidized more of the solids in their vicinity, the mixing heads were lowered to their final location. Due to the timing variability of the events performed at startup for the various tests, we decided to indicate the times at which these events took place with symbols on the time series plots of the mixture density. The symbols and the corresponding events are as follows: main pumps brought up to operating speed mixing jets lowered to Z = 14 inch mixing jets lowered to Z = 12 inch mixing jets lowered to Z = 10 inch.

2.10
The starting procedures have evolved to follow this pattern: after a test, the bridge was raised until the mixing jets were clear of the solids layer. The main pumps were flushed by circulating supernatant liquid, which was then pumped off (removed from the tank). The solids bed was leveled and the water injected back into the solids bed with a ½-inch pipe lance. The solids bed was probed frequently but at random intervals to ensure that dips or mounds of solids were not being formed. When the water level was just short of its final target, the pumps were primed and the water level adjusted. The solids bed and liquid supernatant were allowed to stabilize for at least 12 hours (overnight) before the next test began. At the start of the next test, the mixing heads’ oscillation drives were programmed, started, and checked for proper operation. The data acquisition system was placed in operation, and the outputs from five instruments were recorded simultaneously: two magnetic flowmeters representing the outputs of the two main pumps, the mass flowrate and the density of the sampled local slurry stream that was being circulated through the Coriolis device, and the position indicators of the two mixing nozzles (only one mixing head’s phase angle was made to change). The main pumps were then started and their rotational speeds checked and adjusted to produce nearly identical flows. The bridge was lowered in 2-inch increments to the final test elevation. For the last test in this series, at a phase separation angle of 135 degrees, the bridge was placed exactly at its lowest position with the mixing jets at Z = 10 inches. This provided a qualitative measure of the effect of incrementally lowering the mixing heads on the time required for the mixing process to reach its final equilibrium state. An equilibrium condition was reached significantly sooner when the test was started with the heads fully lowered. There was some increased risk of mechanical failure in starting with the heads lowered due to added torque load on the rotation drive.
The system was first allowed to operate for a reasonable period of time to reach a stable operating condition. The conditions in the tank do not reach steady state (fixed local average mixture density over a sufficient number of oscillation periods) until most of the mixing and mobilization that would have taken place at a given configuration has already been achieved. The data acquisition system is then put into operation, and outputs are recorded from the two magnetic flowmeters, the Coriolis device, and the position indicator of the mixing nozzles. Throughout the test, the slurry-sampling probe was moved back and forth between two radial positions at about 1.5-minute intervals. All data were subsequently down-loaded into an Excel spreadsheet for further analyses and graphic representations of the results.
2.8.1 Data Collection Initially, the data were collected in a series of short files, one for each sampling location. This was changed early on to continually collecting data in one file but writing in a new heading at each change of sampling location. Although the mixing and mobilization processes were allowed to reach a measure of stability before data gathering began, the gathered data were still time dependent due to the periodicity introduced by the mixing nozzles’ oscillations. Figure 2.5 shows a typical density variation with time during the oscillations of the mixing heads. Clearly, the recorded value of the density is always time dependent, although it displays a relatively stable average. That would not have been true if the process were still in the developing stage.
Sets of reliable data were usually taken after the mixing operation had continued for a sufficient time and the slurry density appeared to reach equilibrium. Detailed vertical distributions of the local slurry densities were taken at radial sampling locations of 0, 15, and 30 inches from tank center. The sampling

2.11
0
20
40
60
80
100
120
140
160
180
0 20 40 60 80 100 120 140
Time, sec
Mix
ing
Hea
d A
ngul
ar P
ositi
on, d
egre
es
1.35
1.36
1.37
1.38
1.39
1.4
1.41
1.42
1.43
1.44
1.45
Inst
anta
neou
s Sl
urry
Den
sity
, g/c
c
Reference MixingHeadAdjustable MixingHeadInstantanousSlurry Density
Figure 2.5. Mixture Density Behavior at R = 0 in. and Z = 6 in. under Equilibrium Conditions; also shown are the angular positions of the mixing heads while 180° out of phase
probe inlet was moved vertically from an initial elevation of Z = 22 inches down to the solids bed surface in 2-inch increments. The number of Z values at which data were collected varied with radial location because of the uneven surface. This detailed survey was conducted for phase angles of 0 and 90 degrees.
In most cases, inserting the density probe into the settled bed would, if the bed were somewhat fluidized and the insertion gradual, result in distinctly higher density values. Quick insertion of the sampling probe into a settled bed caused a slug of solids to move up the suction tubing. At high solids loadings, external disturbances such as vibrations or solids settling in the occasionally convoluted sam-pling tube (partly flexible hose to accommodate variable positions) could also send a solids slug up the sampling tube. In all such situations the solids slug formation would jam the peristaltic pump and cause it to stall. A shot of clear water was usually sufficient to purge the pump. The second major series of tests was conducted in the same manner but with density data collected at only two radial locations, 15 and 30 inches. The data were gathered at only one elevation, Z = 14 inches, during the development of the mixing process (prior to reaching equilibrium conditions), then over a range of elevations as before when equilibrium had been reached.
2.8.2 Time Series of the Mixture Density
Sample recordings of the mixture density variations with time at equilibrium are shown in Figure 2.6. The sampling points for this figure were at a single height, Z = 14 inch, but two different radial locations, R = 15 and R = 30 inches, as indicated on the figure. During the actual tests, density data were taken with the sampling port at a constant elevation, Z = 14 inches, prior to reaching equilibrium. Samples were

2.12
1.2
1.22
1.24
1.26
1.28
1.3
1.32
1.34
2150 2200 2250 2300 2350 2400 2450
Time, sec
Inst
anta
neou
s D
ensi
ty, g
/cc
R = 15 in
R= 30 in
Figure 2.6. Mixture Density Behavior at Z = 14 in. under Equilibrium Conditions and
with 45°Phase Separation
taken at alternating radial locations of R = 15 and 30 inches. Hence the density plots (called time series) have “steps” at the times the sampling probe was moved, usually at 1.5-minute intervals. The assumption of stable equilibrium can be justified by the nearly constant average of both traces. When these traces are compressed in time, they appear as colored patches like those seen in Figures 2.7, 2.8, 2.9, and 2.10. The width of a color patch represents the sampling period over which the mixture density measurements were recorded, and the height represents the difference between the maximum and minimum values of the mixture density encountered during that period. Each one of these five mixture density time series represents the sequence of events that took place during the test at that particular time phase separation, as detailed in the following paragraphs. Figure 2.7 illustrates the sequence of events that took place during the test runs at phase angle separa-tions of 180 degrees. The pump motors were started at low rpm at t = 0 seconds, and their speeds gradu-ally increased until nominal flows from the two pumps were reached at t = 845 seconds. The mixing jets were initially 15.5 inches above the tank floor and the sampling tube inlet at Z = 14 inches. The mixing nozzles reached their final locations above the tank floor, Z = 10 inches, at about t = 1730 seconds. While the mixing heads were lowered, the mixture density was monitored at a single radial location, R = 0 inch, and a fixed elevation, Z = 14 inches. Afterward, samples were taken periodically, moving between the two radial locations, as indicated by the colored patches, until equilibrium conditions were established. Starting at about t = 3700 seconds, mixture density data were collected at three radial locations and several elevations from an initial value of Z = 22 inches, 2 inches below the liquid’s free surface, then lowered in 2-inch increments to the surface of the settled solids. The sampling tube was moved manually in the radial direction along a special track and in the vertical direction by raising or lowering it in its own guide tube. When mixture density values increase with increasing time, it means that the sampling tube is being lowered from a position in or near the pure liquid region and into the solids bed.

2.13
0.9
1
1.1
1.2
1.3
1.4
1.5
1.6
0 1000 2000 3000 4000 5000 6000Time, sec
Slur
ry D
ensi
ty, g
/cc
Figure 2.7. Instantaneous Mixture Density with 180-Degree Phase Lag Between Mixing Nozzles
An observed sharp density increase indicates that the sampling tube has reached a region where solids predominate, or very near the solid/liquid interface. At that time the sampling tube is pulled up to its initial location, 2 inches below the liquid surface, and moved to another radial location in preparation for another density sampling run. For these phase angle separations, testing at the first radial location took place from t = 3400 seconds to t = 4370 seconds, the second radial location from t = 4370 seconds to t = 5170 seconds, and the third radial location from t = 4370 seconds to t = 5170 seconds. The other mixture density time series shown in Figures 2.8, 2.9, and 2.10 shows similar behavior except for some unique features, as described below. In Figure 2.8, for instance, at the phase angle separation of 45 degrees, one of the two main pumps, #2, had its intake port partially blocked by a piece of tape that had been securing one of the tank’s depth scales. This event took place at about t = 1000 seconds, and normal pump operation was restored at about t = 1700 seconds. Also, in the test with 135-degree phase separation (Figure 2.10), only raising the pump speed to the operating level that generates ~30 gpm per pump is marked on the figure. For this test the mixing jets were fully deployed at their final height prior to the starting time rather than lowered gradually as in the other tests.
One aspect of mixing performance that is of great interest is the time required for a given configura-tion to bring the mixture to equilibrium. These raw data are pictured in Figures 2.7, 2.8, 2.9, and 2.10 and suggest some interesting behavior and insights into this phenomenon. Further study will be required to draw any useful conclusions.

2.14
0.9
1
1.1
1.2
1.3
1.4
1.5
1.6
0 1000 2000 3000 4000 5000 6000
Time, sec
Slur
ry D
ensi
ty, g
/cc
Figure 2.8. Instantaneous Mixture Density with 45-Degree Phase Lag Between Mixing Nozzles
0.9
1
1.1
1.2
1.3
1.4
1.5
1.6
0 1000 2000 3000 4000 5000 6000
Time, sec
Slur
ry D
ensi
ty, g
/cc
Figure 2.9. Instantaneous Mixture Density with 90-Degree Phase Lag Between Mixing Nozzles

2.15
0.9
1
1.1
1.2
1.3
1.4
1.5
1.6
0 200 400 600 800 1000 1200 1400 1600 1800 2000
Time, sec
Slur
ry D
ensi
ty, g
/cc
Figure 2.10. Instantaneous Mixture Density with 135-Degree Phase Lag Between Mixing Nozzles
2.8.2 Data Analysis
These data are presented for qualitative comparison only. To perform a rigorous evaluation of the impact of jet phase relationship on the speed of mixing will require much more consistent control of the timing of the various events such as pump starting and acceleration rate and the lowering of the mixing heads in the solids bed. In the current test program, these events were performed manually and were difficult to execute consistently and at the proper times. Planned improvements in the apparatus and in the operating procedures will ensure better quality data from future studies.
The first sets of data were collected after the mixing jets had operated at their nominal height for at least 30 minutes. A detailed survey of the slurry density values along a diameter perpendicular to that containing the mixing heads was carried out at R = 0, 15, and 30 inches. The sampling tube opening was held at the first radial position, R = 0 inch, that is, at tank center, and was moved incrementally down from 2 inches below the water surface, Z = 22 inches, to well below the solids layer initial surface, Z ≈ 4 to 6 inches, for about 2 minutes of sampling at each elevation. The probe was then lifted and moved to the second then the third radial location. The purpose of these survey tests was to ascertain the appro-priate number of radial locations at which vertical slurry density distributions should be obtained to satisfactorily characterize the effect of phase angle separations on mixing and mobilization.
Figure 2.11a shows data at 180° phase angle separation (identical to that at 0°) and indicates little dependence of the slurry density on radial location except near the free surface of the supernatant liquid. Figure 2.11b shows data at 90° phase angle separation. Some radial dependence can be easily seen. The

2.16
1
1.1
1.2
1.3
1.4
1.5
1.6
0 2 4 6 8 10 12 14 16 18 20 22 24
Z, inch
Ave
rage
Slu
rry
Den
sity
, g/c
c
0
0.01
0.02
0.03
0.04
0.05
0.06
Mea
sure
men
t Sta
ndar
d D
evia
tion,
g/c
c
Measured DensityR = 0 inR = 15 inR = 30 inStandard DeviationR = 0 inR = 15 inR = 30 in
Figure 2.11a. Average Mixture Density with 180-Degree Phase Lag Between Mixing Nozzles
decision was made to gather data at only two radial locations, R = 15 inches and R = 30 inches, and to use the average of the two measured vertical slurry density distributions to represent the character of that vertical distribution at that particular phase angle separation.
1
1.1
1.2
1.3
1.4
1.5
1.6
0 2 4 6 8 10 12 14 16 18 20 22 24Z, inch
Ave
rage
Slu
rry
Den
sity
, g/c
c
0
0.01
0.02
0.03
0.04
0.05
0.06
Mea
sure
men
t Sta
ndar
d D
evia
tion,
g/c
c
Measured Density
R = 0 in
R = 15 in
R = 30 in
Standard Deviation
R = 0 in
R = 15 in
R = 30 in
Figure 2.11b. Average Mixture Density with 90-Degree Phase Lag Between Mixing Nozzles

2.17
Average slurry density distributions measured along lines extending vertically from the tank floor at two tank radial locations, R = 15 and R = 30 inches, are shown in Figure 2.12. The observed results were consistent, showing that 1) the slurry densities at the larger radius, R = 30 inches, were always higher than those at the smaller radius, R = 15 inches; and 2) two characteristically different behaviors of the mea-sured slurry densities start at elevation Z ≈ 8 inches, which is the mixing nozzles’ operating height. For values of Z ≥ 8 inches, the slurry densities decrease gradually as the sampling point is elevated, until a slurry density value of near unity is reached near the free surface of the supernatant liquid at Z = 22 in. Few solid particles would be found suspended in this region. If we consider an average slurry density, ρm = 1.05 g/cc, the solids volume concentration would be Cv = 0.03, far less than the homogeneous con-centration of Cv = 0.225. For values of Z ≤ 8 inches, the slurry densities increase more or less abruptly as the sampling point is lowered toward the tank floor, until slurry density values of ρm = 1.5 g/cc are measured at Z = 4 inches. At this mixture density value, the solids volume concentration becomes Cv = 0.295, well above the homogeneous mixture concentration of Cv = 0.225.
Attempts at keeping the supernatant liquid sufficiently clear to allow for periodic visual observation of the solids surface topography have never succeeded. The supernatant liquid becomes increasingly murkier with time, and visual observations are not possible. As a substitute, a smooth, square, flat metal piece was attached perpendicular to a wooden post, producing an effective solids surface feeler. The feeler was used to probe the surface of the solid particles below the supernatant liquid.
1
1.1
1.2
1.3
1.4
1.5
1.6
0 5 10 15 20 25
Z, inch
Ave
rage
Slu
rry
Den
sity
, g/c
c Density at R=15 inTheta = 45 degTheta = 90 degTheta = 135 degTheta = 180 degDensity at R=30 inTheta = 45 degTheta = 90 degTheta = 135 degTheta = 180 deg
Figure 2.12. Summary of Slurry Density Variations with Phase Angle at Two Radial Locations

2.18
As Figure 2.12 shows, there is a clear distinction between the mobilized solids and the nearly static bed, represented by the abrupt “knee” in slurry density measurements as the sampling probe approaches the tank floor. The elevation of the static bed interface above the tank floor is not generally constant even along the diameter over which samples were taken. Probing with the metal feeler at shutdown and obser-vations made after draining off some of the supernatant liquid reveal that the bottom can have dune-like features with up to six inches of elevation difference between points on the settled solids surface. Some of this topography may be an artifact of the local density variation of the suspended slurry at the time the pumps are stopped—the suspended solids settled quickly to form mounds where the concentration was highest—and some may be due to erosion near the mixing jets. We don’t know much about the time-dependent behavior of these dunes except that, according to visual observations, they can form in the time it takes the suspended mixture to reach equilibrium. The density distribution is qualitatively similar for all tested conditions at elevations above the solids/liquid interface, but the density values are consistently higher near the wall, R = 30 inches, than near tank center, R = 15 inches. Direct observations through the clear floor during a preliminary run at equilibrium (no data logging) showed that the solids were periodically suspended all the way to the tank floor near the wall in the vicinity of the jet heads, but the settled bed remained fairly level at an elevation slightly below the heads over most of the tank floor. Intermittent flow was visible in an area of the floor extending up to 8 inches radially from the wall, wider near the jets, and tapering to zero near the midpoint between mixing head positions. In addition, during most tests the solids appear to form a ridge along an axis normal to that along which the mixer heads are located and parallel to that along which the sampling tube moved. The effect of that ridge on the density distribution is not clear.
During the next test series, the data logging was started before the pumps reached their full operating speed, and slurry density data were taken at only two radial locations, R = 15 inches and R = 30 inches, alternating between the two at about 1.5-minute intervals. When the system had reached equilibrium, a more detailed survey was taken at the two radial locations, with sampling taking place at 2- to 4-inch intervals from Z = 22 inches (2 inches below the water surface) down to the local solids-liquid interface. The height of the lowest sample point depended on the local elevation found for the interface.
A pattern of slurry density behavior appears to emerge based on the data shown in Figure 2.13. The 90-degree phase angle separation between the two mixing heads clearly gives superior mobilization per-formance by maintaining a higher slurry density for elevations Z ≤ 8 inches, which is the elevation of the mixing nozzles. It appears that the 90-degree phase angle separation delays the settling process of the solid particles, keeping them suspended just above the settled bed. As the elevation increases, a detect-able variation in the slurry density for the various phase angle separations can also be observed at some elevations (Figure 2.13), but the difference is not significant at elevation Z >8 inches. As a summary of results, Figure 2.14 gives a simple average of the slurry density data at all elevations and for each phase angle. For the Z >8-inch curve, the plot omits the slurry density data for Z ≤8 inches from the calculation of the average to isolate any influence on the sampling probe output as a result of being near a “dune” at the surface of the solids layer. Figure 2.15 compares the density change from a baseline of ρ l = 0.998 g/cc according to the following definitions:
Absolute change lρρδ −= ma
Fractional change l
l
ρρρ
δ−
= mf

2.19
1.00
1.10
1.20
1.30
1.40
1.50
1.60
0 45 90 135 180
Phase Angle Between Mixing Heads, Theta, deg
Ave
rage
Slu
rry
Den
sity
, g/c
c
R=15 Z=6
R=30 Z=6
R=15 Z=8
R=30 Z=8
R=15 Z=10
R=30 Z=10
R=30 Z=12
R=15 Z=14
R=30 Z=14
R=15 Z=18
R=30 Z=18
R=15 Z=22
R=30 Z=22
Figure 2.13. Average Density at Equilibrium
1.00
1.10
1.20
1.30
1.40
1.50
1.60
0 45 90 135 180
Phase Angle Between Mixing Heads, Theta, deg
Ave
rage
Slu
rry
Den
sity
, g/c
c
Average byPhase for allZAverage byPhase forZ>8
Figure 2.14. Average Slurry Density Change

2.20
0.00
0.05
0.10
0.15
0.20
0.25
0.30
0.35
0 45 90 135 180
Phase Angle Between Mixing Heads, Theta, deg
Incr
ease
in A
vera
ge D
ensi
ty, g
/cc
1.00
1.05
1.10
1.15
1.20
1.25
Rel
ativ
e D
ensi
ty C
hang
e
Average Density Increase for all Z Average Density Increase for Z>8Relative Density Increase for all Z Relative Density Increase for Z>8
Figure 2.15. Absolute and Relative Slurry Density Change
The range of variation in the average slurry density over the whole tank cross-section was less than 1% for Z >8 inches. If data from Z ≤8 inches are considered, the percent variation in slurry density is
%5100/1min
minmax =
−
∆∆−∆
, and the variation in the density increase is
%24min
minmax =
∆
∆−∆ . These are significant changes.
2.9 Conclusions and Recommendations for Future Work The research conducted to date has shown a positive correlation between the density of mixed media within a range of elevations near the mixing jets and the phase relationship of the mixing jet rotation. This phenomenon could prove very useful for planning operation of mixers in situations where rapidly settling particles compose a significant fraction of the waste.
Most of the data presented are qualitative in nature. To perform a rigorous evaluation of the effect of mixing jet phase relationships on the speed of mixing and the effectiveness of mobilization will require additional efforts to map and probe larger areas of the tank surface. Many improvements must be made to the experimental procedures based on the experience gained in this first attempt at the task. More consis-tent control over the timing of events and closer geometrical similarity to the actual mixing tanks would enhance the quality of the experimental results. Planned improvements in the apparatus will enable us to study these phenomena in a more quantitative way in the future.
3.1
3.0 Mixer Pump Operational Improvement—Nozzle Orientation The desire to find methods and procedures to improve the operation of the baseline mixer pumps derives from the availability of a large number of such pumps at SRS and the desire to use them in the best way possible instead of considering alternatives. In this section we evaluate the manufacturer’s modification that was made to the Lawrence mixer pump to allow it to meet the purchaser’s specifications.
3.1 Introduction The inability of the original mixer pumps to meet the 600-gpm per mixing nozzle requirement speci-fied by SRS in the purchase agreement with the pump vendor prompted a practical fix. The original geometry of the pump included two radially oriented mixing nozzles that were attached to the perimeter of the pump casing (the volute) via two small-radius 90-degree elbows. The considerable pressure losses due to the high-speed flow through these elbows prevented the pump from supplying the specified flow-rate to the mixing nozzles. The manufacturer modified that geometry by removing the 90-degree elbows, giving the nozzles a tangential discharge direction relative to the pump periphery instead of the original radial discharge. No consideration was given to the impact of this modification on the mixing and mobil-ization effectiveness of the mixer pump. We determined how the overall mobilization performance of the Lawrence mixer pump changed from the radially oriented mixing jets operating at a discharge rate of less than 600 gpm to the tangential mixing jets operating at the specified discharge rate of 600 gpm.
3.2 Experimental Facilities The tank acquired for the mobilization tests, as seen in Figure 3.1, is 6 ft in diameter and 54.5 inches deep. The tank has a clear acrylic bottom, which allowed visual inspection of the sludge to determine whether the mobilization jets had cleared the sludge off the bottom of the tank. The tank had graduation marks in inches every 120 degrees around the tank’s interior wall and was mounted on a stand of 2- by 12-inch wood, which in turn sat on a level concrete floor. Mounted on top of the tank was a UNISTRUT frame that was 1 x 2 x 7 ft and made of 1-5/8-inch UNISTRUT beams. The UNISTRUT frame was centered over the tank and supported most of the other equipment.
To test the different nozzle configurations, a nozzle assembly was designed that would allow tan-gential and radial nozzles of various diameters to be installed. It was built of stainless steel and was 5 inches in diameter and 5 inches long. Every 90 degrees around the circumference of the assembly were locations to attach nozzles at mid-height. Either a nozzle or a blank plug could be attached at each of these locations. Nozzles of three sizes, 1/8 inch, 1/4 inch, and 3/8 inch, were built for testing in both radial and tangential configurations. The nozzle assembly was suspended from two concentric stainless steel tubes, a 1-inch-diameter tube within a 2-inch diameter tube. The slurry pump suction port was connected to the 1-inch tube, and the discharge port pumped back the slurry down the annulus and out the mixing nozzles. Figure 3.2 is a diagram of how the assembly fit together.

3.2
Slurry Inlet from Pump Discharge
To Slurry Pump from Main Intake
To SlurryPump fromAuxiliaryIntake
Tank Support12”
12”
54”
6”18”
Main Intake
Maximumand minimumNozzle Heights
Auxiliary Intake
Supporting Frame
Mixing HeadOscillation Drive
Mixing Head
Figure 3.1. Mixing Tank and Oscillating Mechanism of the Mixing Head
Like the SRS mixer pumps, the nozzle assembly was capable of rotating about its own axis in com-plete circles or oscillating over prescribed arc lengths. By doing so the jets produced by the nozzles could be made to sweep the entire tank. To achieve this rotation, the 2-inch stainless steel tubing that supported the nozzle assembly was attached to a Boehm DC motor through a 3:1 gear reduction assembly. The motor and the 2-inch tubing were supported by the UNISTRUT frame, and the 2-inch tubing was centered over the tank, as shown in Figure 3.1. The arrangement of the supporting pipes would not allow the nozzle assembly to rotate the full 360 degrees. A specially designed controller was connected to the DC motor and caused the nozzle assembly to change rotational direction every 180 degrees. The controller also incorporated a variable frequency drive (VFD) by which the rotational speed of the nozzle assembly could be varied from 0 to 8 rpm. The 2-inch tube, which supported the nozzle assembly, was connected to an adapter, which allowed for 1-inch hose connections to the annulus and to the 1-inch center tube. A high-pressure, 1-inch flexible hose was then connected from the annulus to the discharge line of the pump, and the 1-inch center pipe was connected to the suction line of the pump. These flexible hoses made it possible to connect the rotating nozzle assembly to the stationary pump.

3.3
4.5”
4.0”
4.5”
1.75”
2.25”
.5”
4 Openingsfor Nozzle
Plugs AroundCircumference,
90° Apart
2” Schedule 80Stainles SteelSeamless Pipe 304
O-Ring
1.25”
5.0”
1” Schedule 80Stainless SteelSeamless Pipe 304
Slurry Flow toPump Suction
Slurry Flow fromPump Discharge
Figure 3.2. Mixing Head Nozzle Assembly
The flow was supplied by a Series C GRUNDFOS eight-stage centrifugal pump that was mounted alongside the tank. One-inch carbon steel piping connected the pump to the flexible hoses on both the suction and discharge sides. A flow control valve was installed on the discharge side to regulate the flow. A bypass system was also installed between the pump discharge and the hose to allow the pump to be operated independent of the nozzle assembly. This was very helpful when priming the pump and for removing solid particles that could settle in the pump during shutdown.

3.4
3.3 Instrumentation and Measurement Methods A Toshiba LF400 electromagnetic flowmeter was installed on the discharge side of the pump. It was supported by the UNISTRUT framework between the flow control valve and the flexible hose. The flow-meter used electromagnetic transmissions to measure the flow rate nonintrusively. To verify that its readings were accurate before and after the experiment, water was pumped through the flowmeter and into a 55-gallon drum placed on a scale. By checking the weight and the volume of the water in the 55-gallon drum after a given amount of time to allow the flow to reach steady state, it was possible to confirm the readings. It was found that the flowmeter typically reported values that were about 0.15 gpm higher then the actual value. Even though the flowmeter wasn’t perfect, we decided to continue using the data it produced. The data collected during the flowmeter calibration are given in Appendix A. Two different processes were used to quantify mobilization in the tank. The first method was to take samples of the slurry from different depths and locations while the mixing nozzles were operating. The slurry sample was placed in a graduated cylinder where the solid particles would slowly settle to the bottom. Because the void fraction of the solids was known, the ratio of solids to supernatant could be obtained. By taking samples from various locations, one could roughly estimate the average solids percent that was mobilized in the supernatant after a given operating time. The samples were removed from the tank by a peristaltic pump, which removed slurry at a rate of 0.8 liters per minute. The suction line of the peristaltic pump was a vertical 3/8-inch stainless steel tube through which samples could be extracted from the tank at any depth or location. The peristaltic pump pulled the slurry vertically for nearly 4 ft. During this vertical travel the slurry components, sand and water, moved at different rates due to the slip velocity. Slip velocity exists due to the difference in density between the two materials. The sand upward flow lagged slightly behind the water upward flow due to gravitational pull, creating what is normally called “solids holdup.” This difference in flow rates caused the samples to have solids-to-supernatant liquid ratios slightly lower than what was actually in the tank. Because this problem affected all tests equally and conclusions would be based on data comparisons, not on absolute values, the slightly lower ratio was not a problem. The other method of data gathering was somewhat subjective and was done by comparing the patterns of accumulated solids at the solid-liquid interface while the mixing nozzles were operating and after they stopped. The slurry jets produced by the mixing nozzles were not powerful enough to suspend all of the solids under the supernatant liquid. As a result, during mobilization, a quantity of settled solids having a particular topography remained. By comparing the geometrical patterns of the unmobilized solids, it was possible to determine which nozzle configuration kept more solids in suspension and which one cleared solids from a larger area.
3.4 The Test Materials The tank was filled with a layer of solids with a supernatant liquid layer above it. This experiment was a relative study in which materials that approximately simulated the waste in the storage tanks were sufficient. Thus quartz sand was chosen to represent the solid particles, and water was used as the super-natant. Sand and water were used because they are non-toxic, cheap, and readily available. The water was city tap water, which was assumed to have the standard properties of water. The chosen solids

3.5
material was 70-grade sandblasting sand supplied by the Unimin Corporation. This sand was selected because of its small average size (100% <500 µm, 54% between 150 and 250 µm), its roughly spherical shape, its void fraction of 50%, and its specific gravity of 2.8. A complete list of its properties is given in Appendix B. One undesirable characteristic of the sand was the large amount of fine particulate it contained. When mixed with water, the sand clouded the water, gave it a milky color, and made visual observation difficult. It was desirable to keep the liquid relatively clear so that during the experimental runs the solid particles could be observed visually. To remove these small particles from the sand, we developed a washing procedure that removed about 50% of the fine particulate matter that came with the sand. If more time had been available he percentage could have been increased to 100%. After the sand was washed it was placed in the mixing tank. The washing process is described in Appendix C.
3.5 Experimental Procedures Ideally, the mixing nozzles would mobilize all the sand in the tank and mix it with the supernatant liquid to form a homogenous mixture. The peristaltic pump would be used to determine when all the solids were mobilized, and the performance of the different nozzles could then be compared by deter-mining how long it took them to achieve complete mixing. Tests were first run using a tank composed of an 18-inch solids layer and an 18-inch supernatant layer for a total depth of 36 inches. However, the initial results showed that this was a very optimistic expectation. Appropriate changes were made accordingly (see Section 4.9), and new test plans and data acquisition procedures were implemented.
3.6 Data Acquisition Procedures To compare the mixing effectiveness of the radially and tangentially oriented mixing nozzles, 12 tests were carried out. Operating conditions that were changed included the rotational speed of the mixing nozzle assembly and sampling locations. Other variables such as nozzle size, height above tank bottom, and the solids-to-liquid ratio could also have been varied, but time and resources limited us to tests in which we varied only the mixing nozzle assembly’s oscillation frequency, the nozzle orientation, and the sampling location. In some cases, however, the volume flow rate, which directly affects the mixing jet discharge velocity, was increased to observe the surface wave patterns that seemed to vary significantly with the oscillation frequency and nozzle orientation. The mixing nozzle assembly had two nozzles, each with a one-quarter-inch exit diameter and a centerline positioned 6 inches above tank bottom. The oscillation controller changed direction every 180 degrees, so the mixing jets swept over the entire tank during every oscillation cycle. The sand-water mixture consisted of a 12-inch-high sand bed with supernatant liquid occupying an additional 8 inches, so the total mixture in the tank was 20 inches high. Using the formula
where C = volume concentration
VF = void fraction Vsolids = bulk volume of solids
( )slurry
solids
VVVFC −
=1100%

3.6
Vslurry = total volume of the mixture, the percent solids volume concentration in the slurry was determined. In these tests the solids volume concentration was 30% when the mixture was completely homogeneous. Samples of the supernatant liquid were taken during mobilization at mid-radius and at the edge of the tank. The percent of solids in the supernatant liquid (volume concentration) was found for each of these samples, and from the average concentration the percent of mobilized solids was estimated. This value was used to determine which nozzle was more effective at mobilizing the solids. For more information consult Appendix C, which contains a complete list of the tests that were run, and Appendix D, which describes the test procedure.
3.7 Qualitative Results The mixing nozzles were not effective in mixing the sand with the supernatant liquid under the operating conditions of these tests. Although discharge velocity of the nozzles was over 100 ft/sec, the majority of the solids remained undisturbed or just moved away. The solids below the mixing nozzles’ axes were almost totally unaffected by the jets, and most of the solids above the mixing nozzles’ axes were gradually pushed out toward the edge of the tank beyond the reach of the jets. This is a good illustration of the consequences of combining low mixing jet momentum (total flowrate of 32 gpm for both nozzles) and relatively large specific gravity solids, 2.8 in this case. In Figure 3.3, three undisturbed solids contours are shown that were obtained by probing with a suitable “feeler” during nozzle operation.
Water Level 36”
OriginalSand Level 18”
12” to Nozzle Axis
Water Level 36”
OriginalSand Level18”
Water Level 36”
OriginalSand Level18”
Slow Oscillations<1 RPM
6” to Nozzle Axis
Rapid Oscillations
Sand
Water
Sand
Water
Sand
Water
6” to Nozzle Axis
Figure 3.3. Three Different Solids Contours that Resulted from the Operating Conditions
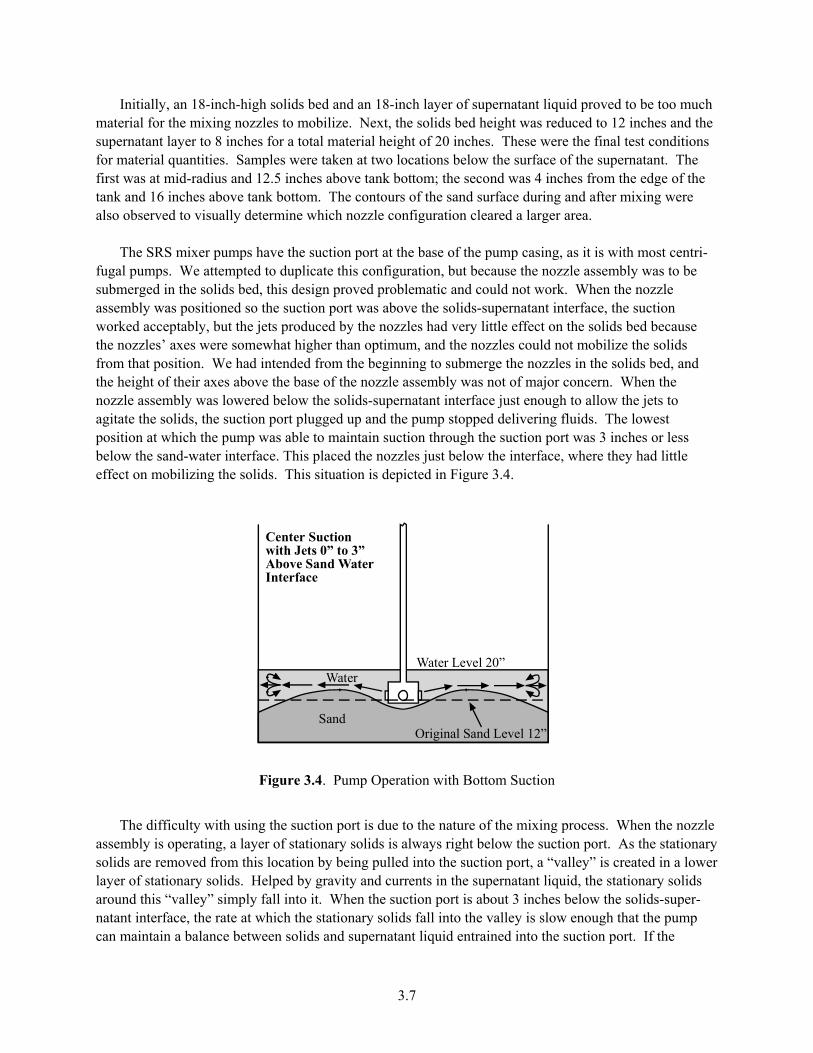
3.7
Initially, an 18-inch-high solids bed and an 18-inch layer of supernatant liquid proved to be too much material for the mixing nozzles to mobilize. Next, the solids bed height was reduced to 12 inches and the supernatant layer to 8 inches for a total material height of 20 inches. These were the final test conditions for material quantities. Samples were taken at two locations below the surface of the supernatant. The first was at mid-radius and 12.5 inches above tank bottom; the second was 4 inches from the edge of the tank and 16 inches above tank bottom. The contours of the sand surface during and after mixing were also observed to visually determine which nozzle configuration cleared a larger area. The SRS mixer pumps have the suction port at the base of the pump casing, as it is with most centri-fugal pumps. We attempted to duplicate this configuration, but because the nozzle assembly was to be submerged in the solids bed, this design proved problematic and could not work. When the nozzle assembly was positioned so the suction port was above the solids-supernatant interface, the suction worked acceptably, but the jets produced by the nozzles had very little effect on the solids bed because the nozzles’ axes were somewhat higher than optimum, and the nozzles could not mobilize the solids from that position. We had intended from the beginning to submerge the nozzles in the solids bed, and the height of their axes above the base of the nozzle assembly was not of major concern. When the nozzle assembly was lowered below the solids-supernatant interface just enough to allow the jets to agitate the solids, the suction port plugged up and the pump stopped delivering fluids. The lowest position at which the pump was able to maintain suction through the suction port was 3 inches or less below the sand-water interface. This placed the nozzles just below the interface, where they had little effect on mobilizing the solids. This situation is depicted in Figure 3.4.
Water Level 20”
Original Sand Level 12”Sand
Water
Center Suctionwith Jets 0” to 3”Above Sand WaterInterface
Figure 3.4. Pump Operation with Bottom Suction
The difficulty with using the suction port is due to the nature of the mixing process. When the nozzle assembly is operating, a layer of stationary solids is always right below the suction port. As the stationary solids are removed from this location by being pulled into the suction port, a “valley” is created in a lower layer of stationary solids. Helped by gravity and currents in the supernatant liquid, the stationary solids around this “valley” simply fall into it. When the suction port is about 3 inches below the solids-super-natant interface, the rate at which the stationary solids fall into the valley is slow enough that the pump can maintain a balance between solids and supernatant liquid entrained into the suction port. If the

3.8
suction port is too low, the solids fall into the valley faster then the pump can remove it through the suction port, and eventually the ratio of supernatant to solids entering the suction port goes to zero. An attempt was made to backwash the suction line before starting the pump to enlarge the valley, but the layer of stationary solids quickly fell into the valley and began to plug the pump. Because the suction port did not work in the locations where the mixing nozzles were most effective, it was necessary to establish a secondary suction port that pulled fluid from above the solids-supernatant interface while the nozzles were under the interface. The secondary suction was 12.5 inches above the tank bottom (one-half inch above the solids-supernatant interface) and 10 inches radially from the center of the tank. When the tests were started, only about 50% of the fine particulate matter had been removed by washing. This made the supernatant somewhat cloudy, so visual inspection during mixing was difficult. The murky nature of the water was augmented by the action of the slurry eroding the carbon steel pipes. As the tests continued, the solids, composed of silica sand, scoured the inside of the pipes and the hoses. This scouring not only weakened the pipes but added the resulting fine particles to the tank. Where the supernatant had been cloudy and visual inspection difficult, it was now filled with minute particles of rubber, grease, and steel, and soon it became impossible to observe the sludge during mobilization. After each test run, we removed the supernatant liquid and found that a new layer of fine black particles had been deposited on the sludge. There were also rust and small metallic shards with the fine particles. We expected that the sludge would scour the components of the apparatus, but we were surprised at how quickly the sand did it. After the sixth test run, the mobilization pump had to be replaced because one of the impellers was damaged. The sludge quickly eroded away the inside of the radial nozzles, so after a few tests the nozzles disintegrated and had to be replaced. The tangential nozzles, which had ninety-degree bends in them, only had a working life of about twenty minutes before the sand wore through the bend (Figure 3.5) and changed the jet stream back to an essentially radial orientation. Thus data for the tangential nozzles could only be obtained during the first few minutes of operation.
Figure 3.5. Tangential Nozzle Inserts at Various Stages of Erosion at the 90-Degree Bend

3.9
3.8 Nozzle Evaluation
3.8.1 Radial Nozzles
Tests with the radial nozzles were started with solids packed 12 inches deep and the nozzles em-bedded 6 inches into the solids. The oscillations were run at two speeds, 3 rpm and 6 rpm. Samples were taken at the mid-radius and at the edge, as described in Section 3.3. When the mobilization pump was first started, large amounts of solid particles were suspended and mobilized within the supernatant and pushed away from the nozzle assembly by the jets. Once the high-density slurry traveled far enough away from the nozzles the solids began to settle out, depositing once again on the stationary sand bed, this time near the tank wall. A nearly parabolic-shaped valley was created, as shown in Figure 3.6. After this initial redistribution of the solids was completed, the system nearly reached the steady-state condition. During this steady-state operation, the percent of mobilized solids in the agitated supernatant liquid remained small and relatively constant.
Typical MixingConfigurationDuring DataCollection
6” to Nozzle
Water Level 20”OriginalSand Level 12”
Sand
Water
Figure 3.6. Typical Mixing/Mobilization Pattern During Radial Mixing Nozzle Operation
The local depth of the settled layer of solids was determined by lowering a measuring device to the solids-supernatant interface to determine the depth of the supernatant liquid cover. Because the overall depth of the mixture remained at 20 inches, subtracting the depth of the supernatant from the total depth resulted in the thickness of the sand bed. Figure 3.7 shows a typical plan view of the surface pattern of the settled solids for 3 and 6 rpm. When the mixing jets oscillate over an arc that is less then 180°, they create the angular notches seen at the edge of the paraboloid and at the top and bottom of the diagrams.
Data taken by the peristaltic pump/sampling tube system shows that after an initial transitional period the volume percent of the mobilized solids in the supernatant liquid averaged about 10%, then slowly decreased with time, as shown in Figure 3.8. When the mixing nozzle assembly was rotated at 6 rpm the volume percent of mobilized sand was greater for about thirty minutes, but as time passed the same amount of sand was mobilized as the 3-rpm rotation case. The percent of mobilized sand gradually decreased with time and would probably have reached a stable value at long times due to the solids being pushed outside the range of influence of the mixing jets.
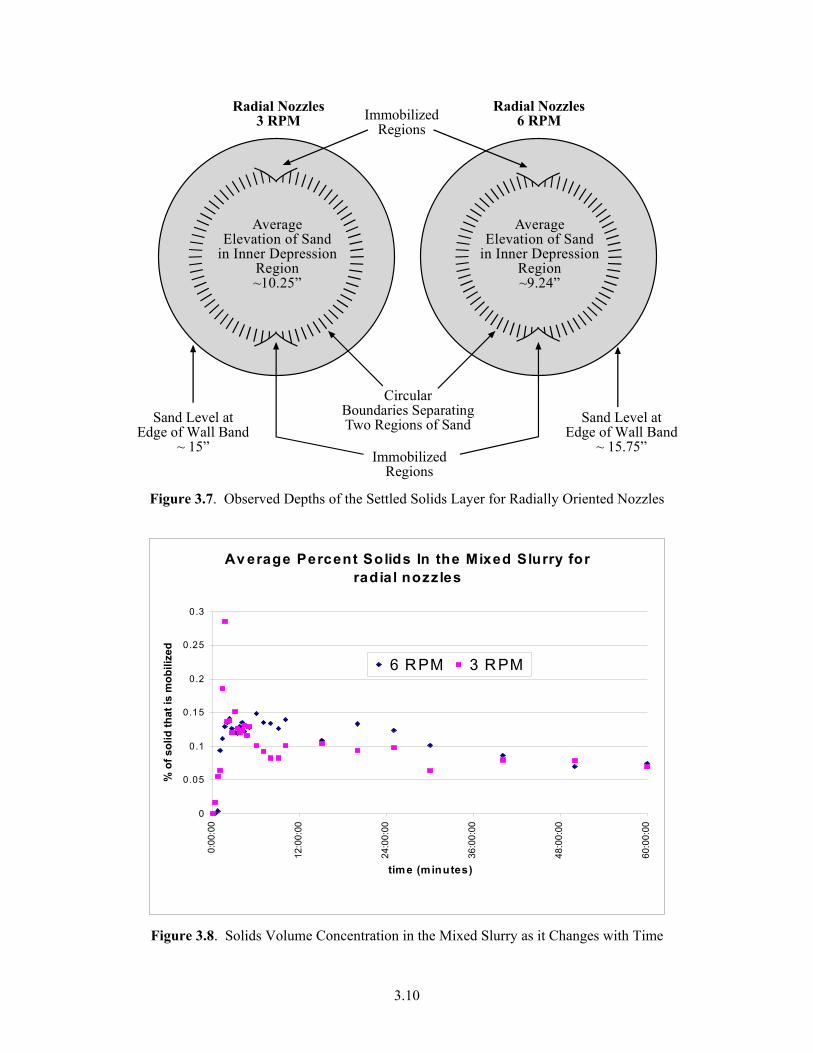
3.10
AverageElevation of Sand
in Inner DepressionRegion~10.25”
CircularBoundaries SeparatingTwo Regions of Sand
Radial Nozzles3 RPM
Radial Nozzles6 RPM
AverageElevation of Sand
in Inner DepressionRegion~9.24”
ImmobilizedRegions
ImmobilizedRegions
Sand Level atEdge of Wall Band
~ 15”
Sand Level atEdge of Wall Band
~ 15.75”
Figure 3.7. Observed Depths of the Settled Solids Layer for Radially Oriented Nozzles
Av erage Percent Solids In the Mixed Slurry for radial nozzles
0
0.05
0.1
0.15
0.2
0.25
0.3
0:00
:00
12:0
0:00
24:0
0:00
36:0
0:00
48:0
0:00
60:0
0:00
time (minutes)
% o
f sol
id th
at is
mob
ilize
d
6 RPM 3 RPM
Figure 3.8. Solids Volume Concentration in the Mixed Slurry as it Changes with Time

3.11
3.8.2 Tangential Nozzles The tangential nozzles, like the radial nozzles, had the effect of throwing the sand out toward the tank edge, but they also created more currents in the supernatant liquid. Typical mixing formed a parabolic-shaped valley, with the unmobilized sand looking like what was found during the radial nozzles tests but with ridgelines apparently caused by the currents. There were also no angular notches for less than 180° arc oscillations, where the oscillations of the nozzles switched directions like they did in the tests with the radial nozzles. The currents carried the fluid in a clockwise direction. This added velocity of the fluid aided in maintaining more solids in suspension. Figure 3.9 shows how the undisturbed layer of solids appeared visually. It was similar in size and shape to the radial pattern, but the layer was two inches deeper at the outside edge and two inches shallower in the middle.
~9”
~15”
~17”
Tangential, 6 rpm
~9”
~13.5”
~17”
Tangential, 3 rpm
Sand CutawaySand Cutaway
Original Sand Level 12”
Water Level 20”
Original Sand Level 12”
Water Level 20”
Surface Waves
Figure 3.9. Mobilization Patterns for Tangentially Oriented Nozzles

3.12
The chart in Figure 3.10 shows the volume percent of the mobilized solids as they change with time when tangentially oriented mixing nozzles were used. On average, about 14% by volume of the mobil-ized solids was maintained in suspension when tangential mixing nozzles were used. Data for the tan-gential nozzles tests were available only for 20 minutes or less, and tests were not completed for the 3-rpm oscillations case. The chart shows the volume percent of the mobilized solids as a function of time for only the 6-rpm oscillations case.
Tangential Nozzle 6 RPM
0
0.05
0.1
0.15
0.2
0.25
0:00:00 4:48:00 9:36:00 14:24:00 19:12:00 24:00:00
time (min)
% o
f slu
dge
that
is
mob
ilize
d
Figure 3.10. Solids Volume Concentration in the Mixed Slurry as it Changes with Time
3.8.3 High-Flow Radial Jets During the radial and tangential nozzle tests the flow rate was limited to 32 gpm, but tests were also run for radial nozzles with a flow rate of 34 gpm. These tests showed that when the nozzles were rotating at 6 rpm the jets created a peculiar wave pattern in the supernatant liquid. Two wave packets would first travel in opposite directions away from the tank center. Once the packets reached the wall, they would reflect off the wall and return to the center. Upon reaching the center they would bounce off each other and travel back toward the wall. Another set of wave packets traveled perpendicular to the first set, that is, operated at 90 degrees out of phase with it. These waves in the supernatant liquid changed the shape of the previously produced parabolic valley into a square valley of unmobilized solids, as shown in Figure 3.11. Data taken from the peristaltic pump/sampling tube system showed that approximately 14% of the solids were mobilized by the radial nozzles when this wave pattern was developed in the supernatant liquid. Figure 3.12 gives the volume percent of mobilized solids sampled and measured over a period that is greater than one hour. The figure also shows that, unlike the previous radial nozzle test, at lower flow rates, the percent mobilized solids does appear to reach a stable rate considerably higher than at lower mixing jet velocities.
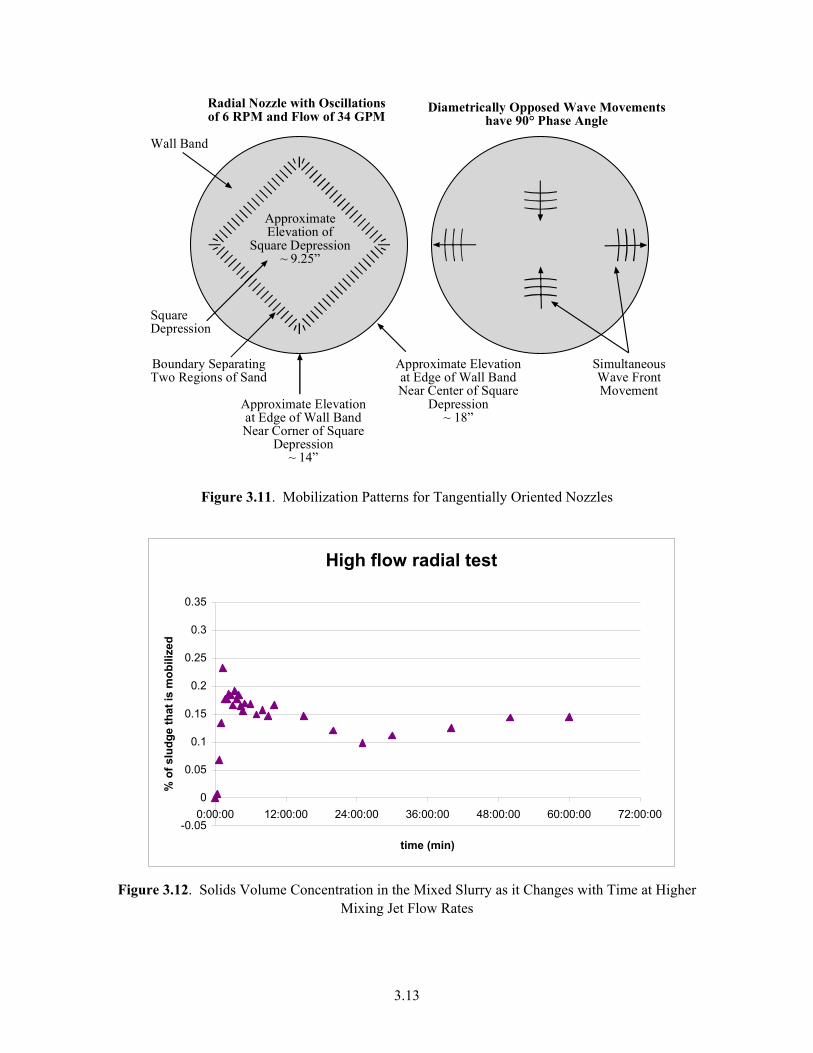
3.13
S i m u l t a n e o u s W a v e F r o n t M o v e m e n t
D i a m e t r i c a l l y O p p o s e d W a v e M o v e m e n t s h a v e 9 0 ° P h a s e A n g l e
R a d i a l N o z z l e w i t h O s c i l l a t i o n s o f 6 R P M a n d F l o w o f 3 4 G P M
B o u n d a r y S e p a r a t i n g T w o R e g i o n s o f S a n d
A p p r o x i m a t e E l e v a t i o n o f
S q u a r e D e p r e s s i o n ~ 9 . 2 5 ”
A p p r o x i m a t e E l e v a t i o n a t E d g e o f W a l l B a n d N e a r C o r n e r o f S q u a r e
D e p r e s s i o n ~ 1 4 ”
A p p r o x i m a t e E l e v a t i o n a t E d g e o f W a l l B a n d N e a r C e n t e r o f S q u a r e
D e p r e s s i o n ~ 1 8 ”
S q u a r e D e p r e s s i o n
W a l l B a n d
Figure 3.11. Mobilization Patterns for Tangentially Oriented Nozzles
High flow radial test
-0.05
0
0.05
0.1
0.15
0.2
0.25
0.3
0.35
0:00:00 12:00:00 24:00:00 36:00:00 48:00:00 60:00:00 72:00:00
time (min)
% o
f slu
dge
that
is m
obili
zed
Figure 3.12. Solids Volume Concentration in the Mixed Slurry as it Changes with Time at Higher
Mixing Jet Flow Rates

3.14
3.9 Fluffed (Quick) Sand
Another phenomenon observed during this experimental program was that at the end of every test the sand bed became almost like quicksand. After the supernatant liquid was pumped (decanted) off the top of the solids surface, we observed that the solids near the surface were in an unstable state. In that state the void fraction increased from 50 to about 57% and the solids moved, or “flowed,” like a liquid. As soon as the “liquefied sand” was disturbed by dropping an object into it or by shaking the tank slightly, it fell out of its quicksand state and compacted on the bottom into its normal settled-bed state with a void fraction of 50%. Table 3.1 shows some data taken on the quicksand void fraction.
Table 3.1. Quicksand Void Fraction(a)
Test V sand V slurry Void fraction Test 1 18 21 57.14 Test 2 17 20 57.50 Test 3 33.5 38 55.92 Average Value of Void Fraction 56.85 (a) Data were taken after radial tests of fluffed quicksand.
3.10 Conclusions These tests showed that the tangentially oriented nozzles maintained a mobilized slurry of nearly 14% solids volume concentration, while the radially oriented nozzles maintained a slurry of only 11% solids volume concentration. The Lawrence Pumps Co. modified their mixer pumps to meet the specifications of the SRS without considering the operational consequences. In this study we showed that the effect of this single modification produces, according to our limited tests, two beneficial results. The first is that removing the 90-degree bend that was just upstream of the mixing jet exit in the pump’s casing prolongs the service life of the mixer pump. The second shows that the change in the mixing nozzles’ orientation from radial to tangential, as a result of removing the 90-degree bend, improves the performance of the Lawrence mixer pump somewhat in mobilizing more settled solids.
One of the advantages that the tangential nozzles had over the radial nozzles was that the tangential nozzles created large-scale motions in the supernatant liquid layer. Because the supernatant liquid was maintained in motion, it was able to suspend more material within its volume. On the other hand, the radial nozzles with the normal flow rate did not create any large-scale motion. As soon as the mixing jets swept past, the supernatant liquid had very little residual motion and the solids quickly settled out. It was also observed that, at a slightly higher flow rate, wave packets were generated in the supernatant liquid. With this added supernatant motion, the mobilization was increased by 3%. From these data it can be seen that creating large-scale motion within the supernatant liquid could increase its ability to suspend solids. This is the function of a mixer pump that is used to mobilize settled solids.

4.1
4.0 West Valley Demonstration Project Experience−Tank D8-2 The West Valley Demonstration Project (WVDP) was created by the West Valley Demonstration Act of October 1, 1980. WVPD is a nuclear waste cleanup project located at the Nuclear Fuel Services facilities in West Valley, New York. Nuclear Fuel Services operated from 1966 to 1972, reprocessing spent nuclear fuel through the plutonium-uranium extraction (PUREX) process. They also reprocessed a core of mixed uranium-thorium fuel using the thorium-uranium extraction (THOREX) process. These reprocessing efforts created approximately 2 million liters of high-level waste (HLW), which was stored under sodium hydroxide in underground storage tanks. This section contains a summary of a paper entitled, “ High-Level Waste Mobilization and Removal at the West Valley Demonstration Project” (Hamel and Meess 1996). This summary is limited to infor-mation related to mixing and mobilization within the tanks, which is the topic of this report. There is much additional information in the paper that is related to other aspects of the waste mobilization and removal operations such as the handling of highly radioactive equipment, maintenance and safety considerations, contamination-control to minimize personnel radiation doses, etc. The complete text is included as Appendix E to this report.
4.1 Introduction HLW was mobilized and removed from two large underground tanks at the WVDP. This was the first step toward vitrifying the waste in borosilicate glass that was subsequently poured into stainless steel canisters. Over a 32-month period, 1.3 million liters (1 L = 0.2642 gal) of HLW slurry was removed from the two tanks in 102 waste transfer batches. Tank 8D-2 is a 2.8-million-L carbon steel storage tank. It contains 2 million liters of HLW consisting of insoluble hydroxides and other salts that precipitated out of the solution to form a sludge layer on the tank bottom and a liquid supernatant, composed of mostly sodium nitrate and sodium nitrite, above he sludge. Tank 8D-1 served as the spare HLW tank for Tank 8D-2. It contained spent zeolite, which was stored under an alkaline liquid. The spent zeolite resulted from a pretreatment process that removed almost all the cesium from the liquid supernatant in Tank 8D-2. After several sludge washing activities in Tank 8D-2 and pretreatment of zeolite in Tank 8D-1, during which the zeolite was ground to 50 µm or less, the zeolite slurry from Tank 8D-1 was combined with the washed sludge in Tank 8D-2. This resulted in over 95% of the HLW activity residing in Tank 8D-2, and the HLW in that tank was ready to be mobilized and removed for transfer into the vitrification facility.
4.2 Facilities Three tanks, 8D-1, 8D-2, and 8D-4, contained the nuclear waste stored at the West Valley site. Tank 8D-4 is a 50,000-L stainless steel storage tank that contained 31,000 L of THOREX waste. Tanks 8D-1 and 8D-2 are 2.8-million-L carbon steel underground storage tanks, 21 m in diameter and 8.2 m high, with a wall thickness ranging from 11 mm to 17 mm. They are each contained within a 0.60-m-thick concrete vault and a 1.6-m high secondary containment pan. The tanks contain an elaborate internal

4.2
gridwork structure that reinforces the tank bottom, supports the tank roof, and provides access for six columns from the concrete vault floor to support the vault roof. The structural grid work in the tank bottom consists of a reinforcing network of wide flange beams with the upper flange 0.91 m above the tank floor. The beams are supported by girders of varying lengths and widths and are attached to the tank bottom with 3.8-cm-diameter rods with reinforcing disks where the rods meet the tank floor. There are 45 21.9-mm-diameter pipes on a 3.05-m grid that connects the wide flange beams to the tank top and pro-vides support for the roof and its exterior structural reinforcing above. This internal gridwork and structure makes waste mobilization and retrieval quite challenging. The HLW Mobilization and Transfer System consists of five mobilization pumps and a single slurry transfer pump installed in Tank 8D-2. The pump pit above the transfer pump is where the pump motor and process piping valves and instrumentation are located. The transfer trench that contains the transfer pipelines connects the pump pit to the vitrification facility. The mobilization pumps are long-shafted centrifugal pumps with an overall length of 15.3 m. A single impeller draws material up into the pump suction that is fitted with a strainer to avoid drawing in large particles or tank debris. This suction was positioned initially 10 cm from the tank bottom, but during later waste transfers it was lowered to 2.5 cm. Two tangential 3.8-cm-diameter nozzles, which discharge the pumped liquid/slurry from the volute, were located at an elevation of 18 to 25 cm above the tank bottom. Each nozzle discharged 2270 L/min at a nominal pump speed of 1800 rpm. The driveline was lubricated and cooled by a column of pressurized clean water surrounding the drive shaft. The pump was powered by a 150-hp motor with a VFD. The entire pump assembly rotated so that the two tangen-tially oriented discharge jets swept the tank bottom to mobilize waste within a 4- to 10-m effective cleaning radius (ECR), depending upon the characteristics of the solid. One-sixth scale tests indicated that up to five mobilization pumps would be needed to mobilize the sludge. Five mobilization pumps were installed within tanks 8D-1 and 8D-2. In Tank 8D-1 these pumps were used to mobilize the temporarily stored zeolite, while a multistage, long-shafted centrifugal pump transferred the waste through a grinder and into Tank 8D-2. The slurry transfer pump is a 13-stage, long-shafted, vertical submersible pump that is approximately 12 m long. Its radial inlet suction extends approximately 7 to 9 cm above the tank bottom. It has a capacity of 380 L/m with a 60-m head and is driven by a 20-hp motor.
4.3 Pretreatment Originally all the PUREX waste was stored in Tank 8D-2. That waste consisted of insoluble hydrox-ides and other salts that precipitated out of the solution to form a sludge layer on the tank bottom and a liquid supernatant, composed of mostly sodium nitrate and sodium nitrite, above the sludge. A pretreat-ment of the supernatant was necessary because the dissolved sodium sulfate would interfere with the vitrification process, and the pretreatment would significantly reduce the amount of waste that had to be vitrified. Pretreatment consisted of removing the cesium-137 from the supernatant using UOP IONSIV IE-96 zeolite. Once the cesium-137 was removed, the spent zeolite was temporarily stored under an alkaline liquid in Tank 8D-1. With the cesium-137 removed, the remainder of the supernatant was now considered a low level waste (LLW) and was solidified with Portland cement. Following the supernatant

4.3
processing, the five mobilization pumps were installed in Tank 8D-2 to agitate the settled sludge and dissolve additional salts into the sludge wash. The three successive washings dissolved the precipitated salts and concentrated the strontium-90, plutonium, and cesium-137 into zeolite. Before the final wash-ing, the THOREX waste was transferred from Tank 8D-4 to Tank 8D-2 so most of its salts could be processed into LLW. This pretreatment of the waste resulted in “washed” PUREX and THOREX sludge in HLW Tank 8D-2, 65,300 kg of spent zeolite in Tank 8D-1, and 19,877 square 270-L drums of cemented salt solution. The last processing step was to transfer the zeolite in Tank 8D-1 to 8D-2, which was achieved using five mobilization pumps and was spread across 18 different transfer campaigns. About 90% of the zeolite was transferred by November 1996. During the transfer the zeolite was passed through a grinder, which reduced the particle size from 840–300 microns to about 50 microns or less. With all the HLW concen-trated in Tank 8D-2, mobilization pumps were used to slurry the solution, and the waste was pumped in slurry form to the vitrification facility.
4.4 Waste Composition
The sludge in Tank 8D-2 before vitrification comprised insoluble metal hydroxides with a specific gravity of 3.35 and a particle size of less then 100 microns. Approximately 50% by weight of the sludge was spent zeolite containing cesium-137, plutonium, and strontium-90. The tank also contained about 870,000 L of supernatant liquid.
4.5 Procedures
In a typical transfer of a mobilized HLW batch, the mobilization pumps were operated from one to three hours before the HLW transfer began to hydraulically lift the settled solids off the tank bottom and slurry them with the supernatant. The mobilization pumps continued to operate throughout the waste transfer process, which lasted typically 30 to 60 minutes, then were shut down. The waste level was reduced progressively from an initial level of 2.5 m to approximately 25 cm at the last transfer. Initially, transfers were performed with a higher liquid level to limit the waste concentration in the transferred slurry until the shielding adequacy of the pump pit and transfer line trench could be verified by measure-ments and until vitrification radioactive operations could be evaluated during the controlled startup. Following successful vitrification, the excess liquid in the HLW Tank D8-2 was progressively decanted to the spare Tank D8-1, leaving the highly radioactive zeolite and sludge with a smaller amount of liquid with which to slurry. This allowed transfers of more concentrated HLW and subsequently minimized waste concentration in the vitrification facility.
During mobilization the operation of the transfer pump was monitored visually, and the key process parameters were recorded and displayed in real time. The online (slurry transfer line) radiation probe was also monitored and, based on its output mobilization pump speeds, positioner speeds and/or rotational directions and the transfer pump speed were adjusted to maximize the effectiveness of the waste transfer. When necessary, the rotation of the mobilization pumps was stopped to aim one of the mixing jets on one specific area, or multiple pumps were targeted in a specific direction to mobilize a portion of the sludge that was identified by the visualization system to still be attached to the bottom or accumulating at a specific region in the tank. Transfers were typically 2½ days apart to provide time for vitrification.

4.4
4.6 Operations and Effectiveness Of the five installed mobilization pumps, only four were functional when waste transfers to the vitrification facility began in June 1966. After approximately two months a sixth pump was installed, bringing the number of functional mobilization pumps to five. In 1998,the inoperable pump was repaired and the remaining waste transfers were accomplished with all six-mobilization pumps operating. The transfer pump occasionally plugged with solids. To remedy this situation, utility water and compressed air were piped into jumpers that could be used for backwashing the transfer pump and pipeline as needed. In addition, a new transfer pump was installed in 1998 to replace the worn-out original. In Tank 8D-2, 102 waste transfers were performed from June 1996 to September 1998. During that time, approximately 88% of the HLW was removed from the site. Liquid was added to the tank during the transfers, mainly in the form of lubricant for the mobilization pumps, which leaked at a rate of about 18 L/min. Nearly all of the cesium-137 (98%) and 86% of the sludge have been processed, leaving approximately 12% of the original waste still in the tanks. Most of the remaining sludge is in an area that is beyond the ECR of the mobilization pumps. Efforts are still under way to remove this material.
4.7 Process Improvements The mobilization pumps have performed very well. Several innovative hardware-related improve-ments were implemented with great success (these improvements are described in detail in Appendix E). These innovative modifications have avoided significant increases in cost, labor, and radiological doses. Mobilization of solids in hard-to-reach areas of the tank bottom has been improved by aiming the mixing jets directly at the desired region. Alternatively, the pump positioner was made to move the pump over a limited arc length, causing the submerged pump jets to concentrate on a particular area of the tank. By using the in-tank video camera and these two techniques, accumulated solids have been mobilized that were previously unreachable. In addition, the VFD on the mobilization pump motor has allowed the pump output to be increased, using the total motor power. This feature allowed increased jet velocity that was needed when aiming or sweeping the jets at an area of unmobilized waste solids. Solids occasionally plugged the transfer pump suction/inlet, which caused the pump performance to deteriorate. Utility water and compressed air that were piped into jumpers within the pump pit were used to clear the transfer pump inlet when it became fouled and were highly effective in clearing the suction strainer, especially the compressed air.
4.8 Major Challenges The major challenges encountered during the HLW mobilization and removal were related to the need to remove highly contaminated equipment, mainly pumps with long drive shafts, from the HLW tank for repair or replacement. The length of the pumps, together with their contamination levels and
4.5
resulting radiation fields, presented some unique challenges to the Engineering, Operations, and Radiation Protection personnel.
4.9 Lessons Learned Small-scale mixing pump testing provided the basis for selecting mobilization and transfer equip-ment. In this case, testing demonstrated that five mobilization pumps, with a sluicer that can be posi-tioned at various locations in the tank, and one transfer pump could mobilize and remove over 95% of the waste. It is highly recommended that as much equipment as possible be positioned outside the pump pit for easier servicing and that the shielded pump pit be easily accessible. Another important recommenda-tion is that pumps with long drive shafts that are inaccessible from within the pump pit should be fitted with vibration sensors and tachometers, including spares. These will allow personnel to monitor for equipment wear, predict remaining lifetimes, and determine the actual speed at which the equipment is operating for diagnostic work. Other noteworthy observations include the unexpected discovery of the worth of having a spare tank that is fitted with similar equipment to those used in the actual tank being mobilized and retrieved. The spare tank was used for receiving excess liquid and/or supplying needed additional liquids. The equip-ment in the spare tank could be used for immediate replacement of damaged equipment in the operating tank without having to wait for excessive delivery time. The spare tank can also be used for testing certain operational schemes that were necessary to overcome unexpected difficulties.
Another significant operational action was maintaining the mobilization pumps in operation while the retrieval pump was operating to remove the waste slurry. This is a valuable procedure, especially when the solids have a high specific gravity, because it helps those heavy mobilized solids to stay in suspension, allowing them to be removed.

5.1
5.0 Reference Hamel WF Jr. and DC Meess. 1996. High-Level Waste Mobilization and Removal at the West Valley Demonstration Project. West Valley Demonstration Project, New York
Appendix A
Flowmeter Calibration Data


A.1
Table A.1. Flowmeter Calibration Data
action item Before Experiment After Experimentrun 1 run 2 run 3 run 1 run 2 run 3
starting count 3413 4346 4384 41132 41174 41215start water flowingwait until flow stablizes
weight 90 69 67 41142 41183 41223count 3424 4354 4392 69 79 63
start timeravg flow rate 7.70+-.04 8.6 9.05+-.03 14.55+-.15 10.79+-.10 6.93+-.07
stop timerweight 304 216 367 306 260 202count 3450 4372 4428 41169 41205 41240time 3:22 2:06:18 3:58:58 1:50 2:06:14 2:27:37
wait until tank is almost fullturn of tap water
final weight 356 254 398 340 342 285final count 3456 4377 4433 41174 41215 41250depth 25" 17 3/4" 27 7/8" 23 7/8" 23 7/8" 21 5/8"diameter 22.5" 22.5" 22.5" 22.5" 22.5" 21.5"
Resultstotal flow from meter 43 31 49 42 41 35total flow from mass 43 30 48 40.7 41 34.2total flow from volume 43 31 48 41.1 41.1 34
rate flow from meter 7.7 8.6 9.05 14.55 10.79 6.93rate flow from mass 7.62 8.37 9.04 14.18 10.65 6.77


Appendix B
Physical Properties of the Solid Particles


B.1
Appendix B
Physical Properties of the Solid Particles
NAM E #70 grade washedSupplier Western Materials
Properties
Solid Volume Fraction Vsand/Vmixture 0.5Bulk Density of the sand (kg/m^3) 1402Material Density of the sand (kg/m^3) 2804Specific Gravity 2.81Shear Strength High (traps air)Particle distribution
starting quanity (g) 246.17Mass Percent percent of sample having
opening (mm) Retained (g) Passing given diameter sieve size (um)1 0 100.0
0.5 0 100.00.25 100.69 58.9 0.16 500-250
0.212 52.21 37.6 0.56 250-2120.15 77.59 6.0 0.51 212-150
0.125 10.66 1.7 0.17 150-1250.07 3.91 0.06 0.03 125-75
0.045 0.06 0.03 0 75-45pan 0.08 0.00 0 45-0
total recovered 245.2total lost 0.97
Particle shape Roughly Spherical 3-D crystals, with angular sidesSettling Velocity (m/s) 0.01-0.04: mostly around 0.03Water Clarity milkier then #30 but clearer then TD
Conclusionsgood distribution: 65% are 250 microns in radius:
Particle distribution
0
20
40
60
80
100
120
1 0.5 0.25 0.212 0.15 0.125 0.07 0.045 pan
opening (m m )
mass retained (
particle distribution
00.10.20.30.40.50.6
500
460
420
380
340
300
260
220
180
140
100 60 20
particle diameter%
of s
ampl
e ha
ving
th
at p
artic
le
diam
eter


Appendix C
Solid Particles Washing Procedure and Test Conditions


C.1
Appendix C
Solid Particles Washing Procedure and Test Conditions
Solid Particles Washing Procedure 1. Pour one bag (100 lbs) of solid particles into a 55-gallon drum. 2. Add approximately 20 gallons of water. 3. With a shovel mix the solid particles with the water. 4. Pump the water, with the suspended fine particulets, out of 55-gallon drum. 5. Pump the water through a filter and down the floor drain. 6. Repeat steps 2-5 three times to remove all of the fine particles. 7. Shovel the solid particles out of the drum and into a large storage container. 8. Repeat steps 1-7 until all the needed solid particles are washed.
Test Conditions
test location of Nozzle Flow Nozzle run sampling tube Oscillations rate configuration
RPM GPM1 midraduis;12.75" from base 3 31.3 radial2 4" from edge; 16" from base 3 31.7 radial3 midraduis;12.75" from base 6 31.8 radial4 midraduis;12.75" from base 3 33.4 radial5 4" from edge; 16" from base 6 33.4 radial6 4" from edge; 16" from base 3 32.7 tangential7 4" from edge; 16" from base 6 34 radial8 midraduis;12.75" from base 6 34 radial9 midraduis;12.75" from base 3 34.5 radial
10 midraduis;12.75" from base 6 32 tangential11 4" from edge; 16" from base 6 32 tangential12 4" from edge; 16" from base 3 32 tangential


Appendix D
Data Collection Procedures


D.1
Appendix D
Data Collection Procedures 1. Start peristaltic pump. 2. Take first data point (time 0:00). 3. Open ball valve to nozzles. 4. Open ball valve to bypass suction. 5. Start pump and timer. 6. Start oscillation motor. 7. Samples must be taken when nozzles are 90 degrees away from sampling tube. 8. Take samples every 20 seconds for the first five minutes. 9. Check the flow rate. 10. Take samples every minute for the next five minutes. 11. Take samples every five minutes from 10 to 30 minutes. 12. Check the flow rate. 13. Take samples at 40, 50, and 60 minutes. 14. Check the flow rate and record the average of the three. 15. Using yardsticks measure the dimensions of the solid sand base at various points. 16. Turn pump off. 17. Turn off oscillation motor. 18. Close ball valve to nozzles. 19. Close ball valve to suction. 20. Start discharge pump and begin pumping water out of the tank. 21. Record the data taken with graduated cylinders. 22. Once water is removed from the tank determine the dimensions of the settled sand using a tape
measure. 23. Using a shovel level the sand in the tank. 24. Change conditions on height, nozzle configuration, oscillation rate, or sampling location if
applicable. 25. Fill the tank with water to the depth of 20 inches. 26. Remove samples from graduated cylinders and clean them for the next test.


Appendix E
High-Level Waste Mobilization and Removal at the West Valley Demonstration Project


E.1
High-Level Waste Mobilization and Removal at The West Valley Demonstration Project
(Formerly Titled: Challenges and Accomplishments in the Mobilization and Transfer of
High-Level Radioactive Waste at the West Valley Demonstration Project)
William F. Hamel, Jr., U.S. Department of Energy - West Valley Demonstration Project Daniel C. Meess, West Valley Nuclear Services Co., Inc. - West Valley Demonstration Project
Abstract The West Valley Demonstration Project (WVDP) has used a process to vitrify high-level radioactive waste (HLW) in borosilicate glass since June 1996. This process is composed of waste mobilization and removal from two large, underground HLW storage tanks; transfer into the Vitrification Facility; and processing the HLW with glass-former chemicals into a molten borosilicate glass that is poured into stainless steel canisters. After 32 months of operation, approximately 88% of the cesium-137 and strontium-90 activity have been removed from the HLW tanks and successfully processed into glass-filled canisters. These operations have removed 1.3 million liters (L) of HLW slurry from the HLW tanks over the course of 102 waste transfers. From these transfers, 58 melter feed batches have been prepared and over 230 canisters of vitrified waste have been produced. Throughout waste mobilization and removal operations, improvements to the systems were made to optimize waste removal. Equipment replacements within the HLW tanks and transfer system presented unique maintenance, safety, radiological, and contamination-control opportunities in the removal of very large, highly radioactive pumps while minimizing personnel radiation doses. In addition, waste mobil-ization and removal operations resulted in many “lessons learned” that may benefit others who are or will be performing similar operations.
Introduction The WVDP is managed and funded by the United States Department of Energy (DOE) in cooperation with the New York State Energy Research and Development Authority (NYSERDA) and is being con-ducted at the site of the first and only operating commercial spent nuclear fuel reprocessing center in the United States. Nuclear Fuel Services operated the facility in West Valley, New York, between 1966 and 1972, reprocessing 640 metric tons of commercial and defense fuels using the plutonium-uranium extrac-tion (PUREX) process. After plutonium and uranium recovery, the remaining HLW was neutralized with sodium hydroxide for safe storage in the 2.8-million L, carbon steel, underground storage tank, designated Tank 8D-2. The 2 million L of HLW consisted of insoluble hydroxides and other salts that precipitated out of the solution to form a sludge layer on the tank bottom and a liquid supernatant, composed of mostly sodium nitrate and sodium nitrite, above the sludge. In addition, approximately 31,000 L of acidic thorium-uranium extraction (THOREX) waste was stored in a 50,000-L underground, stainless steel, storage tank identified as Tank 8D-4. This waste resulted from reprocessing one core of mixed uranium thorium fuel from the Indian Point No. 1 Nuclear Plant (Reference 1).
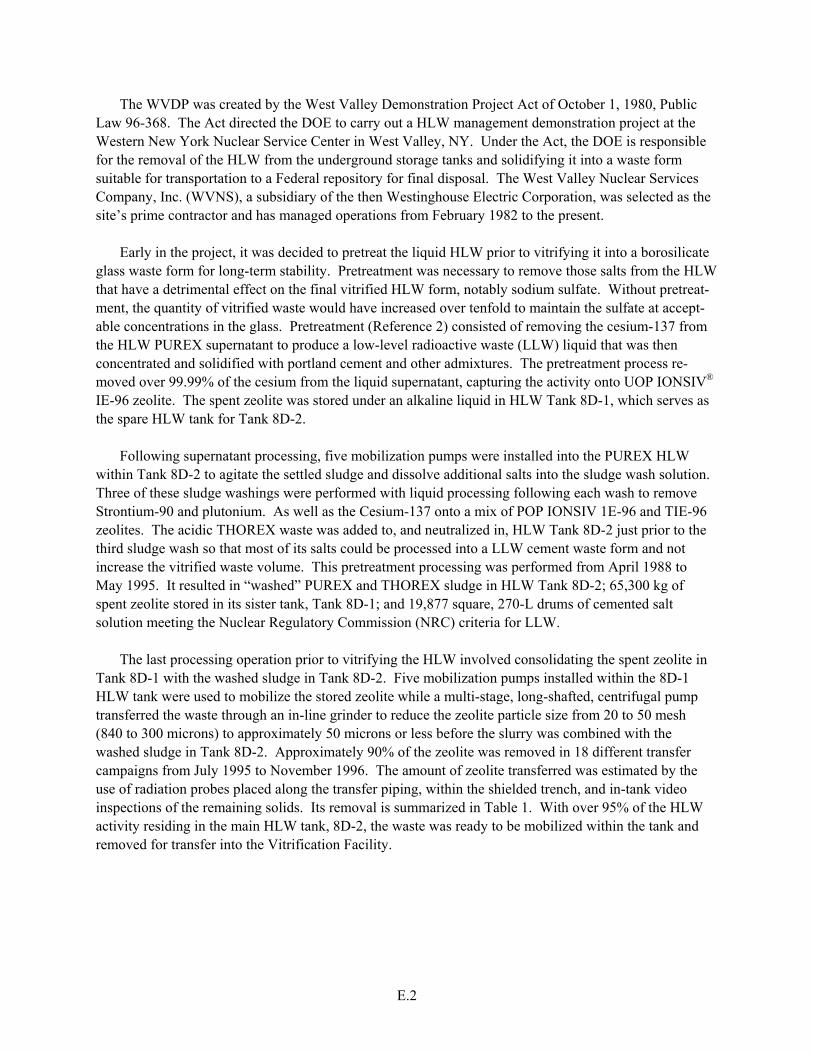
E.2
The WVDP was created by the West Valley Demonstration Project Act of October 1, 1980, Public Law 96-368. The Act directed the DOE to carry out a HLW management demonstration project at the Western New York Nuclear Service Center in West Valley, NY. Under the Act, the DOE is responsible for the removal of the HLW from the underground storage tanks and solidifying it into a waste form suitable for transportation to a Federal repository for final disposal. The West Valley Nuclear Services Company, Inc. (WVNS), a subsidiary of the then Westinghouse Electric Corporation, was selected as the site’s prime contractor and has managed operations from February 1982 to the present. Early in the project, it was decided to pretreat the liquid HLW prior to vitrifying it into a borosilicate glass waste form for long-term stability. Pretreatment was necessary to remove those salts from the HLW that have a detrimental effect on the final vitrified HLW form, notably sodium sulfate. Without pretreat-ment, the quantity of vitrified waste would have increased over tenfold to maintain the sulfate at accept-able concentrations in the glass. Pretreatment (Reference 2) consisted of removing the cesium-137 from the HLW PUREX supernatant to produce a low-level radioactive waste (LLW) liquid that was then concentrated and solidified with portland cement and other admixtures. The pretreatment process re-moved over 99.99% of the cesium from the liquid supernatant, capturing the activity onto UOP IONSIV® IE-96 zeolite. The spent zeolite was stored under an alkaline liquid in HLW Tank 8D-1, which serves as the spare HLW tank for Tank 8D-2. Following supernatant processing, five mobilization pumps were installed into the PUREX HLW within Tank 8D-2 to agitate the settled sludge and dissolve additional salts into the sludge wash solution. Three of these sludge washings were performed with liquid processing following each wash to remove Strontium-90 and plutonium. As well as the Cesium-137 onto a mix of POP IONSIV 1E-96 and TIE-96 zeolites. The acidic THOREX waste was added to, and neutralized in, HLW Tank 8D-2 just prior to the third sludge wash so that most of its salts could be processed into a LLW cement waste form and not increase the vitrified waste volume. This pretreatment processing was performed from April 1988 to May 1995. It resulted in “washed” PUREX and THOREX sludge in HLW Tank 8D-2; 65,300 kg of spent zeolite stored in its sister tank, Tank 8D-1; and 19,877 square, 270-L drums of cemented salt solution meeting the Nuclear Regulatory Commission (NRC) criteria for LLW. The last processing operation prior to vitrifying the HLW involved consolidating the spent zeolite in Tank 8D-1 with the washed sludge in Tank 8D-2. Five mobilization pumps installed within the 8D-1 HLW tank were used to mobilize the stored zeolite while a multi-stage, long-shafted, centrifugal pump transferred the waste through an in-line grinder to reduce the zeolite particle size from 20 to 50 mesh (840 to 300 microns) to approximately 50 microns or less before the slurry was combined with the washed sludge in Tank 8D-2. Approximately 90% of the zeolite was removed in 18 different transfer campaigns from July 1995 to November 1996. The amount of zeolite transferred was estimated by the use of radiation probes placed along the transfer piping, within the shielded trench, and in-tank video inspections of the remaining solids. Its removal is summarized in Table 1. With over 95% of the HLW activity residing in the main HLW tank, 8D-2, the waste was ready to be mobilized within the tank and removed for transfer into the Vitrification Facility.

E.3
Table 1. Zeolite Removal Progress
Transfer
Number of Mobilization
Pumps Operated More Than 10 Hours
Sum of All Mobilization Pump Hours
Percent of Original Zeolite Removed
Cumulative Percentage Removed
1 5 166 25.9 25.9 2 5 158 3.3 29.2 3 5 163 2.0 31.2 4 3 45 2.0 33.2 5 3 43 5.2 38.4 6 4 221 4.4 42.8 7 4 227 5.2 47.9 8 4 191 5.4 53.3 9 4 213 6.2 59.6
10 3 78 2.9 62.4 11 3 186 9.9 72.3 12 2 101 3.2 75.6 13 2 135 5.3 80.8 14 3 129 2.4 83.2 15 4 169 3.2 86.4 16 1 66 1.8 88.3 17 2 80 1.0 89.2 18 1 33 0.1 89.3
High-Level Waste Mobilization and Transfer The HLW Mobilization and Transfer System consists of mobilization pumps and a slurry transfer pump installed into the HLW storage tank, the pump pit above the transfer pump where the pump motor and process piping valves and instrumentation are located, and the transfer trench that contains the transfer pipelines connecting the pump pit to the Vitrification Facility. The relative locations of each of these features are illustrated in Figure 1.
High-Level Waste Tank Description The HLW tank containing the waste is a 2.8-million-L, underground, carbon steel storage tank. The tank is 21 m in diameter and 8.2 m high, with wall thicknesses ranging from I 1 mm to 17 mm. It is contained within a 0.60-m-thick concrete vault and a 1.6-m-high secondary containment pan as shown in Figure 2. The original tank had only one large, 0.61-m-diameter, riser pipe that extended from the tank top up above the grade of the earthen cap over the tank’s concrete vault. The tank was constructed with an elaborate internal gridwork structure (Figure 3) that reinforces the tank bottom, supports the tank roof,

E.4
Figure 1. Waste Tank Farm Facilities Supporting Vitrification and provides access for six columns from the concrete vault floor to support the vault roof. The structural gridwork in the tank bottom consists of a reinforcing network of wide flange beams with the upper flanges 0.91 m above the tank floor. The beams are supported by girders of varying lengths and widths underneath the beams. The girders are attached to the tank bottom with 3.8-cm-diameter rods with reinforcing disks where the rods meet the tank floor. There are 45, 21.9-mm-diameter pipes located on a 3.05-m grid that connects the wide flange beams to the tank top and provides support for the roof and its exterior structural reinforcing above. In addition, the tank contains four inactive air circulators, thermo-wells a heat exchanger, and level/density probes. The internal gridwork and structures make waste mobilization and retrieval quite challenging. Based on the 1/6-scale sludge and zeolite mobilization and removal test program (Reference 3), it was determined that as many as five mobilization pumps were needed to mobilize the solids deposited on the tank bottom so that the solids could be pumped out of the tank to the Vitrification Facility. Consequently, eight additional 71-cm-diameter risers were remotely installed to the tank top to provide for pump installations, and three trusses were constructed over the tank to support the pumps and distribute the weight outboard of the underground concrete vault. The location of these risers with the original five installed mobilization pumps, single slurry-transfer pump, and the floating-suction decant pump, previously used for supernatant and sludge wash pretreatment operations (Reference 2), are illustrated in Figure 3.

E.5
Figure 2. HLW Tank with Installed Mobilization Pumps
Figure 3. HLW Tank 8D-2 Bottom Internal Gridwork

E.6
Waste Composition Prior to the start of HLW Vitrification, the primary HLW storage tank, Tank 8D-2, contained a mixture of washed sludge solids and zeolite with a liquid supernatant. Table II summarizes the waste composition prior to vitrification. The sludge consists of insoluble metal hydroxides, with ferric hydroxide being the major constituent. The sludge mass was estimated at 100,000 kg with a 3.35 specific gravity (SG). Based on sludge sampling and analysis, the particle size of the sludge was generally less than 100 microns. The predominant radionuclides in the sludge are Strontium-90 and isotopes of thorium and uranium. The activity of the Strontium-90 was estimated to be 5.81 million curies (January 1, 1996, basis).
Table II. HLW Composition
Oxide Approximate Weight Percent Fe2O3 35.5 SiO2 20.8 Na2O 14.4 ThO2 10.4 Al2O3 7.1 MnO 2.3 P2O5 1.8 CaO 1.3
Approximately 57,000 kg of zeolite, containing approximately 5.5 million curies of cesium-137 and trace quantities of plutonium and Strontium-90, were transferred into the HLW tank following completion of HLW pretreatment. Pretreatment operations reduced the quantity of salts in the waste and significantly reduced the amount of vitrified waste that must be produced. The zeolite is UOP IONSIVO Type IE-96 and TIE-96 which was size-reduced by passing it through an in-line grinder after it was removed from its storage tank on the way into the HLW tank feeding the Vitrification Facility. The grinder was designed to size-reduce the 20- to 50-mesh zeolite particles (840 to 300 micron) to less than a 50-micron particle size. This smaller size made the zeolite easier to homogeneously mix with the sludge, which has a similar particle size, easier to mobilize and remove from the HLW tank, easier to sample in the Vitrification Facility, and quicker to analyze the waste samples in the WVDP’s Analytical and Process Chemistry (A&PC) Laboratory. The HLW tank also contained approximately 870,000 L of supernatant liquid, essentially an inorganic salt solution, from previous sludge-wash operations. The inorganic salt com-position of the HLW liquid is shown in Table III, with the major constituents as sodium nitrite and sodium nitrate. The SG of the liquid was 1.016, its temperature was approximately 60°C (140°F), and its pH was approximately 11. The spare HLW tank, Tank 8D-1, contained 520,000 L of excess liquid resulting from pretreatment and zeolite transfer operations. This liquid had a SG of 1.016, its temperature was approximately 30°C (85°F), and its pH was approximately 10.5.

E.7
Table III. Inorganic Salt Composition of the HLW Supernatant
Analysis Weight Percent Na 35.0
NO2 25.0 CO3 22.0 NO3 8.9 SO4 1.1 K 0.94 B 0.43 Cr 0.33 U 0.13 P 0.046
Waste Mobilization and Removal Equipment The mobilization pumps, installed in the HLW tank to “mobilize” the solids deposited on the tank bottom and mix them with the supernatant, are long-shafted, centrifugal pumps with an overall length of 15.3 m. There is a single impeller that draws material up into the pump suction that is fitted with a strainer to avoid drawing in large particles or tank debris. This suction is positioned between 2.5 cm and 10 cm from the tank bottom (Figure 3). Two tangential, 3.8-cm-diameter nozzles discharge the pumped liquid from the volute at an elevation from 18 cm to 25 cm above the tank bottom. Each nozzle dis-charges 2270 L/min. at the 100%-rated pump speed of 1800 rpm. The driveline bearings are cooled and lubricated by a water column enclosing the drive shaft and pressurized with clean water. The pump column utilizes mechanical seals at the top and bottom to maintain the pressurized water column. A 150-hp motor powers the pump and is supplied by a variable frequency drive (VFD) to provide speed adjustments. The entire pump-motor assembly rotates so that the two, tangentially oriented discharge jets sweep the tank bottom in either a clockwise or counter-clockwise direction to mobilize waste within a 4- to 10-m radius around each pump, depending on the physical characteristics of the waste solids. The gearmotor that rotates the entire pump assembly is also supplied with a VFD to control rotational speed of the pump jets, typically 1/4 to 1 rpm. Currently, six of these mobilization pumps are installed in HLW Tank 8D-2 at the locations shown in Figure 3. The slurry transfer pump is a 13-stage, long-shafted, vertical turbine approximately 12 m long. Its radial inlet suction extends from approximately 7 to 9 cm above the tank bottom. Two concentric strainers prevent large solids or debris from entering the pump. The driveline bearings are immersed within the process slurry passing up the pump column around the shaft. It is equipped with a 20-hp motor located in a concrete shielded pump pit directly over the pump column. The motor is remotely replace-able and is supplied with a VFD to provide flow control. The pump has a capacity of 380 L/min. with a 60-m head. The long pump column is reinforced to be able to pump waste slurry with the mobilization pumps operating within the HLW tank. The pump is equipped with a tachometer sensor to measure shaft speed, and vibration sensors to monitor pump wear.

E.8
Transfer Pump Pit An underground concrete pump pit, located immediately over the HLW tank vault roof, contains a stainless steel-lined bottom and houses the HLW transfer pump head, discharge piping, and motor. Temperature, pressure, and flow sensors are installed on the pump discharge jumper. Remotely replaceable jumpers connect the equipment within the pit to the piping. In addition, the pit contains primary and spare transfer lines to both the spare HLW tank and the Vitrification Facility, as well as a recirculation line back to the HLW tank below. Valves equipped with position-indicating switches provide isolation between the various piping jumpers contained within the pit. These valves are manually actuated by extended T-handles that pass through the concrete pit covers. The position switches are connected to a programmable logic controller (PLC) that ensures proper valve positioning prior to pump operations. The pit is both ventilated and drained by a pipe connecting the pit floor with the HLW tank underneath. The pit is supplied with compressed air and water to flush equipment and piping. The in-line grinder, used to size-reduce the zeolite as it was transferred from the spare HLW tank following HLW pretreatment, is also located within the pit with its motor and cooling water lines. The pit is accessible by removing one or more of the six keyed concrete covers over top of the pit. A weather shelter is erected over the pit covers to provide protection for personnel actuating pit valving. A mobile crane is used to remove pit covers end service pit equipment. Immediately adjacent to the transfer pump pit is an underground utility pit that provides the isolation valving and backflow protection for the water and compressed air that passes into the pump pit.
Transfer Trench The transfer trench is a partially below-grade, seismically designed, concrete structure that connects the HLW tank pump pits together and with the Vitrification Facility. The trench stretches over 70 m from the pump pit to the Vitrification Facility. The trench has removable concrete covers and is insulated above ground to prevent line freezing. All transfer piping within the trench is 5 cm stainless steel, with 10 cm stainless steel secondary containments jacketing the primary pipelines. The piping slopes toward a low point in the pump pit where the line drains back to the HLW tank and secondary-containment piping leak detectors are located. Valving within the pump pit allows for draining the secondary-containment jacket in the event it receives liquid. The trench also has high-point vents and exterior valving to test the integrity of the secondary containment. Radiation probe penetrations exist to monitor the activity of the liquid passing through the transfer piping.
High-Level Waste Mobilization and Removal Over 102 transfers of waste from the HLW tank to the Vitrification Facility have been performed from the first transfer on June 24, 1996, to September 30; 1998. These transfers made up 58 batches of feed for the melter and contained 10.3 million curies of Cesium-137 and Strontium-90. The first transfers were performed with the tank level at 2.5 m. The tank level was progressively reduced to approximately 25 cm at the last transfers. Initially, transfers were performed with a higher liquid level in the HLW tank to limit the waste concentration of the transfer until the shielding adequacy of the pit and trench could be verified by measurements and until vitrification radioactive operations could be evaluated during the controlled start-up. Following successful vitrification (start-up) operations, the excess liquid in the HLW tank was progressively decanted to the spare HLW tank, leaving the highly radioactive zeolite and sludge

E.9
with a smaller amount of liquid with which to slurry. This allowed transfers of more concentrated HLW and subsequently minimized waste concentration in the Vitrification Facility. During this period, liquids were also added to the HLW tank. Waste from laboratory analysis of vitrification samples was returned to the HLW tank. Overheads (distillates) from concentrating the waste in the Vitrification Facility make-up tank were returned after a 20 to 50 volume reduction in the Liquid Waste Treatment System (LWTS) evaporator. In addition, the clean water used to pressurize the mobil-ization pump columns was added to the tank’s volume since some of the mobilization pumps’ lower mechanical seals leaked up to 18 L/min. It is estimated that approximately 1.3 million L of water were added to the tank due to mobilization pump column leakage. Part of this liquid was volume-reduced in the Integrated Radwaste Treatment System (IRTS) and returned to the HLW tanks, and some excess liquid was decanted to the spare HLW tank. Having the spare HLW tank to hold the excess liquid and the ability to process the liquid from the spare tank to reduce its volume was critical to maintaining the waste concentration in the primary HLW tank supplying the Vitrification Facility.
Typical High-Level Waste Transfer A typical HLW transfer is performed by filling and pressurizing the mobilization pump columns with water then starting the operable mobilization pumps in the HLW tank. Pump positioner and pump speeds, as well as the starting sequence and relative start times, are planned prior to the transfer based on prior transfer performance data, tank level, in-tank video camera surveillance, and previous mobilization pump operating parameters. When necessary, mobilization, pump rotation is stopped at a specific location or rotated (swept) through a partial arc to focus one discharge jet at a specific tank region and mobilize solids accumulated beyond the normal cleaning radii of the installed mobilization pumps. Mobilization pumps are generally operated between 30 minutes and 8 hours (normally 1 to 3 hours) prior to the start of the HLW transfer, to hydraulically lift the settled solids off the tank bottom and slurry them with the supernatant. The mobilization pumps continued to operate throughout the waste transfer, typically 30 to 60 minutes, then were shutdown. A typical HLW transfer is performed at a 380-L/min. rate with generally 15,000 to 19,000 L transferred. The transfer pump is operated and monitored via a PLC. A chart recorder displays transfer pump current, waste flowrate, and pump discharge pressure to provide online trending of the key process parameters. The online radiation probe is monitored on a chart recorder and compared to previous transfers. Based on the radiation probe output, the mobilization pump speeds, pump positioner speeds and/or rotational direction, and transfer pump speed are adjusted to maximize the effectiveness of the waste transfer. Based on the Vitrification Facility’s time to concentrate the waste by evaporation, transfers within a single vitrification feed batch occur approximately 2-1/2 days apart.
Waste Mobilization and Removal Effectiveness From the first waste removal on June 24, 1996, through September 30, 1998, 5.70 million curies of the estimated 5.80 million curies of Cesium-137 originally stored on zeolite in this HLW tank since 1995/1996 have been removed for a 98% recovery. Sludge/Strontium-90 recovery has been slightly less with 4.98 million curies removed through September 30, 1998, for a greater than an 86% recovery. This is not surprising since the sludge was deposited into the tank from spent fuel reprocessing operations between 1966 and 1972 and has consolidated over the years. Despite pretreatment sludge washing

E.10
operations and adding a sixth mobilization pump into the HL W tank, and based on in-tank video camera inspections, there continued to be an accumulation of solids under the M-7/M-8 riser area (Figure 3) on the tank bottom. This area was apparently at the edge of the cleaning radii of the adjacent three mobil-ization pumps in the M-I, M-2, and M-6 risers. Originally, these accumulated solids became visible above the tank liquid at a level of 56 cm in mid-April 1998. But, by continuing to direct or fix the adjacent mobilization pump jets at this area periodically while processing down the tank level, the height of the accumulated solids has been reduced to less than 2 cm. Mobilization and removal of these solids and radioactivity will continue in Fiscal Year 1999 (FY1999).
Process Improvements A number of both hardware and operational improvements were incorporated into the HLW mobilization and transfer process during the past 32 months. Some improvements proved quite challenging to implement while continuing to operate the process.
Hardware Improvements Approximately four months prior to the first HLW transfer to the Vitrification Facility, one of the five installed mobilization pumps in the primary HLW tank failed. The reason for the failure is unknown, but through testing it was determined that the key securing the pump’s impeller to the 15-m-long shaft had apparently sheared rendering the pump inoperable. The impeller-to-volute clearances are tight; less than 2 mm, with 15 m of shaft above the pump. Possibly differential thermal expansion between the 17-4 PH shaft and the 304 stainless steel pump column, resulting from just filling the column with water prior to pump startup, caused the impeller to impact the volute and shear the key, or perhaps some foreign object was drawn into the 9.5-mm-square openings in the pump suction screen and wedged between the impeller and volute. Although too late for this pump, all nine remaining mobilization pumps were modified by replacing the easily accessible motor coupling key so that the motor coupling key would fail prior to shearing the impeller key, which is just above the bottom of the HLW tank and extremely inaccessible. In addition, impeller-to-volute clearances were expanded slightly on the other pumps to allow for some additional differential growth between the shaft and pump column, resulting in somewhat lower output. Design specifications for spare pumps were modified to specify a Nitronic-50Tm shaft material that has a coefficient of thermal expansion much closer to the 304 stainless steel pump column. Temperature control of the water supplied to the pump columns, so that the water would be at the same temperature as the tank internal temperature was also considered but was not thought to be cost effective with the other modifications made. The mobilization pumps have performed very well, although the major complaint is that the water-filled columns providing lubrication and cooling to the nine driveline bearings leak clean water into the HLW tank creating more waste liquid to process. Operable mobilization pump leakage rates vary from none to 19 L/min. In the past, two pumps leaked at over 50 L/min. which rendered them inoperable until modifications were incorporated into the pumps. The source of the leak is the lower mechanical seal between the pump shaft and the pressurized water column. Replacement pump specifications have required a different mechanical seal that prohibits torquing the bellows portion of the seal if the seal faces stick during pump startup. To reduce the leakage with the previously inoperable pumps, a 14-m-long spray assembly was developed to spray a small but controlled amount of water at each internal bearing.

E.11
The spray assembly is installed into the pump column that uses approximately 15 L/min. with a supply pressure of 7.7 kg/cm2. The concept was tested before actual deployment into the WVDP mobilization pumps at the Savannah River Site’s (SRS) Mobilization Pump Test Facility by the Westinghouse Savannah River Company (WSRC). The successful deployment of this system has allowed the WVDP to again operate these pumps without the immediate heed to replace them. This innovative modification has avoided significant costs in dollars, labor, and radiological dose. Mobilization pumps were originally installed into the HLW tanks based on best available survey data and as-built data on the tanks themselves. The pump suctions were approximately 10 cm above the tank bottom with the discharge jets just below the girder portion of the tank bottom reinforcing (Figure 3). All pumps have since been lowered to within 4 cm of the tank bottom to provide additional clearance between the jet centerlines and the tank structural gridwork. This has improved the effective solids mobilization radius of each pump and allows them to be operated at lower tank levels. Variable frequency drives (VFDs) were added to the mobilization pump rotary gearmotor positioners to be able to adjust the rotational speed of the entire pump assembly which allows the pump discharge jets to turn at any speed up to 2 rpm. This was found to be helpful in operating in one of two modes: slow rotational speeds for a maximum solids cleaning radius around each pump by scouring solids up from the tank bottom, and faster speeds to better retain the solids in suspension once lifted off the tank bottom. The VFDs were also used on the rotary positioners of the mobilization pumps near the transfer pump suction to limit the amount of solids jetted to the transfer pump so as to avoid plugging its suction strainer with solids without having to reduce the actual mobilization pump motor speed and limit jet velocity. By running the pump positioners at a faster speed, the discharge jets sweep by the transfer pump suction quicker, so plugging the strainer with solids is reduced. In-tank video cameras were deployed with lights and remotely operated pan-tilt assemblies to monitor waste removal progress, observe mobilization pump operation and lower seal in-leakage, and estimate remaining waste volumes. Two cameras on opposite sides of the tank worked very well, especially with supplemental lighting added. A simple radiation probe installed along the HLW transfer line inside its shielded trench proved valuable to monitor the Cesium-137 concentration in the waste being removed. Radiation probe output was used as the basis for adjustments to mobilization pump speeds, pump positioner speeds and rotational directions, and the transfer pump flowrate/speed, to maximize the concentration of the waste being removed. Radiation probe readings were also useful to indicate when debris built up around the transfer pump suction, limiting solids removal. Due to the volumes of water being added to the HLW tanks as a result of leaky mobilization pump seals, the utility water system was replaced with a demineralized water supply system to limit unwanted chemical addition, primarily calcium, to the waste. The demineralized water supply is sized to provide faster pump column filling and accommodates the leakage rate of all mobilization pumps in either HLW tank. This system will also supply the remotely operated sluicer which is currently being installed into the spare HLW tank to aid in zeolite heel removal.
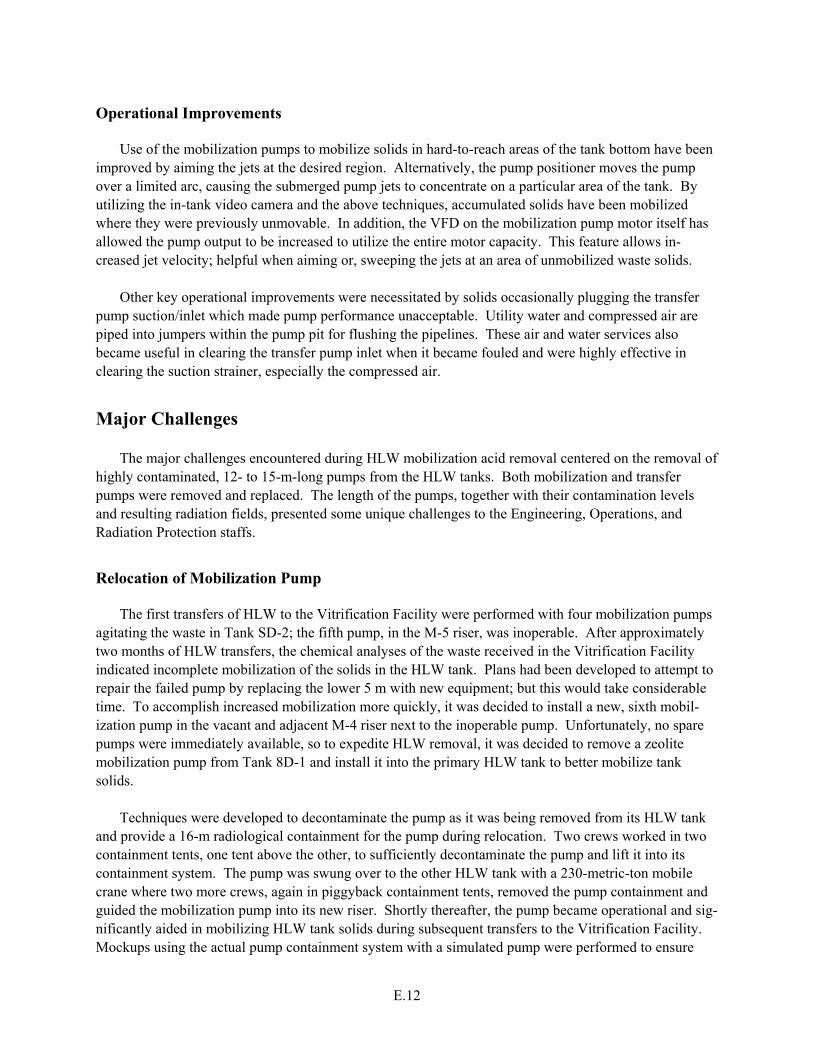
E.12
Operational Improvements Use of the mobilization pumps to mobilize solids in hard-to-reach areas of the tank bottom have been improved by aiming the jets at the desired region. Alternatively, the pump positioner moves the pump over a limited arc, causing the submerged pump jets to concentrate on a particular area of the tank. By utilizing the in-tank video camera and the above techniques, accumulated solids have been mobilized where they were previously unmovable. In addition, the VFD on the mobilization pump motor itself has allowed the pump output to be increased to utilize the entire motor capacity. This feature allows in-creased jet velocity; helpful when aiming or, sweeping the jets at an area of unmobilized waste solids. Other key operational improvements were necessitated by solids occasionally plugging the transfer pump suction/inlet which made pump performance unacceptable. Utility water and compressed air are piped into jumpers within the pump pit for flushing the pipelines. These air and water services also became useful in clearing the transfer pump inlet when it became fouled and were highly effective in clearing the suction strainer, especially the compressed air.
Major Challenges The major challenges encountered during HLW mobilization acid removal centered on the removal of highly contaminated, 12- to 15-m-long pumps from the HLW tanks. Both mobilization and transfer pumps were removed and replaced. The length of the pumps, together with their contamination levels and resulting radiation fields, presented some unique challenges to the Engineering, Operations, and Radiation Protection staffs.
Relocation of Mobilization Pump The first transfers of HLW to the Vitrification Facility were performed with four mobilization pumps agitating the waste in Tank SD-2; the fifth pump, in the M-5 riser, was inoperable. After approximately two months of HLW transfers, the chemical analyses of the waste received in the Vitrification Facility indicated incomplete mobilization of the solids in the HLW tank. Plans had been developed to attempt to repair the failed pump by replacing the lower 5 m with new equipment; but this would take considerable time. To accomplish increased mobilization more quickly, it was decided to install a new, sixth mobil-ization pump in the vacant and adjacent M-4 riser next to the inoperable pump. Unfortunately, no spare pumps were immediately available, so to expedite HLW removal, it was decided to remove a zeolite mobilization pump from Tank 8D-1 and install it into the primary HLW tank to better mobilize tank solids. Techniques were developed to decontaminate the pump as it was being removed from its HLW tank and provide a 16-m radiological containment for the pump during relocation. Two crews worked in two containment tents, one tent above the other, to sufficiently decontaminate the pump and lift it into its containment system. The pump was swung over to the other HLW tank with a 230-metric-ton mobile crane where two more crews, again in piggyback containment tents, removed the pump containment and guided the mobilization pump into its new riser. Shortly thereafter, the pump became operational and sig-nificantly aided in mobilizing HLW tank solids during subsequent transfers to the Vitrification Facility. Mockups using the actual pump containment system with a simulated pump were performed to ensure

E.13
readiness and to train all personnel involved in this difficult job. Despite a 5 R/hr gamma field, 1 m away from the pump bottom, the entire relocation was performed with a whole body collective dose of less than 300 mR.
Replacement of Inoperable Mobilization Pump HLW mobilization and removal operations continued with five operating mobilization pumps during most of 1997, but as the HLW inventory became smaller, analytical data again indicated that the expected mass of solids in the tank were not being fully mobilized. It was decided that the inoperable pump would have to be replaced with a spare pump that had been fabricated earlier in the year. Removal of this pump was more difficult than the first one removed since it was highly contaminated with both high-energy beta and gamma emitters. In addition, a limited amount of high-activity solids were expected to be found trapped in the pump column due to the lower mechanical seal leakage path. The pump had also sat with its bottom end submerged in the tank solids, inoperable for approximately two years, while the other mobilization pumps agitated the waste. With the sheared impeller key on this pump, it could not be operated to attempt to dislodge solids packed in and around its suction. The containment system employed earlier on the first mobilization pump relocation was employed with minor improvements learned from its first use. A much more aggressive water decontamination system was developed and deployed into the riser around the pump to reduce the radiation levels to workable limits. Additional decontamination of the pump internals and the suction proved necessary due to the greater than 100 R/hr gamma field measured at the pump bottom. In response to these measure-ments, an air sparge was established through the existing sluicer ring under the pump suction while an electric gearmotor was used to slowly rotate the pump shaft. As it turned out, the slow shaft speed caused the impeller to rotate despite the sheared impeller/shaft key. The pump shaft was raised and lowered with the impeller slowly turning to scrape solids off the bottom and top of the volute cavity and help eliminate them from inside the pump casing, all the while sparging compressed air under the pump inlet. In addi-tion, the area just above the impeller was purged with both compressed air and water. Decontamination efforts proved to be sufficient to meet preestablished radiological limits. The pump was successfully raised out of the tank into its containment system and repositioned in an open riser in the spare HLW tank where it could potentially be repaired or further decontaminated in the future. Despite internal and external decontamination efforts, the pump’s lower mechanical seal area .still had a hot spot of 8 R/hr gamma. However, due to the extensive mockups, innovative hardware design, and personnel preparation, the combined whole body dose for the 12 major participants in the relocation totaled less than 400 mR. Pump removal was the difficult task: especially during Western New York’s most severe winter months of January through March. The spare mobilization pump was subsequently installed and became operational on April 21, 1998. Its operation, along with the other five operating mobilization pumps, improved agitation of the tank solids in that region of the HLW tank.
High-Level Waste Transfer Pump Replacement The HLW transfer pump in the primary HLW tank that supplies the Vitrification Facility began to develop difficulties in November 1997 after 45 transfers of waste, which constitutes approximately 100 hours of pump operation. The pump began running rougher in general and, under certain
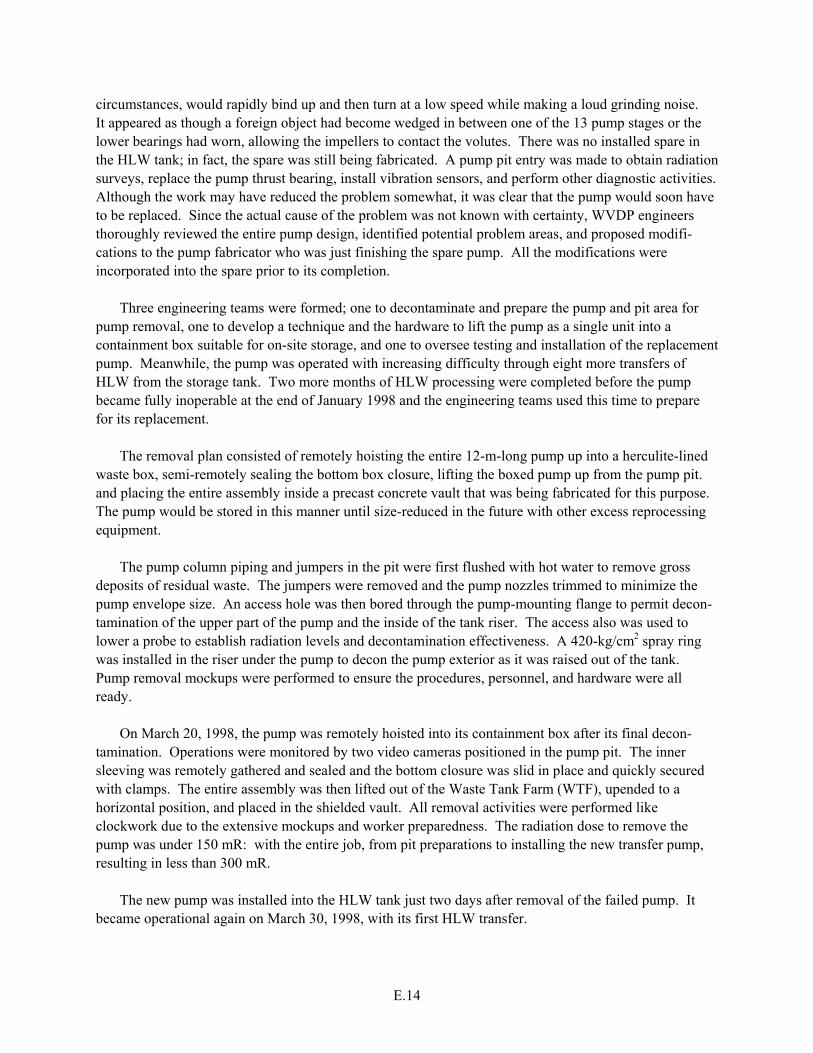
E.14
circumstances, would rapidly bind up and then turn at a low speed while making a loud grinding noise. It appeared as though a foreign object had become wedged in between one of the 13 pump stages or the lower bearings had worn, allowing the impellers to contact the volutes. There was no installed spare in the HLW tank; in fact, the spare was still being fabricated. A pump pit entry was made to obtain radiation surveys, replace the pump thrust bearing, install vibration sensors, and perform other diagnostic activities. Although the work may have reduced the problem somewhat, it was clear that the pump would soon have to be replaced. Since the actual cause of the problem was not known with certainty, WVDP engineers thoroughly reviewed the entire pump design, identified potential problem areas, and proposed modifi-cations to the pump fabricator who was just finishing the spare pump. All the modifications were incorporated into the spare prior to its completion. Three engineering teams were formed; one to decontaminate and prepare the pump and pit area for pump removal, one to develop a technique and the hardware to lift the pump as a single unit into a containment box suitable for on-site storage, and one to oversee testing and installation of the replacement pump. Meanwhile, the pump was operated with increasing difficulty through eight more transfers of HLW from the storage tank. Two more months of HLW processing were completed before the pump became fully inoperable at the end of January 1998 and the engineering teams used this time to prepare for its replacement. The removal plan consisted of remotely hoisting the entire 12-m-long pump up into a herculite-lined waste box, semi-remotely sealing the bottom box closure, lifting the boxed pump up from the pump pit. and placing the entire assembly inside a precast concrete vault that was being fabricated for this purpose. The pump would be stored in this manner until size-reduced in the future with other excess reprocessing equipment. The pump column piping and jumpers in the pit were first flushed with hot water to remove gross deposits of residual waste. The jumpers were removed and the pump nozzles trimmed to minimize the pump envelope size. An access hole was then bored through the pump-mounting flange to permit decon-tamination of the upper part of the pump and the inside of the tank riser. The access also was used to lower a probe to establish radiation levels and decontamination effectiveness. A 420-kg/cm2 spray ring was installed in the riser under the pump to decon the pump exterior as it was raised out of the tank. Pump removal mockups were performed to ensure the procedures, personnel, and hardware were all ready. On March 20, 1998, the pump was remotely hoisted into its containment box after its final decon-tamination. Operations were monitored by two video cameras positioned in the pump pit. The inner sleeving was remotely gathered and sealed and the bottom closure was slid in place and quickly secured with clamps. The entire assembly was then lifted out of the Waste Tank Farm (WTF), upended to a horizontal position, and placed in the shielded vault. All removal activities were performed like clockwork due to the extensive mockups and worker preparedness. The radiation dose to remove the pump was under 150 mR: with the entire job, from pit preparations to installing the new transfer pump, resulting in less than 300 mR. The new pump was installed into the HLW tank just two days after removal of the failed pump. It became operational again on March 30, 1998, with its first HLW transfer.

E.15
The replacement transfer pump included design improvements to address potential causes of the original failure, plus its suction was completely redesigned to attempt to minimize suction plugging and maximize suction velocity to the extent possible. The replacement pump had a dual strainer with the outer strainer having over three times the area of the original. Its suction also had a radial inlet instead of a bottom inlet. Laboratory tests performed at the Westinghouse Science and Technology Center (WSTC) on the new design confirmed its ability to remove larger particle solids from the HLW tanks. This replacement pump has operated flawlessly since it was placed into service.
Lessons Learned The 1/6-scale testing (Reference 3) performed at the WVDP from 1985 to 1986 provided the basis for selection of mobilization and transfer equipment for both sludge and zeolite. Small-scale mixing pumps were used with actual zeolite and kaolin clay to simulate the PURER sludge. The testing demonstrated that five mobilization pumps, with a sluicer that can be positioned at various locations in the tank, can mobilize and remove over 95% of the waste. These test results closely mirror the actual zeolite and HLW sludge removal efforts to date. Although the tests had their limitations, such as not simulating the con-solidation of sludge over time with the associated decay heat present, the testing provided very valuable information that resulted in an effective HLW mobilization and transfer system. The sludge mobilization testing seems to better reflect actual operational experience than the zeolite removal testing. This may be due to reuse of the zeolite in the l/6-scale testing which may have broken down the zeolite into smaller particle sizes which are fluidized easier, or perhaps the zeolite that was stored in the actual HLW tank for up to seven years has changed characteristics or agglomerated into larger-size particles that are more difficult to fluidize. Another factor to be considered is the degree of conservatism to apply to the test data for use as design inputs. If the testing indicated the need for five operating pumps, should six or more be installed to ensure adequate mobilization of the entire tank bottom? This factor should be considered especially in light of the real possibility of pump failures and the difficulty in their replacement. Obvi-ously, there is a balance that must be struck between a bare bones design and an overly conservative and costly design. The second area recognized is the balance between a simple system, with a low installed cost, and a more involved system with provisions for easy equipment servicing. Having the transfer pump motors, pump tachometer, and valve position switches inside the heavily shielded pump pits was an easy, cost-effective design. But after operating the system for nearly three years, replacement and adjustment of value position switches, and replacing one transfer pump, a few lessons learned would be:
• Position as much equipment as possible outside the pump pit so it can be serviced easier; i.e., valve position switches, pump motors, tachometer, pressure transmitter, temperature indicator, etc. Having these outside the pit eliminates the need for entries into potentially highly contaminated areas and keeps more equipment clean.
• The shielded pump pit should be easy to access if required for maintenance or service, however, the WVDP transfer pit covers must be removed with a specially leased, 230-metric-ton crane due to the weight of the covers and the required reach. If redesigning a similar system, consideration should be given to an overhead gantry or monorail crane/hoist, or reducing the weight of individual covers while increasing their number to maintain the equivalent amount of shielding. At the WVDP, a weather shelter is located directly over the pump pit covers and must be removed prior to pit cover

E.16
removal. Certainly a larger, more costly weather enclosure could have been built around the covers so they could be removed within it. The enclosure could also serve as a radiological containment for pit entries.
• All rotating equipment, inaccessible within pump pits should be fitted with vibration sensors and tachometers, including spares. These will allow personnel to monitor for equipment wear, predict remaining lifetimes, and establish limits at which equipment is secured prior to reaching a damage threshold. In addition, tachometers are essential in determining the actual speed at which the equip-ment is operating in diagnostic work and are useful in measuring how freely the equipment turns in coast down mode.
Fiscal Year 1999 waste removal efforts are focused on waste removal from the spare HLW tank (Figure 4). To support removal of as much of the remaining zeolite as possible, the mobilization pumps have been lowered further under the tank bottom gridwork to maximize their jet effectiveness and provide pump operability at lower tank levels. An inoperable mobilization pump, temporarily stored in this tank, has been removed and replaced with a new mobilization pump. In addition, upgrades have been made to replace the mobilization pump VFDs, and VFDs have been added to the pump positioner gearmotors to adjust pump rotation within the risers between 0 to 2 rpm. One mobilization pump had leaked column water at a >50 L/min. rate, which rendered the pump inoperative. To address this problem, a driveline bearing-spray assembly was designed, fabricated, tested, and installed into this pump column to spray a small quantity of water at each of the eight internal bearings. The pump is now operable, although the
Figure 4. HLW Tank 8D-1 Plan View

E.17
water addition rate is approximately IS L/min. In the big picture, this water addition can be managed by existing processes therefore replacement of this expensive and highly contaminated pump has been avoided. The five operating mobilization pumps are currently being used to mobilize the zeolite within the tank so that the transfer pump can remove the slurry and transport it to the main HLW tank. A remotely operated and positioned sluicer assembly is being installed into an empty tank riser to aid in zeolite removal. The sluicer is supplied with clean, demineralized water at 7 kg/cm2 or it can utilize the radioactive tank liquid. Its functions are to wash off internal tank surfaces, move deposited zeolite under this area of the tank back to where the mobilization pumps can draw it into the agitated slurry, sluice or feed zeolite to the transfer pump suction in the adjacent riser, and clear the inlet to the transfer pump of debris if required. The sluicer assembly also features two radiation-resistant cameras with lights positioned on pan/tilt units on the end of arms. These arms traverse up and down the deployment mast and will position the in-tank cameras to monitor tank clean-out activities. An in-tank video camera is also in place in the M-4 riser, and another camera installation is planned for the N-12 riser. By September 30, 1999, it is expected that less than 3% of the original radioactivity, or a maximum of 160,000 curies of Cesium-137, will remain in the spare HLW tank. Other, more advanced, waste-removal equipment is being developed to assist in its subsequent removal. Another area that sometimes receives inadequate attention during design phases is the radiological requirements needed to replace a highly contaminated piece of equipment; i.e., a l5-m, 4,000-kg mobilization pump that is reading over 100 rads/hr gamma at the bottom where it was pumping sludge and zeolite. To remove highly contaminated pumps, it was decided to fabricate and deploy high-pressure (420-kg/cm) spray rings down into the HLW tank’s risers to decon the pumps as they were being removed instead of utilizing the 14-kg/cmz spray nozzles built into the risers. Deployment of the spray rings was more difficult, but much-more effective in decontamination, than the low-pressure spray system. Prior to installing any equipment into a HLW tank, the equipment’s failure at the most inappro-priate time should be anticipated and a recovery plan with appropriate equipment (or at least the con-ceptual design of it) should be available to address the situation. This concept could be taken to the extreme; clearly a balance again is needed to plan for the most likely failures and those with the highest consequences. Mockups have been extremely valuable, in the removal and replacement of highly contaminated equipment. The WVDP has invested considerable resources to construct two outdoor platforms with heights of 14 m and 17 m as well as an indoor platform. These platforms are used to simulate the height of the HLW tank and its riser connection. Prior to most equipment being installed into the HLW tanks, the components are first installed in the platforms where they undergo final testing and checkout while personnel are trained in the operation of the systems. Equipment tested in these platforms includes a HLW supernatant decant pump, replacement HLW transfer pump, dual-arm camera system, and the mast-mounted delivery system with its remotely operated sluicer arm and dual-camera arm systems. Equip-ment removal from the HLW tanks is also mocked up and practiced using these facilities. Remote tooling, hardware, fixtures, and contamination-control systems are checked out and adjusted until the equipment and personnel are ready to perform the actual “hot” work. In addition; key activities are practiced to minimize and determine stay times so that realistic dose estimates can be developed and proper radiological hold points can be incorporated into the field work instructions. The extensive use of mockups has resulted in better hardware design, more operator input into the jobs they perform, increased ownership in the activity, safer operations, reduced worker doses, and less unanticipated situations in the

E.18
field. Mockups have been performed in conjunction with the relocation, size-reduction, and replacement of 15-m-long mobilization pumps; the replacement of the original HLW transfer pump; and the potential future replacement of the HLW supernatant decant pump. Mockups will continue to be utilized at the WVDP in order to perform highly contaminated work safely and with worker doses as low as reasonably achievable (ALARA).
Current and Future Waste Heel Removal As shown in Table IV, there is approximately 0.66 million curies of mostly Cesium-137 remaining on zeolite in the spare HLW tank, Tank 8D-1, and 0.76 million curies of predominantly Strontium-90 remaining in the sludge within the primary HLW tank, Tank 8D-2, supplying the Vitrification Facility.
Table IV. Cesium and Strontium Processing Summary as of September 30, 1998(a)
Cs-137 (MCi) Sr-90 (MCi) Cs-137 and Sr-90 (MCi)
Processed-to-Date Through Batch 67, HLW Transfer 58
5.70 4.98 10.68
Remaining in Tank 8D-1 0.56 0.10 0.66
Remaining in Tank 8D-2 0.03 0.73 0.76
Totals 6.29 5.81 12.1 (a) January 1, 1996, Activity Basis.
Waste mobilization and removal from the primary HLW tank, Tank 8D-2, will resume after sufficient zeolite is added to it from the spare HLW tank. Removal efforts in FY 1999 include the use of the six mobilization pumps and the addition of either a seventh mobilization pump or a sluicing arm in the M-7 riser (Figure 3). The equipment in the M-7 riser is needed to mobilize the accumulated solids remaining on the tank bottom in this area, at the limit of the adjacent mobilization pump jets. It is projected that by the, end of FY 1999, less than 0.76 million curies will remain in this HLW tank. Processing from this tank will continue in FY2000 and FY2001 using existing mobilization pumps and more advanced, waste-removal equipment currently being developed.
Summary and Conclusion The WVDP has successfully mobilized and transferred approximately 88% of its HLW from its underground storage tanks to the Vitrification Facility where the waste was processed into over 230 borosilicate-glass-filled containers. This processing was performed over a 32-month period using up to six, 150-hp mobilization pumps to agitate and suspend the sludge and zeolite in the HLW tank while the transfer pump sent the slurry to the Vitrification Facility. There were 102 HLW transfers performed to prepare 58 batches of melter feed. The average batch included 178,000 curies of cesium-137 and strontium-90 which are the major radionuclides. At the start of waste processing, a single transfer of HLW from the storage tank contained enough waste to produce a melter batch. As waste mobilization

E.19
and transfers continued, the resulting HLW became more dilute so that two or three transfers were required to make up batches after approximately 9 million curies (79% of the estimated tank activity) were removed. Waste dilution continued to require eight HLW transfers to produce the last vitrification batch of Calendar Year 1998 (CY 1998). Many improvements to the original installed mobilization and transfer system were incorporated during waste processing. In-line radiation probes were used to monitor end trend the activity of the waste being pumped so that mobilization and transfer pump operations could maximize waste removal. Mobilization pumps were lowered in the tank to maximize the effectiveness of their jets under the tank’s bottom gridwork and increase the waste mobilization radius around each pump, as well as allowing pump operation at lower tank levels. Mobilization pump column water infiltration into the HLW tank was minimized by water supply system modifications and the utilization of a custom spray assembly to cool and lubricate mobilization pump driveline bearings instead of maintaining liquid-filled pump columns. Mobilization pump gearmotor-driven positioners were outfitted with VFDs to be able to utilize the pump jets to both scour the solids off the tank bottom at slow rotational speeds and then better suspend the solids at the higher rotational speeds. In-tank cameras and lights provided visual verification, of the effective waste mobilization and removal process and indicated areas where additional solids mobilization was required. The previous utility water system supplying seal water to the mobilization pumps was replaced by a high-capacity demineralized water system to minimize the calcium addition to the waste. Two mobilization pumps were added to the tank; one to replace an adjacent failed pump which had left a portion of the tank solids inadequately mobilized, and another to provide additional tank waste mobilization. Operational improvements included the backflushing of the HLW transfer pump with either water or compressed air when its inlet strainer became fouled with solids or debris. Mobilization pumps were fixed or aimed in certain directions to mobilize hard-to-reach solids within the tanks while visually confirming the pumps’ effectiveness with the in-tank video camera. Vibration monitors were added to the transfer pump and were monitored for signs of accelerated pump wear. The major challenges encountered during waste mobilization and removal were:
• Relocating a contaminated, 15 m long mobilization pump from the spare HLW tank to compensate for an inoperable mobilization pump.
• Removal and replacement of the highly contaminated inoperable mobilization pump.
• Replacement of the HLW transfer pump with an improved version after the original pump became inoperable.
Each of the above three tasks involved very detailed planning to safely perform the hardware change with minimal disruption to the ongoing processing and yet maintain worker radiation doses ALARA. Remote equipment and operations were used where feasible in all three tasks. Prior to performing these difficult radioactive activities, multiple mock-ups were performed to demonstrate the operation of the equipment; verify the adequacy of work instructions, radiological containments, and dose estimates; and ensure worker familiarity with the equipment and activities. Many lessons were learned during waste mobilization and removal operations and many more will undoubtedly be forthcoming during future activities to remove the remaining waste heels from the HLW
E.20
tank bottoms. Waste recovery to date has been challenging but relatively straightforward; future waste recovery will be necessarily slower due to the small amount spread over such large tank surfaces. Plans call for new equipment to be installed into both large HLW tanks. Remotely operated sluicers with the capability to wash tank internal surfaces and move solids across the tank bottom are planned for both tanks in CY1999. The sluicers are equipped with dual-camera arms to monitor sluicer operations and waste removal effectiveness. The sluicers will be used with mobilization pumps to remove as much of the waste heels as possible over the next year while the next generation of waste removal equipment is being developed for future deployment. Current plans anticipate final waste heel removal by the end of FY200 1, subject to approval of a tank-closure plan that allows approximately 2% of the original waste to be left behind and stabilized. The WVDP’s progress and accomplishments in mobilizing, removing, and vitrifying the HLW over the last 32 months showcase the discipline of our processing operations groups, the innovative engineering approaches to challenges that always arise along the way, and the overall reliability of the processing systems.
References
1. L. E. Rykken, “High-Level Waste Characterization at West Valley,” Topical Report DOE/NE/44139-14, June 1986.
2. Daniel C. Meess, “High-Level Radioactive Waste Pretreatment at The West Valley
Demonstration Project,” Waste Management ‘96, February 1996.
3. M. A. Schiffhauer and R. E. lnzana, “Scale Model Equipment Testing,” Topical Report DOE/NE/44139-36, June 1987.

PNNL-13756
Distr. 1
Distribution No. of Copies OFFSITE B. Adkins
Westinghouse Savannah River Company 742-7G Bldg. Aiken, SC 29808
S. Barnes 10282 Rock Springs Rd. MSIN: WV-48 West Valley, NY 14171
T. B. Caldwell Westinghouse Savannah River Company 742-4G Bldg. Aiken, SC 29801
F. Damerow 10282 Rock Springs Rd. West Valley, NY 14171-9799
P. L. Davis Westinghouse Savannah River Company 742-9G Bldg. Aiken, SC 29801 E. Freed Westinghouse Savannah River Company 742-5G Bldg. Aiken, SC 29801
K. Gerdes Office of Science and Technology 19901 Germantown Road 1154 Cloverleaf Bldg. Germantown, MD 20874-1290
No. of Copies
T. S. Gutmann U.S. Department of Energy Savannah River Operations Office P.O. Box A, Bldg. 704-S Aiken, SC 29802
K. A. Lockie
U.S. Department of Energy Idaho Operations Office 750 DOE Place (MS 1145) Idaho Falls, ID 83402 B. A. Martin Westinghouse Savannah River Company 742-9G Bldg. Aiken, SC 29801
J. P. Morin Westinghouse Savannah River Company Savannah River Technology Center 703-H Building
Aiken, SC 29808 P. Mukherjee
Westinghouse Savannah River Company 742-8G Bldg. Rm. #3 Aiken, SC 29801 J. R. Noble-Dial U.S. Department of Energy Oak Ridge Operations Office P.O. Box 2001
Oak Ridge, TN 37830-8620
E. Saldivar Westinghouse Savannah River Company 742-4G Bldg. Aiken, SC 29801

PNNL-13756
Distr. 2
No. of Copies ONSITE 20 Hanford Site
J.W. Cammann H6-22 A. B. Carlson R3-73 K.E. Carpenter S7-65 A. F. Choho H6-22 T. J. Conrads R3-8 C. DeFigh-Price R2-58 J. S. Garfield L4-07 K.A. Gasper L4-07
P.W. Gibbons (2) K6-91 M. G. Glasper K8-50 E. A. Pacquet H6-22 T. P. Pietrok K8-50 S.H. Rifaey S7-65 C. P. Shaw R4-08 D.B. Smet S7-65 W. T. Thompson S7-90 R. L. Treat H6-60 D.T. Vladimiroff S7-20 R.D. Wojtasek R2-39
No. of Copies 27 Pacific Northwest National Laboratory J. A. Bamberger K7-15 S. Q. Bennett K7-90 W. F. Bonner K9-14 J. W. Brothers K7-15 J. L. Buelt K9-09 B. A. Carteret K9-91 C. W. Enderlin K7-15 F. F. Erian (10) K7-15 B. K. Hatchell (2) K5-22 W. L. Kuhn K7-15 P.A. Meyer K7-15 O. D. Mullen K5-22 M. W. Rinker (2) K5-22 B. J. Williams K9-69 Information Release (2) K1-06 This document is also available for download Tank Technology Guide: www.tanks.org