EXPENSES TRACKER SYSTEM USING LEAST SQUARE METHOD …
72
EXPENSES TRACKER SYSTEM USING LEAST SQUARE METHOD SITI ZULAIKHA BINTI MAHIZAN BACHELOR OF COMPUTER SCIENCE (SOFTWARE DEVELOPMENT) WITH HONOURS UNIVERSITI SULTAN ZAINAL ABIDIN 2020
Transcript of EXPENSES TRACKER SYSTEM USING LEAST SQUARE METHOD …

EXPENSES TRACKER SYSTEM USING LEAST
SQUARE METHOD
SITI ZULAIKHA BINTI MAHIZAN
BACHELOR OF COMPUTER SCIENCE
(SOFTWARE DEVELOPMENT) WITH HONOURS
UNIVERSITI SULTAN ZAINAL ABIDIN
2020

EXPENSES TRACKER SYSTEM USING LEAST SQUARE METHOD
SITI ZULAIKHA BINTI MAHIZAN
BACHELOR OF COMPUTER SCIENCE (SOFTWARE
DEVELOPMENT) WITH HONOURS
FACULTY OF INFORMATICS AND COMPUTING
UNIVERSITI SULTAN ZAINAL ABIDIN, TERENGGANU, MALAYSIA
JULY 2020

i
DECLARATION
I hereby declare that this report is based on my original work except for
quotations and citations, which have been duly acknowledged. I also declare that it
has not been previously or concurrently submitted for any other degree at Universiti
Sultan Zainal Abidin or other institutions.
Name : Siti Zulaikha Binti Mahizan
Date : ………………………………..

ii
CONFIRMATION
This is to confirm that this project entitled Expenses Tracker System was
prepared and submitted by Siti Zulaikha Binti Mahizan (Matric Number:
BTAL17046376) and has been satisfactory in terms of scope, quality and presentation
as partial fulfillment of the requirement for the Bachelor of Computer Science
(Software Development) with honors in Universiti Sultan Zainal Abidin. The research
conducted and the writing of this report was under my supervisor.
Supervisor : Mdm. Fauziah Binti Ab Wahab
Date : ………………………………….……..

iii
DEDICATION
In the Name of Allah, the Most Gracious and the Most Merciful. Alhamdulillah
all praise to Allah s.w.t, I have completely finished writing this research project. I
would like to thanks my family and friends the most for giving me strength and
courage to finish this project. Here I would to give my gratitude to my supervisor,
Mdm. Fauziah Binti Ab Wahab, for her guidance and support throughout the process
of completing this project. Last but not the least, thank you to everyone that either
directly or indirectly involved in the process of establishing the system and
documentation.
Thank you.

iv
ABSTRACT
These days, with a fast-paced of lifestyle, people tend to overlook their budget
planning. Some would spend more than necessary and some might be under-budgeted
to buy their necessities because they have spent too much on other stuff. Making sure
having a concrete budget planning is crucial so that people would not face any
financial issues in the future.
The Expenses Tracker System is developed to keep track of users’ spending and
make a prediction for their budget monthly. The system should be able to generate
reports of their spending and notify users if they have exceeded their budget. The
system is designed to be dynamic as it used least square method to produce the
prediction. The system also provides users’ personal information, their income as well
as their expenses. Expenses Tracker System will be an approach for people to control
their spending better in more efficient ways.

v
ABSTRAK
Hari ini, dengan gaya hidup yang pantas, orang ramai cenderung untuk
mengabaikan perancangan bajet mereka. Sesetengah akan menghabiskan lebih
daripada yang perlu dan sesetengah mungkin mempunyai bajet di bawah dari apa
diperuntukkan bagi keperluan mereka kerana telah menghabiskan terlalu banyak duit
ke atas barangan lain. Memastikan seseorang mempunyai perancangan bajet yang
kukuh adalah penting supaya mereka tidak akan menghadapi kesulitan kewangan
pada masa akan datang.
Expenses Tracker System dibangunkan untuk mengawal perbelanjaan pengguna dan
membuat ramalan untuk bajet setiap bulan. Sistem ini sepatutnya dapat menjana
laporan perbelanjaan mereka dan memaklumkan kepada pengguna jika mereka telah
melebihi belanjawan mereka. Sistem ini direka untuk menjadi dinamik kerana ia
menggunakan kaedah least square method untuk menghasilkan ramalan. Sistem ini
juga menyediakan maklumat peribadi pengguna, pendapatan serta perbelanjaan
mereka. Expenses Tracker System akan menjadi satu pendekatan kepada orang ramai
untuk mengawal perbelanjaan mereka dengan lebih baik dengan cara yang lebih
cekap.

vi
CONTENTS
DECLARATION i
CONFIRMATION ii
DEDICATION iii
ABSTRACT iv
ABSTRAK v
CONTENTS vi
LIST OF TABLES x
LIST OF FIGURES xii
CHAPTER I 1
INTRODUCTION 1
1.1 Background 1
1.2 Problem Statement 2
1.3 Objectives 3
1.4 Scope 3
1.5 Limitations 4
1.6 Implementation And Planning 4
1.7 Expected Result 5
1.8 Summary 5

vii
CHAPTER II 6
LITERATURE REVIEW 6
2.1 Introduction 6
2.2 Related Research And Technique 7
2.3 Related Software 9
2.5 Summary 9
CHAPTER III 10
METHODOLOGY 10
3.1 Introduction 10
3.2 Waterfall Methodology 11
3.2.1 Phase 1: Requirement Gathering 12
3.2.2 Phase 2: System Design 12
3.2.3 Phase 3: Implementation 12
3.2.4 Phase 4: Testing 13
3.2.5 Phase 5: Deployment 13
3.2.6 Phase 6: Maintenance 13
3.3 System Requirement 14
3.3.1 Software Requirement 14
3.3.2 Hardware Requirement 15
3.4 System Design And Modelling 16
3.4.1 Framework Design 17
3.4.2 Context Diagram 18
3.4.3 Data Flow Diagram 19

viii
3.5 Entities Relationship Diagram(ERD) 25
3.5.1 Data Dictionary 27
CHAPTER IV 31
IMPLEMENTATION 31
4.1 Introduction 31
4.2 Implementation and Output 31
4.3 Design Interface 32
4.3.1 Login page 32
4.3.2 Register/Sign up page 33
4.3.3 Dashboard 34
4.3.4 User profile 35
4.3.6 Budget page 36
4.3.6 Income page 37
4.3.7 Expense Page 38
4.3.8 Report page 39
4.4 Testing Analysis 40
4.5 Test Cases 40
4.6 Summary 48
CHAPTER V 49
RESULT AND CONCLUSION 49
5.1 Introduction 49
5.2 Project Contribution 49
5.3 Discussion 50

ix
5.4 Project Constraint and Limitation 51
5.5 Future Work 52
5.6 Conclusion 52
REFERENCES 53
APPENDIX 55

x
LIST OF TABLES
TABLE TITLE PAGE
1.1
3.1
3.2
3.3
3.4
3.5
3.6
3.7
4.1
4.2
4.3
4.4
4.5
4.6
4.7
4.8
Gantt Chart
List of software requirements
List of hardware requirements
Users Table
Income Table
Expenses Table
Category Table
Budget Table
Login page
Sign up page
Dashboard page
User profile page
Budget page
Income page
Expense page
Report page
4-5
14
15
28
28
29
29
30
32
33
34
35
36
37
38
39

xi

xii
LIST OF FIGURES
FIGURE TITLE PAGE
3.1
3.2
3.3
3.4
3.5
3.6
3.7
3.8
3.9
3.10
3.11
4.1
4.2
4.3
4.4
Waterfall Methodology
Framework design for the system
Context Diagram of the system
DFD Level 1 for Admin
Level 1 for User
DFD Level 1
DFD Level 2 Manage Income
DFD Level 2 Manage Expenses
DFD Level 2 Report Generation
Entities Relationship Diagram(ERD)
Database Design
Test Case for Successful Login
Test Case for Unsuccessful Login
Test Case for Add Expenses Details
Test Case for Delete Expenses Record
11
17
18
19
20
21
22
23
24
25
26
41
42
43
44

xiii
4.5
4.6
4.7
Test Case for Update User Profile
Test Case for Success Generate Report
Test Case for Failed Generate Report
45
46
47

1
CHAPTER I
INTRODUCTION
1.1 Background
Management of finance and accounts has been an actual issue for a long time.
People are less likely to keep track of their spending, be it, in checkbook or even
spreadsheets. Despite that, for the recent decades, it has got a new perspective with
the advent of modern technologies and the internet which is becoming more and more
accessible.
Expenses Tracker is a way that can help us to keep up with our spending. Not
only that, it can help us pinpoint areas that we have been spending and track
upcoming bill payments.
It is a web-based system that can keep track of their expenses and determine
whether they are spending as per their set budget. Potential users need to input the
required data such as the expense amount, merchant, category, and date when the
expense was made. This mobile system is a full detailed expense tracker tool that will
not only help users keep a check on their expenses, but also cut down the unrequired
expenses, and thus will help provide a responsible lifestyle.

2
1.2 Problem Statement
As for the time being, there a lot of budget planner software that are available
online but some of these software fall short in helping users to actually create and
stick to a budget.
One of the drawbacks is the on-going maintenance, a lot of budget software offer
the simplicity of integrating with all users financial accounts and consolidating their
activity into one dashboard. However though, some of this existing software mostly
have complicated features that are not user friendly.
Also, due to the busy and hectic lifestyle people tend to overlook their budget and
end up spending an excessive amount of money since they usually didn’t plan their
budget wisely. Last but not least, user cannot predict future expenses. While they can
write down their expenses in a piece of paper or manage them in excel spreadsheet,
their lack of knowledge in managing finances will be a problem.
3
1.3 Objectives
1. To design a user friendly and an attractive interface so that users can easily access
the system.
2. To develop a systematic system that will help to improve users’ financial
management and forecast future budget planning.
3. To test and evaluate the reliability of the system to generate monthly report and
forecast budget for the users.
1.4 Scope
The scope of this study are divided into:
Admin
l The role of an admin is to login the system to make changes or update.
l Admin can control user data and do the system maintenance.
User
l User needs to input their monthly income and expenses to manage their financial.
l Able to log in to system.
l Can view the generated report.
l Can view previous spending
4
1.5 Limitations
This system can only be used by individuals as it includes only personal expenses.
And only admin is allowed to manage the maintenance of the system. The system
cannot be performed offline.
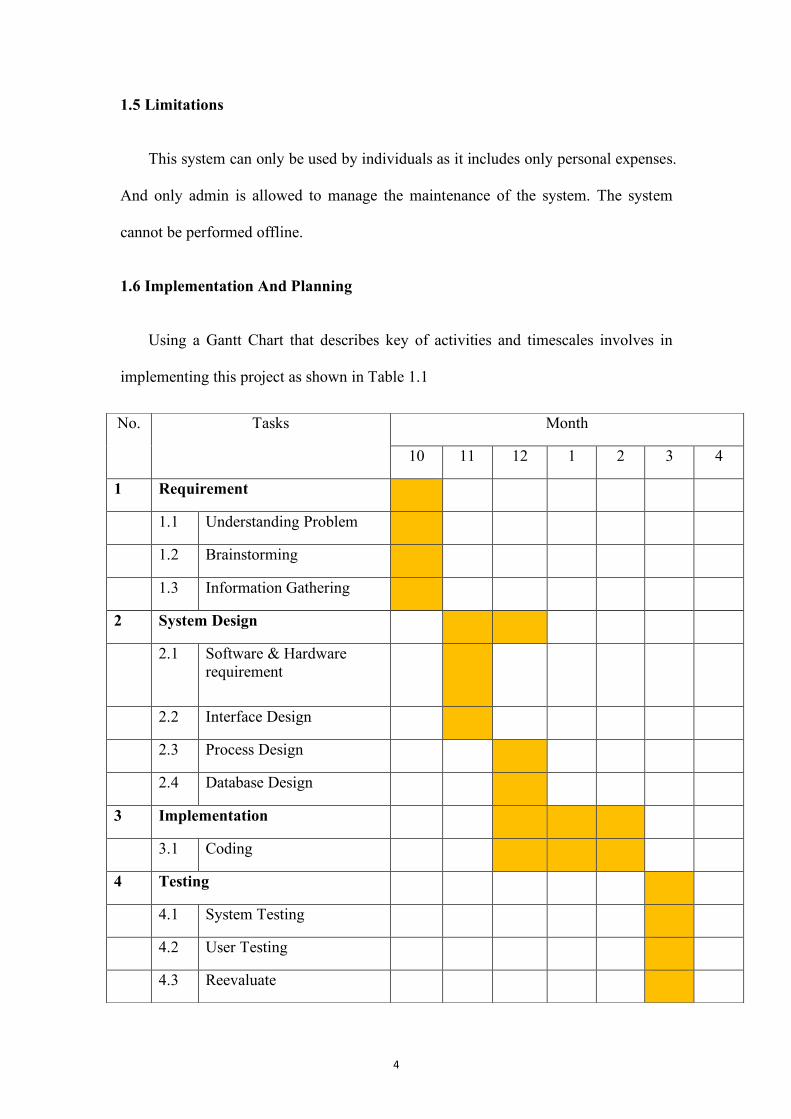
1.6 Implementation And Planning
Using a Gantt Chart that describes key of activities and timescales involves in
implementing this project as shown in Table 1.1
No. Tasks Month
10 11 12 1 2 3 4
1 Requirement
1.1 Understanding Problem
1.2 Brainstorming
1.3 Information Gathering
2 System Design
2.1 Software & Hardware requirement
2.2 Interface Design
2.3 Process Design
2.4 Database Design
3 Implementation
3.1 Coding
4 Testing
4.1 System Testing
4.2 User Testing
4.3 Reevaluate

5
Table 1.1 Gantt Chart
1.7 Expected Result
The expected outcomes from this project is that the system can precisely keeping
track of user’s expenses as well as their budgeting. A report will be automatically
generated by at the end of the month for user to review their spending. This report is
retrieved from the database that they have entered.
The goals that are achieved by the system are:
l User friendly and flexible interface.
l Efficient calculation and forecasting.
l Improved productivity
l Instant access.
1.8 Summary
The details of Expenses Tracker System has been discussed in this chapter which
include the project’s problem statements, objectives, scope, expected result and
project planning.
5 Delivery/deployment
5.1 Installation
6 Maintenance
6.1 Modifications

6
CHAPTER II
LITERATURE REVIEW
2.1 Introduction
This chapter will be focusing on the work or research that are related either
directly or indirectly to this project. This part is very important for the development of
the project as it works as a guideline. It is an evaluative report of studies found in the
literature that related to the selected area. Besides, by studying and understanding the
researches, it will help in determining the best approach for the system development.

7
2.2 Related Research And Technique
Some research and journals have been reviewed throughout this project to make
out a distinct image of it. These journals in short, works as a guide for this project to
implement Least Square Method.
Based on article [4], it discusses about regression models. Basically, it holds a
concept where we forecast the time series of interest at y-axis assuming that it has a
linear relationship with other time series at x-axis. The author [4] also stated that, the
least squares principle provides a way of determining the coefficients effectively by
minimizing the sum of the squared errors.
A study carried out by author [9], it introduces tools and methods for both finance
and accounting that help with asset pricing, corporate finance, options and futures,
and conducting financial accounting research. How least square method works and
implied in financial forecasting is discussed.
The author [2] applied several of statistical time series models to observe forecast
errors in the demand of juice production are within the expected limit and to choose a
forecasting technique which has a less relative error. The author [2] proved that Least
Square Method is more accurate than the others. Article [3] also did the study in order
to forecast milk production in India using statistical time series modeling- Double
Exponential Smoothing and Auto-regressive Integrated Moving Average and
concluded that Auto Regressive Integrated Moving Average performed better.

8
In a paper studied by [7] explains that Batch-mode Least Squares SVM (LSSVM)
is often associated with unbounded number of support vectors (SVs). This, makes it
unsuitable for applications if it involves large-scale streaming data.
In this paper [7], it explains how to train the limited-scale LSSVM dynamically.
By applying a budget online LSSVM (BOLSSVM) algorithm, methodologically, by
setting a fixed budget for SVs, LSSVM model is updated according to the current SVs
set dynamically without re-training from scratch. This way, the proposed BOLSSVM
algorithm is especially useful for online prediction tasks. Thus, batch-mode learning
methods were compared, the computational complexity of the proposed BOLSSVM
method is significantly reduced. The validity and effectiveness of the proposed
BOLSSVM algorithm is shown by the experimental results of classification and
regression on benchmark data-sets and real-world applications.
The paper [10] aims to describe a computerized system that is able to predict the
budget for the new year based on past budgets by using time series analysis. It will
then show results with most minimum errors and controls the budget during the year.
Through the ability to control exchange, compared to the scheme with the investigator
and calculating the deviation, measurement of performance ratio and the growth of a
number of indicators relating to budgets, it is possible to achieve the objective. For
example, this article [10] uses the rate of condensation of capital, the growth rate and
profitability ratio and gives a clear indication whether these ratios are good or not.

9
2.3 Related Software
One of the most common existing software that is related to this project is MINT.
Mint was formally introduced in September 2007. it is a server-based web, but this
software also can be used using PC or smart-phone.
Based on a research from author [1], MINT is aware of users’ daily expense and
if they have a future goal of buying something, user can reduce your current spending
according to it. Most importantly, it keeps a track on users’ credit bills, home bills and
savings. This budgeting software also will notify users whenever user are due to pay a
bill or payment. This will lower the chance for users to forget to make payment.
Despite having some great advantages, MINT also comes with a plenty of
drawbacks such as there no guarantee of the security in this online software. The
chances of getting their account hacked is worrisome as this software stores users’
financial account. The rivalry from other potential software also becomes one of the
big factor. Website has too many ads while browsing through finances.
2.5 Summary
In conclusion, the selection of accurate technique is very important to make sure
that the system successfully implemented and achieved the objective. The selected
technique is artificial neural networks that can be able to predict the financial forecast
correctly. Based on the research study, it can be conclude that the artificial neural
networks is suitable for Expenses Tracker System.

10
CHAPTER III
METHODOLOGY
3.1 Introduction
In this chapter, it will be discussing about the methodology chosen in order to
develop Expenses Tracker System. A few methodologies have been taken into
consideration such as Agile Methodology and Rapid Application Development(RAD)
Methodology. Agile is a conceptual framework for undertaking software engineering
projects. It is adaptive which means that it responds to changes well. While, RAD is
created to take the maximum advantage of the development software. It makes the
entire development process uncomplicated as it also aid client in taking quick reviews
and uses them to make improvement.
But, at the end of the day, we decided to choose Waterfall Methodology to be
implemented in this project. There are few reasons why we choose the method and
more will be discussed as we get further into this chapter.

11
3.2 Waterfall Methodology
Waterfall Methodology is also one of Software Development Life Cycle(SDLC)
approach. It is chosen to be implemented in Expenses Tracker System because it is
very simple to understand and use. In waterfall model, there will be no overlapping in
the phases as each phase must be completed before the next phase can begin. The
phases consist of requirement gathering, system design, implementation, testing and
maintenance.
Figure 3.1 Waterfall Methodology

12
3.2.1 Phase 1: Requirement Gathering
The first phase is done by brainstorming the solution for the problem occurred.
Hence, this project, Expenses Tracker System was decided. At this stage, all possible
requirements are collected in order to develop the system by doing questionnaire. The
requirements then are analyzed and documented.
3.2.2 Phase 2: System Design
During this phase, the requirements captured from the first phase are studied and
the system design for Expenses Tracker is prepared which specifies hardware and
system requirements. This is to ensure that every requirement and any related things
need to be done are suitable with the system. This stage will help in defining the
overall system architecture for Expenses Tracker System.
Designing the Context Diagram(CD), Data Flow Diagram(DFD), and Entity
Relationship Diagram(ERD) are also being done here in order to translate the process
flow of Expenses Tracker System.
3.2.3 Phase 3: Implementation
As the name implies, in this phase the source code is written as per
requirements. The information from the previous stage is taken and a working code is
written to create a functional product. Small pieces of code will be implemented and
then are integrated at the end of this phase or the beginning of the next. For Expenses
Tracker System is developed using XAMPP, MySQL and Notepad++ .

13
3.2.4 Phase 4: Testing
Once the implementation is completed, the final product of Expenses Tracker will
be tested and evaluated to find any problem that might occur on its performance. Bugs
is fixed in this phase. This is also where the system will be determine whether it meets
the requirements or not.
3.2.5 Phase 5: Deployment
In this phase, the complete product of Expenses Tracker will be released and
tested to the end-users. They will use the system and give their feedback on whether it
needs to be improved or modify. Any modifications or changes are being made based
on the feedback from the user to make sure the system is completely fulfilling the
requirements.
3.2.6 Phase 6: Maintenance
After the deployment phase, the next step is to provide support and maintenance
for the system, making sure it works perfectly as it should. If users come across any
errors, defects or bugs during the process, fixing them is the main aim of this stage.
To fix those issues, patches are released. Also some better versions are released to
enhance the product.

14
3.3 System Requirement
System requirement contains of software requirement and hardware requirement.
These are needed to ensure the accomplishment of all processes are well covered. So,
every aspect required during implementation phase needs to be determined.
3.3.1 Software Requirement
List of software required:
No. Software Purpose
1. LARAVEL Framework to develop the system.
2. Notepad++ Used for coding and as connection to
database.
3. XAMPP Used as local server.
4. MYSQL Database Acts as the database for the system.
5. WPS Office Writer Used to do the documentation for the project.
6. Flutter Framework to develop the system
7. Google Chrome A browser to run localhost and search for
information.
Table 3.1 List of software requirements
15
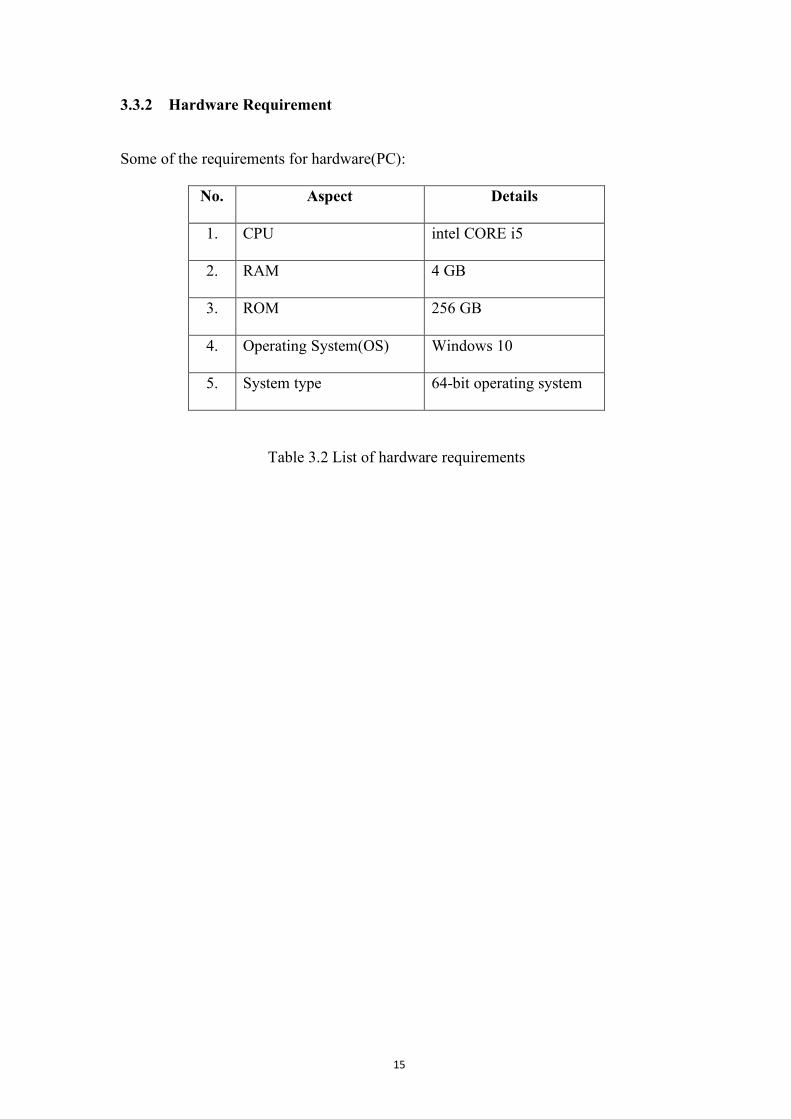
3.3.2 Hardware Requirement
Some of the requirements for hardware(PC):
No. Aspect Details
1. CPU intel CORE i5
2. RAM 4 GB
3. ROM 256 GB
4. Operating System(OS) Windows 10
5. System type 64-bit operating system
Table 3.2 List of hardware requirements

16
3.4 System Design And Modelling
Constructing a few work flow diagrams will be taken into account moving into
the next stage in the Waterfall methodology. This will help developers to define a
clearer idea based on the specified requirements. As for Expenses Tracker System, it
will include the Context Diagram and Data Flow Diagram shows the physical design
of the system while the Entities Relationship Diagram act as the logical design of the
system.

17
3.4.1 Framework Design
Figure 3.2 Framework design for the system
The framework for Expenses Tracker System includes Admin, User, Database
and the system itself. Based on Figure 3.2 above, it shows the flow of how the system
works in general where users can input their income, expense and budget to the
system and all the data will be stored in the database. From the database, the data will
be analyzed and new report and budget will be generated.

18
3.4.2 Context Diagram
LEVEL 0
Figure 3.3 Context Diagram of the system
Figure 3.2 shows the main process flow of how Expenses Tracker works. There
two entities involved, Admin and User. The role of Admin is that they can manage the
data of the user and do the maintenance. Meanwhile, user is required to register their
profile in order to use the system. User is allowed to input their income and expenses.

19
3.4.3 Data Flow Diagram
LEVEL 1
Figure 3.4 DFD Level 1 for Admin
Based on Figure 3.4 above, there are six processes involve in Admin module.
Admin can be login to the system as a first step to get into the system. After login,
process that involve admin is Manage Income, Manage Expenses, Forecast Budget
and Generate Report from the system. At the end on the process, admin can logout
from the system.

20
LEVEL 1
Figure 3.5 DFD Level 1 for User
Figure 3.5 above shows that there are four processes involve in User module. User
can be login to the system as a first step to get into the system. Then, other processes
carried in this module are Manage Income, Manage Expenses and Generate Report
from the system.

21
LEVEL 2
Figure 3.6 DFD Level 1
Figure 3.6 shows the login process of the system in details. User is required to
enter the details needed in order to use the system.

22
LEVEL 2
Figure 3.7 DFD Level 2 Manage Income
Based on Figure 3.7, the process above means that user can enter their income,
edit and delete if needed.

23
LEVEL 2
Figure 3.8 DFD Level 2 Manage Expenses
Based on Figure 3.8, the process above shows that user can enter their expenses, edit
and delete if needed.

24
LEVEL 2
Figure 3.9 DFD Level 2 Report Generation
From Figure 3.9, it shows the process to generate a report based on data has been
entered in income and expenses. The data from these data store will be retrieve to
display a report and forecast next month budget.

25
3.5 Entities Relationship Diagram(ERD)
ERD is a data modelling technique that creates a graphical representation of
the entities and the relationships within a system. Figure 3.10 below shows the
entities involved in Expenses Tracker System and its relationships. There are
several entities which are user, admin, expenses, income, budget and category.
Figure 3.10 Entities Relationship Diagram(ERD)
Figure 3.10 visualizes the entities, their attributes and the relationships between
the entities.

26
Figure 3.11 Database Design
Figure above shows the database design of Expenses Tracker System. It
visualized the connection and relationship between the tables involved in the
database.

27
3.5.1 Data Dictionary
A data dictionary is a file or a set of files that contains a database's meta data.
It has records about other objects in the database, such
as data ownership, data relationships to other objects, and other data. The following
tables below are showing the specification of each table involves in the database:
1. TABLE Users
2. TABLE Income
3. TABLE Expenses
4. TABLE Category
5. TABLE Budget

28
Column Type Null Length Key Description
username varchar no 10 PK
firstName varchar yes 20
lastName varchar yes 20
email varchar yes 50
password varchar yes 12
Table 3.3 Users Table
Column Type Null Length Key Description
income_id varchar no 10 PK
username varchar no 10 FK
inc_amount decimal yes 7
inc_date datetime yes
inc_source varchar yes 20
Table 3.4 Income Table

29
Column Type Null Length Key Description
expense_id varchar no 10 PK
username varchar no 10 FK
exp_amount decimal yes 7,0
exp_date datetime yes
category varchar yes 20
exp_status varchar yes 20
Table 3.5 Expenses Table
Column Type Null Length Key Description
username varchar no 10 PK
groceries varchar yes 7
entertainment varchar yes 7
automobile varchar yes 7
household varchar yes 7
loans varchar yes 7
insurance varchar yes 7
rent varchar yes 7
bill varchar yes 7
others varchar yes 7
Table 3.6 Category Table

30
Column Type Null Length Key Description
budget_id varchar no 10 PK
username varchar no 10 FK
income_id varchar no 10 FK
budgetName varchar yes 20
budget_amount decimal yes 7,0
firstDate datetime yes
secondDate datetime yes
category varchar yes 20
period varchar yes 10
Table 3.7 Budget Table

31
CHAPTER IV
IMPLEMENTATION
4.1 Introduction
This chapter will cover the implementation and the result of Expenses Tracker
System using least square method to ensure that the system is develop according to
the main objectives and achieve user requirement also to make sure the system is
running smoothly with error-free.
4.2 Implementation and Output
Expenses Tracker System is develop using several language. For the interface,
HTML website template. For the programming language, this system used PHP
(Hypertext Pre-processor) language. PHP is widely used because it is an open source
for general-purpose scripting language, can be embedded into HTML and it suits for
Web development. This system used HTML5, PHP and JavaScript for the validation.
Validation is important to make sure user have a minimum chance to make mistake
when inserting data. Open Source database also used in this system and the database
is MySQL version 5.6.26 - MySQL Community Server (GPL). Apache use to run
local host server and the Apache version is 2.4.16. Notepad++ used for writing and
edit the code.

32
The main focus of the project in solely on users’ side. So, the users are allowed to
login and insert their desired budget of the month. Then, they need to enter their
income. Hence, the budget amount will be deducted every time they expense. A report
will be generated and the end of the month and a new budget will be forecast.
4.3 Design Interface
4.3.1 Login page
Figure 4.1 Login page
The figure above shows that the user needs to insert their registered email and
password. If these two are correct then user can successfully login to the system.
Otherwise, user needs to re-enter the required information or sign up to a new
account.

33
4.3.2 Register/Sign up page
Figure 4.2 Sign up page
User should insert all information needed as shown in the Figure 4.2 so that
the system will save a record for the user in the database. After all is done, then
user can perform the login function.

34
4.3.3 Dashboard
Figure 4.3 Dashboard page
Once the user successfully login, a dashboard will be displayed. It will show
a summary of the user’s spending.

35
4.3.4 User profile
Figure 4.4 User profile page
Based on Figure 4.4, the page will will display the user’s information. In this
page, user can edit or update their information they want to.

36
4.3.6 Budget page
Figure 4.5 Budget page
Based on Figure 4.5, it shows the budget page which allows users to insert their
monthly budget according to their preference.

37
4.3.6 Income page
Figure 4.6 Income page
In this page, user needs to enter the details of their income such as the amount,
description and the date. Everything will be saved in the database. Then the income
entered just now will be shown in a list form. User can delete the record if they wish
to do so.
38
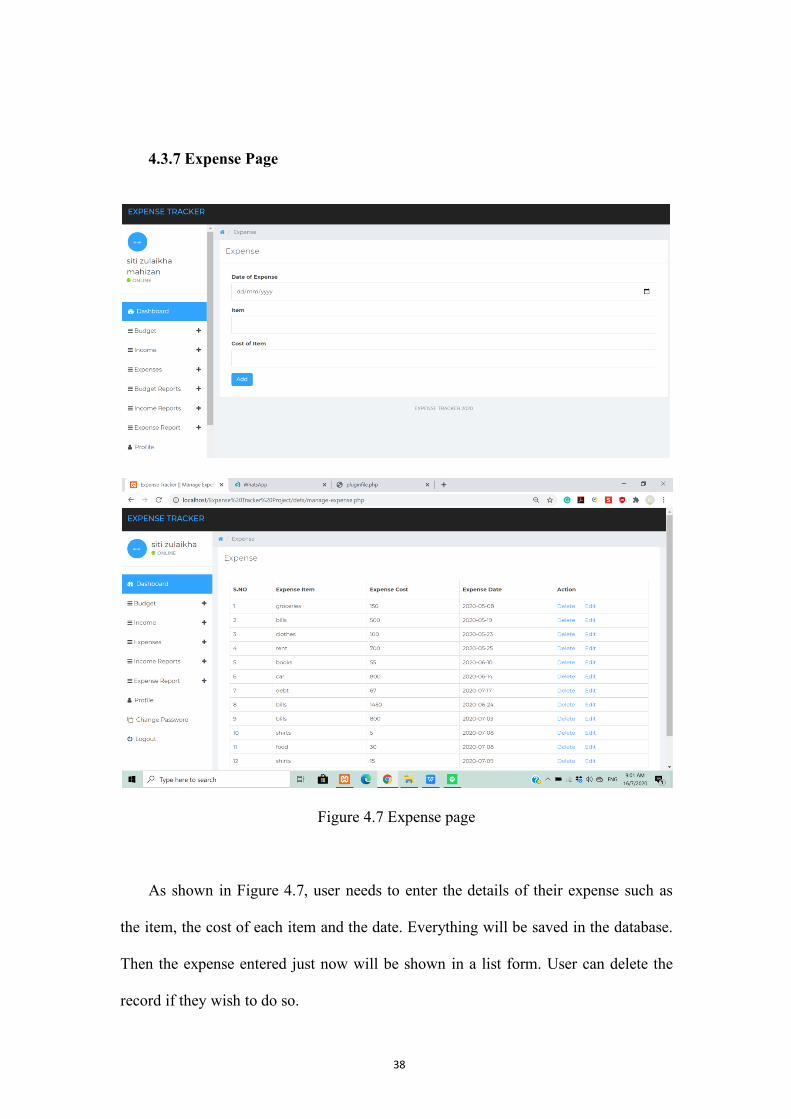
4.3.7 Expense Page
Figure 4.7 Expense page
As shown in Figure 4.7, user needs to enter the details of their expense such as
the item, the cost of each item and the date. Everything will be saved in the database.
Then the expense entered just now will be shown in a list form. User can delete the
record if they wish to do so.

39
4.3.8 Report page
Figure 4.8 Report page
As shown in the figure above, this page will display the amount of expenses made
by the user. It will calculate and make a grand total of all months.

40
4.4 Testing Analysis
After the development of the system are already complete. This system will be
test using two techniques of software testing which are black box testing and white
box testing in order to examine the functionality of the system. Black box testing
module involve login, manage user, manage budget, manage income, and manage
report. In white box testing it involve generate the report of diseases detection.
4.5 Test Cases
A test case is a set of condition or variables under which a tester will determine
whether a system works correctly or under test satisfies requirement. Process of
developing test case may help to find problem in the requirement or design of an
application. Below shows the cases for several process in the Expenses Tracker
System.

41
Test Case for Successful Login
Step Test Procedure Expected Result Pass/Fail
1 Go to login page Login page loaded Pass
2 Enter the user email and
password
Email: [email protected]
Password: 123
Pass
3 Click ‘Login’ button. Login successful.
Redirecting to
dashboard page.
Pass
Table 4.1 Test Case for Successful Login

42
Test Case for Unsuccessful Login
Step Test Procedure Expected Result Pass/Fail
1 Go to login page Login page loaded Pass
2 Enter the user email and
password
Email: [email protected]
Password: 9876
Pass
3 Click ‘Login’ button. Message “Invalid
Details.”
User needs to
reenter the correct
email and
password.
Pass
Table 4.2 Test Case for Unsuccessful Login

43
Test Case for Add Expenses Details
Step Test Procedure Expected Result Pass/Fail
1 Click ‘Add Expenses’ option. Form page loaded. Pass
2 Enter the new expense record. Pass
3 Click ‘Add’ button. New record is
added into the
database. A pop-up
message says
“Expense has been
added.”
Redirecting to
‘Manage Expense’
page.
Pass
Table 4.3 Test Case for Add Expenses Details

44
Test Case for Delete Expenses Record
Step Test Procedure Expected Result Pass/Fail
1 Click ‘Manage Expense’ option. List of expenses
made before
displayed.
Pass
2 Click ‘Delete’. Delete a record of
expense successful.
Redirect to
‘Manage expense’
page.
Pass
Table 4.4 Test Case for Delete Expenses Record

45
Test Case for Update User Profile
Step Test Procedure Expected Result Pass/Fail
1 Click ‘Profile’ button. Form page loaded. Pass
2 Enter the new data of the user. Pass
3 Click ‘Update’ button. Update successful.
Redirecting to
‘User Profile’ page.
Pass
Table 4.5 Test Case for Update User Profile

46
Test Case for Success Generate Report
Step Test Procedure Expected Result Pass/Fail
1 Click ‘Expense Report’ button. Form page loaded. Pass
2 User needs to choose dates.
From date: 01/01/2020
To date: 01/02/2020
Pass
3 Click ‘Submit’ button Report page
display the amount
of expense.
Pass
Table 4.6 Test Case for Success Generate Report

47
Test Case for Failed Generate Report
Step Test Procedure Expected Result Pass/Fail
1 Click ‘Expense Report’ button. Form page loaded. Pass
2 User leaves the dates empty. Pass
3 Click ‘Submit’ button Report page loaded
with message
‘Please fill out this
field”. User has to
reenter a valid date.
Pass
Table 4.7 Test Case for Failed Generate Report

48
4.6 Summary
In a nutshell, this chapter covers the implementation of code into the system,
interface design and testing of the system. All the test case is test carefully to make
sure the results come out as intended. The developer can identify errors and
immediately fixes the errors in order for the system to run smoothly.

49
CHAPTER V
RESULT AND CONCLUSION
5.1 Introduction
This chapter will discuss a conclusion of this project and the content on this
chapter are summary for the whole of this project, project contribution, project
limitation and some suggestion for the future.
5.2 Project Contribution
Expenses Tracker System have been developed for user to plan and control their
money spending properly. It has achieved the objectives and scope that were stated in
this project. This project have achieved some of the below. �
l Users can manage their budget related to their income.
l Users also can view and study their spending by viewing the reports for budget,
income, and expense that have been generated.
l Users may spend their money according to the budget.

50
5.3 Discussion
By the end of this project, the Expenses Tracker System is successfully achieving
its objectives which are to design a user friendly and an attractive interface so that
users can easily access the system., to develop a systematic system that will help to
improve users’ financial management and forecast future budget planning and is
reliable to generate monthly report and forecast budget for the users using least square
method.
This project provide the report for diseases detection using the ruled-based
algorithm. The percentage of the diseases is calculated with the number symptoms
that have been chosen by the patient and is compared to the diseases symptoms
documentation. The result of the calculation provide the best possible diseases for the
patient. When the patient select the symptoms, the result of possible diseases is
generated and give the patient report for their diseases detection. Thus, this system
will give benefits to the patient which that can diagnose their diseases in efficient and
quick way besides can keep better and good health.

51
5.4 Project Constraint and Limitation
Every system needs some limitation to ensure it performs as it supposed. There
are also a few problems and limitations that occur throughout the development of
these project which are:
l The system cannot retrieve username and password if a user happens to forget
them.
l The report only shows separated reports for budget, income and expense, thus the
chart do not show or evaluate income versus expenses made.

52
5.5 Future Work
The system is well operated and function as planned, however, there are a few
suggestion to make it even more better and usable in the future. Here are some
enchantment for the system to work more efficient in future.
l For current report, it is only limited to a few options. Hence, maybe it will be
better if the report can generate a bar graph or line graph that shows all reports
together instead being separated. It would a lot easier for user to evaluate their
spending too.
l It would be great if the system can perform any online payment instead of only
able to generate reports and forecast budget.
5.6 Conclusion
Expenses Tracker System is a system that being developed to assist users in
budget planning. It provides end users to records their income and expenses within the
budget that have been planned beforehand. Furthermore, users are able to keep track
on their spending so they are not wasting their money without doubt. Last but
certainly not the least, they are able to access the system anytime and anywhere that is
accessible.

53
REFERENCES
[1] Morgan L. (2017). Why Do People Think Mint is Bad For Budgeting. Investing
Education.[online] Retrieved from:
http://www.investinged.com/why-do-people-think-mint-is-bad-for-budgeting/
[Accessed 1 April 2017].
[2] Kumar, R and Mahto, D 2013, ‘A case study : Application of Proper Forecasting
Technique in Juice Production’, Global Journal of Researches in Engineering,
vol. 13, no. 4, pp. 1-6
[3] Pal, S, Ramasubramanian, V and Mehta, SC 2007, ‘Statistical Models for
Forecasting Milk Production in India’, Journal of Indian Society of Agricultural
Statistics, vol.61, no.2, pp. 80-83.
[4] Hyndman, R. J., & Athanasopoulos, G. (2018). Forecasting: Principles and
Practice.
[5] Thanapal, P., Patel, M., Lokesh Raj, T., & Satheesh Kumar, J. (2015). Income
and Expense Tracker. Indian Journal Of Science And Technology, 8(S2), 118-122.
[6] Chauhan, B. D., Rana, A., & Sharma, N. K. (2017, September). Impact of
development methodology on cost & risk for development projects. In 2017 6th
International Conference on Reliability, Infocom Technologies and Optimization
(Trends and Future Directions)(ICRITO) (pp. 267-272). IEEE.

54
[7] Jian, L., Shen, S., Li, J., Liang, X., & Li, L. (2016). Budget online learning
algorithm for least squares SVM. IEEE transactions on neural networks and learning
systems, 28(9), 2076-2087.
[8] Gaither, G. H., Dukes, F. O., & Swanson, J. R. (1981). ENROLLMENT
FORECASTING: USE OF A MULTIPLE-METHOD MODEL FOR PLANNING
AND BUDGETING. Decision Sciences, 12(2), 217-230.
[9] Lee, C. F., Chen, H. Y., & Lee, J. (2019). Econometric Approach to Financial
Analysis, Planning, and Forecasting. In Financial Econometrics, Mathematics and
Statistics (pp. 125-157). Springer, New York, NY.
[10] Elbasheer, F. A., & Samani, A. T. (2014). Forecasting Budget Estimated Using
Time-Series. Intelligent Information Management, 2014, 6, 142-148, Published
Online May 2014 in SciRes. http://www. scirp. org/journal/iim.

55
APPENDIX

56
APPENDIX A (GANTT CHART 1)

57
APPENDIX B (GANTT CHART 2)