Expeditious illustration of layer-cake models on and above...
9
Case study Expeditious illustration of layer-cake models on and above a tactile surface Daniel Simões Lopes a,n , Daniel Mendes a,b , Maurício Sousa a,b , Joaquim Jorge a,b a INESC-ID Lisboa, Portugal b Instituto Superior Técnico, Universidade de Lisboa, Portugal article info Article history: Received 14 August 2015 Received in revised form 9 February 2016 Accepted 10 February 2016 Available online 12 February 2016 Keywords: Layer-cake models Illustrative geology Sketch-based modeling Spatial interaction Stereoscopic visualization abstract Too often illustrating and visualizing 3D geological concepts are performed by sketching in 2D mediums, which may limit drawing performance of initial concepts. Here, the potential of expeditious geological modeling brought by hand gestures is explored. A spatial interaction system was developed to enable rapid modeling, editing, and exploration of 3D layer-cake objects. User interactions are acquired with motion capture and touch screen technologies. Virtual immersion is guaranteed by using stereoscopic technology. The novelty consists of performing expeditious modeling of coarse geological features with only a limited set of hand gestures. Results from usability-studies show that the proposed system is more efficient when compared to a windows-icon-menu-pointer modeling application. & 2016 Elsevier Ltd. All rights reserved. 1. Introduction Three dimensional visualizations of geological constructs are common in many geo-related fields since these communicate spatial relationships and possible structural configurations of geological objects effectively (Lidal, 2013; Turner, 2006). Currently these visualizations are conveyed by 3D illustrations drawn on 2D media using conventional computer input such as mouse and keyboard. Recently-developed approaches propose 2D sketch- based systems to enable rapid geological modeling of terrains and stratigraphic elements (Lidal, 2013). However, advanced stereo- scopic visualization systems and new gesture-based spatial inter- action systems using 3D sensing technology and touchscreens (Galyean and Hughes, 1991; Schkolne et al., 2001; Keefe et al., 2001; Piper et al., 2002; Hilliges et al., 2012) could usher in even more expeditious means to rapidly build or illustrate geological model, via direct manipulation. Geological illustration must take into consideration the amount of complexity to be pictured, which depends on the level of detail required along with the abstraction chosen to represent geological phenomena (Natali et al., 2013; Laurent et al., 2015). For instance, highly detailed geological illustration is a demanding endeavor performed by well-skilled illustrators who need to interact with geologists and iterate over different visualizations to arrive at a desired result, which usually are richly populated with detailed features. This lengthens the process and is an obstacle to quickly exploring alternate scenarios. However, illustrators can build highly detailed models by starting with more simplified model versions, as a more meaningful model comes up when composing with a series of relatively simple struc- tural elements (e.g., terrains, horizons, elevations or depressions) (Jessell and Valenta, 1996; Laurent et al., 2015). Another advantage of simplified models is that they can be rapidly built, hence, users can quickly deliver an initial composition of the geological model and also propose several alternative structural arrangements. Therefore, and contrary to highly detailed geological illustration, we approach an early visualization framework that offers a simpler level of detail, where externalizing ideas or concepts of a layer-cake model in the absence of quantitative geological data. These so-called “no-data scenarios” are common in geology (Jessell and Valenta, 1996; Natali et al., 2013; Laurent et al., 2015). In the absence of data, major features (e.g., largest elevations and depressions, large faults and intrusive bodies) of terrains (air–soil interface) and horizons (soil–soil interfaces) are easier to be modeled from scratch. The lack or absence of data requires modelers to focus on global features, which can be complemented when more data become available. Modeling is guided by the qualitative geological knowledge and it may take sev- eral rapid iterations to produce the desired result. Qualitative and rough as they are, these externalizations are favored by geologists since they allow valuable insights and hypotheses to be explored without requiring costly terrain surveys and seismic data collection. The work presented here provides a spatial interaction system that can be used by geologists and illustrators alike to build layer- cake geological illustrations via hand gestures. Our approach to expedite modeling relies on observations that geologists can Contents lists available at ScienceDirect journal homepage: www.elsevier.com/locate/cageo Computers & Geosciences http://dx.doi.org/10.1016/j.cageo.2016.02.009 0098-3004/& 2016 Elsevier Ltd. All rights reserved. n Corresponding author. E-mail addresses: [email protected] (D.S. Lopes), [email protected] (D. Mendes), [email protected] (M. Sousa), [email protected] (J. Jorge). Computers & Geosciences 90 (2016) 1–9
Transcript of Expeditious illustration of layer-cake models on and above...
Computers & Geosciences 90 (2016) 1–9
Contents lists available at ScienceDirect
Computers & Geosciences
http://d0098-30
n CorrE-m
danielmmaurici
journal homepage: www.elsevier.com/locate/cageo
Case study
Expeditious illustration of layer-cake models on and above a tactile surface
Daniel Simões Lopes a,n, Daniel Mendes a,b, Maurício Sousa a,b, Joaquim Jorge a,b
a INESC-ID Lisboa, Portugalb Instituto Superior Técnico, Universidade de Lisboa, Portugal
a r t i c l e i n f o
Article history:Received 14 August 2015Received in revised form9 February 2016Accepted 10 February 2016Available online 12 February 2016
Keywords:Layer-cake modelsIllustrative geologySketch-based modelingSpatial interactionStereoscopic visualization
x.doi.org/10.1016/j.cageo.2016.02.00904/& 2016 Elsevier Ltd. All rights reserved.
esponding author.ail addresses: [email protected] (D.S. [email protected] (D. Mendes),[email protected] (M. Sousa), [email protected]
a b s t r a c t
Too often illustrating and visualizing 3D geological concepts are performed by sketching in 2D mediums,which may limit drawing performance of initial concepts. Here, the potential of expeditious geologicalmodeling brought by hand gestures is explored. A spatial interaction system was developed to enablerapid modeling, editing, and exploration of 3D layer-cake objects. User interactions are acquired withmotion capture and touch screen technologies. Virtual immersion is guaranteed by using stereoscopictechnology. The novelty consists of performing expeditious modeling of coarse geological features withonly a limited set of hand gestures. Results from usability-studies show that the proposed system is moreefficient when compared to a windows-icon-menu-pointer modeling application.
& 2016 Elsevier Ltd. All rights reserved.
1. Introduction
Three dimensional visualizations of geological constructs arecommon in many geo-related fields since these communicatespatial relationships and possible structural configurations ofgeological objects effectively (Lidal, 2013; Turner, 2006). Currentlythese visualizations are conveyed by 3D illustrations drawn on 2Dmedia using conventional computer input such as mouse andkeyboard. Recently-developed approaches propose 2D sketch-based systems to enable rapid geological modeling of terrains andstratigraphic elements (Lidal, 2013). However, advanced stereo-scopic visualization systems and new gesture-based spatial inter-action systems using 3D sensing technology and touchscreens(Galyean and Hughes, 1991; Schkolne et al., 2001; Keefe et al.,2001; Piper et al., 2002; Hilliges et al., 2012) could usher in evenmore expeditious means to rapidly build or illustrate geologicalmodel, via direct manipulation.
Geological illustration must take into consideration the amountof complexity to be pictured, which depends on the level of detailrequired along with the abstraction chosen to represent geologicalphenomena (Natali et al., 2013; Laurent et al., 2015). For instance,highly detailed geological illustration is a demanding endeavorperformed by well-skilled illustrators who need to interact withgeologists and iterate over different visualizations to arrive at adesired result, which usually are richly populated with detailed
pes),
lisboa.pt (J. Jorge).
features. This lengthens the process and is an obstacle to quicklyexploring alternate scenarios.
However, illustrators can build highly detailed models by startingwith more simplified model versions, as a more meaningful modelcomes up when composing with a series of relatively simple struc-tural elements (e.g., terrains, horizons, elevations or depressions)(Jessell and Valenta, 1996; Laurent et al., 2015). Another advantage ofsimplified models is that they can be rapidly built, hence, users canquickly deliver an initial composition of the geological model and alsopropose several alternative structural arrangements.
Therefore, and contrary to highly detailed geological illustration,we approach an early visualization framework that offers a simplerlevel of detail, where externalizing ideas or concepts of a layer-cakemodel in the absence of quantitative geological data. These so-called“no-data scenarios” are common in geology (Jessell and Valenta,1996; Natali et al., 2013; Laurent et al., 2015). In the absence of data,major features (e.g., largest elevations and depressions, large faultsand intrusive bodies) of terrains (air–soil interface) and horizons(soil–soil interfaces) are easier to bemodeled from scratch. The lack orabsence of data requires modelers to focus on global features, whichcan be complemented when more data become available. Modeling isguided by the qualitative geological knowledge and it may take sev-eral rapid iterations to produce the desired result. Qualitative andrough as they are, these externalizations are favored by geologistssince they allow valuable insights and hypotheses to be exploredwithout requiring costly terrain surveys and seismic data collection.
The work presented here provides a spatial interaction systemthat can be used by geologists and illustrators alike to build layer-cake geological illustrations via hand gestures. Our approach toexpedite modeling relies on observations that geologists can
Motion Capture Cameras
Depth Camera
D.S. Lopes et al. / Computers & Geosciences 90 (2016) 1–92
quickly sketch the rough structure of a terrain or of a stratigraphiclayer with few strokes (Lidal, 2013). We conjecture that a spatialsketching interface would provide a quicker way to externalize anideated model by geologists or illustrators. We have explored thismodeling principle, examining the geological expressiveness ofhand gestures towards rapidly creating geological layered-objects.
3D GlassesMulti-Touch
Frame
Drawing Device
3D TV
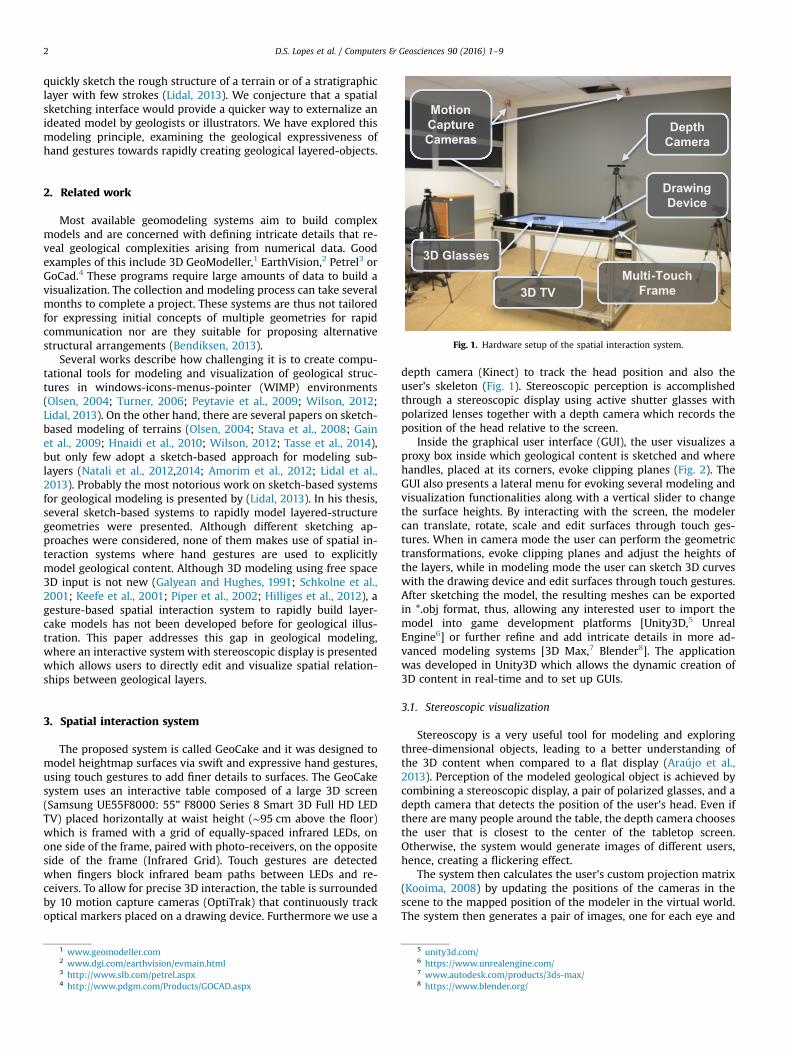
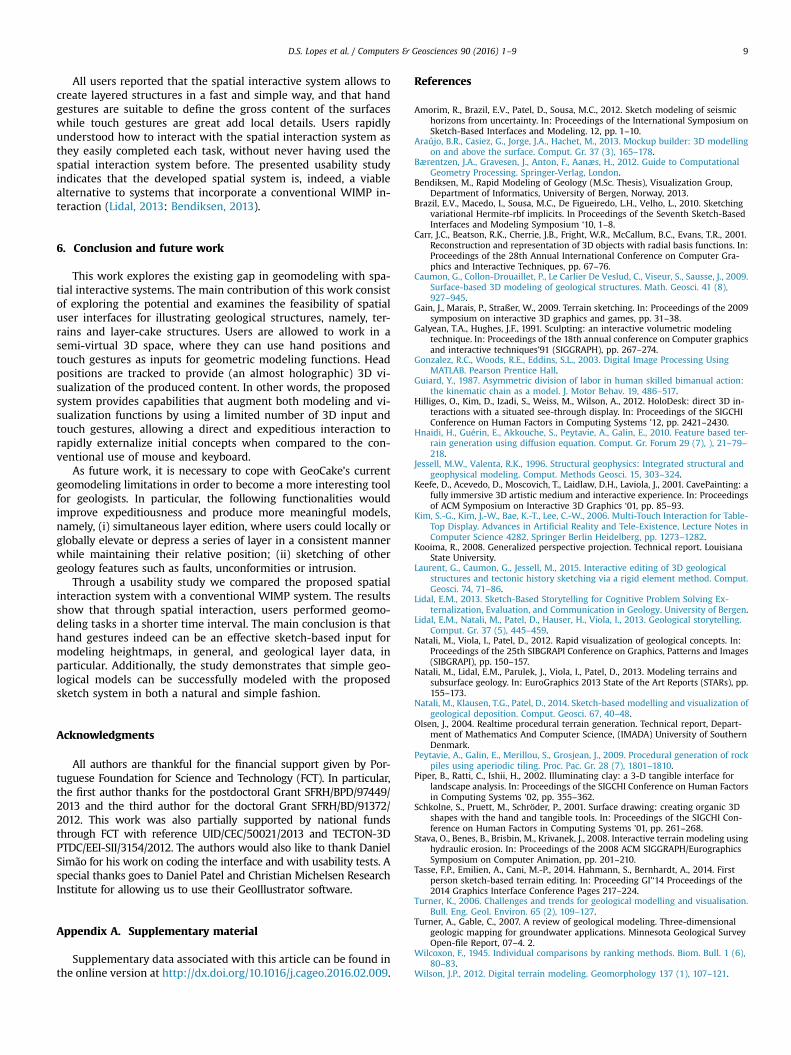
Fig. 1. Hardware setup of the spatial interaction system.
2. Related work
Most available geomodeling systems aim to build complexmodels and are concerned with defining intricate details that re-veal geological complexities arising from numerical data. Goodexamples of this include 3D GeoModeller,1 EarthVision,2 Petrel3 orGoCad.4 These programs require large amounts of data to build avisualization. The collection and modeling process can take severalmonths to complete a project. These systems are thus not tailoredfor expressing initial concepts of multiple geometries for rapidcommunication nor are they suitable for proposing alternativestructural arrangements (Bendiksen, 2013).
Several works describe how challenging it is to create compu-tational tools for modeling and visualization of geological struc-tures in windows-icons-menus-pointer (WIMP) environments(Olsen, 2004; Turner, 2006; Peytavie et al., 2009; Wilson, 2012;Lidal, 2013). On the other hand, there are several papers on sketch-based modeling of terrains (Olsen, 2004; Stava et al., 2008; Gainet al., 2009; Hnaidi et al., 2010; Wilson, 2012; Tasse et al., 2014),but only few adopt a sketch-based approach for modeling sub-layers (Natali et al., 2012,2014; Amorim et al., 2012; Lidal et al.,2013). Probably the most notorious work on sketch-based systemsfor geological modeling is presented by (Lidal, 2013). In his thesis,several sketch-based systems to rapidly model layered-structuregeometries were presented. Although different sketching ap-proaches were considered, none of them makes use of spatial in-teraction systems where hand gestures are used to explicitlymodel geological content. Although 3D modeling using free space3D input is not new (Galyean and Hughes, 1991; Schkolne et al.,2001; Keefe et al., 2001; Piper et al., 2002; Hilliges et al., 2012), agesture-based spatial interaction system to rapidly build layer-cake models has not been developed before for geological illus-tration. This paper addresses this gap in geological modeling,where an interactive systemwith stereoscopic display is presentedwhich allows users to directly edit and visualize spatial relation-ships between geological layers.
3. Spatial interaction system
The proposed system is called GeoCake and it was designed tomodel heightmap surfaces via swift and expressive hand gestures,using touch gestures to add finer details to surfaces. The GeoCakesystem uses an interactive table composed of a large 3D screen(Samsung UE55F8000: 55” F8000 Series 8 Smart 3D Full HD LEDTV) placed horizontally at waist height (∼95 cm above the floor)which is framed with a grid of equally-spaced infrared LEDs, onone side of the frame, paired with photo-receivers, on the oppositeside of the frame (Infrared Grid). Touch gestures are detectedwhen fingers block infrared beam paths between LEDs and re-ceivers. To allow for precise 3D interaction, the table is surroundedby 10 motion capture cameras (OptiTrak) that continuously trackoptical markers placed on a drawing device. Furthermore we use a
1 www.geomodeller.com2 www.dgi.com/earthvision/evmain.html3 http://www.slb.com/petrel.aspx4 http://www.pdgm.com/Products/GOCAD.aspx
depth camera (Kinect) to track the head position and also theuser's skeleton (Fig. 1). Stereoscopic perception is accomplishedthrough a stereoscopic display using active shutter glasses withpolarized lenses together with a depth camera which records theposition of the head relative to the screen.
Inside the graphical user interface (GUI), the user visualizes aproxy box inside which geological content is sketched and wherehandles, placed at its corners, evoke clipping planes (Fig. 2). TheGUI also presents a lateral menu for evoking several modeling andvisualization functionalities along with a vertical slider to changethe surface heights. By interacting with the screen, the modelercan translate, rotate, scale and edit surfaces through touch ges-tures. When in camera mode the user can perform the geometrictransformations, evoke clipping planes and adjust the heights ofthe layers, while in modeling mode the user can sketch 3D curveswith the drawing device and edit surfaces through touch gestures.After sketching the model, the resulting meshes can be exportedin *.obj format, thus, allowing any interested user to import themodel into game development platforms [Unity3D,5 UnrealEngine6] or further refine and add intricate details in more ad-vanced modeling systems [3D Max,7 Blender8]. The applicationwas developed in Unity3D which allows the dynamic creation of3D content in real-time and to set up GUIs.
3.1. Stereoscopic visualization
Stereoscopy is a very useful tool for modeling and exploringthree-dimensional objects, leading to a better understanding ofthe 3D content when compared to a flat display (Araújo et al.,2013). Perception of the modeled geological object is achieved bycombining a stereoscopic display, a pair of polarized glasses, and adepth camera that detects the position of the user’s head. Even ifthere are many people around the table, the depth camera choosesthe user that is closest to the center of the tabletop screen.Otherwise, the system would generate images of different users,hence, creating a flickering effect.
The system then calculates the user’s custom projection matrix(Kooima, 2008) by updating the positions of the cameras in thescene to the mapped position of the modeler in the virtual world.The system then generates a pair of images, one for each eye and
5 unity3d.com/6 https://www.unrealengine.com/7 www.autodesk.com/products/3ds-max/8 https://www.blender.org/
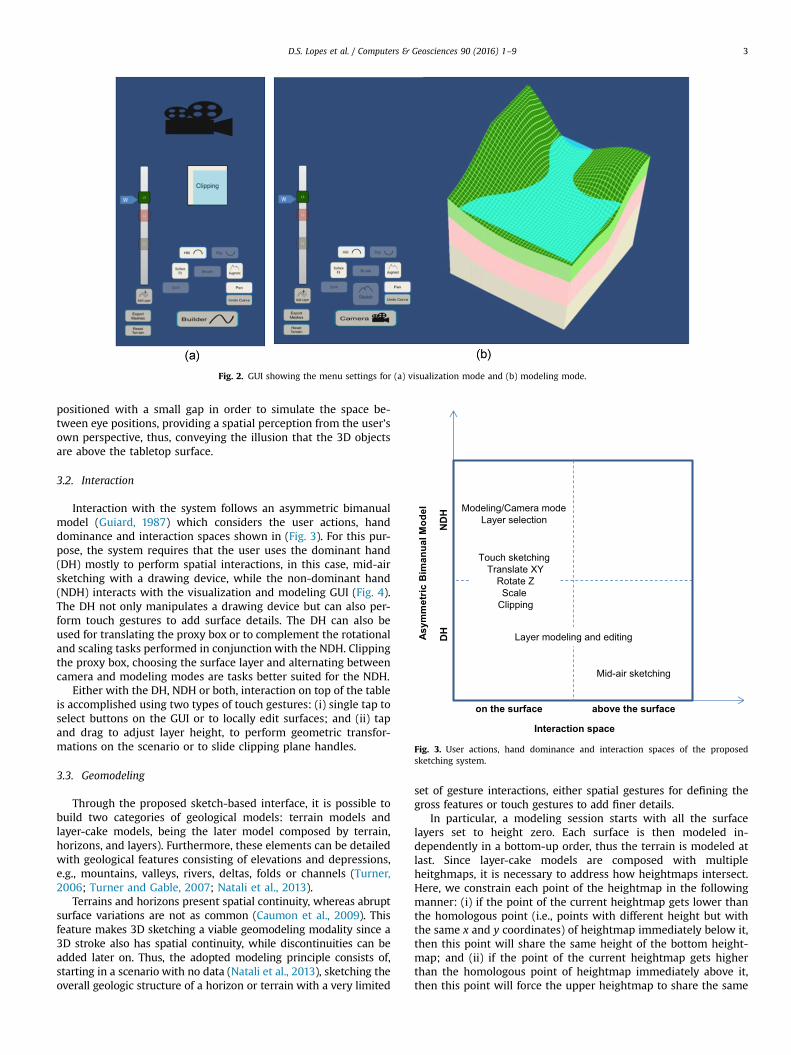
Fig. 2. GUI showing the menu settings for (a) visualization mode and (b) modeling mode.
on the surface above the surface
DH
ND
H
Mid-air sketching
Modeling/Camera modeLayer selection
Interaction space
ledoMlauna
miB
cirtem
mysA
Touch sketching Translate XY
Rotate ZScale
Clipping
Layer modeling and editing
Fig. 3. User actions, hand dominance and interaction spaces of the proposedsketching system.
D.S. Lopes et al. / Computers & Geosciences 90 (2016) 1–9 3
positioned with a small gap in order to simulate the space be-tween eye positions, providing a spatial perception from the user’sown perspective, thus, conveying the illusion that the 3D objectsare above the tabletop surface.
3.2. Interaction
Interaction with the system follows an asymmetric bimanualmodel (Guiard, 1987) which considers the user actions, handdominance and interaction spaces shown in (Fig. 3). For this pur-pose, the system requires that the user uses the dominant hand(DH) mostly to perform spatial interactions, in this case, mid-airsketching with a drawing device, while the non-dominant hand(NDH) interacts with the visualization and modeling GUI (Fig. 4).The DH not only manipulates a drawing device but can also per-form touch gestures to add surface details. The DH can also beused for translating the proxy box or to complement the rotationaland scaling tasks performed in conjunction with the NDH. Clippingthe proxy box, choosing the surface layer and alternating betweencamera and modeling modes are tasks better suited for the NDH.
Either with the DH, NDH or both, interaction on top of the tableis accomplished using two types of touch gestures: (i) single tap toselect buttons on the GUI or to locally edit surfaces; and (ii) tapand drag to adjust layer height, to perform geometric transfor-mations on the scenario or to slide clipping plane handles.
3.3. Geomodeling
Through the proposed sketch-based interface, it is possible tobuild two categories of geological models: terrain models andlayer-cake models, being the later model composed by terrain,horizons, and layers). Furthermore, these elements can be detailedwith geological features consisting of elevations and depressions,e.g., mountains, valleys, rivers, deltas, folds or channels (Turner,2006; Turner and Gable, 2007; Natali et al., 2013).
Terrains and horizons present spatial continuity, whereas abruptsurface variations are not as common (Caumon et al., 2009). Thisfeature makes 3D sketching a viable geomodeling modality since a3D stroke also has spatial continuity, while discontinuities can beadded later on. Thus, the adopted modeling principle consists of,starting in a scenario with no data (Natali et al., 2013), sketching theoverall geologic structure of a horizon or terrain with a very limited
set of gesture interactions, either spatial gestures for defining thegross features or touch gestures to add finer details.
In particular, a modeling session starts with all the surfacelayers set to height zero. Each surface is then modeled in-dependently in a bottom-up order, thus the terrain is modeled atlast. Since layer-cake models are composed with multipleheitghmaps, it is necessary to address how heightmaps intersect.Here, we constrain each point of the heightmap in the followingmanner: (i) if the point of the current heightmap gets lower thanthe homologous point (i.e., points with different height but withthe same x and y coordinates) of heightmap immediately below it,then this point will share the same height of the bottom height-map; and (ii) if the point of the current heightmap gets higherthan the homologous point of heightmap immediately above it,then this point will force the upper heightmap to share the same

NDH
DH
Fig. 4. The DH holds the 3D drawing device while the NDH interacts with the GUIto evoke application functionalities.
Table 1Type of interaction and corresponding geomodeling operation that affect the sur-faces either globally or locally.
Interaction Geomodeling operation Surface model Global or localfeatures
Spatial Point cloud curve for sur-face fitting
Thin plate spline Global
Spatial Point cloud curve for sur-face editing
Image mask Local
Spatial Surface editing Image mask LocalTouch Surface editing Image mask LocalTouch Surface height Vertical
translationGlobal
D.S. Lopes et al. / Computers & Geosciences 90 (2016) 1–94
height of the current layer. Consequently, modifications of thelower layers may alter the terrain (i.e., topography) or, in otherwords, horizons may cross the terrain.
These modeling constraints are important since they give themodeler a sense of order in the modeling process and, more im-portantly, allows the modeler to constantly supervise if any surfaceintersection occur. In addition, the considered surface intersectionconstraints provide a sense of control whenever the user changesa surface. Furthermore, they assure geomodeling expeditiousnesssince, if no constraints were considered, then whenever a surfacewas modified, other surfaces would not be affected by this editand had to be manually edited. This would be very time con-suming and would negatively affect geomodeling efficiency. Notethat this workflow is different from the one presented by (Caumonet al., 2009) since the authors consider fault modeling first andend with horizon modeling. In this paper, faults, unconformities(e.g. erosion) or intrusion are not considered.
3.4. Sketching of terrains and sub-surface layers
Layer-cake structures are encoded as a set of heightmaps,which are a common surface representation for horizons andterrains (Natali et al., 2013). A heightmap is an explicit surfaceformalized as [ ] × [ ] ∈ →h x x y y: , ,1 2 1 2
2 . Since 3D content isproduced inside a proxy box, each point of a heightmap is con-tained within a set = [ ] × [ ] × [ ] ∈B x x y y z z B, , , ,1 2 1 2 1 2
3. Each 3Dmodeling interaction, either spatial or touch gestures, have acorresponding geometric transformation associated to modify aheightmap, namely, the geomodeling operations described in(Table 1) and illustrated in (Figs. 5 and 6).
By sketching in mid-air, the position of the drawing device isused to define a set of point cloud curves that can be used in twoways. Based on Thin Plate Spline interpolation (TPS), a heightmapcan be interpolated to the sketched points (Fig. 5(a)). This tech-nique allows the user to generate the global features of a horizonor terrain, and is commonly used for terrain reconstruction(Bærentzen et al., 2012). Alternatively, the sketched points can beused to locally adjust an image mask or brush (Gonzalez et al.,2003). For instance, if the image mask is a Gaussian function, thenthe peak of the function can match the point’s height (Fig. 5(b)).This modeling feature is especially useful if the user wishes to add
a set of depressions or elevations, such as a mountain range.Moreover, when continuously tracking the position and or-
ientation of the drawing device, the user can also create localelevations or depressions in real-time, but in this case, the imagemask can be rotated, thus, adding a new degree of modelingfreedom to the workflow. Here, the height of the drawing devicerelative to the touch screen corresponds to the peak of the Gaus-sian function.
When modeling with touch gestures, image masks are alsoused to emulate both elevations and depressions, where it ispossible to introduce multiple surface editions by touching thescreen at several points (Fig. 6). Also, through touch interaction, itis possible to change the heights of the horizons and terrain, thus,altering the layer thickness. The heights can be adjusted by usingthe slider bar (Fig. 8), where each heightmap has a color codedlabel that can be slid up or down altering its vertical height.
Local features are modeled by introducing elevations or de-pressions through the use of an image mask. A proper image maskfor geomodeling of heightmaps is the Gaussian function or, moregenerically, the elliptical Gaussian function (Fig. 7(a)):
⎛
⎝⎜⎜
⎛⎝⎜⎜
⎛⎝⎜
⎞⎠⎟
⎛⎝⎜
⎞⎠⎟
⎞⎠⎟⎟
⎞
⎠⎟⎟σ σ
( ) = − − +−
( )g x y A
x x y y, exp
12 1x
y
y
y0 0
where A is the amplitude; x0 and y0 the center; sx and sy is thevariance along x and y, respectively; γZ1, the exponent that givesto the elliptical Gaussian a more circular (γE2) or square (γ42)shape. Note that the Gaussian surface is a particular case of (Eq. 1)when sx¼sy¼γ¼1. Individually, this mathematical function re-sembles a mountain or valley. When adding various different andcontiguous Gaussians, the shape of a geological object comes toshape.
3.5. Affine transformations
The modeling process demands the visualization of the 3Dcontent under many different angles. In order to visualize themodeled content, several affine transformations must be appliedto the camera with easy-to-use multi-touch gestures (Kim et al.,2006). A total of 5 degrees of freedom are available, namely, twotranslations for displacing the proxy throughout the xOz plane,two rotations along the normal and tangential directions of theproxy’s bottom plane, and a uniform scale. These transformationsare performed by using the following set of interactions (Fig. 9):(i) pan gesture for translation; (ii) pinch open and pinch closegestures to zoom in and out, respectively, or with two fingers pressand move them to each other or away along a straight line to zoomin or out; and (iii) rotate gesture for rotating the proxy box aroundan axis that crosses vertically its centroid.
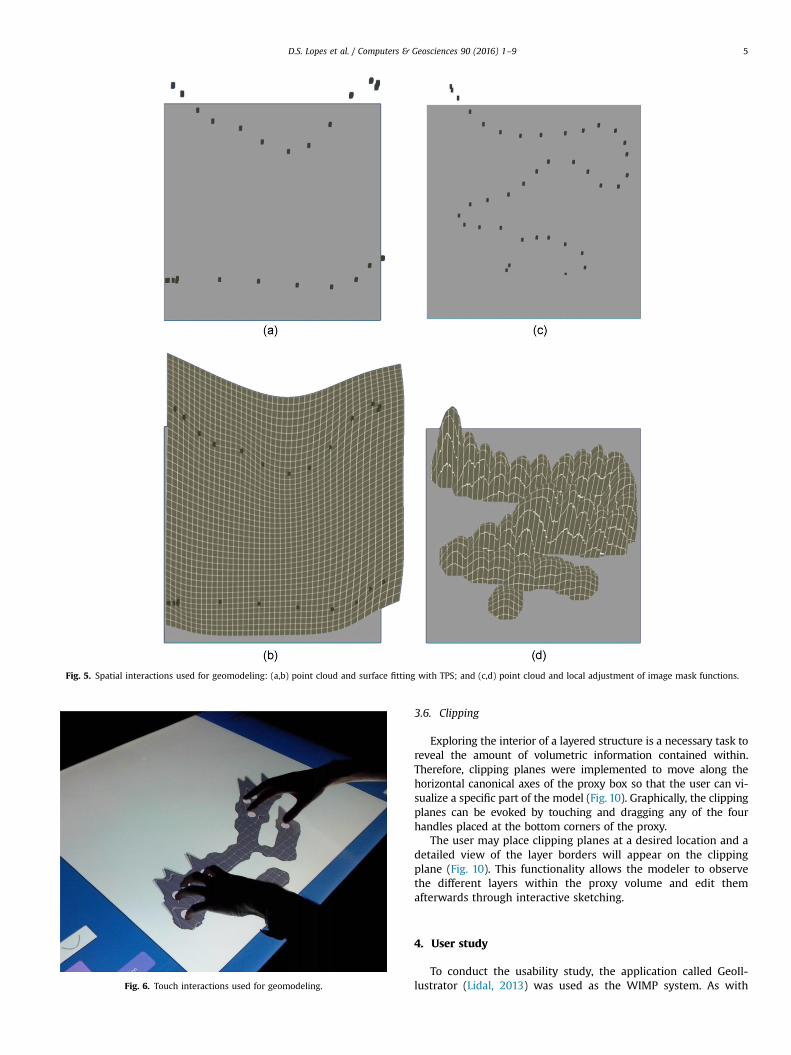
Fig. 5. Spatial interactions used for geomodeling: (a,b) point cloud and surface fitting with TPS; and (c,d) point cloud and local adjustment of image mask functions.
Fig. 6. Touch interactions used for geomodeling.
D.S. Lopes et al. / Computers & Geosciences 90 (2016) 1–9 5
3.6. Clipping
Exploring the interior of a layered structure is a necessary task toreveal the amount of volumetric information contained within.Therefore, clipping planes were implemented to move along thehorizontal canonical axes of the proxy box so that the user can vi-sualize a specific part of the model (Fig. 10). Graphically, the clippingplanes can be evoked by touching and dragging any of the fourhandles placed at the bottom corners of the proxy.
The user may place clipping planes at a desired location and adetailed view of the layer borders will appear on the clippingplane (Fig. 10). This functionality allows the modeler to observethe different layers within the proxy volume and edit themafterwards through interactive sketching.
4. User study
To conduct the usability study, the application called GeoIl-lustrator (Lidal, 2013) was used as the WIMP system. As with
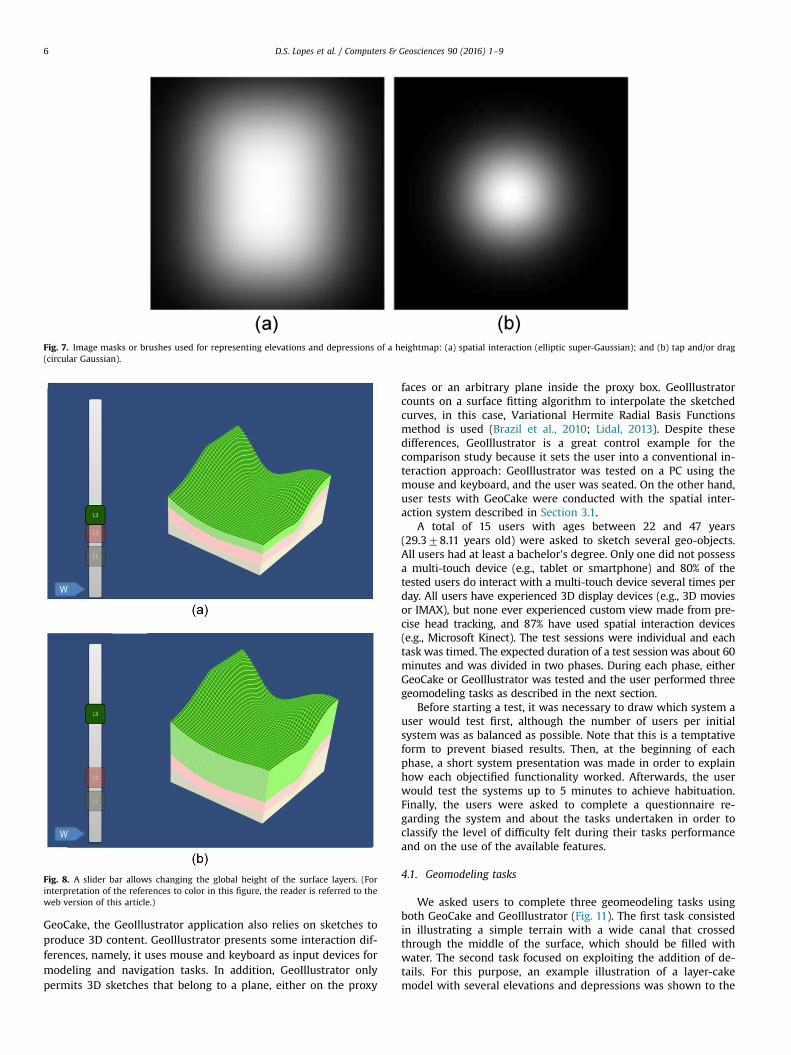
Fig. 7. Image masks or brushes used for representing elevations and depressions of a heightmap: (a) spatial interaction (elliptic super-Gaussian); and (b) tap and/or drag(circular Gaussian).
Fig. 8. A slider bar allows changing the global height of the surface layers. (Forinterpretation of the references to color in this figure, the reader is referred to theweb version of this article.)
D.S. Lopes et al. / Computers & Geosciences 90 (2016) 1–96
GeoCake, the GeoIllustrator application also relies on sketches toproduce 3D content. GeoIllustrator presents some interaction dif-ferences, namely, it uses mouse and keyboard as input devices formodeling and navigation tasks. In addition, GeoIllustrator onlypermits 3D sketches that belong to a plane, either on the proxy
faces or an arbitrary plane inside the proxy box. GeoIllustratorcounts on a surface fitting algorithm to interpolate the sketchedcurves, in this case, Variational Hermite Radial Basis Functionsmethod is used (Brazil et al., 2010; Lidal, 2013). Despite thesedifferences, GeoIllustrator is a great control example for thecomparison study because it sets the user into a conventional in-teraction approach: GeoIllustrator was tested on a PC using themouse and keyboard, and the user was seated. On the other hand,user tests with GeoCake were conducted with the spatial inter-action system described in Section 3.1.
A total of 15 users with ages between 22 and 47 years(29.378.11 years old) were asked to sketch several geo-objects.All users had at least a bachelor's degree. Only one did not possessa multi-touch device (e.g., tablet or smartphone) and 80% of thetested users do interact with a multi-touch device several times perday. All users have experienced 3D display devices (e.g., 3D moviesor IMAX), but none ever experienced custom view made from pre-cise head tracking, and 87% have used spatial interaction devices(e.g., Microsoft Kinect). The test sessions were individual and eachtask was timed. The expected duration of a test sessionwas about 60minutes and was divided in two phases. During each phase, eitherGeoCake or GeoIllustrator was tested and the user performed threegeomodeling tasks as described in the next section.
Before starting a test, it was necessary to draw which system auser would test first, although the number of users per initialsystem was as balanced as possible. Note that this is a temptativeform to prevent biased results. Then, at the beginning of eachphase, a short system presentation was made in order to explainhow each objectified functionality worked. Afterwards, the userwould test the systems up to 5 minutes to achieve habituation.Finally, the users were asked to complete a questionnaire re-garding the system and about the tasks undertaken in order toclassify the level of difficulty felt during their tasks performanceand on the use of the available features.
4.1. Geomodeling tasks
We asked users to complete three geomeodeling tasks usingboth GeoCake and GeoIllustrator (Fig. 11). The first task consistedin illustrating a simple terrain with a wide canal that crossedthrough the middle of the surface, which should be filled withwater. The second task focused on exploiting the addition of de-tails. For this purpose, an example illustration of a layer-cakemodel with several elevations and depressions was shown to the
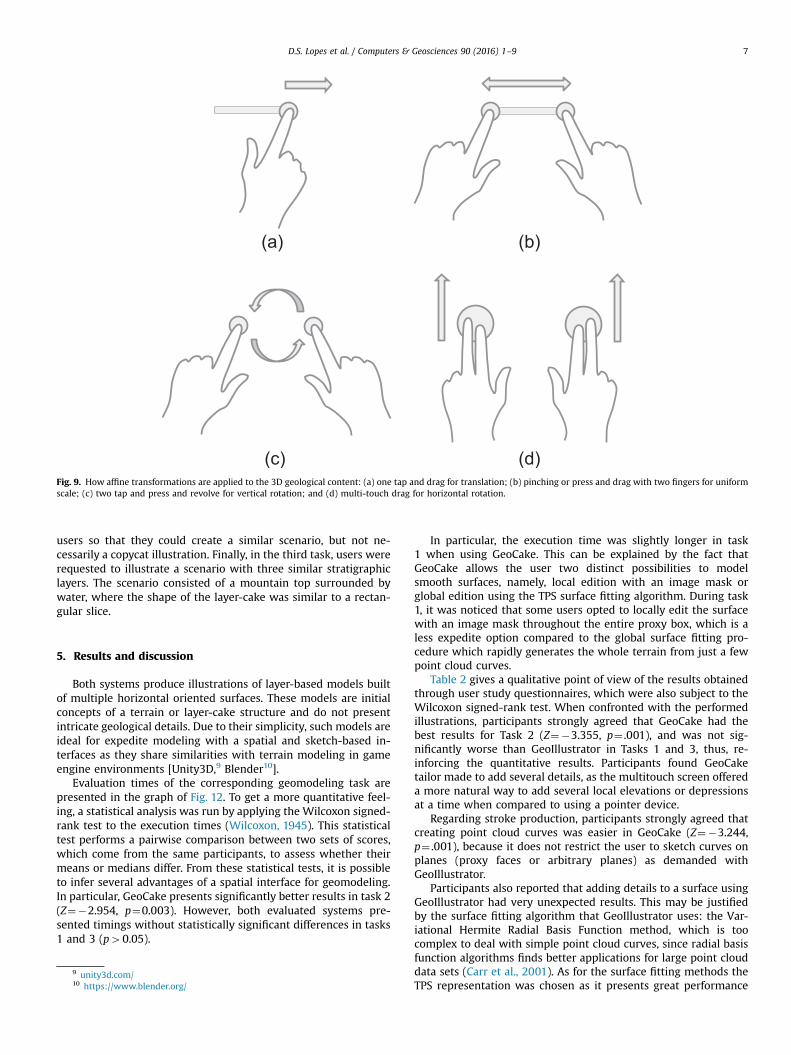
Fig. 9. How affine transformations are applied to the 3D geological content: (a) one tap and drag for translation; (b) pinching or press and drag with two fingers for uniformscale; (c) two tap and press and revolve for vertical rotation; and (d) multi-touch drag for horizontal rotation.
D.S. Lopes et al. / Computers & Geosciences 90 (2016) 1–9 7
users so that they could create a similar scenario, but not ne-cessarily a copycat illustration. Finally, in the third task, users wererequested to illustrate a scenario with three similar stratigraphiclayers. The scenario consisted of a mountain top surrounded bywater, where the shape of the layer-cake was similar to a rectan-gular slice.
5. Results and discussion
Both systems produce illustrations of layer-based models builtof multiple horizontal oriented surfaces. These models are initialconcepts of a terrain or layer-cake structure and do not presentintricate geological details. Due to their simplicity, such models areideal for expedite modeling with a spatial and sketch-based in-terfaces as they share similarities with terrain modeling in gameengine environments [Unity3D,9 Blender10].
Evaluation times of the corresponding geomodeling task arepresented in the graph of Fig. 12. To get a more quantitative feel-ing, a statistical analysis was run by applying the Wilcoxon signed-rank test to the execution times (Wilcoxon, 1945). This statisticaltest performs a pairwise comparison between two sets of scores,which come from the same participants, to assess whether theirmeans or medians differ. From these statistical tests, it is possibleto infer several advantages of a spatial interface for geomodeling.In particular, GeoCake presents significantly better results in task 2(Z¼�2.954, p¼0.003). However, both evaluated systems pre-sented timings without statistically significant differences in tasks1 and 3 (p40.05).
9 unity3d.com/10 https://www.blender.org/
In particular, the execution time was slightly longer in task1 when using GeoCake. This can be explained by the fact thatGeoCake allows the user two distinct possibilities to modelsmooth surfaces, namely, local edition with an image mask orglobal edition using the TPS surface fitting algorithm. During task1, it was noticed that some users opted to locally edit the surfacewith an image mask throughout the entire proxy box, which is aless expedite option compared to the global surface fitting pro-cedure which rapidly generates the whole terrain from just a fewpoint cloud curves.
Table 2 gives a qualitative point of view of the results obtainedthrough user study questionnaires, which were also subject to theWilcoxon signed-rank test. When confronted with the performedillustrations, participants strongly agreed that GeoCake had thebest results for Task 2 (Z¼�3.355, p¼ .001), and was not sig-nificantly worse than GeoIllustrator in Tasks 1 and 3, thus, re-inforcing the quantitative results. Participants found GeoCaketailor made to add several details, as the multitouch screen offereda more natural way to add several local elevations or depressionsat a time when compared to using a pointer device.
Regarding stroke production, participants strongly agreed thatcreating point cloud curves was easier in GeoCake (Z¼�3.244,p¼ .001), because it does not restrict the user to sketch curves onplanes (proxy faces or arbitrary planes) as demanded withGeoIllustrator.
Participants also reported that adding details to a surface usingGeoIllustrator had very unexpected results. This may be justifiedby the surface fitting algorithm that GeoIllustrator uses: the Var-iational Hermite Radial Basis Function method, which is toocomplex to deal with simple point cloud curves, since radial basisfunction algorithms finds better applications for large point clouddata sets (Carr et al., 2001). As for the surface fitting methods theTPS representation was chosen as it presents great performance
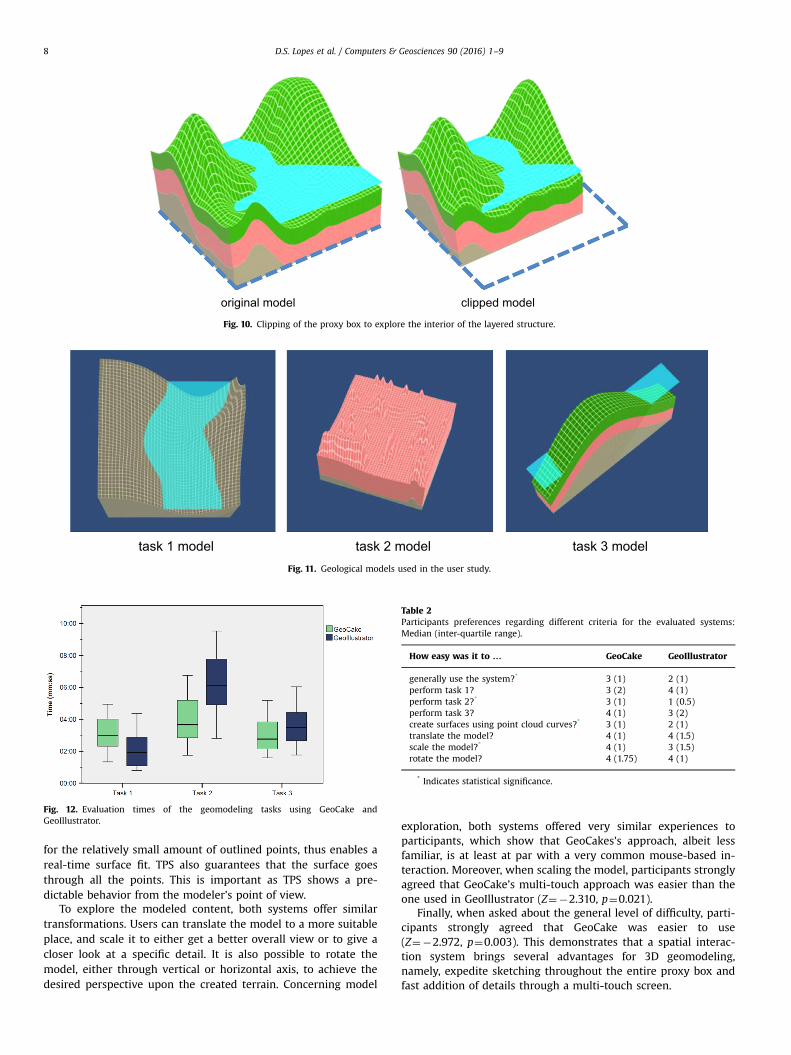
task 1 model task 2 model task 3 modelFig. 11. Geological models used in the user study.
Fig. 12. Evaluation times of the geomodeling tasks using GeoCake andGeoIllustrator.
Table 2Participants preferences regarding different criteria for the evaluated systems:Median (inter-quartile range).
How easy was it to … GeoCake GeoIllustrator
generally use the system?* 3 (1) 2 (1)perform task 1? 3 (2) 4 (1)perform task 2?* 3 (1) 1 (0.5)perform task 3? 4 (1) 3 (2)create surfaces using point cloud curves?* 3 (1) 2 (1)translate the model? 4 (1) 4 (1.5)scale the model?* 4 (1) 3 (1.5)rotate the model? 4 (1.75) 4 (1)
* Indicates statistical significance.
original model clipped model
Fig. 10. Clipping of the proxy box to explore the interior of the layered structure.
D.S. Lopes et al. / Computers & Geosciences 90 (2016) 1–98
for the relatively small amount of outlined points, thus enables areal-time surface fit. TPS also guarantees that the surface goesthrough all the points. This is important as TPS shows a pre-dictable behavior from the modeler's point of view.
To explore the modeled content, both systems offer similartransformations. Users can translate the model to a more suitableplace, and scale it to either get a better overall view or to give acloser look at a specific detail. It is also possible to rotate themodel, either through vertical or horizontal axis, to achieve thedesired perspective upon the created terrain. Concerning model
exploration, both systems offered very similar experiences toparticipants, which show that GeoCakes's approach, albeit lessfamiliar, is at least at par with a very common mouse-based in-teraction. Moreover, when scaling the model, participants stronglyagreed that GeoCake’s multi-touch approach was easier than theone used in GeoIllustrator (Z¼�2.310, p¼0.021).
Finally, when asked about the general level of difficulty, parti-cipants strongly agreed that GeoCake was easier to use(Z¼�2.972, p¼0.003). This demonstrates that a spatial interac-tion system brings several advantages for 3D geomodeling,namely, expedite sketching throughout the entire proxy box andfast addition of details through a multi-touch screen.
D.S. Lopes et al. / Computers & Geosciences 90 (2016) 1–9 9
All users reported that the spatial interactive system allows tocreate layered structures in a fast and simple way, and that handgestures are suitable to define the gross content of the surfaceswhile touch gestures are great add local details. Users rapidlyunderstood how to interact with the spatial interaction system asthey easily completed each task, without never having used thespatial interaction system before. The presented usability studyindicates that the developed spatial system is, indeed, a viablealternative to systems that incorporate a conventional WIMP in-teraction (Lidal, 2013: Bendiksen, 2013).
6. Conclusion and future work
This work explores the existing gap in geomodeling with spa-tial interactive systems. The main contribution of this work consistof exploring the potential and examines the feasibility of spatialuser interfaces for illustrating geological structures, namely, ter-rains and layer-cake structures. Users are allowed to work in asemi-virtual 3D space, where they can use hand positions andtouch gestures as inputs for geometric modeling functions. Headpositions are tracked to provide (an almost holographic) 3D vi-sualization of the produced content. In other words, the proposedsystem provides capabilities that augment both modeling and vi-sualization functions by using a limited number of 3D input andtouch gestures, allowing a direct and expeditious interaction torapidly externalize initial concepts when compared to the con-ventional use of mouse and keyboard.
As future work, it is necessary to cope with GeoCake’s currentgeomodeling limitations in order to become a more interesting toolfor geologists. In particular, the following functionalities wouldimprove expeditiousness and produce more meaningful models,namely, (i) simultaneous layer edition, where users could locally orglobally elevate or depress a series of layer in a consistent mannerwhile maintaining their relative position; (ii) sketching of othergeology features such as faults, unconformities or intrusion.
Through a usability study we compared the proposed spatialinteraction system with a conventional WIMP system. The resultsshow that through spatial interaction, users performed geomo-deling tasks in a shorter time interval. The main conclusion is thathand gestures indeed can be an effective sketch-based input formodeling heightmaps, in general, and geological layer data, inparticular. Additionally, the study demonstrates that simple geo-logical models can be successfully modeled with the proposedsketch system in both a natural and simple fashion.
Acknowledgments
All authors are thankful for the financial support given by Por-tuguese Foundation for Science and Technology (FCT). In particular,the first author thanks for the postdoctoral Grant SFRH/BPD/97449/2013 and the third author for the doctoral Grant SFRH/BD/91372/2012. This work was also partially supported by national fundsthrough FCT with reference UID/CEC/50021/2013 and TECTON-3DPTDC/EEI-SII/3154/2012. The authors would also like to thank DanielSimão for his work on coding the interface and with usability tests. Aspecial thanks goes to Daniel Patel and Christian Michelsen ResearchInstitute for allowing us to use their GeoIllustrator software.
Appendix A. Supplementary material
Supplementary data associated with this article can be found inthe online version at http://dx.doi.org/10.1016/j.cageo.2016.02.009.
References
Amorim, R., Brazil, E.V., Patel, D., Sousa, M.C., 2012. Sketch modeling of seismichorizons from uncertainty. In: Proceedings of the International Symposium onSketch-Based Interfaces and Modeling. 12, pp. 1–10.
Araújo, B.R., Casiez, G., Jorge, J.A., Hachet, M., 2013. Mockup builder: 3D modellingon and above the surface. Comput. Gr. 37 (3), 165–178.
Bærentzen, J.A., Gravesen, J., Anton, F., Aanæs, H., 2012. Guide to ComputationalGeometry Processing. Springer-Verlag, London.
Bendiksen, M., Rapid Modeling of Geology (M.Sc. Thesis), Visualization Group,Department of Informatics, University of Bergen, Norway, 2013.
Brazil, E.V., Macedo, I., Sousa, M.C., De Figueiredo, L.H., Velho, L., 2010. Sketchingvariational Hermite-rbf implicits. In Proceedings of the Seventh Sketch-BasedInterfaces and Modeling Symposium ‘10, 1–8.
Carr, J.C., Beatson, R.K., Cherrie, J.B., Fright, W.R., McCallum, B.C., Evans, T.R., 2001.Reconstruction and representation of 3D objects with radial basis functions. In:Proceedings of the 28th Annual International Conference on Computer Gra-phics and Interactive Techniques, pp. 67–76.
Caumon, G., Collon-Drouaillet, P., Le Carlier De Veslud, C., Viseur, S., Sausse, J., 2009.Surface-based 3D modeling of geological structures. Math. Geosci. 41 (8),927–945.
Gain, J., Marais, P., Straßer, W., 2009. Terrain sketching. In: Proceedings of the 2009symposium on interactive 3D graphics and games, pp. 31–38.
Galyean, T.A., Hughes, J.F., 1991. Sculpting: an interactive volumetric modelingtechnique. In: Proceedings of the 18th annual conference on Computer graphicsand interactive techniques’91 (SIGGRAPH), pp. 267–274.
Gonzalez, R.C., Woods, R.E., Eddins, S.L., 2003. Digital Image Processing UsingMATLAB. Pearson Prentice Hall.
Guiard, Y., 1987. Asymmetric division of labor in human skilled bimanual action:the kinematic chain as a model. J. Motor Behav. 19, 486–517.
Hilliges, O., Kim, D., Izadi, S., Weiss, M., Wilson, A., 2012. HoloDesk: direct 3D in-teractions with a situated see-through display. In: Proceedings of the SIGCHIConference on Human Factors in Computing Systems ’12, pp. 2421–2430.
Hnaidi, H., Guérin, E., Akkouche, S., Peytavie, A., Galin, E., 2010. Feature based ter-rain generation using diffusion equation. Comput. Gr. Forum 29 (7), ), 21–79–218.
Jessell, M.W., Valenta, R.K., 1996. Structural geophysics: Integrated structural andgeophysical modeling. Comput. Methods Geosci. 15, 303–324.
Keefe, D., Acevedo, D., Moscovich, T., Laidlaw, D.H., Laviola, J., 2001. CavePainting: afully immersive 3D artistic medium and interactive experience. In: Proceedingsof ACM Symposium on Interactive 3D Graphics ‘01, pp. 85–93.
Kim, S.-G., Kim, J.-W., Bae, K.-T., Lee, C.-W., 2006. Multi-Touch Interaction for Table-Top Display. Advances in Artificial Reality and Tele-Existence, Lecture Notes inComputer Science 4282. Springer Berlin Heidelberg, pp. 1273–1282.
Kooima, R., 2008. Generalized perspective projection. Technical report. LouisianaState University.
Laurent, G., Caumon, G., Jessell, M., 2015. Interactive editing of 3D geologicalstructures and tectonic history sketching via a rigid element method. Comput.Geosci. 74, 71–86.
Lidal, E.M., 2013. Sketch-Based Storytelling for Cognitive Problem Solving Ex-ternalization, Evaluation, and Communication in Geology. University of Bergen.
Lidal, E.M., Natali, M., Patel, D., Hauser, H., Viola, I., 2013. Geological storytelling.Comput. Gr. 37 (5), 445–459.
Natali, M., Viola, I., Patel, D., 2012. Rapid visualization of geological concepts. In:Proceedings of the 25th SIBGRAPI Conference on Graphics, Patterns and Images(SIBGRAPI), pp. 150–157.
Natali, M., Lidal, E.M., Parulek, J., Viola, I., Patel, D., 2013. Modeling terrains andsubsurface geology. In: EuroGraphics 2013 State of the Art Reports (STARs), pp.155–173.
Natali, M., Klausen, T.G., Patel, D., 2014. Sketch-based modelling and visualization ofgeological deposition. Comput. Geosci. 67, 40–48.
Olsen, J., 2004. Realtime procedural terrain generation. Technical report, Depart-ment of Mathematics And Computer Science, (IMADA) University of SouthernDenmark.
Peytavie, A., Galin, E., Merillou, S., Grosjean, J., 2009. Procedural generation of rockpiles using aperiodic tiling. Proc. Pac. Gr. 28 (7), 1801–1810.
Piper, B., Ratti, C., Ishii, H., 2002. Illuminating clay: a 3-D tangible interface forlandscape analysis. In: Proceedings of the SIGCHI Conference on Human Factorsin Computing Systems ’02, pp. 355–362.
Schkolne, S., Pruett, M., Schröder, P., 2001. Surface drawing: creating organic 3Dshapes with the hand and tangible tools. In: Proceedings of the SIGCHI Con-ference on Human Factors in Computing Systems ’01, pp. 261–268.
Stava, O., Benes, B., Brisbin, M., Krivanek, J., 2008. Interactive terrain modeling usinghydraulic erosion. In: Proceedings of the 2008 ACM SIGGRAPH/EurographicsSymposium on Computer Animation, pp. 201–210.
Tasse, F.P., Emilien, A., Cani, M.-P., 2014. Hahmann, S., Bernhardt, A., 2014. Firstperson sketch-based terrain editing. In: Proceeding GI’‘14 Proceedings of the2014 Graphics Interface Conference Pages 217–224.
Turner, K., 2006. Challenges and trends for geological modelling and visualisation.Bull. Eng. Geol. Environ. 65 (2), 109–127.
Turner, A., Gable, C., 2007. A review of geological modeling. Three-dimensionalgeologic mapping for groundwater applications. Minnesota Geological SurveyOpen-file Report, 07–4. 2.
Wilcoxon, F., 1945. Individual comparisons by ranking methods. Biom. Bull. 1 (6),80–83.
Wilson, J.P., 2012. Digital terrain modeling. Geomorphology 137 (1), 107–121.