Expedia Project Report
23
MIS 6356 Business Analytics with R Project Report - Expedia Dataset
-
Upload
dipendu-chanda -
Category
Documents
-
view
88 -
download
4
Transcript of Expedia Project Report
MIS 6356Business Analytics with R
Project Report - Expedia Dataset
2
Getting value from data is difficult but…
“If you torture the data long enough, it will confess.”
-Ronald Coase, Economist
3
Why we chose Expedia?
• Huge volumes of data generated online
• Use of analytics for customer behavior prediction
• Scope of improvement
• Directly adding value to Expedia business
• Challenges in handling more than 10 million records
4
Data Description• In this project, we are using Expedia’s dataset that includes shopping and
purchase of customer data as well as information on price competitiveness.
• The data are organized around a set of “search result impressions”, or the ordered list of hotels that the user sees after they search for ahotel on the website along with other details like promotions, user review etc. for the hotels.
• The user response is provided as a click on a hotel or/and a purchase of a hotel room. Using this Expedia dataset we are predicting if the final booking has been done by the user.
5
6
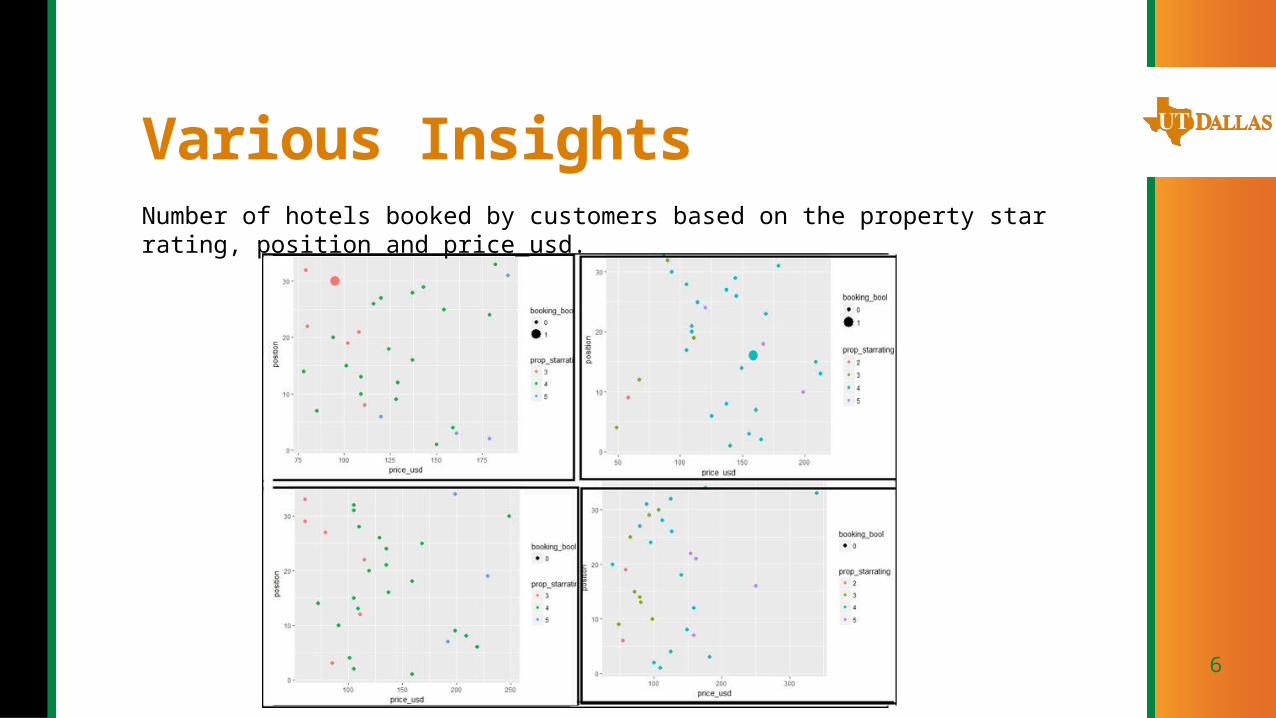
Various InsightsNumber of hotels booked by customers based on the property star rating, position and price_usd.
7
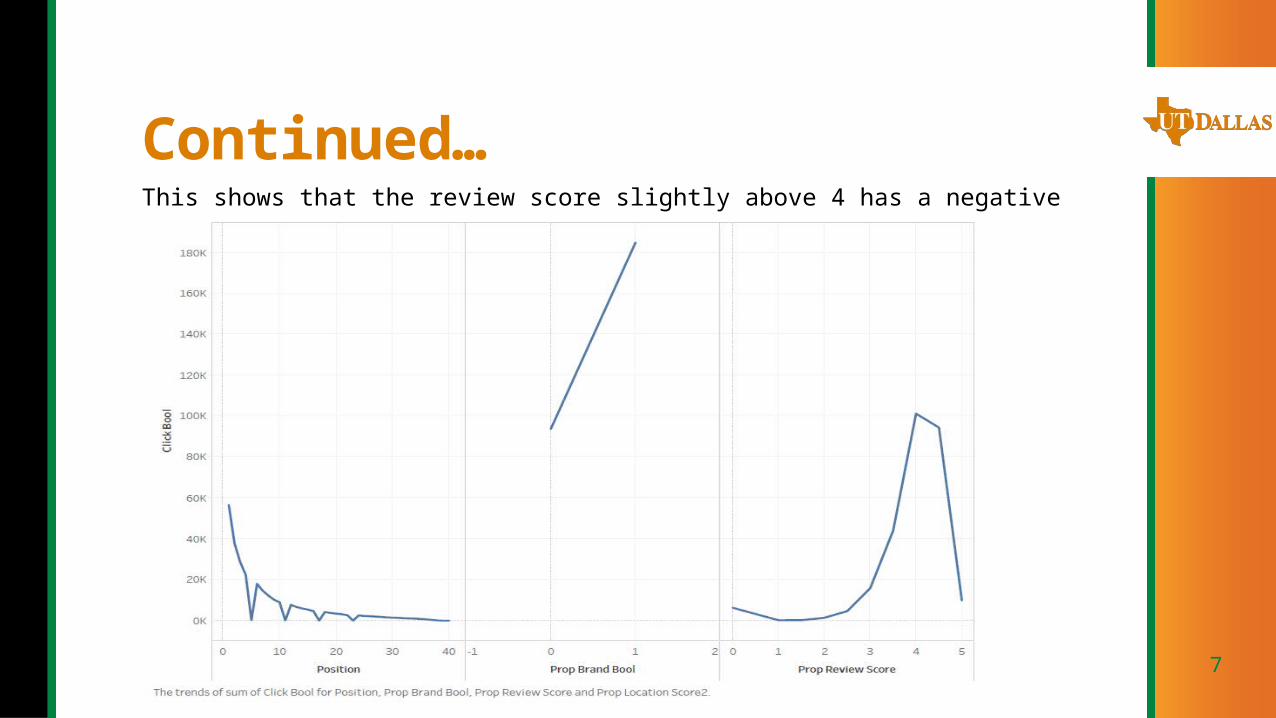
Continued…This shows that the review score slightly above 4 has a negative impact on the y variable.
8
Exploratory Data Analysis (EDA)Why EDA?• Detection of mistakes
• Checking of assumptions (feature engineering)
• Preliminary selection of appropriate models
• Determining relationships among the explanatory variables (Correlation)
• Assessing the direction and rough size of relationships between explanatory and outcome variables.
9
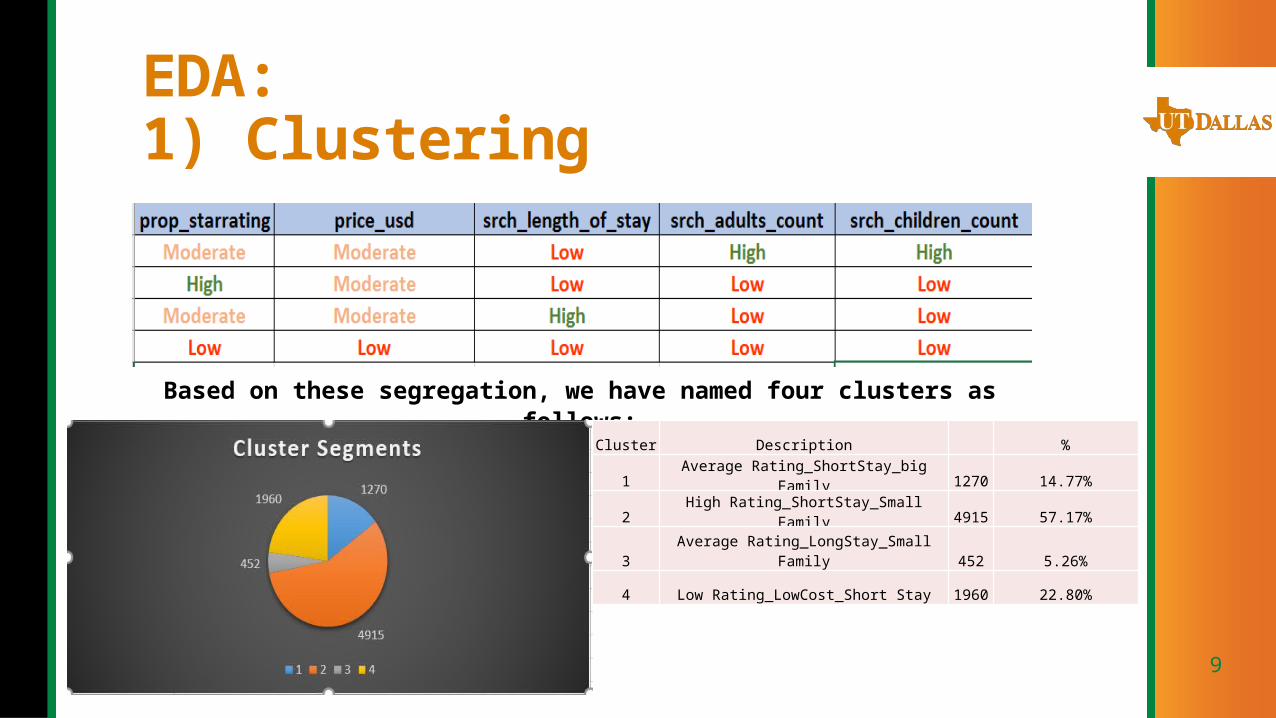
EDA:1) Clustering
Based on these segregation, we have named four clusters as follows:
Cluster Description %
1 Average Rating_ShortStay_big Family 1270 14.77%
2 High Rating_ShortStay_Small Family 4915 57.17%
3 Average Rating_LongStay_Small Family 452 5.26%
4 Low Rating_LowCost_Short Stay 1960 22.80%
10
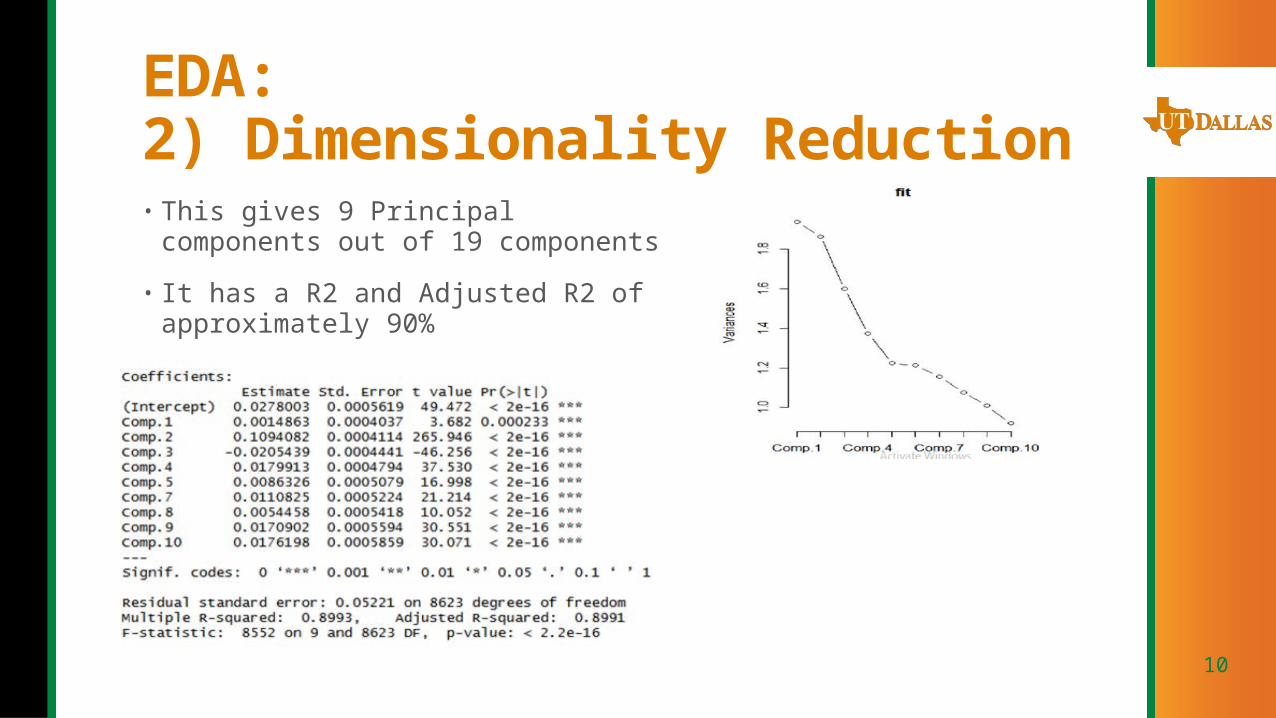
EDA: 2) Dimensionality Reduction• This gives 9 Principal components out of 19
components
• It has a R2 and Adjusted R2 of approximately 90%
11
Data Preprocessing• Data Partitioning
• Eliminated data biasing keeping equal set of 0’s and 1’s in the response variable.
• Removed multicollinearity between the predictor variables using correlation analysis.
• Eliminated the columns with more than 98% missing values.
• Data Imputation using MICE package
• Feature Scaling - normalization
12
Business Intelligence Models:1. Linear Model
2. Decision Trees
3. Random Forest
4. Logistic Regression
5. Support Vector Machines
6. k -Nearest Neighbor
13
1. Linear Model
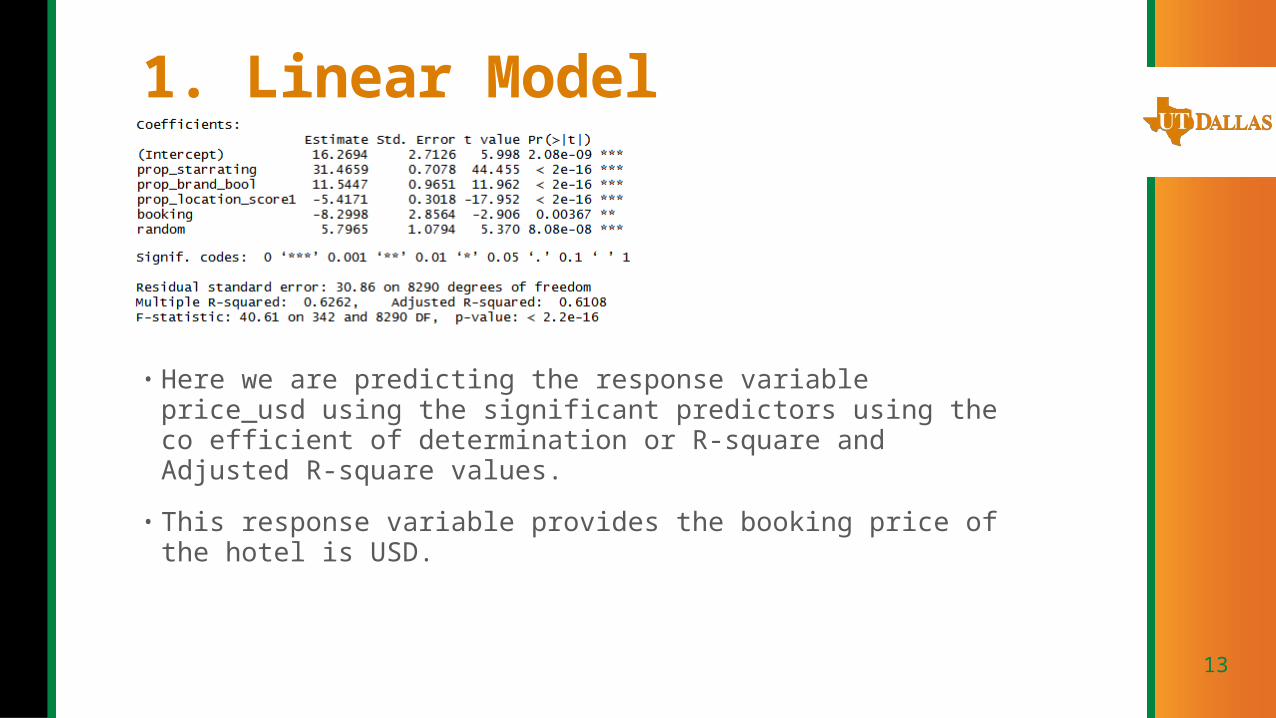
• Here we are predicting the response variable price_usd using the significant predictors using the co efficient of determination or R-square and Adjusted R-square values.
• This response variable provides the booking price of the hotel is USD.
14
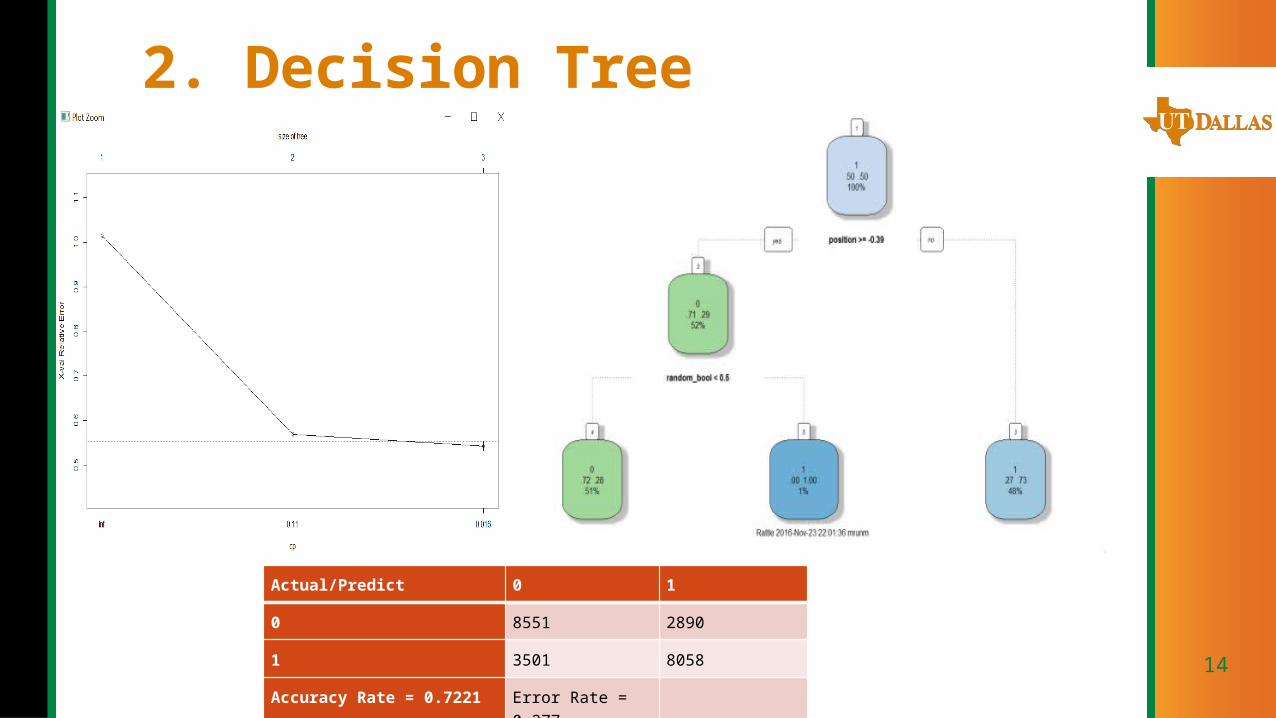
2. Decision Tree
Actual/Predict 0 1
0 8551 2890
1 3501 8058
Accuracy Rate = 0.7221 Error Rate = 0.277
15
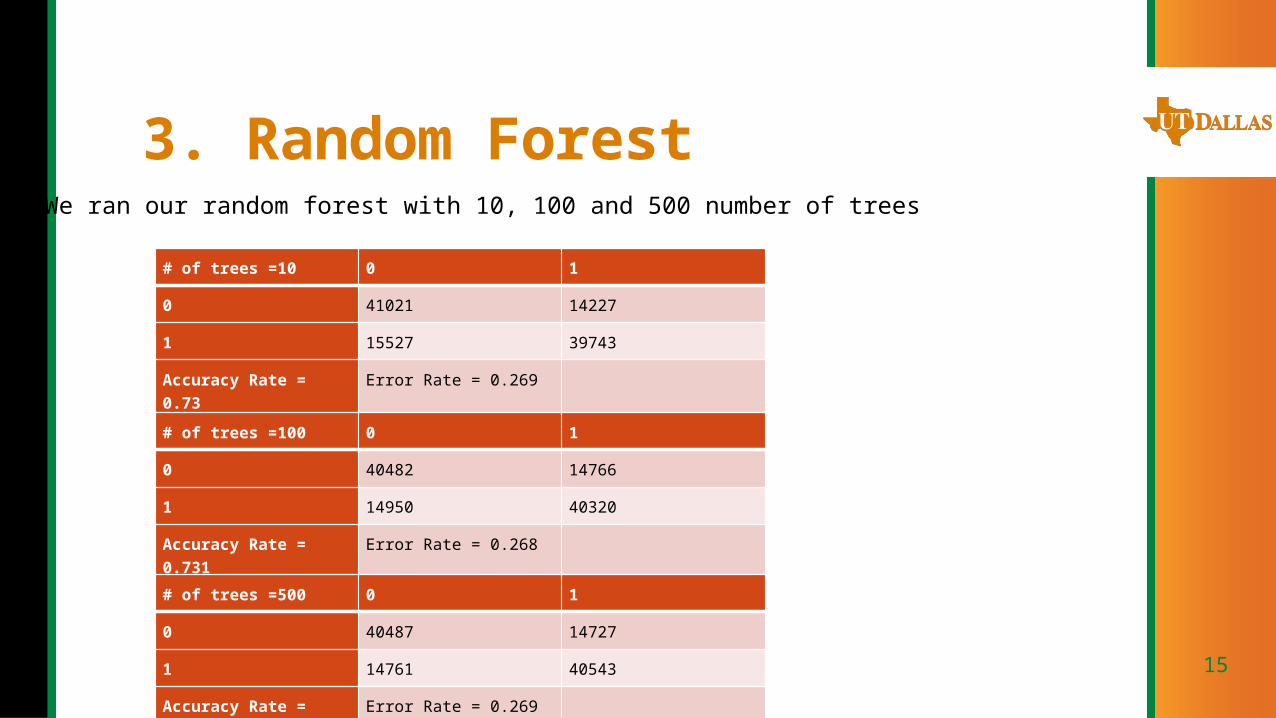
3. Random Forest
# of trees =10 0 1
0 41021 14227
1 15527 39743
Accuracy Rate = 0.73
Error Rate = 0.269
# of trees =100 0 1
0 40482 14766
1 14950 40320
Accuracy Rate = 0.731
Error Rate = 0.268
# of trees =500 0 1
0 40487 14727
1 14761 40543
Accuracy Rate = 0.733
Error Rate = 0.269
We ran our random forest with 10, 100 and 500 number of trees
16
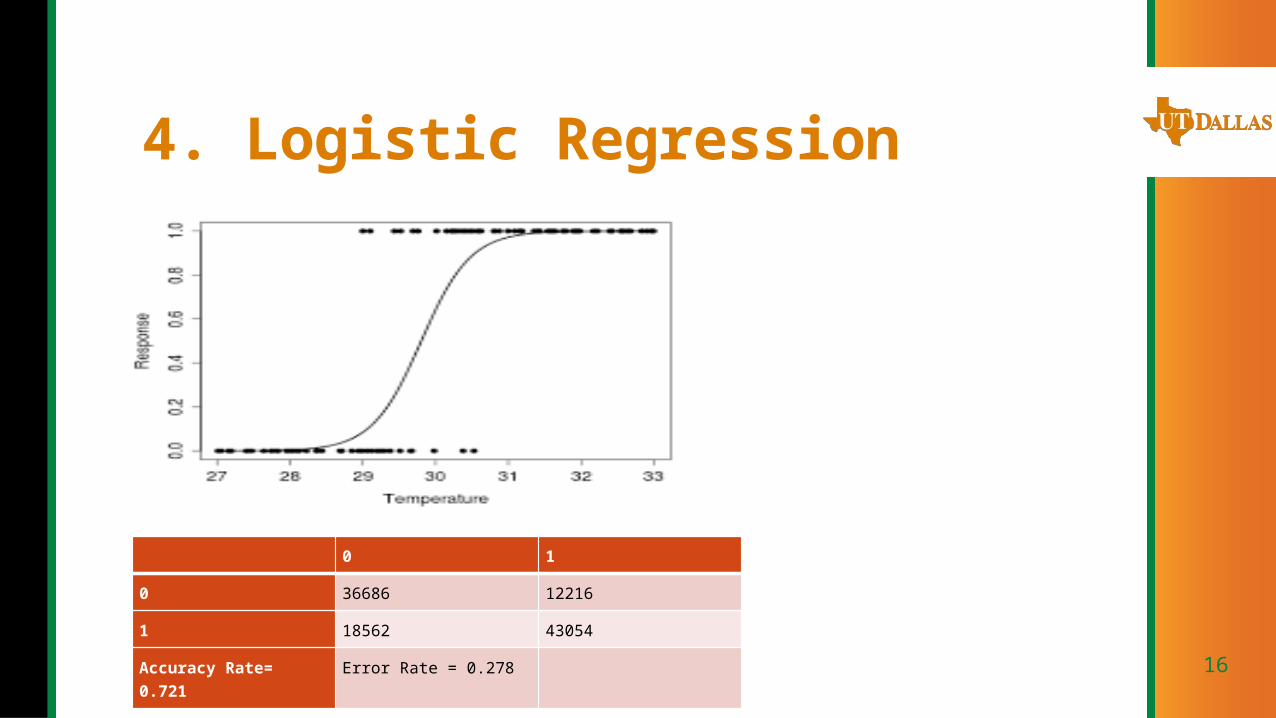
4. Logistic Regression
0 1
0 36686 12216
1 18562 43054
Accuracy Rate= 0.721
Error Rate = 0.278
17
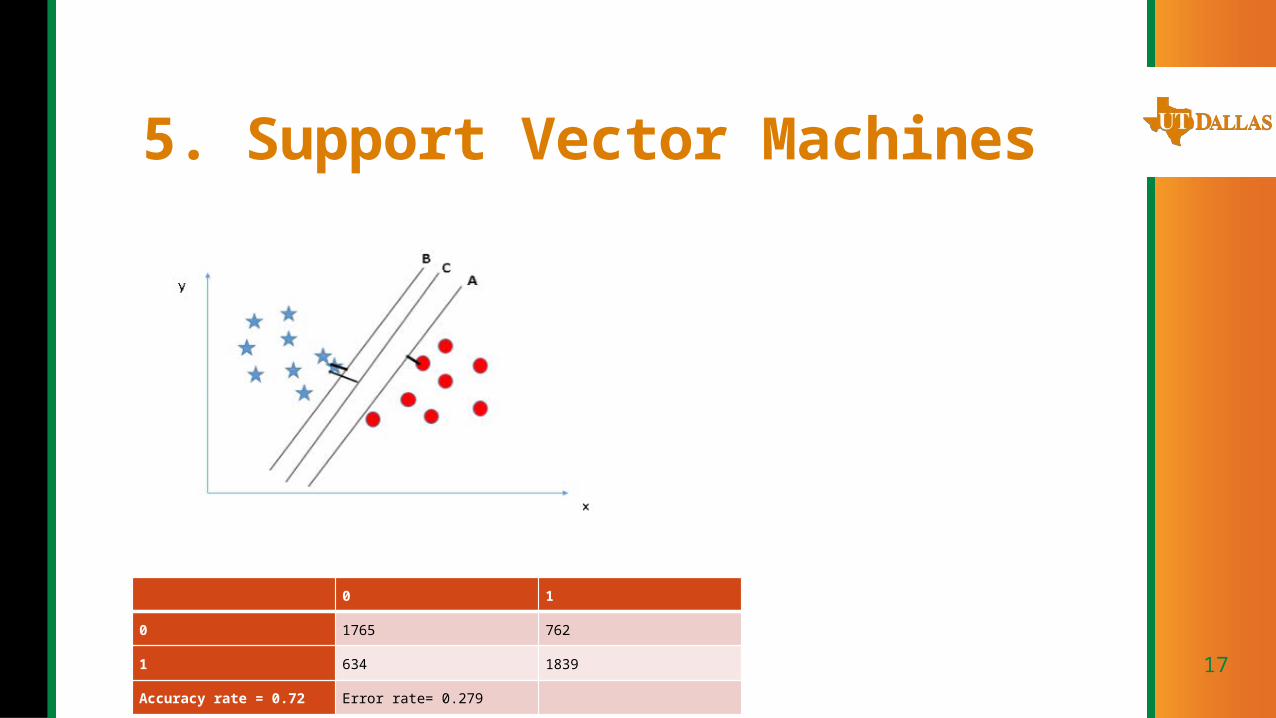
5. Support Vector Machines
0 1
0 1765 762
1 634 1839
Accuracy rate = 0.72 Error rate= 0.279
18
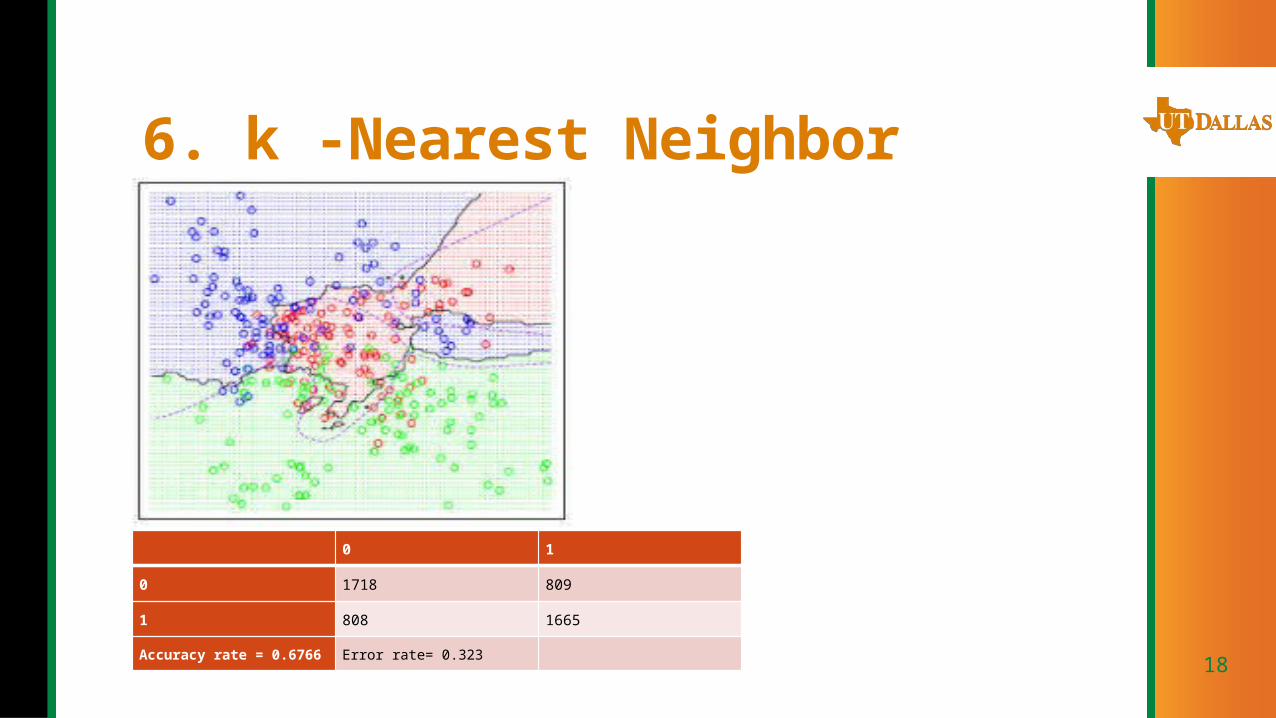
6. k -Nearest Neighbor
0 1
0 1718 809
1 808 1665
Accuracy rate = 0.6766 Error rate= 0.323
19
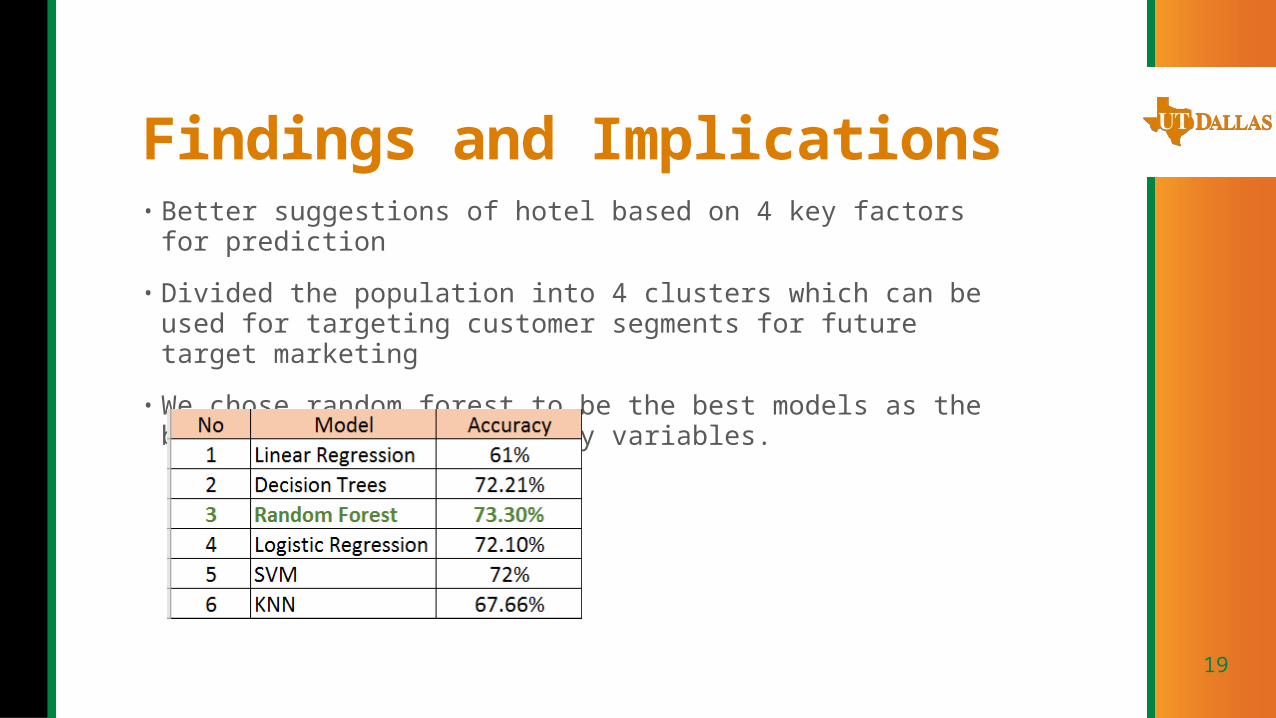
Findings and Implications• Better suggestions of hotel based on 4 key factors for prediction
• Divided the population into 4 clusters which can be used for targeting customer segments for future target marketing
• We chose random forest to be the best models as the best predictor from the key variables.
20
Delivering value to expedia• Hotels positioned at 1st , 2nd and 3rd have high chances being clicked on.
• Considering other parameters constant, there is less chance of a hotel being picked by a customer if the hotel is positioned at places 4th , 5th and 6th .
• A hotel that is recognized by a brand has 28% higher chance of getting picked by a customer.
• Review scores from 3.5 to 4.5 have higher chances of getting clicked
21
Delivering value to expedia• Using classification models such as Logistic Regression, Random Forests , SVM we are able
to predict the probability of a hotel being booked by a potential customer.
• These insights are used in a ranking algorithm that uses the click data and customer database to deliver personalized results for a hotel search query
• We can strategically position our search results to reduce bounce rate and increase the chance of converting a search into booking
• Using customer properties, we have classified them into a clusters and will use them in a ranking algorithm which will rank the hotels based on the probabilities predicted by our classification models.
• If customer belongs to Average Rating_ShortStay_big Family, our models are able to estimate the probability of a sale with 69% accuracy.
• If customer belongs to High Rating_ShortStay_Small Family, our models are able to estimate the probability of a sale with 83% accuracy.
• If customer belongs to Average Rating_LongStay_Small Family, our models are able to estimate the probability of a sale with 73% accuracy.
• If customer belongs to Low Rating_LowCost_Short Stay, our models are able to estimate the probability of a sale with 49% accuracy.
22
Summary• Based on these results Expedia can predict the hotel based on user behavior
and property popularity. This will guide user to choose the best possible property in the initial search list.
• We used various data preprocessing techniques to cleanse the data, scale the data.
• We have tried out modelling the project using 5 different statistical approaches to predict booking by users based on key variables.
• From the results obtained, the Random forest model is identified as the feasible approach, as it yields the highest accuracy based on evaluating classifiers.
• By having more valid competitor data by imputation through functional acumen we can increase the accuracy of the model in turn increasing the predicting ability.
23
References[1] https://www.cs.princeton.edu/courses/archive/spring07/cos424/papers/mitchell-dectrees.pdf
[2] https://www.analyticsvidhya.com/blog/2016/04/complete-tutorial- tree-based- modeling-scratch- in-python/
[3] Lecture Notes
[4] https://www.youtube.com/
[5] https://www.r-bloggers.com/how-to-learn-r-2/
[6] http://stats.stackexchange.com/
[7] http://stackoverflow.com/