Expected Ideal Solution and Verified By Numerical Analysis ...
10
*Corresponding author email: [email protected] Symbiosis Group International Journal of Advanced Robotics and Automation Open Access Symbiosis www.symbiosisonline.org www.symbiosisonlinepublishing.com Expected Ideal Solution and Verified By Numerical Analysis for a Triangular Unit Cell Model Jeongho Choi* School of Mechanical Engineering, Kyungnam University, Masanhappo-gu, Changwon-si, Gyeongsangnam-do 51767, Republic of Korea Research Article Abstract This study aims to provide critical information regarding the development of ultralight materials with tailored properties using a triangular unit cell model. Three different types of triangular unit cells (or triangular prism unit cells, e.g. OST, OTT, and CTT) were studied via finite element analysis to calculate and compare their relative density, stiffness, and strength. The relative stiffness and strength were extracted under a compression load. The ideal solutions were calculated using commercial finite element analysis software and then compared to the ideal Gibson–Ashby solution. The relative Young’s modulus and the relative yield strength for the three different unit cell models are shown to differ from the ideal solution of the Gibson– Ashby theory. In conclusion, the effective stiffness of the OTT and CTT is higher than that of the Gibson-Ashby model. When the relative density is more than 0.1, the OTT and CTT have higher yield strength. OTT and CTT have a higher plastic strength when the relative density is more than 0.03–0.05. For aerospace or automobile use, further study is needed to find the optimum truss and aperture sizes and shape of the unit model. Keywords: Cellular solids; Effective medium; Relative properties; Triangular unit cell; Received: April 04, 2018; Accepted: April 18, 2018; Published: April 23, 2018 *Corresponding author: Jeongho Choi, School of Mechanical Engineering, Kyungnam University, 7 Kyungnamdaehak-ro, Masanhappo-gu, Changwon-si, Gyeongsangnam-do 51767, Republic of Korea, Tel: +82-55-249-2210; E-mail: [email protected] Introduction Periodic Cellular Metals (PCMs), which are defined by the Gibson–Ashby ideal solutions, are important research and development topics [1,2]. PCMs are composed of open or closed unit cells. The study of the closed or open unit cells is an important step in the development and the prediction of the properties of a new PCM structure. The study of the closed or open unit cells is an important step in the development and the prediction of the properties of a new PCM structure. Engineers and scientists have developed several applications of PCMs. Choi, et al. [3,4,5,6] created a unit cell model with a truss and developed a complex structure and unit cell models such as corrugated wire mesh laminate and pinwheel trusses. The development of a new unit cell model is the most important aspect for building a sandwich core structure. Gumruk, et al. [7] studied heat protection, thermal insulation, and packaging for the automotive and shipping industries. Rejab, et al. [8], Zhang, et al. [9], Jeong, et al. [10], and Schaedler, et al. [11] showed other applications such as sound insulation, battery electrodes, catalyst supports, acoustics, vibration or shock energy damping, filters with broader contact areas, such as those in chemical reactions, and packaging with energy absorption. Sypeck, [12,13] and Wadley, [14] showed that lattice truss topologies have the potential to be created as triangular, diamond prismatic, Navtruss, a tetrahedral lattice, a pyramidal lattice, three-dimensional Kagome, diamond textile, diamond collinear, and square collinear. Hutchinson, et al. [15] proposed an advanced structure referred to as a microlattice, which was created by HRL Laboratories. This structure was lighter than other structures because it used advanced technology. In addition, Linul, et al. [16] studied open cell forms using numerical analysis for different sizes of models. Serban, et al. [17] investigated open-cell foams through numerical analysis. Thus, several scientists and researchers have focused on developing better structures by applying PCM structure unit cells in various fields. The advantages of trusses are applicability, low weight, cost effectiveness, versatility, open-cell construction, and environmental toughness. Additionally, they are potentials such as structural strength, blast protection, ballistic protection, and heat exchange. Low weight implies functionality, such as carrying larger payloads, providing additional storage, reducing fuel consumption, and allowing for higher speed. The low weight and multifunctional attributes provide time and cost effectiveness. Additionally, core topology, cell size, or relative density is optimized depending on the application. Open-cell topologies or periodic microtruss structures allow for the use of additional materials for increasing ballistic resistance. Industrial companies, such as Cellular Materials International Inc. [18] and Boeing, [19], have shown that microtruss structures can provide protection from environmental problems such as corrosion in marine applications, the high-heat conditions of space, and reentry vehicle applications.
Transcript of Expected Ideal Solution and Verified By Numerical Analysis ...
*Corresponding author email: [email protected] Group
International Journal of Advanced Robotics and Automation Open Access
Symbiosis www.symbiosisonline.org www.symbiosisonlinepublishing.com
Expected Ideal Solution and Verified By Numerical Analysis for a Triangular
Unit Cell ModelJeongho Choi*
School of Mechanical Engineering, Kyungnam University, Masanhappo-gu, Changwon-si, Gyeongsangnam-do 51767, Republic of Korea
Research Article
AbstractThis study aims to provide critical information regarding the
development of ultralight materials with tailored properties using a triangular unit cell model. Three different types of triangular unit cells (or triangular prism unit cells, e.g. OST, OTT, and CTT) were studied via finite element analysis to calculate and compare their relative density, stiffness, and strength. The relative stiffness and strength were extracted under a compression load. The ideal solutions were calculated using commercial finite element analysis software and then compared to the ideal Gibson–Ashby solution. The relative Young’s modulus and the relative yield strength for the three different unit cell models are shown to differ from the ideal solution of the Gibson–Ashby theory. In conclusion, the effective stiffness of the OTT and CTT is higher than that of the Gibson-Ashby model. When the relative density is more than 0.1, the OTT and CTT have higher yield strength. OTT and CTT have a higher plastic strength when the relative density is more than 0.03–0.05. For aerospace or automobile use, further study is needed to find the optimum truss and aperture sizes and shape of the unit model.
Keywords: Cellular solids; Effective medium; Relative properties; Triangular unit cell;
Received: April 04, 2018; Accepted: April 18, 2018; Published: April 23, 2018
*Corresponding author: Jeongho Choi, School of Mechanical Engineering, Kyungnam University, 7 Kyungnamdaehak-ro, Masanhappo-gu, Changwon-si, Gyeongsangnam-do 51767, Republic of Korea, Tel: +82-55-249-2210; E-mail: [email protected]
IntroductionPeriodic Cellular Metals (PCMs), which are defined by the
Gibson–Ashby ideal solutions, are important research and development topics [1,2]. PCMs are composed of open or closed unit cells. The study of the closed or open unit cells is an important step in the development and the prediction of the properties of a new PCM structure. The study of the closed or open unit cells is an important step in the development and the prediction of the properties of a new PCM structure. Engineers and scientists have developed several applications of PCMs. Choi, et al. [3,4,5,6] created a unit cell model with a truss and developed a complex structure and unit cell models such as corrugated wire mesh laminate and pinwheel trusses. The development of a new unit cell model is the most important aspect for building a sandwich core structure. Gumruk, et al. [7] studied heat protection, thermal
insulation, and packaging for the automotive and shipping industries. Rejab, et al. [8], Zhang, et al. [9], Jeong, et al. [10], and Schaedler, et al. [11] showed other applications such as sound insulation, battery electrodes, catalyst supports, acoustics, vibration or shock energy damping, filters with broader contact areas, such as those in chemical reactions, and packaging with energy absorption. Sypeck, [12,13] and Wadley, [14] showed that lattice truss topologies have the potential to be created as triangular, diamond prismatic, Navtruss, a tetrahedral lattice, a pyramidal lattice, three-dimensional Kagome, diamond textile, diamond collinear, and square collinear. Hutchinson, et al. [15] proposed an advanced structure referred to as a microlattice, which was created by HRL Laboratories. This structure was lighter than other structures because it used advanced technology. In addition, Linul, et al. [16] studied open cell forms using numerical analysis for different sizes of models. Serban, et al. [17] investigated open-cell foams through numerical analysis. Thus, several scientists and researchers have focused on developing better structures by applying PCM structure unit cells in various fields.
The advantages of trusses are applicability, low weight, cost effectiveness, versatility, open-cell construction, and environmental toughness. Additionally, they are potentials such as structural strength, blast protection, ballistic protection, and heat exchange. Low weight implies functionality, such as carrying larger payloads, providing additional storage, reducing fuel consumption, and allowing for higher speed. The low weight and multifunctional attributes provide time and cost effectiveness. Additionally, core topology, cell size, or relative density is optimized depending on the application. Open-cell topologies or periodic microtruss structures allow for the use of additional materials for increasing ballistic resistance. Industrial companies, such as Cellular Materials International Inc. [18] and Boeing, [19], have shown that microtruss structures can provide protection from environmental problems such as corrosion in marine applications, the high-heat conditions of space, and reentry vehicle applications.

Page 2 of 10Citation: Choi J (2018) Expected Ideal Solution and Verified By Numerical Analysis for a Triangular Unit Cell Model. Int J Adv Robot Automn 3(2): 1-10. DOI: 10.15226/2473-3032/3/1/00133
Expected Ideal Solution and Verified By Numerical Analysis for a Triangular Unit Cell Model
Copyright: © 2018 Choi J
The disadvantages of trusses are that truss models are created using conventional materials, which are monolithic and heavy with high densities. Truss models must consider bonding techniques. That is, crossed points in truss models are not easily bonded. The material properties of truss models may change because of the heat treatment during bonding. In addition, the bonding procedure is time consuming and expensive. To solve these problems, the use of advanced techniques, such as three-dimensional printing, is required.
Liu, et al. [20] studied effective elastic moduli of triangular lattice materials theoretically and then they checked the ideal solution with finite element analysis. And Ptochos, et al. [21] reported mechanical properties of micro-lattice structures by calculated analytically.
This study investigates the ideal solutions and simulations for truss unit cell models, which are defined as Opened Truss-wall Triangular (OTT), Opened Solid-wall Triangular (OST), and Closed Truss-wall Triangular (CTT) models. Replacing solid walls with truss structures can result in weight reduction. In other words, the OTT model is a structure in which the solid wall of the OST model is replaced by a truss. The CTT model is a structure with an open face covered by a truss. The relative modulus and relative compressive yield strength obtained for the OST, OTT, and CTT models are compared to the Gibson–Ashby ideal solutions which describe relative stiffness of a model correlated with relative density of cell geometry. The goal of this study is to determine the effective stiffness and effective strength for the truss-wall triangular unit cell models as a function of the relative density.
Ideal SolutionUnit Cell Model
The unit cell is a fundamental concept for creating a sandwich structure. This implies that a unit cell model is a repeated configuration. For a truss-wall unit cell model, relative stiffness is proportional to the square, which infer cell geometry, of relative density and relative strength is proportional to relative density to the power of 3/2 on a log–log scale, as shown by Gibson, et al. [2]. That is,
Where C1 and C2 are constant. These infer the Eq.1 is moving left or right and the power means slope.
Relative Density
Relative density (ρ*/ρs) is proportional to the inverse of relative volume (Vs/V*), which is the ratio of the volume of a solid wall to the volume of the cellular structure.
2* *
1
3* * 2
2
(1)s s
s s
E CE
and
C
ρρ
σ ρσ ρ
=
=
The unit cell model is based on a solid wall model. The model is expected to have the same correlation between volume and density as a power law, and it uses parameters such as diameter, opening width, and the total number of trusses in the directions of length, width, and height. This model has the same relationship between relative density and relative volume as the OST or OTT models.
Opened Solid-Wall Triangular (OST) Model
An ideal solution was derived for the relative density of the triangular prism, and this is shown in figure 1. The volume of the applied material is
The volume of the foam is
The relative density for a triangular prism is shown in Eq.5 and Eq.6. It means l-t/4) is not equal to zero but positive value in Eq.3 The ratio of thickness and length satisfies the condition that thickness must be smaller than four times the length. To compare this with the OST model, it is assumed that the thickness in the solid-wall triangular model is equal to the diameter of the truss-triangular wall. These are coming from Gibson, et al. [2].
*
* (2)s
s
VV
ρρ
∝
Figure 1: Schematic OST model (h = height; l = length, width; t = thick-ness)
3 (3)8 4s
tV ht l = −
* 23 (4)8
V l h=
*
, (5)s
t t ll
ρρ
= <
*
, (6)s
d d ll
ρρ
= <
Page 3 of 10Citation: Choi J (2018) Expected Ideal Solution and Verified By Numerical Analysis for a Triangular Unit Cell Model. Int J Adv Robot Automn 3(2): 1-10. DOI: 10.15226/2473-3032/3/1/00133
Expected Ideal Solution and Verified By Numerical Analysis for a Triangular Unit Cell Model
Copyright: © 2018 Choi J
Opened Truss-Wall Triangular (OTT) Model
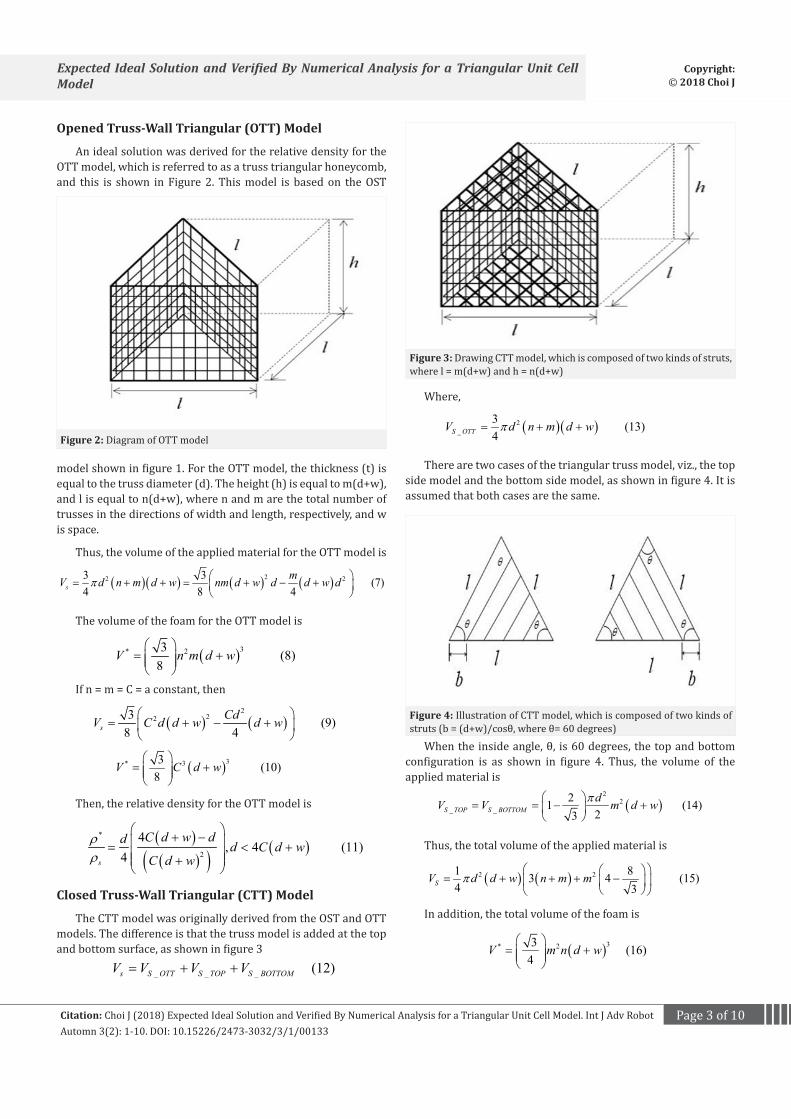
An ideal solution was derived for the relative density for the OTT model, which is referred to as a truss triangular honeycomb, and this is shown in Figure 2. This model is based on the OST
Figure 2: Diagram of OTT model
model shown in figure 1. For the OTT model, the thickness (t) is equal to the truss diameter (d). The height (h) is equal to m(d+w), and l is equal to n(d+w), where n and m are the total number of trusses in the directions of width and length, respectively, and w is space.
Thus, the volume of the applied material for the OTT model is
The volume of the foam for the OTT model is
If n = m = C = a constant, then
Then, the relative density for the OTT model is
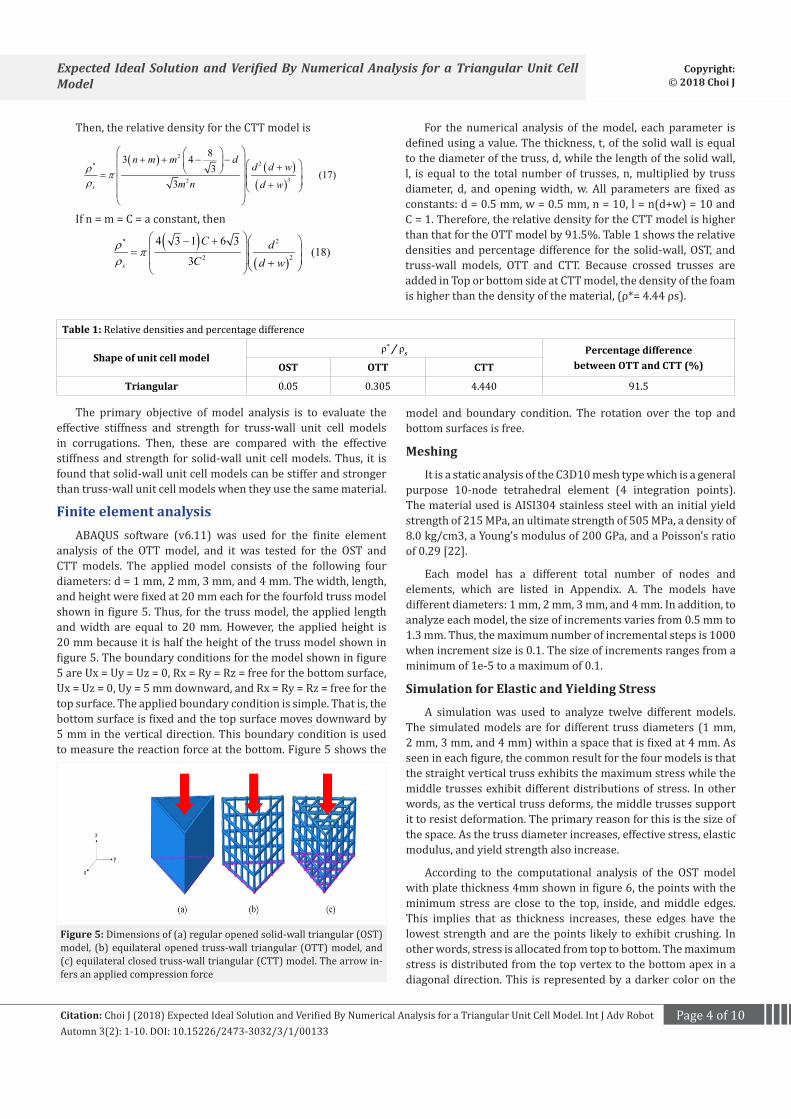
Closed Truss-Wall Triangular (CTT) Model
The CTT model was originally derived from the OST and OTT models. The difference is that the truss model is added at the top and bottom surface, as shown in figure 3
( )( ) ( ) ( )22 23 3 (7)4 8 4s
mV d n m d w nm d w d d w dπ = + + = + − +
( )3* 23 (8)8
V n m d w
= +
( ) ( )2
223 (9)8 4s
CdV C d d w d w
= + − +
( )3* 33 (10)8
V C d w
= +
( )( )( ) ( )
*
2
4, 4 (11)
4s
C d w dd d C d wC d w
ρρ
+ − = < + +
_ _ _ (12)s S OTT S TOP S BOTTOMV V V V= + +
Figure 3: Drawing CTT model, which is composed of two kinds of struts, where l = m(d+w) and h = n(d+w)
Where,
There are two cases of the triangular truss model, viz., the top side model and the bottom side model, as shown in figure 4. It is assumed that both cases are the same.
( )( )2_
3 (13)4S OTTV d n m d wπ= + +
Figure 4: Illustration of CTT model, which is composed of two kinds of struts (b = (d+w)/cosθ, where θ= 60 degrees)
When the inside angle, θ, is 60 degrees, the top and bottom configuration is as shown in figure 4. Thus, the volume of the applied material is
Thus, the total volume of the applied material is
In addition, the total volume of the foam is
( )2
2_ _
21 (14)23S TOP S BOTTOMdV V m d wπ
= = − +
( ) ( )2 21 83 4 (15)4 3SV d d w n m mπ
= + + + −
( )3* 23 (16)4
V m n d w
= +
Page 4 of 10Citation: Choi J (2018) Expected Ideal Solution and Verified By Numerical Analysis for a Triangular Unit Cell Model. Int J Adv Robot Automn 3(2): 1-10. DOI: 10.15226/2473-3032/3/1/00133
Expected Ideal Solution and Verified By Numerical Analysis for a Triangular Unit Cell Model
Copyright: © 2018 Choi J
Then, the relative density for the CTT model is
If n = m = C = a constant, then
( ) ( )( )
22*
32
83 43 (17)
3s
n m m dd d w
m n d wρ πρ
+ + − − + =
+
( )( )
* 2
2 2
4 3 1 6 3 (18)
3s
C dC d w
ρ πρ
− + =
+
For the numerical analysis of the model, each parameter is defined using a value. The thickness, t, of the solid wall is equal to the diameter of the truss, d, while the length of the solid wall, l, is equal to the total number of trusses, n, multiplied by truss diameter, d, and opening width, w. All parameters are fixed as constants: d = 0.5 mm, w = 0.5 mm, n = 10, l = n(d+w) = 10 and C = 1. Therefore, the relative density for the CTT model is higher than that for the OTT model by 91.5%. Table 1 shows the relative densities and percentage difference for the solid-wall, OST, and truss-wall models, OTT and CTT. Because crossed trusses are added in Top or bottom side at CTT model, the density of the foam is higher than the density of the material, (ρ*= 4.44 ρs).
Table 1: Relative densities and percentage difference
Shape of unit cell modelρ* / ρs Percentage difference
between OTT and CTT (%)OST OTT CTT
Triangular 0.05 0.305 4.440 91.5
The primary objective of model analysis is to evaluate the effective stiffness and strength for truss-wall unit cell models in corrugations. Then, these are compared with the effective stiffness and strength for solid-wall unit cell models. Thus, it is found that solid-wall unit cell models can be stiffer and stronger than truss-wall unit cell models when they use the same material.
Finite element analysisABAQUS software (v6.11) was used for the finite element
analysis of the OTT model, and it was tested for the OST and CTT models. The applied model consists of the following four diameters: d = 1 mm, 2 mm, 3 mm, and 4 mm. The width, length, and height were fixed at 20 mm each for the fourfold truss model shown in figure 5. Thus, for the truss model, the applied length and width are equal to 20 mm. However, the applied height is 20 mm because it is half the height of the truss model shown in figure 5. The boundary conditions for the model shown in figure 5 are Ux = Uy = Uz = 0, Rx = Ry = Rz = free for the bottom surface, Ux = Uz = 0, Uy = 5 mm downward, and Rx = Ry = Rz = free for the top surface. The applied boundary condition is simple. That is, the bottom surface is fixed and the top surface moves downward by 5 mm in the vertical direction. This boundary condition is used to measure the reaction force at the bottom. Figure 5 shows the
Figure 5: Dimensions of (a) regular opened solid-wall triangular (OST) model, (b) equilateral opened truss-wall triangular (OTT) model, and (c) equilateral closed truss-wall triangular (CTT) model. The arrow in-fers an applied compression force
model and boundary condition. The rotation over the top and bottom surfaces is free.
Meshing
It is a static analysis of the C3D10 mesh type which is a general purpose 10-node tetrahedral element (4 integration points). The material used is AISI304 stainless steel with an initial yield strength of 215 MPa, an ultimate strength of 505 MPa, a density of 8.0 kg/cm3, a Young’s modulus of 200 GPa, and a Poisson’s ratio of 0.29 [22].
Each model has a different total number of nodes and elements, which are listed in Appendix. A. The models have different diameters: 1 mm, 2 mm, 3 mm, and 4 mm. In addition, to analyze each model, the size of increments varies from 0.5 mm to 1.3 mm. Thus, the maximum number of incremental steps is 1000 when increment size is 0.1. The size of increments ranges from a minimum of 1e-5 to a maximum of 0.1.
Simulation for Elastic and Yielding Stress
A simulation was used to analyze twelve different models. The simulated models are for different truss diameters (1 mm, 2 mm, 3 mm, and 4 mm) within a space that is fixed at 4 mm. As seen in each figure, the common result for the four models is that the straight vertical truss exhibits the maximum stress while the middle trusses exhibit different distributions of stress. In other words, as the vertical truss deforms, the middle trusses support it to resist deformation. The primary reason for this is the size of the space. As the truss diameter increases, effective stress, elastic modulus, and yield strength also increase.
According to the computational analysis of the OST model with plate thickness 4mm shown in figure 6, the points with the minimum stress are close to the top, inside, and middle edges. This implies that as thickness increases, these edges have the lowest strength and are the points likely to exhibit crushing. In other words, stress is allocated from top to bottom. The maximum stress is distributed from the top vertex to the bottom apex in a diagonal direction. This is represented by a darker color on the

Page 5 of 10Citation: Choi J (2018) Expected Ideal Solution and Verified By Numerical Analysis for a Triangular Unit Cell Model. Int J Adv Robot Automn 3(2): 1-10. DOI: 10.15226/2473-3032/3/1/00133
Expected Ideal Solution and Verified By Numerical Analysis for a Triangular Unit Cell Model
Copyright: © 2018 Choi J
middle surface in the case of 4-mm thickness. The other cases show the same maximum stress distribution. Therefore, the OTT and CTT models use the OST model as the fundamental volume. That is, the OTT and CTT models use the same truss diameter as the thickness of a plate in the OST model.
The OTT model has an open area at the top and bottom, and trusses are setup only on the wall side. This model converges from the OST model with trusses. That is, the total volume for the OTT model is the same as that for the OST model. The OTT model is generated using crossed trusses with an opening width.
Figure 6: Stress distribution for OST model (Ux = Uy = Uz = 0, Rx = Ry = Rz = free at bottom, Ux = Uz = 0, and Uy = 1 mm downward)
Figure 7 shows the simulated models with diameters 4 mm within a fixed opening space between the trusses. As the truss diameter increases, the wall side is filled with the trusses and the open space between trusses disappears. Thus, applied load affects vertical trusses and does not affect the horizontal truss. The horizontal truss supports the vertical trusses.
Figure 7: Stress distribution for OST model (Ux = Uy = Uz = 0, Rx = Ry = Rz = free at bottom, Ux = Uz = 0, and Uy = 1 mm downward)
The truss without a space is connected to all other trusses directly and behaves like the truss in the OST model. Therefore, the space in the OTT model is one of the significant factors for reducing external loads.
For the CTT model with diameter 4mm shown in figure 8, the mesh size is 1 and the approximate number of elements per circle is 8.
Figure 8: Stress distribution for CTT model (Ux = Uy = Uz = 0, Rx = Ry = Rz = free at bottom, Ux = Uz = 0, Uy = 1 mm downward, and Rx = Ry = Rz = free at top)
In the CTT model, the top and bottom are covered with crossed trusses with a fixed open space. The size of the crossed trusses is the same as that of the truss applied at the wall. The CTT model has the same stress distribution as that of the vertical trusses because the horizontal truss only supports the vertical trusses. In addition, the top and bottom walls are covered with crossed trusses. However, this does not affect stress, owing to the opening space between trusses. The same phenomenon as that observed for the OTT model is confirmed for the CTT model. In other words, the truss with the largest diameter and no truss space in the CTT model behaves like a plate in the OST model shown in figure 9. This phenomenon can be confirmed for the top- or bottom-crossed truss with a diameter of 4 mm, as shown in figure 10. Therefore, the space in the CTT model is an important factor for reducing external loads, as in the OTT model.
Figure 9: Compressive stress against strain for OST model

Page 6 of 10Citation: Choi J (2018) Expected Ideal Solution and Verified By Numerical Analysis for a Triangular Unit Cell Model. Int J Adv Robot Automn 3(2): 1-10. DOI: 10.15226/2473-3032/3/1/00133
Expected Ideal Solution and Verified By Numerical Analysis for a Triangular Unit Cell Model
Copyright: © 2018 Choi J
Figure 10: Data for compressive stress against strain for CTT model
Figure 8 shows the stress distribution for the CTT model, for truss diameters 4 mm. Stress increases with truss diameter. It shows that truss diameter is the primary factor for withstanding a high reaction force. Thus, initial stress increases with truss diameter. The initial yield loads for each model are shown in table 2.
Table 2: Initial yield loads
Type ofunit cell
d (mm)
Initial yield loads (N)
OST
1 14649
2 32400
3 31204
4 61284
CTT
1 2326
2 7597
3 23521
4 38753
OTT
1 1457
2 10160
3 23351
4 42159
Results Each model provides the common result that stiffness
increases with truss diameter. The stiffness for the OST model is the highest. The stiffness for the CTT model is higher than that for the OTT model. From the results as effective stress as a function of effective strain for the OST, OTT, and CTT models, it is observed for all models that stress increases with truss diameter within a fixed opening area.
Figure 9 shows effective stress as a function of effective strain for the OST model. Figure10 and figure 11 show effective stress as a function of effective strain for the CTT and OTT models, respectively. All data are summarized in Table 3 and Table 4.
The solid-wall unit cell models have relative densities ranging from 0.049 to 0.198. The relative densities for the CTT unit cell model range from 0.029 to 0.207. The relative densities for the OTT unit cell model range from 1.016 to 10.835. The relative densities are different because they are correlated with the inverse relative volume. Thus, among the three models, the OST model has the lowest relative density, and the OTT model has the highest relative density. Table 3 lists the values of relative density and relative Young’s modulus. Effective Young’s modulus, which is denoted as E*, follows Hook’s law. It is equal to applied yield strength divided by initial strain. Thus, the effective Young’s modulus for OST range from 47 GPa to 559 GPa, while that for CTT range from 14 GPa to 230 GPa and OTT range from 8 GPa to 245 GPa. The reason that the calculated Young’s modulus of the foam (E*=559 GPa) is higher than the Young’s modulus of the base material (Es = 200 GPa) is a structural properties within a limited volume. Base material infers applied material property but the Young’s modulus of the foam means geometrical property.
According to Wang, et al. [23], there are two kinds of yield strengths: initial yield strength, and yield strength at 25% strain. The effective yield strength, σ*, when yielding begins is equal to the load carrying capacity divided by the application surface area. It ranges from 73.3 MPa to 306.4 MPa for OST, from 9.4 MPa to 193.8 MPa for CTT, and from 7.3 MPa to 210.8 MPa for OTT. When yielding occurs at 25% strain, yield strength, which is denoted by σ0.25, ranges from 49.7 MPa to 564.4 MPa for OST, from 2.7 MPa to 266.6 MPa for CTT, and from 8.37 MPa to 263.9 MPa for OTT. The applied material is SST304 stainless steel, and its yield strength is 215 MPa. Thus, the ratio of relative density to initial
Table 3: Relative elastic modulus
Type of unit cell d (mm) E* (GPa) ρ* / ρs E*/Es
OST
1 47 0.049 0.22
2 194 0.099 0.90
3 300 0.148 1.40
4 559 0.198 2.60
Figure 11: Compressive stress-strain for OTT model

Page 7 of 10Citation: Choi J (2018) Expected Ideal Solution and Verified By Numerical Analysis for a Triangular Unit Cell Model. Int J Adv Robot Automn 3(2): 1-10. DOI: 10.15226/2473-3032/3/1/00133
Expected Ideal Solution and Verified By Numerical Analysis for a Triangular Unit Cell Model
Copyright: © 2018 Choi J
CTT
1 14 0.029 0.07
2 59 0.086 0.27
3 126 0.147 0.58
4 230 0.207 1.07
OTT
1 8 1.016 0.04
2 61 3.483 0.28
3 147 6.856 0.68
4 245 10.835 1.14
Table 4: Relative yield strength
Type ofunit cell
d (mm)Initial
yield strengthYield strengthat 25% strain
Relative yield strength
σ * (MPa) σ 0.25 (MPa) σ */ σ ys σ 0.25 / σ ys
OST
1 73.3 49.7 0.341 0.231
2 162.0 171.0 0.753 0.788
3 156.0 393.7 0.726 1.831
4 306.4 564.4 1.425 2.625
CTT
1 9.4 2.7 0.054 0.013
2 38.0 45.4 0.177 0.211
3 117.6 214.0 0.547 0.995
4 193.8 266.6 0.901 1.240
OTT
1 7.3 8.37 0.034 0.011
2 50.8 49.3 0.236 0.229
3 116.8 207.7 0.543 0.966
4 210.8 263.9 0.980 1.227
Discussion For the analysis of the truss wall corrugated structure, the
OST, CTT, and OTT unit cell models were tested and validated through computational analysis. The stiffness and strength for the models were based on the theory of Gibson and Ashby, [2], which states that stiffness is proportional to the square of density, and strength is proportional to density raised to a power of 3/2. The results of the finite element analysis of the OST, CTT, and OTT models are in good agreement with those of the open-cell theory of Gibson and Ashby. That is,
2* *
1
3* * 2
2
(18)s s
s s
E CE
and
C
ρρ
σ ρσ ρ
=
=
yield strength ranges from 0.049 to 0.198 for OST, from 0.029 to 0.207 for CTT, and from 1.016 to 10.835 for OTT. The ratio of relative density to yield strength at 25% strain ranges from 0.231 to 2.626 for OST, from 0.013 to 1.240 for CTT, and from 0.011 to 1.227 for OTT.
Based on relative yield strength, the percentage difference between initial yield strength and the yield strength at 25% shown in table 4 indicates that the yield strength at 25% strain is higher than initial yield strength.
Thus, the OST, CTT, and OTT models are considered as periodic cellular structures.
Figure 12 shows relative elastic modulus as a function of relative density. Relative stiffness is proportional to relative density to a power of 1.73 for the OST model, 1.4 for the CTT model, and 1.46 for the OTT model. That is,
Figure 12: Data for the relative elastic modulus against relative density

Page 8 of 10Citation: Choi J (2018) Expected Ideal Solution and Verified By Numerical Analysis for a Triangular Unit Cell Model. Int J Adv Robot Automn 3(2): 1-10. DOI: 10.15226/2473-3032/3/1/00133
Expected Ideal Solution and Verified By Numerical Analysis for a Triangular Unit Cell Model
Copyright: © 2018 Choi J
However, this power is 1.5 in Gibson and Ashby’s ideal solution. Therefore, the CTT and OTT models are closer to Gibson and Ashby’s ideal solution than the OST model.
Figure 13 shows the relative compressive yield strength at initial yield strain as a function of relative density. Relative compressive yield strength is proportional to relative density to a power of 0.97 for the OST model, 0.68 for the CTT model, and 0.70 for the OTT model. This power is 2.0 in Gibson and Ashby’s ideal solution. Therefore, the OTT model is close to Gibson and Ashby’s ideal solution, and the CTT model is reasonably close to it. That is,
1.7* *
2.6* *
1.4* *
42.6 , (19)
93.2 ,
9.0
s sOST
s sOTT
s sCTT
EE
EE
EE
ρρ
ρρ
ρρ
≈
≈
≈
1.8* *
@
3.7* *
@
2.5* *
@
51.2 ,
831.9 , (21)
78.8
s sOST plastic
s sOTT plastic
s sCTT plastic
σ ρσ ρ
σ ρσ ρ
σ ρσ ρ
≈
≈
≈
Figure 13: Data for the relative compressive yield strength against rela-tive density
0.97* *
0.4* *
0.7* *
0.15 ,
0.18 , (20)
0.23
s sOST
s sOTT
s sCTT
σ ρσ ρ
σ ρσ ρ
σ ρσ ρ
≈
≈
≈
Figure 14 shows the compressive yield strength at plastic strain as a function of relative density. Relative compressive yield strength is proportional to relative density to a power of 1.8 for the OST model: approximately 2.5 for the CTT model, and approximately 3.7 for the OTT model. This power is 2.0 in Gibson and Ashby’s ideal solution. That is,
Figure 14: Data for the relative compressive yield strength against rela-tive density
Therefore, the OST, OTT, and CTT models show significant differences from Gibson and Ashby’s ideal solution under this condition.
Conclusion For the OST, OTT, and CTT, the effective stiffness, the
compressive yield strength, and compressive strength at the plastic range were analyzed using a computational analysis. Each model is based on a different shape of the triangular prism. OST refers to plates applied into the wall, OTT to a truss applied into the wall, and CTT to a truss applied into the wall and into the top or bottom side.
The simulation predicts the ideal solution to ensure effective stiffness and effective strength, as shown in Equation (19), (20), and (21). Thus, OTT is shown to be stiffer than CTT, OTT has greater yield strength than CTT, and OTT is stronger at plastic than CTT. The ideal solutions for all models are plotted using the Gibson–Ashby theory, and it can predict the effective stiffness of OTT and CTT to be stiffer, and the yield strength is similar within a density 0.2 approximately. If the density of OTT or CTT is greater than 0.2, then the prediction for the yield strength via Gibson-Ashby is higher. If the density of OTT or CTT is less than 0.2, then the predicted yield strength via Gibson-Ashby is lower. If the density of OTT or CTT is more than 0.03–0.05 (approx.), then the plastic strength predicted by Gibson-Ashby is lower than OTT or CTT. If the density of OTT or CTT is less than 0.03–0.05 (approx.), then the plastic strength predicted by Gibson-Ashby is higher than OTT or CTT. Thus, the stiffness of OTT and CTT is

Page 9 of 10Citation: Choi J (2018) Expected Ideal Solution and Verified By Numerical Analysis for a Triangular Unit Cell Model. Int J Adv Robot Automn 3(2): 1-10. DOI: 10.15226/2473-3032/3/1/00133
Expected Ideal Solution and Verified By Numerical Analysis for a Triangular Unit Cell Model
Copyright: © 2018 Choi J
higher than the ideal Gibson-Ashby solution. The yield strength of OTT and CTT is higher when the relative density is greater than 0.1, and the plastic strength of OTT and CTT is higher when the relative density is greater than 0.03–0.05.
In conclusion, the effective stiffness of the OTT and CTT is greater than the ideal Gibson-Ashby solution. When the relative density is greater than 0.2, the effective yield strength of the OTT and CTT is higher than the ideal Gibson-Ashby solution. When the relative density is greater than 0.03–0.05, the effective plastic strength of the OTT and CTT is higher than an ideal Gibson-Ashby solution.
For aerospace or automotive applications, optimizing various parameters – such as width, length, height, diameter, aperture, and corrugation angle – is an important research subject insofar as the mechanical properties of truss-wall models depend on these parameters. In the near future, a new method to create PCM models without joining points may be devised using well-known techniques, such as three-dimensional printing and casting.
Appendix A For the solid-wall triangular (OST model), the mesh size is
1 and the approximate number of elements per circle is 8. The maximum deviation factor for curvature control is 0.1. The total number of nodes and elements are shown in table A, applying the C3D10 tetrahedral mesh type.
For the OTT model, the mesh size is 1 and the approximate number of elements per circle is 8. The maximum deviation factor for curvature control is 0.1. The C3D10 tetrahedral mesh type is applied. The maximum number of increments for the analysis is 1000, with an increment size of 0.1, a minimum increment size of 1e-5, and a maximum increment size of 0.1.
For the CTT model with diameter 4mm shown in figure 8, the mesh size is 1 and the approximate number of elements per circle is 8. The maximum deviation factor for curvature control is 0.1. The total number of nodes and elements is shown in table A. The C3D10 tetrahedral mesh type is applied. The maximum number of increments for the analysis is 1000, with an increment size of 0.1, a minimum increment size of 1e-5, and a maximum increment size of 0.1.
Table A.1: Nodes and elements
Type of model d (mm) Nodes Elements
OST
1 61363 36041
2 88062 55562
3 119712 79067
4 160301 108923
OTT
1 120934 70031
2 114860 70821
3 153399 99909
4 235538 159174
CTT
1 149610 86512
2 140476 86936
3 180533 118296
4 115255 76445
References1. Gibson LJ, Ashby MF, Harley BA. Cellular Materials in Nature and
Medicine. Cambridge University Press. 2010.2. Gibson LJ, Ashby MF. Cellular Solids-Structure and Properties.
Cambridge University Press. 1997.3. Choi J, Chae T. Effective stiffness and effective compressive yield
strength for unit-cell model of complex truss. International Journal of Mechanics and Materials in Design. 2015;11(1):91–110.
4. Choi J, Lee J, Lee J. Development of ideal solution and validation of stiffness and strength by finite element method for truss-wall corrugated cellular solids. Journal of Mechanical Science and Technology. 2014;28(5):1765–1778.
5. Choi J, Lee J. Preliminary research of truss-wall corrugated cellular solids. Applied Mechanics and Materials. 2014;510:139–149.
6. Choi J, Shankar K, Lee J. Research of elasticity for a corrugated wire
mesh. Materials & Design. 2013:52:78–91. 7. Gumruk R, Mines RAW. Compressive behaviour of stainless steel
micro-lattice structures. International Journal of Mechanical Sciences. 2013;68:125–139.
8. Rejab MRM, Cantwell WJ. The mechanical behaviour of corrugated-core sandwich panels. Composites Part B: Engineering. 2013;47:267–277.
9. Zhang G, Wang B, Ma L, Xiong J, Wu L. Response of sandwich structures with pyramidal truss cores under the compression and impact loading. Composite Structures. 2013;100:451–463.
10. Jeong J, Lee Y, Cho M. Sequential multiscale analysis on size-dependent mechanical behavior of micro/nano-sized honeycomb structures. Mechanics of Materials. 2013;57:109–133.
11. Schaedler TA, Jacobsen AJ, Torrents A, Sorensen AE, Lian J, Greer JR, et al. Ultralight metallic microlattice. Science. 2011;334

Page 10 of 10Citation: Choi J (2018) Expected Ideal Solution and Verified By Numerical Analysis for a Triangular Unit Cell Model. Int J Adv Robot Automn 3(2): 1-10. DOI: 10.15226/2473-3032/3/1/00133
Expected Ideal Solution and Verified By Numerical Analysis for a Triangular Unit Cell Model
Copyright: © 2018 Choi J
(6058):962–965. 12. Sypeck DJ, Wadley HNG. Multifunctional microtruss laminates:
Textile synthesis and properties. Journal of Materials Research, 2001;16(3):890–897.
13. Sypeck DJ. Constructed cellular metals. Processing and properties of lightweight cellular metals and structures, third Global Symposium on Materials Processing and Manufacturing, TMS. 2002:35–45.
14. Wadley HN. Multifunctional periodic cellular metals. Philos Trans A Math Phys Eng Sci. 2006;364(1838):31-68. doi: 10.1098/rsta.2005.1697
15. Hutchinson RG, Wicks N, Evans AG, Fleck NA, Hutchinson JW. Kagome plate structures for actuation. International Journal of Solids and Structures. 2003;40:6969–6980.
16. Linul E, Marsavina L. Prediction of fracture toughness for open cell polyurethane foams by finite element micromechanical analysis. Iranian Polymer Journal. 2011;20(9):735–746.
17. Serban D, Linul E, Voiconi T, Marsavina L, Modler N. Numerical evaluation of two-dimensional micromechanical structures of anisotropic cellular materials: case study for polyurethane rigid foams. Iranian Polymer Journal. 2015;24(6):515–529.
18. Sterling R. Cellular Materials International Inc. 2017. Available from: http://www.cellularmaterials.com/advantages.asp
19. Boeing The world’s lightest material. 2012. Available from: http://www.boeing.com/features/2015/10/innovation-lightest-metal-10-15.page
20. Liu X, Liang N. Effective elastic moduli of triangular lattice material with defects. Journal of the Mechanics and Physics of Solids, 2012;60(10):1722-1739.
21. Ptochos E. Labeas G. Elastic modulus and Poisson’s ratio determination of micro-lattice cellular structures by analytical, numerical and homogenisation methods. Journal of Sandwich Structures and Materials. 2012;14:597-626.
22. Matweb Material Property Data. 2017. Available from: http://matweb.com/search/DataSheet.aspx?MatGUID=abc4415b0f8b490387e3c922237098da&ckck=1
23. Wang AJ, McDowell DL. In-plane stiffness and yield strength of periodic metal honeycombs. J Eng Mater Technol. 2004;126(2):137–156.