Expansion Strategy for an Energy Company
23
Intelligent Energy Solutions Presented By: David Kolapudi Praveen Baghel Pranav Patil Diego Montano Mengqi Sun Shuping Lian Bingzi Deng
-
Upload
david-kolapudi -
Category
Business
-
view
78 -
download
0
Transcript of Expansion Strategy for an Energy Company
Intelligent
Energy
Solutions Presented By:
David Kolapudi
Praveen Baghel
Pranav Patil
Diego Montano
Mengqi Sun
Shuping Lian
Bingzi Deng
❖ Company Introduction & Business Model
❖ Country Analysis (United Kingdom vs. India vs. France)
❖ Key Market Drivers
❖ Expansion Analysis
❖ Recommendation
Agenda
➢ Infrastructure
➢ Natural resources
➢ Economic situation
➢ Ease of Doing Business
➢ Government situation
➢ Trade/ Investment
➢ Attracting FDI
➢ Property rights
IES Introduction
Highly competitive, innovative and demanding energy industry
Key Consulting Services Intelligent Energy Monitoring Energy Management and Conservation Efficiency Management
Currently operating in the United States, IES has realized the need to expand abroad and has identified three opportunities:
United Kingdom France India
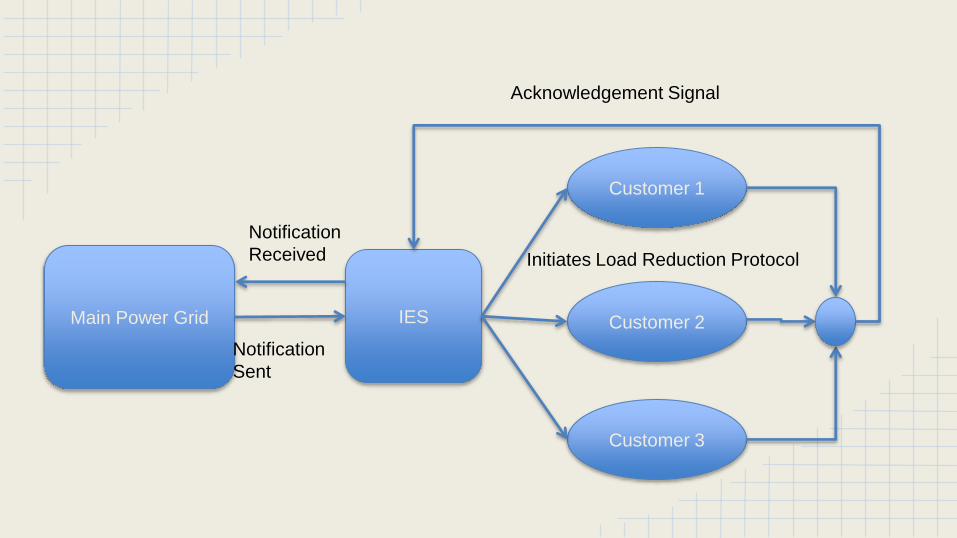
Main Power Grid IES
Customer 1
Customer 2
Customer 3
Notification
Sent
Notification
Received
Acknowledgement Signal
Initiates Load Reduction Protocol
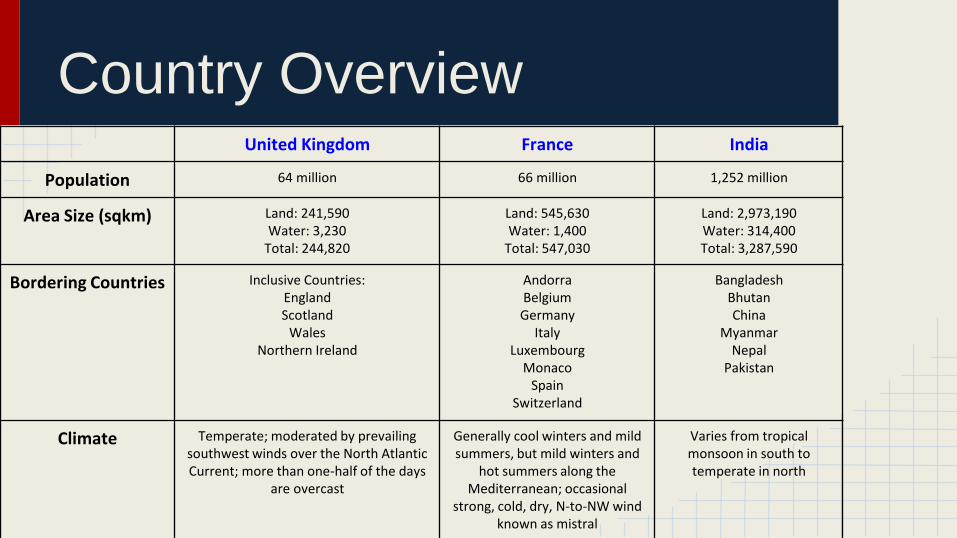
United Kingdom France India
Population 64 million 66 million 1,252 million
Area Size (sqkm) Land: 241,590Water: 3,230
Total: 244,820
Land: 545,630Water: 1,400
Total: 547,030
Land: 2,973,190Water: 314,400Total: 3,287,590
Bordering Countries Inclusive Countries:EnglandScotland
WalesNorthern Ireland
AndorraBelgiumGermany
ItalyLuxembourg
MonacoSpain
Switzerland
BangladeshBhutanChina
MyanmarNepal
Pakistan
Climate Temperate; moderated by prevailing southwest winds over the North Atlantic Current; more than one-half of the days
are overcast
Generally cool winters and mild summers, but mild winters and
hot summers along the Mediterranean; occasional
strong, cold, dry, N-to-NW wind known as mistral
Varies from tropical monsoon in south to temperate in north
Country Overview
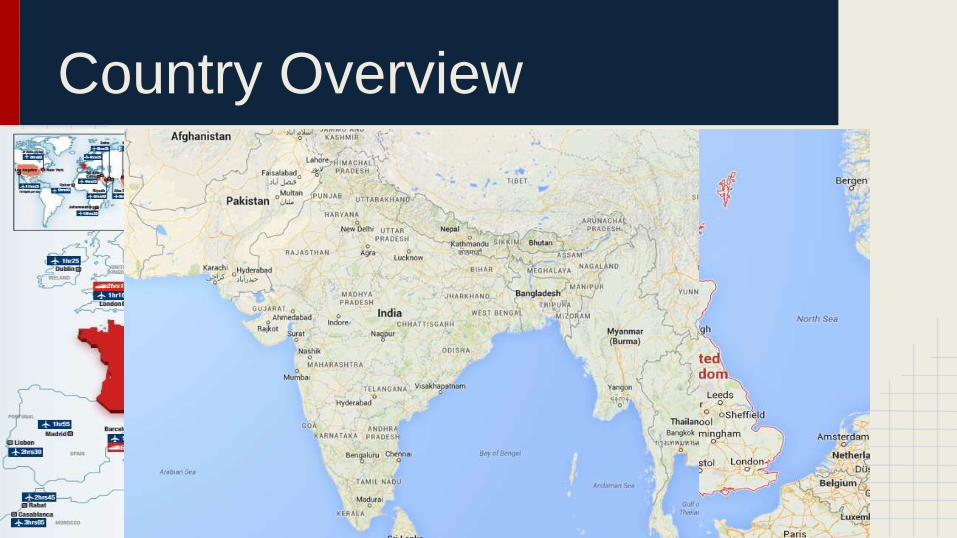
Country Overview

Transportation Communication Utility
UKTotal Capex: £184,998.39MM
180 Transportation Project
Total Capex: £22,048.00MM
7 Communication Projects
Total Capex: £263,726.50MM139 Energy Projects; 32 Water Projects;
26 Waste Projects
France
Ranked second in Europe for high-speedrail lines.
Best road network in Europe
The broadband rate--35.5% in June 2012
23.1 million subscribers in June 2012.
Ranked as the second largest in Europe.
The number of wind turbines in France is expanding fast.
France aims to supply 23% of the total energy consumed domestically from
renewable sources by 2020.
India
Indian government has allocated $1 trillion
in infrastructure spending in the five years
through 2017.
Transport outlined plans for $120 billion
worth of road-widening projects
India is the world's second-largest
telecommunications market.
933 million
subscribers by the end of FY14.
India is the fourth-largest energy
consumer (2013) in the world.
Oil and gas account for 37 per cent of total
energy consumption.
Infrastructure Comparison
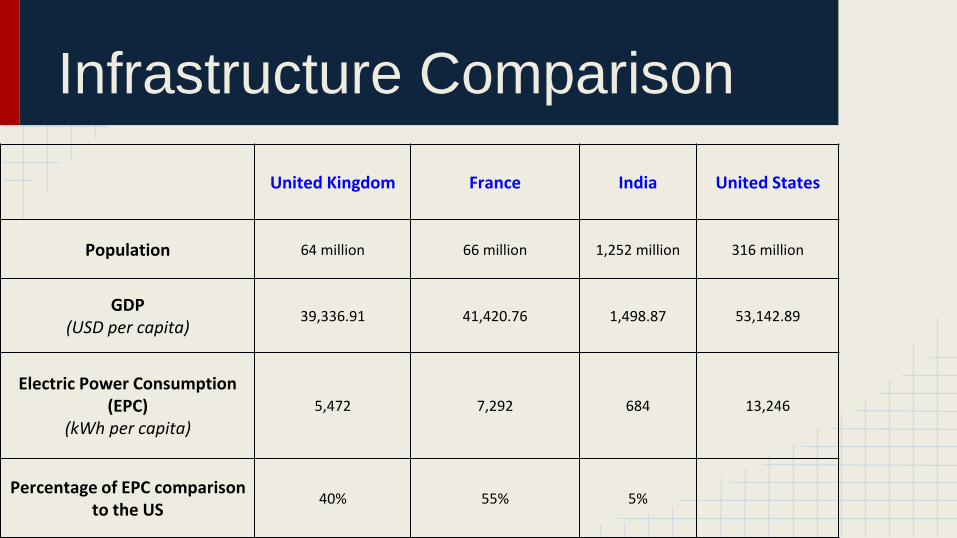
United Kingdom France India United States
Population 64 million 66 million 1,252 million 316 million
GDP(USD per capita)
39,336.91 41,420.76 1,498.87 53,142.89
Electric Power Consumption (EPC)
(kWh per capita)5,472 7,292 684 13,246
Percentage of EPC comparison to the US
40% 55% 5%
Infrastructure Comparison
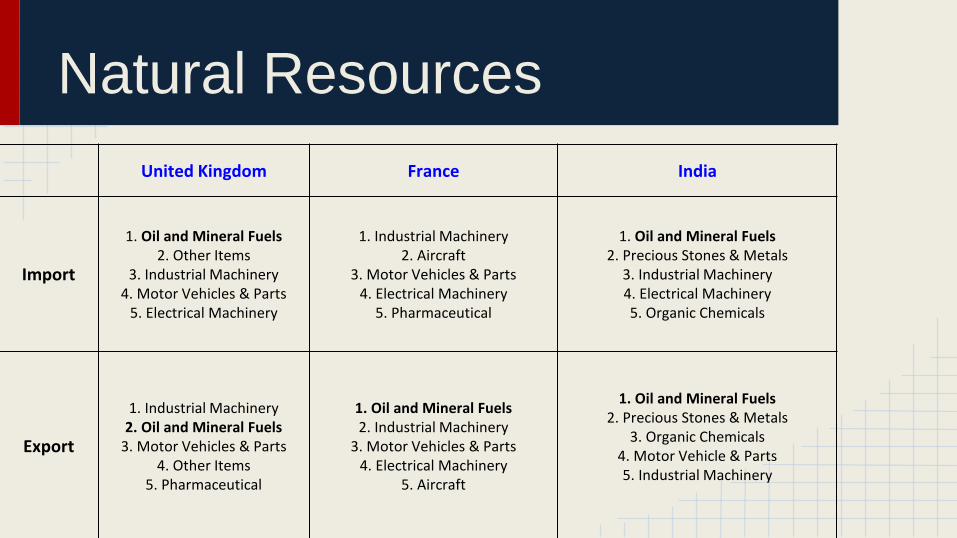
Natural Resources
United Kingdom France India
Import
1. Oil and Mineral Fuels 2. Other Items
3. Industrial Machinery4. Motor Vehicles & Parts
5. Electrical Machinery
1. Industrial Machinery2. Aircraft
3. Motor Vehicles & Parts4. Electrical Machinery
5. Pharmaceutical
1. Oil and Mineral Fuels 2. Precious Stones & Metals
3. Industrial Machinery4. Electrical Machinery5. Organic Chemicals
Export
1. Industrial Machinery2. Oil and Mineral Fuels
3. Motor Vehicles & Parts4. Other Items
5. Pharmaceutical
1. Oil and Mineral Fuels 2. Industrial Machinery
3. Motor Vehicles & Parts4. Electrical Machinery
5. Aircraft
1. Oil and Mineral Fuels 2. Precious Stones & Metals
3. Organic Chemicals 4. Motor Vehicle & Parts5. Industrial Machinery
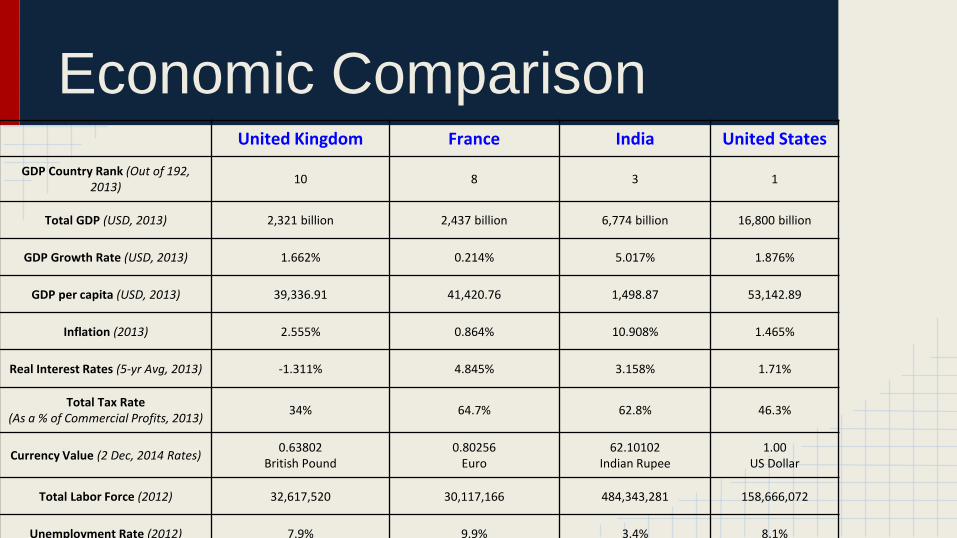
United Kingdom France India United States
GDP Country Rank (Out of 192, 2013)
10 8 3 1
Total GDP (USD, 2013) 2,321 billion 2,437 billion 6,774 billion 16,800 billion
GDP Growth Rate (USD, 2013) 1.662% 0.214% 5.017% 1.876%
GDP per capita (USD, 2013) 39,336.91 41,420.76 1,498.87 53,142.89
Inflation (2013) 2.555% 0.864% 10.908% 1.465%
Real Interest Rates (5-yr Avg, 2013) -1.311% 4.845% 3.158% 1.71%
Total Tax Rate(As a % of Commercial Profits, 2013)
34% 64.7% 62.8% 46.3%
Currency Value (2 Dec, 2014 Rates)0.63802
British Pound0.80256
Euro62.10102
Indian Rupee1.00
US Dollar
Total Labor Force (2012) 32,617,520 30,117,166 484,343,281 158,666,072
Unemployment Rate (2012) 7.9% 9.9% 3.4% 8.1%
Economic Comparison
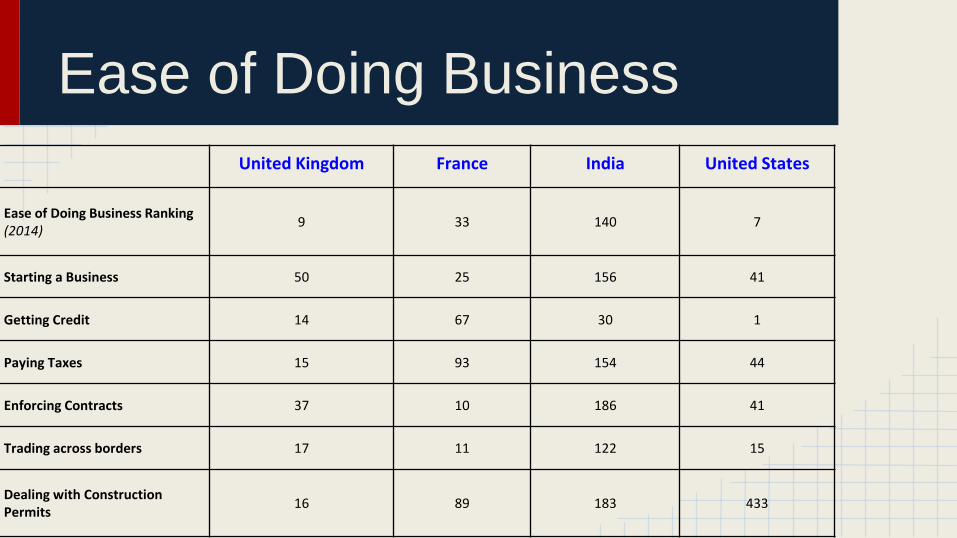
Ease of Doing Business
United Kingdom France India United States
Ease of Doing Business Ranking(2014)
9 33 140 7
Starting a Business 50 25 156 41
Getting Credit 14 67 30 1
Paying Taxes 15 93 154 44
Enforcing Contracts 37 10 186 41
Trading across borders 17 11 122 15
Dealing with Construction Permits
16 89 183 433
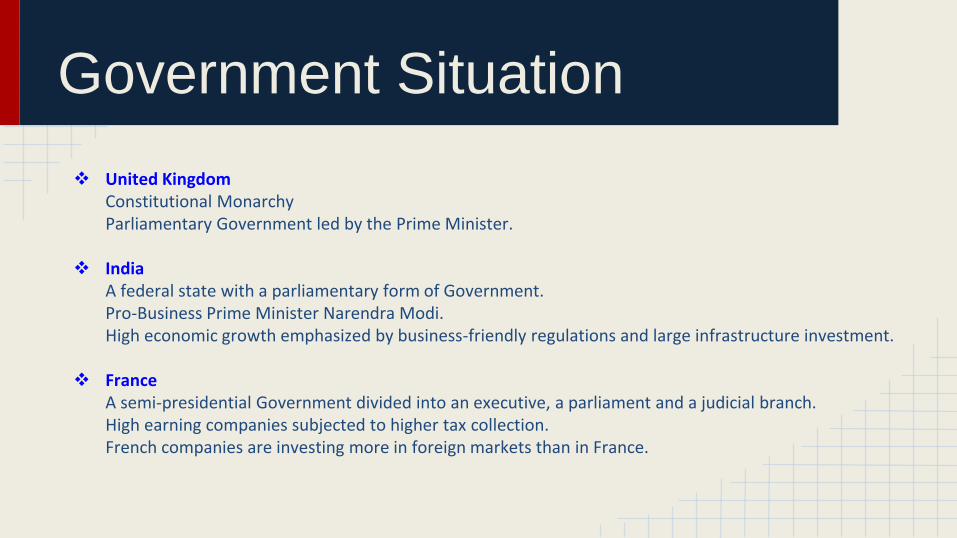
Government Situation
United KingdomConstitutional MonarchyParliamentary Government led by the Prime Minister.
IndiaA federal state with a parliamentary form of Government.Pro-Business Prime Minister Narendra Modi.High economic growth emphasized by business-friendly regulations and large infrastructure investment.
FranceA semi-presidential Government divided into an executive, a parliament and a judicial branch.High earning companies subjected to higher tax collection.French companies are investing more in foreign markets than in France.
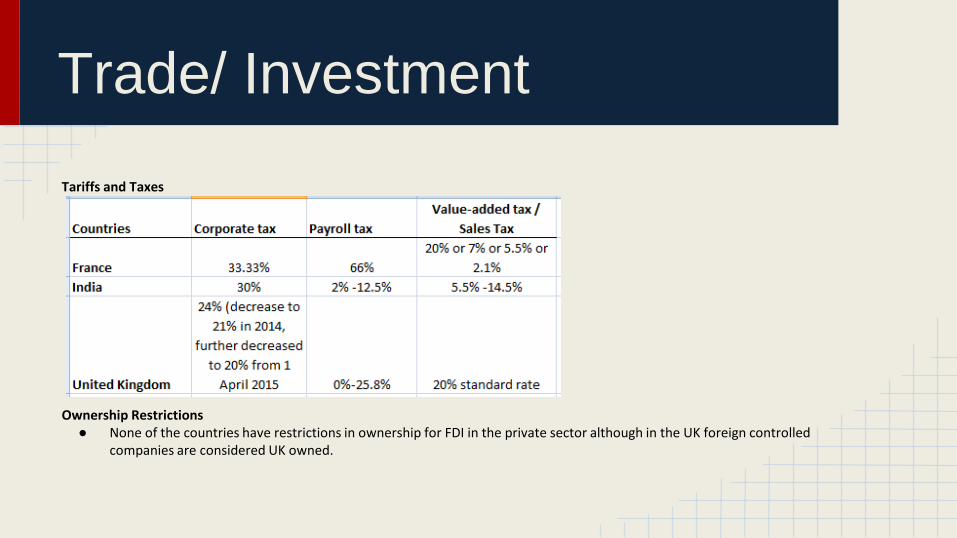
Trade/ Investment
Tariffs and Taxes
Ownership Restrictions● None of the countries have restrictions in ownership for FDI in the private sector although in the UK foreign controlled
companies are considered UK owned.
Attracting FDI
United Kingdom Over the last five years, the UK has experienced a negative cycle. The main issues are concentrated around credit availability
through the recent recessions but the government has shown a positive attitude towards business and attracting investment.
France Foreign companies from 132 countries have established themselves in France throughout the sectors. The top two source
countries creating jobs in France are the United States and Germany.
India FDI inflows to India increased 17 per cent in 2013 reaching US$ 28 billion.The Indian government’s policy and a robust business
environment have ensured that foreign capital keep flowing into the country.
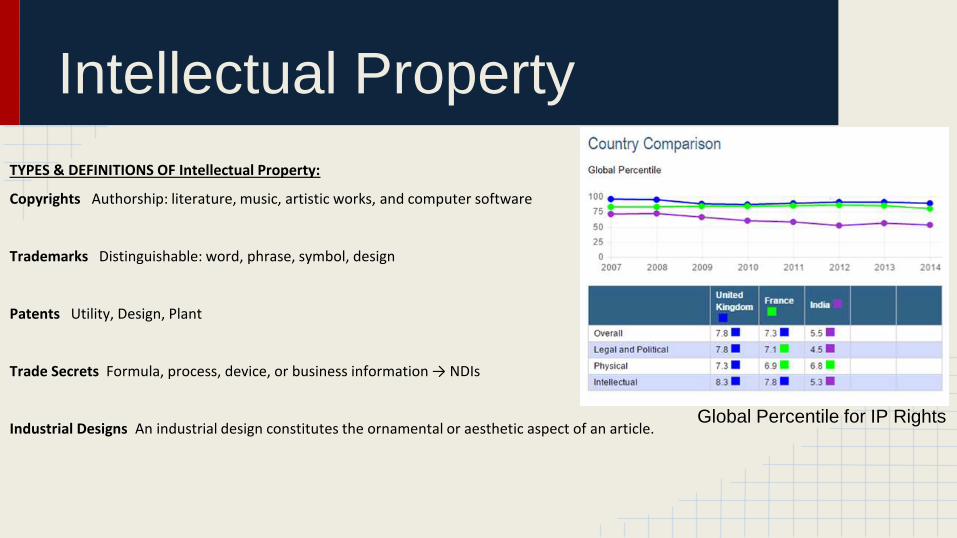
Intellectual Property
TYPES & DEFINITIONS OF Intellectual Property:
Copyrights Authorship: literature, music, artistic works, and computer software
Trademarks Distinguishable: word, phrase, symbol, design
Patents Utility, Design, Plant
Trade Secrets Formula, process, device, or business information → NDIs
Industrial Designs An industrial design constitutes the ornamental or aesthetic aspect of an article. Global Percentile for IP Rights
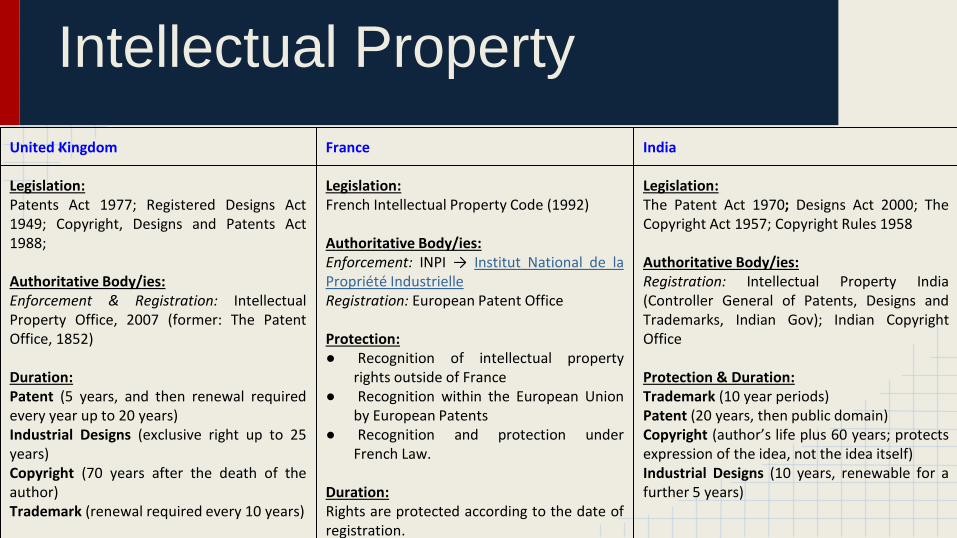
Intellectual Property
. United Kingdom France India
Legislation:Patents Act 1977; Registered Designs Act1949; Copyright, Designs and Patents Act1988;
Authoritative Body/ies:Enforcement & Registration: IntellectualProperty Office, 2007 (former: The PatentOffice, 1852)
Duration:Patent (5 years, and then renewal requiredevery year up to 20 years)Industrial Designs (exclusive right up to 25years)Copyright (70 years after the death of theauthor)Trademark (renewal required every 10 years)
Legislation:French Intellectual Property Code (1992)
Authoritative Body/ies:Enforcement: INPI → Institut National de laPropriété IndustrielleRegistration: European Patent Office
Protection:● Recognition of intellectual property
rights outside of France● Recognition within the European Union
by European Patents● Recognition and protection under
French Law.
Duration:Rights are protected according to the date ofregistration.
Legislation:The Patent Act 1970; Designs Act 2000; TheCopyright Act 1957; Copyright Rules 1958
Authoritative Body/ies:Registration: Intellectual Property India(Controller General of Patents, Designs andTrademarks, Indian Gov); Indian CopyrightOffice
Protection & Duration:Trademark (10 year periods)Patent (20 years, then public domain)Copyright (author’s life plus 60 years; protectsexpression of the idea, not the idea itself)Industrial Designs (10 years, renewable for afurther 5 years)
India Fourth-largest energy consumer (2013) in the world
Oil and gas account for 37 per cent of total energy consumption.
India is the world's second-largest telecommunications market.
Indian government has allocated $1 trillion in infrastructure spending in the five years through 2017
Government situation : High economic growth emphasized by business-friendly regulations and large infrastructure investment.
Government’s Initiatives: opening to foreign investment by relaxing norms and regulations.
FDI inflows to India increased 17 per cent in 2013 reaching US$ 28 billion.
Investor friendly platform - Increased transparency in policies and procedures.
Competitive advantage of low wage high skilled labor workforce.
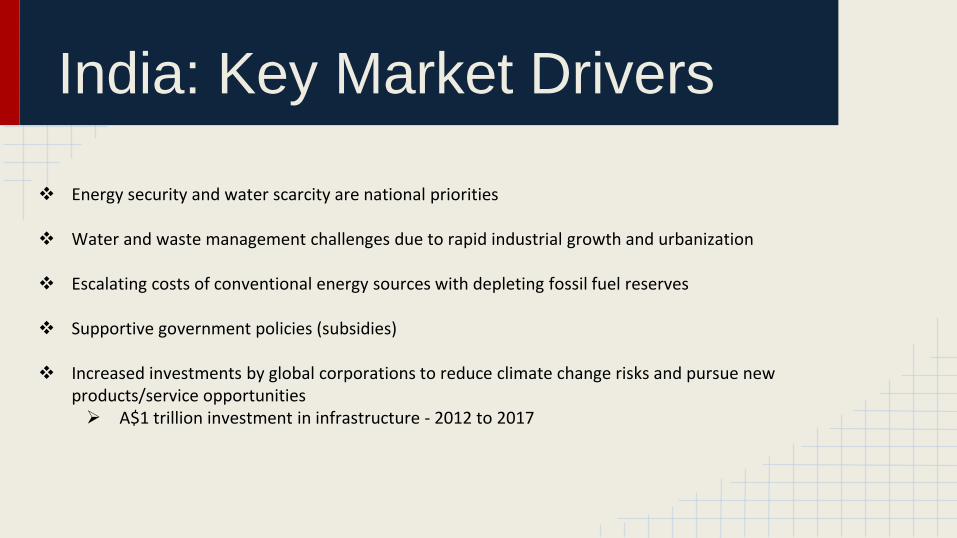
India: Key Market Drivers
Energy security and water scarcity are national priorities
Water and waste management challenges due to rapid industrial growth and urbanization
Escalating costs of conventional energy sources with depleting fossil fuel reserves
Supportive government policies (subsidies)
Increased investments by global corporations to reduce climate change risks and pursue new products/service opportunities A$1 trillion investment in infrastructure - 2012 to 2017

Expansion Analysis
Differences in corporate culture between two organizations.
Differences in Technology used between two organizations.
Technical and Interpersonal skills.
Primary Demand Drivers:
Income of consumers
Increasing customer sophistication
Profitability of business customers
Profitability Drivers:
Gaining expertise in a particular field of knowledge
Developing and marketing new products
Achieving access to capital
Creating a faster time-to-market process
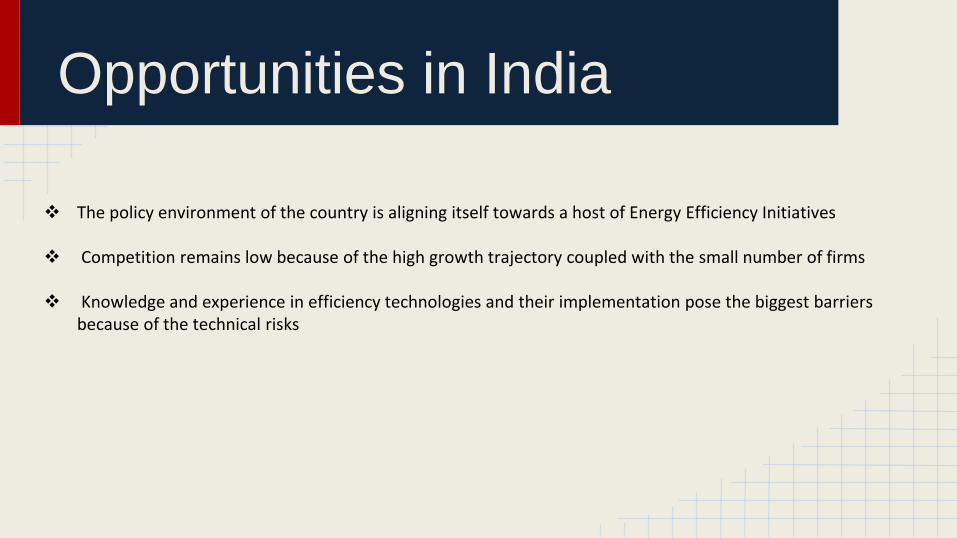
Opportunities in India
The policy environment of the country is aligning itself towards a host of Energy Efficiency Initiatives
Competition remains low because of the high growth trajectory coupled with the small number of firms
Knowledge and experience in efficiency technologies and their implementation pose the biggest barriers because of the technical risks
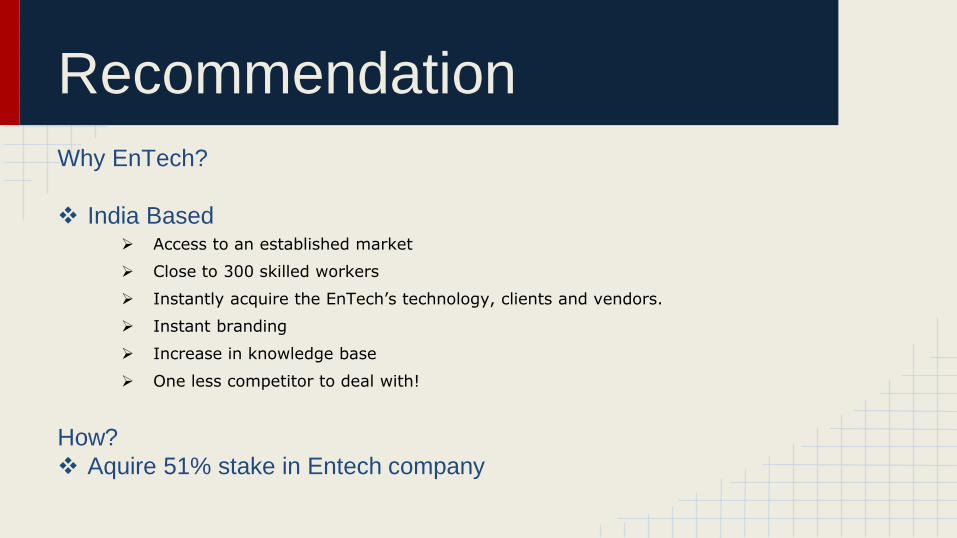
Recommendation
Why EnTech?
India Based Access to an established market
Close to 300 skilled workers
Instantly acquire the EnTech’s technology, clients and vendors.
Instant branding
Increase in knowledge base
One less competitor to deal with!
How?
Aquire 51% stake in Entech company

Questions?